Embed Size (px)
Citation preview

Please cite this paper as:
OECD/Bío Bío’s Regional Steering Committee (2009), “The Bío Bío Region, Chile: Self-Evaluation Report”, OECD Reviews of Higher Education in Regional and City Development, IMHE, www.oecd.org/edu/imhe/regionaldevelopment
Directorate for Education
Programme on Institutional Management in Higher Education (IMHE)
OECD Reviews of Higher Education in Regional and City Development
The Bío Bío Region, Chile
SELF-EVALUATION REPORT
Bío Bío’s Regional Steering Committee

This report was prepared for the Bío Bío Region’s Regional Steering Committee as an input to the OECD – World Bank
Review of Higher Education in Regional and City Development. It was prepared in response to guidelines provided by the
OECD to all participating regions. The guidelines encouraged constructive and critical evaluation of the policies, practices
and strategies in HEIs’ regional engagement. The opinions expressed are not necessarily those of the Regional Steering
Committee, the OECD or its Member countries.

OECD – WORLD BANK REVIEW OF HIGHER EDUCATION IN REGIONAL AND CITY DEVELOPMENT: THE BIO BIO REGION (CHILE)
SELF-EVALUATION REPORT
SEPTEMBER 2009

This document was prepared by the following research team:
Coordinator
Jorge Dresdner Cid, Ph.D., Department of Economics, Universidad de Concepción
Principal researchers
Andrés Acuña Duarte, M.S., Department of Economics and Finance, Universidad del Bío Bío
Bernardo Castro Ramírez, Ph.D., Department of Sociology, Universidad de Concepción
Miguel Quiroga Suazo, Ph.D., (c), Department of Economics, Universidad de Concepción
Hugo Salgado Cabrera, Ph.D., Department of Economics, Universidad de Concepción
Andrés Ulloa Oliva, Ph. D. (c), Department of Economics, Universidad Católica de la Santísima Concepción
Felipe Vásquez Lavin, Ph.D., Department of Economics, Universidad de Concepción
Assistant researchers
Hans Altamirano, Commercial Engineer, Department of Economics, Universidad de Concepción
Jorge Espinoza B., M.B.A., Department of Administration, Universidad Católica de la Santísima Concepción
Gabriel Pino, M.S., Department of Economics, Universidad de Concepción
Gloria Rivas Palma, M.S. (c), Dirección de Desarrollo Estudiantil, Universidad del Bío Bío
Leonardo Salazar, M.S., Department of Economics, Universidad de Concepción
Grethel Zurita Zapata, M.S., Department of Economics, Universidad de Concepción
Secretary
Marcela Alveal, Department of Economics, Universidad de Concepción

FOREWORD
1. This Self-Evaluation Final Report was prepared by the working group appointed by the Regional Steering Committee for the Bío Bío Region in Chile. The report reflects the joint effort of higher education institutions (HEI) and regional stakeholders in the Bío Bío Region in an attempt to assess the impact that the HEI have had on regional development. This study is part of the second round of evaluations promoted by the project “Review of the Higher Education Institutions in Regional Development” sponsored by the Organisation for Economic Co-Operation and Development (OECD).
2. The self-evaluation was performed between December 2008 and June 2009. It included three workshops with regional stakeholders; surveys of regional HEI and business representatives; interviews with qualified informers from the public and private sectors, higher education institutions, and research centres; reviews of existing material such as reports, studies, proceedings, legal documents, etc.; and the analysis and processing of available statistical information.
3. We are grateful for the help received from the Steering Committee of the Self-Evaluation for the Bío Bío Region. They supported and complemented the work of the research team throughout the whole self-evaluation process. We also acknowledge the assistance of all the regional stakeholders, whose contributions made this report possible, granting interviews, participating in workshops and discussion groups, responding to surveys, providing information, giving feedback to preliminary results, and generally showing interest in the study. Furthermore, we thank the OECD-team for their comments and the interest shown in the study during the pre-visit this team made to Concepción in July 2009. The report has undoubtedly benefited from their feedback. Finally, the working group received funding from the Under-Committee for Innovation of the Bío Bío Region (Grant INNOVA BÍO BÍO No. 08-IR 438 F10) to conduct the self-evaluation study. We gratefully acknowledge this funding.

i
EXECUTIVE SUMMARY
Overview of the Region
4. The Bío Bío region presents a diversified economic structure that has developed as a consequence of historical and natural conditions. Since its early stages of development evidenced a maritime and trading vocation. This is in part explained by its privileged location in the centre of the country and its sheltered bays that facilitated the port development. An early orientation to agricultural activities, that with the development of the coal mining and port activities lead to a settlement and urbanization process, was later complemented with the development of industrial manufacturing in steel, petrochemical, forestry, and fishing products and of the services sector. Public infrastructure investment and public initiatives headed by CORFO played a key role in the industrial development of the Region.
5. The region is located in central Chile. The capital city Concepción is distant about 500 kilometres south of the national capital, Santiago. It has an extended net of transport connections with the rest of the country and the world, by air, sea, and land.
6. From an administrative point of view, the region is divided in four provinces and 54 communes. However, for the sake of regional public planning, it can also be divided in 10 relatively homogenous planning territories.
7. Concepción is the capital of the region and the province of Concepción. The other provinces with their province capitals are Ñuble (capital Chillán), Bío Bío (capital Los Angeles), and Arauco (capital Lebu).
8. The population in the Bío Bío Region was 1,861,562 inhabitants in the census year 2002. This corresponds to 12% of the country’s total population. Population is concentrated in the coast area of the province of Concepción, especially in the conurbation known as The Great Concepción that includes 6 communes. To a lesser magnitude, there is also a concentration of population around Chillán and Los Angeles. In spite of this concentration, accessibility to different areas in the region is good.
9. The Bío Bío Region makes an important contribution to the national product. Since 1990 the regional product has grown rapidly. However, in the period 1980-2006 the national per capita income has grown more quickly than the regional per capita income, leading to a declining trend in the regional participation of gross national product. The reasons for this relative poor performance are a major issue in the regional public discussion on economic matters.
10. From a productive point of view, industrial manufacturing is the most important activity developed in the Bío Bío region. Notwithstanding, other activities that have important impacts on total production are the services and primary production sectors. The service sector comprises different economic activities, such as social, communal, financial, and transportation services, that are basically urban in location. Primary activities include agricultural, livestock, fishing, forestry, and mining activities. The productive conditions that these primary activities show are directly related to the social and cultural characteristics of the population that works in these activities and that lives in the rural areas where they are mainly located.

ii
11. The firm structure of the region is heavily leaned towards small enterprises. About 82% of the firms are micro firms. Thus, variations in employment are related to the presence of these firms. Firm net creation is small but positive.
12. The main exports sectors are the forestry and fishing sectors. These sectors are dynamic and to an important extent drive the economy of the Bío Bío region. The number of products, exporting firms, and markets has grown steadily during the last 20 years. The export basket is diversified in different destiny markets.
13. The employment structure differs from the productive structure. The share of employment of the service and commerce sectors is much higher and the share of the manufacturing sector much lower than in production. Moreover, the non tradable sectors have increased their importance in total employment over time, in detriment of the primary sectors. However, employment has grown slowly over time, which has manifested itself in a higher regional unemployment rate than the national one.
14. The sustained, although moderated, growth of the regional production increased the income per capita in the Region. This allowed improve social indicators. Life expectancy in the Region is similar to the one faced by many developed countries. Poverty and indigence have been reduced significantly in the period. Despite of these improvements the region still shows social indicators as poverty or unemployment rate that are among the worst at the national level.
15. The diverse economic structure of the region and the original ethnic groups that existed in Chile at the arrival of the Spanish conquerors has generated a culturally and ethnically diverse population.
16. There has been an enormous progress in educational issues. Literacy, years of schooling and participation in higher education are contributing to close the gap that during several decades affected to the regional population in relation to the country.
17. The supply of higher education programmemes and enrolment in the Bío Bío region is concentrated, in the same way as population, in the Great Concepción, and to a lesser extent, in Chillán and Los Angeles. The HEI has grown rapidly in the last years reflecting the general enrolment growth process along the country. However, the students that are enrolled in the regions’ HEI come mainly from the same region. From a gender perspective, female students have increased their participation in total enrolment. Presently, the distribution of pregraduate students between males and females is even. However, the female share of graduates is higher than men.
18. The regional HEI have played an important role in regional development. Since the foundation, at the early of the past century, the University of Concepcion has been present supporting the training of qualification of labour and the transfer of knowledge towards the region. Many economics activities in the Region have, in the last century, received support from professionals and researchers graduated at the University of Concepcion. These contributions have been significant in many of the more important productive areas of the region as forestry, chemical, marine sciences, and agriculture. Other higher education institutions, although only recently, have begun the same process that have as a result a more complete sets of activities oriented to promote regional science and technology and more competitiveness.
19. The regional government is leaded by the Intendente, who is appointed by the president of the republic. The Intendente chairs the Regional Government that is composed of 22 council members elected by the members of the communal councils in the region. Moreover, each province has a governor elected by the government. Finally, the Alcalde (Mayor) and the communal council members are elected directly by universal suffrage.

iii
Characteristics of the Higher Education System
20. The national higher education system (SNES) is composed of three main agents: organisms that supervise and control the quality of the higher education, the higher education institutions (HEI) and the students and their families.
21. Among the entities that supervise the system, the division of higher education (DES) of the Ministry of Education; the higher council of education (CSE) a public autonomous organism and the council of rectors from Chilean universities (CRUCH) can be named. The DES basically supervises compliance with the current legislation relevant to higher education. The CSE promotes and supervises quality among the accredited institutions. The CRUCH coordinates the academic activity of the 25 traditional universities that are member of this organisation.
22. There are (basically) three types of HEI: universities, professional institutes (IP), and technical formation centres (CFT). The main difference between these institutions is in the type of grade they can give. In practice, this has consequences for the duration of the programmemes offered by the different institutions, being the CFT programmemes between 2-3 years; the IP programmemes 4 years, and the university programmemes 5 or more years. The distribution of HEI´s enrolment is biased towards university studies. This type of institution concentrated two thirds of total HEI enrolment in 2007, being the rest distributed between the CFT and the IP.
23. Geographically, the HEI are primarily located in the Metropolitan (Santiago), Bío-Bío (Concepción-Talcahuano), and Valparaíso (Valparaíso-Viña del Mar) regions. 74.2% of total enrolment is concentrated in these regions.
24. The higher regional educational system started with the creation of the Universidad de Concepción in 1919. The other important regional universities, namely the Universidad del BíoBío, Universidad Católica de la Santísima Concepción, and Universidad Técnica Federico Santa María, emerged as autonomous units from transformations of the regional headquarters of traditional national universities after this year. The professional institutes and the technical formation centres made their appearance in the region in the sixties and seventies, where institutions as the DUOC-UC and INACAP were created. Finally, during the eighties the so called “private universities” entered the regional higher education system, with the creation of the Universidad de San Sebastián and Universidad del Desarrollo.
25. The high education system at the national level has grown rapidly in past years in terms of enrolment, programmemes, accredited institutions, and financial resources. However, in terms of active institutions, there is a clear declining trend. The high education system in the Bío Bío region has also grown rapidly as in the rest of the country. However, in contrast with the national trend, the number of active institutions has grown in the region. This has primarily been due to the arrival of “non-regional” HEI to the Bío Bío region in the last years. In 2008, the HEI in the Bío Bío Region had an income equivalent to 2.6% of the regional total product.
26. The regional high education system is highly concentrated at least in two respects. First it is concentrated in a few large institutions. The universities agglomerate student enrolment, academic staff, resources, etc. to the detriment of the IP and CFT. Moreover, among the universities, the traditionally region-based CRUCH universities respond for the larger share of the educational supply. Second, there is also a geographic concentration that implies that the headquarters of the HEI are primarily located in the more high urbanized areas of the region: principally in the communes of Concepción, Talcahuano, Chillán and Los Angeles. The only type of institution that has a decentralization effect is the CFT. There are CFT located in more backward communes as Lebu and Lota.

iv
27. In year 2008, almost 65% of the students enrolled belonged to the two first (poorest) quintiles of income. This is a recent trend in student enrolment that is based on the interest from the families to educate their children and the extended funding possibilities given by the authorities, especially to the low income families. This fact involves new challenges to the regional HEI, e.g. in terms of drop-out rates from students from low income families, and HEI benefits to vulnerable students.
Contribution of HEI to Research and Regional Innovation
28. The general agreement, that innovation plays a central role for the possibilities of the country to grow rapidly in the future, seems to exist in Chile. This agreement is based on up-to-date research on the subject. Moreover, there has been a distinct effort from the part of the authorities, especially after year 2000, to promote innovation, through the development of different institutions, instruments and funds. However, the statistics show that presently Chile has a relatively poor performance in terms of innovation rates, number of researchers that participate in R&D, and a low rate of patenting, as compared with more developed countries. Moreover, funding for R&D seems to be insufficient, with a small participation of the private sector, and the research effort is concentrated in few institutions. However, on the positive side, there is an important expansion in researcher formation efforts and the level of science seems to be good in comparison with other Latin American countries.
29. The national policies that promote innovation have not shown an explicit regional dimension. Indirectly, the policies might have favoured the development of innovative activities in certain regions, to the extent that the resources involved in these activities are spatially decentralized. However, available information indicates that the Bío Bío Region has a larger share of innovative firms with a large portion of small firms involved in innovative activities than the country averages.
30. The regional government in the last decade has been orienting its public policies to encourage the HEI to increase applied research in issues of regional relevance. The support given by the regional authorities to the creation of institutions as INNOVA BÍO BÍO and CORECYT are indicative of the efforts made to promotion regional innovation. Many research centres with regional oriented have been created using national and regional public funding especially in areas related with natural resources as biotechnology, polymers, forestry, energy, etc. In addition, HEI has been showing a clear compromise with innovation and entrepreneurship
31. The regional agents that develop science and technology (S&T) are basically three traditional universities and the technological institutes and research centres. Of these, only the Universidad de Concepción emerges as an important S&T institution at the national level.
32. In spite of the non-existence of an explicit national policy for promoting science and technology at the regional level, the results of regional researchers and the orientation of research centres is mainly to areas with local relevance. Although, it has been a significant advance in the last ten years, and an incipient environment of innovation has been created, it is necessary to advance faster in order to increase the rate of economic regional growth and improve the living conditions of the population. Overall, considering that the economy has been growing slower than the country and showed historically high unemployment and poverty rates.
33. However, the HEI have some important weakness that must be tackled rapidly. One of them is the scarce cooperation activities among the institutions of Higher Education of the Region. This is valid for research collaboration between academic staff of different universities and between HEI and business firms. Probably because the system has been highly concentrated in one institution the cooperation has not be an issue. However, the experience shows that this is an important input to promote innovation and cluster development. Another weakness is the

v
low incentives that HEI have historically assigned to activities of applied research, diffusion, patenting and technological transfer. Although the University of Concepcion is one of the best positioned universities of Chile leading the patenting process among HEI, it is necessary to accelerate this process and generate internal incentive and special units into the HEI with highly qualified staff in the process of innovation in the firm, that can be used to act as intermediaries among firms, government and universities.
Contribution of HEI to Teaching and Learning to Labour Market and Skills
34. In very general terms, the supply of degrees offered by the regional higher education institutions (HEI) does not seem to be misaligned with the present demand for higher education graduates of the business sector. However, there is a substantial amount of the degrees offered by the HEI that cannot be classified in some productive sector, because they are “transversal or general” to different activities.
35. However, the match between supply and demand is not tight when the supply of degrees of the HEI are compared with the long term needs of the region, as expressed in the priority areas identified in the Regional Strategy for Development (RSD). In some areas identified by the RSD there seems to be an important and diverse supply of degrees. But in other areas the supply is tiny. This probably should mean that to the meet the “future demands”, there should be some re-directing of the regional higher education supply. However, the regional HEI have the potential to fulfil the long term requirements established in the RSD. They show a high quality and highly diversified supply of education within the dynamic and competitive environment that is the higher educational sector in Chile today, which forces them to improve continuously the attributes of their educational supply.
36. Localization of education seems to be highly concentrated in a few places. Decentralization of education is not an end by itself, and it probably responds to economies of scale and possible synergies given by the centralization of services for students. Additionally this concentration adds to the economic development of certain areas and regions, contributing also the develop identity of these places as universities cities. Decentralization might be an objective more feasible for certain type of institutions, like CFT and PI, but not necessary for all type of institutions. However, a good substitute to institutional localization can be student mobility. By and large, it is clear that HEI have a significant impact in the region and in the country, providing graduates in all areas of knowledge that fulfil the labour demand of the region and of the country and additionally generates a pole of development in some cities of the region.
37. There exist a wide number of instruments in the SNES that aim to reduce inequality for different socioeconomic groups, due to some type of discrimination (social, political, racial, and others). However, these are national instruments. There does not seem to exist regional specific instruments. The analysis of enrolment in the regional HEI by type of institution and according to quintile of income, leads to the conclusion that the CRUCH universities and the CFT might be contributing more to the reduction of income inequalities between families from different quintiles.
38. The Bío Bío region is a net expeller of HEI graduates, except for postgraduates. Moreover, the average wages earned by HEI graduates in the Bío Bío region are lower than their counterparts in the rest of the country for all sectors of economic activity. Finally, the unemployment rates for different types of HEI graduates are higher in the Bío Bío region than in the rest of the country, except for postgraduates. All this indicates that the labour market for HEI graduates in this region is relatively weak. The only exception seems to be for researchers (postgraduate students). A challenge faced by the region is the development of mechanisms to promote less migration of the graduates of HEI, especially linked to the fact that the region presents lower salaries and higher rates of unemployment in comparison to the country.

vi
Additionally, even though the HEI in the region have not decreased their enrolment participation in the country, more effort is needed to attract students from other regions of the country as well as international students.
39. The perception of different stakeholders about the skills and attainment of the regional HEI graduates, indicate that there is an important share of the interviewed that consider that the competences obtained are high or very high, that they have a good technical and professional formation, and capacity to apply their skills to specific tasks, but that they are ignorant about important facts about how the labour market functions, and they lack social abilities. A higher link between the students and the “real” labour work is needed to improve the insertion of graduates in the labour market. A great challenge is to train students in a second language. There exists several efforts in different institutions to make progress in this matter, but still a great portion of the students do not learn another language in their process of learning.
40. The opening of the survey results by different types of agents reveals that there exist important differences in opinion about the skills and attainment of the graduates. In general, HEI people tend to have a more positive opinion about their graduates than the agents from the public or business sector interviewed.
41. All HEI declare that the regional dimension of the learning process is a priority. This is explicitly stated in the “mission and vision” declaration of several institutions. Moreover, they develop different strategies to incorporate the regional dimension in their supply of courses and careers. Finally, they also implement different actions to recruit students from the region and to sponsor employability of their graduates.
42. Another challenge faced by the HEI is the need to generate better information sources to follow up the performance of HEI in several aspects. This is important for several reasons: for example, having a centralized source of information could shed some lights on new areas of knowledge that can be supplied by HEI. This development requires a higher level of cooperation among institutions, both in the same type of education or between different types (levels). Unfortunately this cooperation is limited due to the inherent competition for enrolment of students, and for public funds, among other issues, aggravated by the heterogeneity of missions and objectives among institutions. Difficulties to obtain information might also explained by this competition situation, that make actors to consider information as a sensible subject that could affect their relative position in the market.
43. There is room for improvement if, putting aside the market competition for students and public funds, HEI make efforts to promote the region and its institutions as an attractive centre for higher education, with diverse cultural, sport and academic activities available to all students, better job opportunities, supporting social and academic system to student from other regions that have to move from their current living places, student interactions and mobility among HEI.
Contribution of HEI to Social, Cultural, and Environmental Development
44. There exist two institutional conditions that promote the role of the HEI on the social, cultural, and environmental regional development. On one hand, in the strategic lines of the RSD there is a special mention of the intention to integrate the regional HEI as relevant actors in the development of these lines during the period 2008-2015. On the other hand, the National Accreditation Commission (CNA) uses as an accreditation criterion the degree of involvement of the HEI with the local environment, where the concept of involvement employed is related to the pertinence and ties with the local markets of the activity the HEI develops. These two conditions promote the participation of the HEI on the social, cultural and environmental spheres.

vii
45. The HEI have shown an impact on social conditions in the Bío Bío Region through different activities. These are the participation in different public- private task forces aiming at improving social conditions, the development of degrees in social development areas and the inclusion of graduate profiles oriented to cover social needs in the region, the impact of professional internships in social areas, the development of centres for juridical and social orientation directed to the community at subsidized costs, the development of community relation policies progressively oriented to social matters, the participation in the discussion of regional social development. Special mention should be made to the social impact that the location of some CFT in zones of high social vulnerability has had on the educational and labour market opportunities of their students and graduates.
46. Some factors that difficult the contribution of HEI to social development are that there is no direct link between the participation in different consulting instances and the design of social policy, the lack of an explicit policy that gives priority to research and teaching in social development issues, concentration in few communes of the HEI and their supply of courses and degrees, the bias in higher education towards university careers and away from technical education.
47. The HEI have also had an impact on the cultural development of the Bío Bío Region. The principal activities that reflect this have been the implementation of explicit community relation policies with a high content of cultural activities, the development or arts and culture as part of the universities supply of courses, the HEI participation in the regional councils on arts and culture, the development of communication media that increases the regional supply of cultural and arts programmemes, and specifically the contribution to sports infrastructure in the region.
48. There exist also some factors that difficult the contribution of HEI to cultural development, such as the deficit in cultural manager formation and in some specific cultural areas, and the low level of research in cultural expressions.
49. The main qualitative factors that enhance the contribution of the HEI to the development of environmental conditions in the Bío Bío Region are the support to research and the development of programmemes and degrees in environmental sciences, and their contribution in the design of specific environmental policies.
50. The factors that have restrained this contribution have been the low quantity of researchers in environmental areas, the perception that the installed capacities in the HEI are not fully used by regional stakeholders, and that environmental sustainability has not been expanded to all academic curricula.
Capacity Building for Regional Co-Operation
51. The principal organism in charge to implement and execute activities that promote regional development in the Bío Bío Region is the regional agency for innovative and productive development (ARIDP). The only regional agency that has introduced explicitly the concept of “innovation” in the name is the one for the Bío Bío Region. Administratively the agency depends on CORFO. However, unlike CORFO, which is a regional representative of the national institution, ARIDP is regional in nature with the main goal of incorporating regional public and private stakeholders in the regional decision making processes..
52. Other institutions that are important for R&D are the CORECYT and INNOVA BÍO BÍO. CORECYT is an organism that plans and promotes scientific and technological innovation at a regional basis. INNOVA BÍO BÍO is the regional fund for technological innovation.
viii
53. Three mechanisms that promote participation of the HEI in regional development were identified. These are the public private task forces oriented to specific regional issues, the participation of the HEI in the design and generation of the Regional Strategy for Development (RSD), and the participation of the HEI in forums and private organisations that promote regional development.
54. An important network for regional cooperation, in terms of the promotion of science, technology and innovation for regional development, exists in the Bío Bío Region. This network is leaded by the public sector (GORE and ARIDP) but it also includes the participation of some HEI and private organisations. Nevertheless, some areas of potential improvement exist, such as a better coordination between the regional and national level and a better inclusion of UP, CFT and IP in this network. Moreover, the regional authorities seem to be well aware of the capabilities and importance of the HEI for innovation and development. This is reflected in the inclusion of the role of the HEI in implementation of two strategic lines in the RSD, and in the regional agenda for innovation and productive development.
55. Even when HEI participate in the processes that promote regional development, there still exist few collaborative efforts among different HEI and between HEI and private firms. Some of the difficulties for collaborative efforts, from the point of view of the public authorities, private institutions and HEI are presented in the document. Among the most important we found the high heterogeneity of HEI, with regards to size, type of activities, type of research, etc. It is particularly important that there is one big university (Universidad de Concepcion) that compete at the national and international level, while the other institutions seems to focus their activities in a local and regional level. To facilitate the associative process the authorities have considered the creation of a Regional Council for Higher Education and through the CORECYT promoted associative projects between different HEI. Until now, the results seem to have been modest.
56. Finally, when asked, the HEI representatives identified several reasons and obstacles to the perceived low level of collaboration between their institutions. However, these reasons and identified obstacles differed between different types of institutions and in relation to the type of institution and the field they were supposed to collaborate. The HEI see each other in different ways depending on the type of institution, where a natural grouping considers three types: CRUCH universities, PU and CFT-IP. CRUCH universities seem to focus their activities in research, teaching and extension, PU in teaching and extension, and CFT-IP in teaching. In most of the aspects, CRUCH universities consider themselves not related with PU and CFT-IP. There seems to be a competition among the different type of institutions for student recruitment and external funding. CRUCH universities consider themselves to be allies only with other CRUCH universities in research activities.
Challenges for Increasing the Contribution of HEI to Regional Development
57. Although the region has made impressive progress in educational levels in general, and in higher educational levels specifically, there exists several challenges that must be met to resolve critical socioeconomic regional problems. Some of the challenges identified are the following: First, the focus in education must change from coverage to quality. Second, the contribution of HEI, in terms of more innovation and greater labour market skills, must be improved substantially to have a significant impact on the needed higher regional growth. Third, the HEI must revise their internal functioning and incentive systems to give effective priority to matters related to regional development. Fourth, the HEI must attempt to bridge differences and to develop cooperative activities between them and to strengthen relations between HEI and other regional actors, considering the existing differences between different institutions. Fifth, efforts must be laid down by the regional community to develop institutions that facilitate the transfer of knowledge to innovative activities, especially for the sector of small and medium-sized enterprises (SME). Sixth, the authorities must assure the administrative and financial tools

ix
to support and speed up initiatives that promote regional growth and contribute to the creation of institutions that can catalyze development efforts, looking at the same time to lift the restrictions for participation in this process of different HEI. Seventh, the promotion of the region as a centre for higher education seems to be a task that can be assumed by all regional actors and that can be beneficial for the regional development.

x
TABLE OF CONTENTS
FOREWORD
EXECUTIVE SUMMARY i
Overview of the Region i
Characteristics of the Higher Education System iii
Contribution of HEI to Research and Regional Innovation iv
Contribution of HEI to Teaching and Learning to Labour Market and Skills v
Contribution of HEI to Social, Cultural, and Environmental Development vi
Capacity Building for Regional Co-Operation vii
Challenges for Increasing the Contribution of HEI to Regional Development viii
CHAPTER 1. OVERVIEW OF THE REGION 1
Economic - Historical Overview of the Bío Bío Region 1
Geography and Connectivity 2
Demographic description 5
Economic and Social Characteristics 7
Higher Education in the Bío Bío Region 12
Governance Structure 13
CHAPTER 2. CHARACTERISTICS OF THE HIGHER EDUCATION SYSTEM 16
Review of the National Higher Education System 16
Evolution of the National Education System 19
Description of the Higher Education System in the Bío Bío Region 22
Regional Dimension in the National Higher Education Policy 26
CHAPTER 3. CONTRIBUTION OF RESEARCH TO REGIONAL INNOVATION 29
Framework conditions for promoting research and innovation 29
Responding to regional needs in the Bío Bío Region 35
Collaboration links between institutions and researchers 40
The Innovative Environment in the Bío Bío Region 42
CHAPTER 4. CONTRIBUTION OF TEACHING AND LEARNING TO THE labour MARKET AND SKILLS
46
Education Supply from Regional HEI 46
Matching the Supply and Demand in the Educational Process 46
xi
Skills and Attainments of the Regional HEI Graduates 55
Regional Dimension in the Development of HEI Strategies 58
CHAPTER 5. CONTRIBUTION TO SOCIAL, CULTURAL, AND ENVIRONMENTAL DEVELOPMENT
63
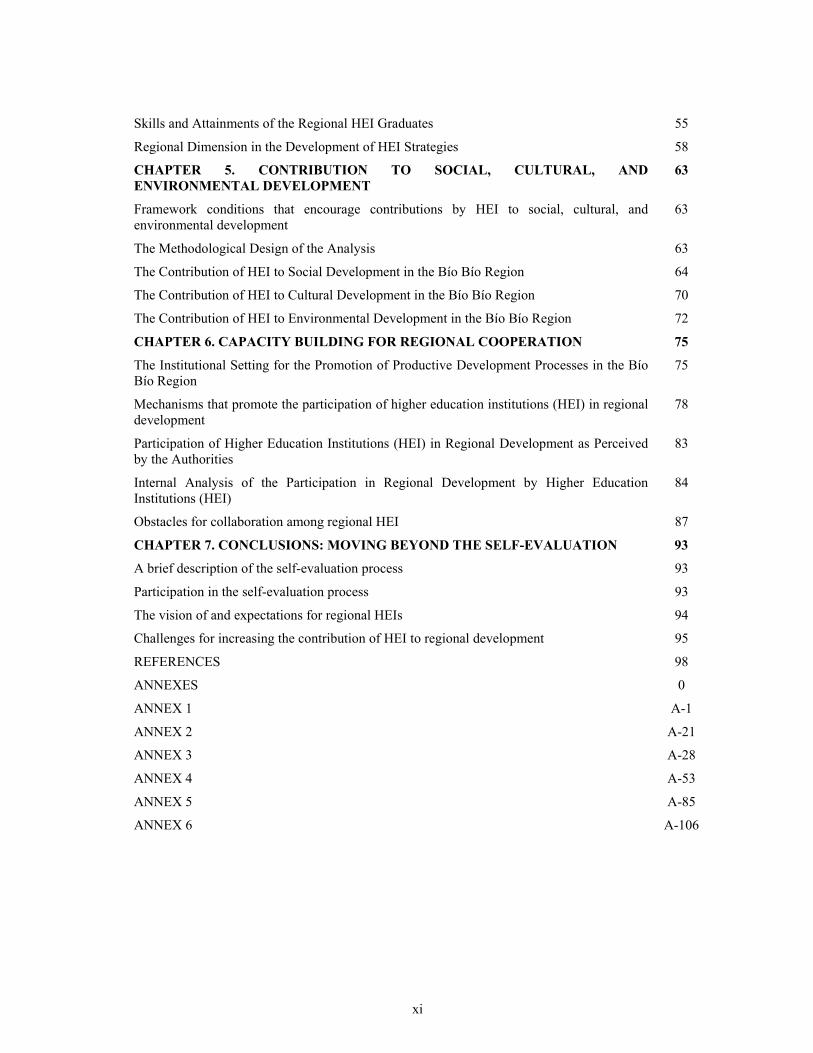
Framework conditions that encourage contributions by HEI to social, cultural, and environmental development
63
The Methodological Design of the Analysis 63
The Contribution of HEI to Social Development in the Bío Bío Region 64
The Contribution of HEI to Cultural Development in the Bío Bío Region 70
The Contribution of HEI to Environmental Development in the Bío Bío Region 72
CHAPTER 6. CAPACITY BUILDING FOR REGIONAL COOPERATION 75
The Institutional Setting for the Promotion of Productive Development Processes in the Bío Bío Region
75
Mechanisms that promote the participation of higher education institutions (HEI) in regional development
78
Participation of Higher Education Institutions (HEI) in Regional Development as Perceived by the Authorities
83
Internal Analysis of the Participation in Regional Development by Higher Education Institutions (HEI)
84
Obstacles for collaboration among regional HEI 87
CHAPTER 7. CONCLUSIONS: MOVING BEYOND THE SELF-EVALUATION 93
A brief description of the self-evaluation process 93
Participation in the self-evaluation process 93
The vision of and expectations for regional HEIs 94
Challenges for increasing the contribution of HEI to regional development 95
REFERENCES 98
ANNEXES 0
ANNEX 1 A-1
ANNEX 2 A-21
ANNEX 3 A-28
ANNEX 4 A-53
ANNEX 5 A-85
ANNEX 6 A-106

xii
LIST OF TABLES
Table 1.1 Population: Inter-census Growth and Urban and Rural Shares of the
Population Bío Bío Region. 5
Table 1.2 Net Migration Rate (%) (Immigrants – Emigrants) per 1,000 Inhabitants for Selected Regions.
6
Table 1.3 Proportion of the Population that is Poor and Indigent Bío Bío Region and Country.
12
Table 2.1 Total National Enrolment in Higher Education by Type of Institution. 1990-2008.
21
Table 2.2 Enrolment in the Bío Bío Region by Higher Education Institution and Level (Undergraduate, Post-Professional, Postgraduate). 1990-2008.
25
Table 2.3 Social-Economic Composition of the Enrolment in the Bío Bío Region by Income Quintile and according to Type of Higher Education Institution .2008
26
Table 3.1 GDP Growth and TFP Contribution in Chile (Different Periods). 30
Table 3.2 Main Indicators of Science, Technology, and Innovation by Regions in Chile, Several Years.
37
Table 3.3 Number and Distribution of Firms Classified by Technological Level in the Bío Bío Region, Spain, and Italy.
42
Table 4.1 Percent Distribution of Students (%) by Type of Higher Education Institution According to Gender and Quintile.2003 and 2006.
56
Table 5.1 Human Capital Formation in Areas Linked to Social Development by Type of Higher Education Institution.
66
Table 6.1 Participation in Public Funds with Direct Impact on Regional Development (% of Institutions by Type and Year).
86
LIST OF MAPS
Map 1.1 Administrative and Political Divisions of the Bío Bío Region, 2009. 4
Map 4.1 Presence of Higher Education Institutions and Total Enrolment per each One Thousand Inhabitants in Different Communes Bío Bío Region. 2008.
51

xiii
LIST OF FIGURES
Figure 1.1 Per Capita Gross Domestic Product Bío Bío Region and Country. 1990-
2006. 8
Figure 1.2 Share of the Economic Sectors in the Gross Domestic Product Bío Bío Region. 2006.
9
Figure 1.3 Unemployment Rate Bío Bío Region and Country Annual Average. 1997-2008.
11
Figure 2.1 Evolution of National and Regional Undergraduate Coverage of the 18-24-Year-Old Age Group. 1990-2008.
22
Figure 2.2 Evolution of the Number of Higher Education Institutions with a Presence in the Bío Bío Region. 2000-2008.
24
Figure 3.1 Relationship Between Gross Domestic Product and Number of Researchers in Several Countries.2008.
31
Figure 3.2 Number of Scientific Publications (ISI) in Chile. 1988-2008. 32
Figure 4.1 Employment Distribution of Higher Education Graduates by Sector of Economic Activity Bío Bío Region. 2006.
48
Figure 4.2 Net Migration from the Bío Bío Region in Numbers of People by Type of Education. 2006.
53
Figure 6.1 Organisations in Charge of Promoting Economic and Productive Development in the Bío Bío Region.
79
LIST OF DIAGRAMS
Diagram A.4.1
Higher Education Articulation in INACAP
62
LIST OF BOXES
Box 3.1 Innova Bío Bío 35
Box 3.2 Centro de Alta Tecnología en Maderas (CATEM) 41
Box 3.3 Unidad de Desarrollo Tecnológico (UDT) 43
Box 3.4 Centro Regional de Estudios Ambientales (CREA) 44
Box 4.1 Programme for Education in Competences FORCOM-INACAP-COLBUN 60
Box 4.2 Articulation of Higher Education at Different Levels: CFT-IP-University. INACAP
62

xiv
Box 5.1 ARTIUC, an Institutionalized Integration Experience with Handicapped Students
69
Box 5.2 The Technical Formation Centre CFT Lota Arauco. Human Capital Formation in a Highly
70
Box 5.3 The Symphony at the Forum. Symphonic Orchestra of the Universidad de Concepción
71
Box 5.4 The International Europe Latin America Centre for Research and Formation in Environmental Sciences (Centro EULA Chile)
73
Box 6.1 The Role of CORECYT in Capacity Building for Regional Cooperation among HEI
77
Box 6.2
A Cluster in Higher Education, Science, and Technology, Bío Bío Educating and Innovating
81
Box 6.3 The Creation of a Community Liaison Vice-Chancellor in the UCSC 83

xv
LIST OF TABLES IN ANNEXES
Table A.1.1 Distance from the Provincial Capital Cities of the Bío Bío Region to Selected Cities (Kilometres).
A-1
Table A.1.2 Time and Cost of Transport from Concepción to Chile’s two Main Cities, January 2009.
A-1
Table A.1.3 Communal Immigration and Emigration between 1997 and 2002 Share of Total Population (%).
A-2
Table A.1.4 Fertility of Mothers Younger than 20 Years Old (*) per 1,000 Women Bío Bío Region and Country.
A-4
Table A.1.5 Higher Education Institutions with Presence in the Bío Bío Region: 2009.
A-5
Table A.1.6 Students Enrolled in Higher Education Institutions by Type of Institution and City of Origin Bío Bío Region: 2008.
A-9
Table A.1.7 Origin (Secondary School) of Students Enrolled in the Higher Education Institutions, by Type of Institution, in the Bío Bío Region. Percentage (%) of Total Students: 2008.
A-10
Table A.2.1 Number of Higher Education Institutions in Chile According to Type and Regime. 2002-2008.
A-21
Table A.2.2 Academic Staff of Higher Education Institutions by Institution Type and Gender. 2008.
A-21
Table A.2.3 First Year Undergraduate Students by Origin and Type of Higher Education Institution (HEI). 2008.
A-22
Table A.3.1 Innovation Expenditure of Private Sector in Chile (2003-2006). A-28
Table A.3.2 R&D Indicators, Selected Countries. A-29
Table A.3.3 Science and Technology Indicators for Latin American Selected Countries.
A-31
Table A.3.4 Distribution of Expenditure in Science and Technology by Type of Institution for Selected Latin American Countries, 2001
A-31
Table A.3.5 Triadic Patent Families1 per Million Inhabitants in Selected Countries2 (2005).
A-32
Table A.3.6 Patent Applications and Patents Granted through Chilean DPI by Origin (1995-2007).
A-33
Table A.3.7 Distribution of Total Patent Applications and Patents Granted (%) by Type of Institution (1995-2004).
A-34
Table A.3.8 Research Profile of the Main Chilean Universities (2008). A-35
Table A.3.9 Impact and Number of Publications in Selected Disciplines and Countries (1993-2003).
A-36
Table A.3.10 Budget for Science and Technology From CONICYT by Programmes in Thousands of Dollars. 2004-2007.
A-37

xvi
Table A.3.11 Number of Scientific Publications in Chile and their Distribution Among
Institutions. A-38
Table A.3.12 Number and Distribution of Patents Registered by Chilean Universities by Institution.1995-2007.
A-38
Table A.3.13 Citation Indicators for National Publications and those from the Bío Bío Region.1988-2008.
A-39
Table A.3.14 Research Centres of Higher Education Institutions in the Bío Bío Region. 2009.
A-40
Table A.3.15 Innovation Consortia in Chile. 2009. A-42
Table A.3.16 Publication Indicators by Knowledge Area: National and for the Bío Bío Region.
A-45
Table A.3.17 Index of Collaboration Effort with Other Researchers from CRUCH Universities in the Bío Bío Region.2006–2008.
A-46
Table A.3.18 Cooperation in Research and Development Activities by Region and Type of Cooperation. 2005-2006.
A-47
Table A.3.19 Share of Innovative Firms in the Total by Size and According to Region (2006).
A-47
Table A.3.20 Knowledge about Existence and Use of Funds by Source and According to Region.
A-48
Table A.4.1 Integration and Coverage Initiatives in the Chilean System. A-53
Table A.4.2 Distribution of Students (%) by Gender According to Quintile and Type of Higher Education Institution. 2003 and 2006.
A-57
Table A.4.3 Distribution of Students (%) by Quintile According to Gender and Type of Higher Education Institution. 2003 and 2006.
A-58
Table A.4.4 Assessment of Competences Obtained from the Higher Education Institutions of the Bío Bío Region by Type of Qualified Informers. 2009.
A-59
Table A.4.5 Assessment of Competences Obtained by Graduate of the Higher Education Institutions of the Bío Bío Region by Employers. 2009.
A-60
Table A.5.1 Programmes, Agreements, and Actions Developed by the Higher Education Institutions in the Bío Bío Region for Social Development.
A-86
Table A.5.2 Summary of Self Evaluation: How do You Perceive the Contribution of the Higher Education Institutions to Social Development in the Bío Bío Region?. By Type of Higher Education Institution.
A-89
Table A.5.3 Self Assessment by Regional CRUCH Universities of the Contribution of Higher Education Institutions to Social Development.
A-90
Table A.5.4 Self Assessment of Private Regional Universities of the Contribution of Higher Education Institutions to Social Development
A-91
Table A.5.5 Self Assessment of the Regional Higher Education Institutions of the Contribution of Higher Education Institutions to Social Development.
A-92

xvii
Table A.5.6 Self Assessment of the Regional Technical Formation Centres of the
Contribution of Higher Education Institutions to Social Development. A-93
Table A.5.7 Self Assessment of the Regional Higher Institutions of the Contribution of Higher Education Institutions to Social Development.
A-94
Table A.5.8 Number of Research Projects Awarded by the FONDECYT Regular Programme in Socially Related Areas between 2000 and 2009, by University in the Bío Bío Region.
A-95
Table A.5.9 Art and Culture Infrastructure in the Bío Bío Region. A-95
Table A.5.10 Indicators of Participation in Artistic and Cultural Activities in the Bío Bío Region. 2005.
A-96
Table A.5.11 Perception of the Contribution on the CRUCH to the Development of Arts and Culture in the Bío Bío Region.
A-96
Table A.5.12 Type of Cultural Activities in the Higher Education Institutions of the Bío Bío Region by Type of Activity and According to Type of Higher Education Institution.
A-97
Table A.5.13 Programmes and Activities of the Higher Education Institutions Related to Arts and Culture in the Bío Bío region .2009.
A-98
Table A.5.14 Undergraduate and Postgraduate Programmes Oriented to Social, Cultural, and Environmental Areas Offered by the Regional Universities in the Bío Bío region.
A-101
Table A.5.15 Regular FONDECYT Projects Awarded in the Environmental Area to Universities in the Bío Bío region. Period 2000-2009.
A-105
Table A.5.16 Human Capital Formation in Areas Linked to Environmental Sustainability.
A-105
Table A.6.1 Level of Importance for Defining Regional Priorities and Needs (% of Total Answers).
A-106
Table A.6.2 Participation of the HEI in Entities that Promote Regional Development in the Bío Bío Region (% of Institutions that Participate Actively or Passively).
A-107
Table A.6.3 Activities Conducted at Each Higher Education Institution that Contribute to Regional Development.
A-108
Table A.6.4 Views of Strategic Interaction among Higher Education Institutions (% of Answers in Each Category).
A-114
Table A.6.5 Areas in which Higher Education Institutions Currently Conduct Associative Activities (% of Answers in Each Category).
A-116

xviii
LIST OF MAPS IN ANNEXES
Map A.1.1 Planning Territories in the Bío Bío Region, 2009. A-13
Map A.1.2 Four Main Populated Areas in the Bío Bío Region, 2002. A-14
Map A.1.3 Students Enrolled in Higher Education Institutions Bío Bío Region 2008. A-15
Map A.4.1 Distribution of Offered Undergraduate Degrees from the Higher Education System by Sector of Economic Activity and Labour Demand According to Commune Bío Bío Region. 2008.
A-61
LIST OF FIGURES IN ANNEXES
Figure A.1.1 Composition of the Population by Age Groups and Sex Bío Bío Region. 1992 and 2002.
A-16
Figure A.1.2 Distribution of the Population by Years of Education Bío Bío Region. 1992 and 2002.
A-17
Figure A.1.3 Distribution of the Population by Years of Education Bío Bío Region and Country. 2002.
A-18
Figure A.1.4 Share of Sectors in Employment in the Bío Bío Region Annual Average. 2007.
A-19
Figure A.1.5 Region of Origin of Student Enrolled in Higher Education Institutions in the Bío Bío Region.
A-20
Figure A.2.1 Evolution of the Number of Higher Education Institutions in Chile by Type of Institution. 1990-2008.
A-23
Figure A.2.2 Evolution of Public Contributions to Higher Education Institutions in Chile through the Direct (AFD) and Indirect (AFI) Contributions, and the Institutional Development Fund and MECESUP (FDI-MECESUP). 1990-2008 (in Millions of Pesos per Year).
A-23
Figure A.2.3 National Undergraduate, Post-Professional, and Postgraduate Enrolment in Chile. 1990-2008.
A-24
Figure A.2.4 Distribution of National Undergraduate Enrolment by Area of Knowledge. 2008.
A-24
Figure A.2.5 Number of Graduates from Higher Education Institutions in Chile by Gender. 1998-2007.
A-25
Figure A.2.6 Evolution of Public Support for Students (millions of Chilean pesos of 2008) and the Number of Beneficiaries. 1990-2008.
A-25
Figure A.2.7 Evolution of the Public Contributions Obtained by the Universidad de Concepción, the Universidad del Bío-Bío, and the Universidad Católica de la Santísima Concepción, in Millions of Pesos of 2008 1990-2008.
A-26

xix
Figure A.2.8 Communal Share of Undergraduate Enrolment in the Bío Bío Region by Type of Institution. 2008.
A-26
Figure A.2.9 Distribution of the Average Scores Obtained by the Incoming Students for the CRUNCH Universities with Presence in the Bío Bío Region. 1998-2008.
A-27
Figure A.2.10 Evolution of Regional HEI Support to Students (millions of Chilean pesos of 2008) and the Number of Beneficiaries by Income Quintile 1998-2008.
A-27
Figure A.3.1 Relationship Between Research and Development Intensity and Gross Domestic Product (by Purchasing Power Parity) in Several Countries.2008.
A-28
Figure A.3.2 Relationship Between per Capita Research and Development and per Capita Gross Domestic Product in Several Countries. 2008.
A-29
Figure A.4.1 Number of Branches of Higher Education Institutions by Year and Type Bío Bío Region. 2000-2007.
A-67
Figure A.4.2 Enrolment by Year and Type of Higher Education Institution Bío Bío Region. (Number of Students). 2000-2007.
A-68
Figure A.4.3 Distribution of Degrees by Type of Institution Bío Bío Region. 2007. A-69
Figure A.4.4 Employment by Sector of Economic Activity Bío Bío Region. 2006. A-70
Figure A.4.5 Distribution of Higher Education Employees by Type of Higher Education Institution and Sector of Economic Activity Bío Bío Region. 2006.
A-71
Figure A.4.6 Distribution of Offered Undergraduate Degrees from the Regional Higher Education System by Sector of Economic Activity Bío Bío Region. 2008.
A-72
Figure A.4.7 Distribution of Undergraduate Degrees Offered by the Regional Higher Education Institutions by Sector of Economic Activity Bío Bío Region. 2008.
A-73
Figure A.4.8 Distribution of Offered Undergraduate Degrees from the Regional Higher Education System in Agriculture, Fish and Stockbreeding Bío Bío Region. 2008.
A-74
Figure A.4.9 Number of University Graduate Programmes by Institution and Province Bío Bío Region in year 2008.
A-75
Figure A.4.10 Degrees by Development Areas Bío Bío Region. 2008. A-76
Figure A.4.11 Distribution of Degrees Offered by the Regional Higher Education Institutions by Type of Institution and Area of Development Bío Bío Region. 2008.
A-77
Figure A.4.12 Distribution of the Headquarters of the Higher Education Institutions by Locality Bío Bío Region. 2008.
A-78
Figure A.4.13 Rate of Enrolment in the Higher Education Institutions per Thousand Inhabitants in Different Localities Distribution of Offered Undergraduate Degrees from the Higher Education System Bío Bío Region. 2008.
A-79

xx
Figure A.4.14 Average Wages Earned by Graduates from Technical Formation Centres
Employed by the Economic Activity Sector (in pesos per month) Bío Bío Region and Country. 2006.
A-80
Figure A.4.15 Average Wages Earned by Professional Institute Graduates Employed by Sector of Economic Activity (pesos per month) Bío Bío Region and Country. 2006.
A-81
Figure A.4.16 Average Wages Earned By University Graduates Employed by Sector of Economic Activity (pesos per month) Bío Bío Region and Country. 2006.
A-82
Figure A.4.17 Rate of Unemployment by Type of Higher Education Graduate Bío Bío Region and Country. 2006.
A-83
Figure A.4.18 Distribution of Export Value Originated in the Bío Bío Region by Principal Export Sectors.2008.
A-84
LIST OF DIAGRAMS IN ANNEXES
Diagram A.3.1 Institutional Framework of the Chilean Innovation System. A-51
Diagram A.3.2 The Learning Trajectory of the Chilean Innovation System. A-52

xxi
ACRONYMS AND ABBREVIATIONS
AFD Aporte Fiscal Directo Direct Public Contribution
AFI Aporte Fiscal Indirecto Indirect Public Contribution
ARDP Agencia Regional de Desarrollo Productivo
Regional Agency for Productive Development
ARIDP Agencia Regional de Innovación y Desarrollo Productivo
Regional Agency for Innovation and Productive Development
CATEM Centro de Alta Tecnología en Madera Centre for Advanced Wood Technology
CASEN Encuesta de Caracterización Socio Económica Nacional
National Socioeconomic Characterization Survey
CCTE Centros de Ciencia y Tecnología de Excelencia
Scientific and Technological Centres of Excellence
CEDUC Centro de Formación Técnica y de Capacitación
Technical Formation and Training Centre
CEFE Centro de Economía y Finanzas de la Empresa
Centre for Business Economics and Finance
CEIA Centro de Estudios de Ingeniería Ambiental
Centre for Environmental Engineering Studies
CEUR Centro de Estudios Urbanos Regionales
Centre of Urban Regional Studies
CFT Centro de Formación Técnica Technical Formation Centre
CIAM Centro de Investigación Aplicada al Mercado
Centre of Market Applied Research
CICAT Centro Interactivo de Ciencias Artes y Tecnología
Interactive Centre for Science, Arts, and Technology
CIDCIE Centro de Desarrollo en Informática Educativa
Centre for the Development of Computer Based Education
CIDE Centro de Innovación y Desarrollo Empresarial
Centre for Entrepreneurial Development and Innovation
CIDERE BÍO BÍO Corporación Industrial para el Desarrollo Regional de la Región del Bío Bío
Industrial Corporation for the Regional Development of the Bío Bío Region

xxii
CIEP Centro en Investigación de Ecosistemas en la Patagonia
Centre for Research in Patagonian Ecosystems
CIMP Centro de Investigación Marítimo Portuario
Centre of Maritime and Harbour Research
CIPA Centro de Investigación de Polímeros Avanzados
Research Centre on Advanced Polymers
CMI Comisión Ministerial para la Innovación
Ministerial Commission for Innovation
CNA Comisión Nacional de Acreditación National Accreditation Commission
CNAP Comisión Nacional de Acreditación de Pregrado
National Commission of Undergraduate Accreditation
CNCA Consejo Nacional de la Cultura y las Artes
National Council for Culture and the Arts
CNIC Consejo Nacional de Innovación para la Competitividad
National Council of Innovation for Competitiveness
CODELCO Corporación Nacional del Cobre National Copper Corporation
CONACE Consejo Nacional para el Control de Estupefacientes
National Council for Drug Control
CONAP Comisión Nacional de Acreditación de Postgrado
National Commission for Postgraduate Programme Accreditation
CONICYT Comisión Nacional de Investigación Científica y Tecnológica
National Commission for Scientific and Technological Research
COPAS Centro de Investigación Oceanográfica en el Pacífico Sur Oriental
Centre for Oceanographic Research in the Eastern South Pacific
CORBÍOBÍO Corporación por la Regionalización del Bío Bío
Corporation for the Regionalization of the Bío Bío
CORE Consejo Regional Regional Council

xxiii
CORECYT Consejo Regional de Ciencia y
Tecnología Regional Council for Science and Technology
CORFO Corporación de Fomento de la Producción
Corporation for Production Promotion
CPCC Cámara de la Producción y el Comercio de Concepción
Chamber of Production and Commerce of Concepción
CREA Centro Regional de Estudios Ambientales
Regional Centre for Environmental Studies
CRUCH Consejo de Rectores de Universidades Chilenas
Council of Rectors from Chilean Universities
CSE Consejo Superior de Educación Higher Council of Education
CTA Consorcio Tecnológico Aeronautico Technological Aeronautic Consortium
DES División Superior de Educación Division of Higher Education
DPI Departamento de Propiedad Intelectual
Department of Intellectual Property
DUOC Departamento Universitario Obrero y Campesino de la Universidad Católica de Chile
University Department for Peasants and Workers of the Universidad Católica de Chile
EFE Empresa de Ferrocarriles del Estado Public Railroad Company
ENAP Empresa Nacional del Petróleo National Oil Company
EPO Oficina de Patentes de Europa European Patent Office
EULA Centro de Ciencias Medioambientales Centre for Environmental Sciences
FDI Fondo de Desarrollo e Innovación (ex - FONSIP)
Fund for Development and Innovation (formerly FONSIP)
FIA Fondo para la Innovación Agraria Fund for Agricultural Innovation
FIC Fondo de Innovación para la Competitividad
Innovation Fund for Competitiveness
FIM Fondo de Investigaciones Mineras Fund for Mining Research
FIP Fondo de Investigación Pesquera Fund for Fisheries Research

xxiv
FNDR Fondo Nacional de Desarrollo Regional
National Fund for Regional Development
FOB Libre a Bordo Free on Board
FOCAL Programmea de Fomento a la Calidad Programme for Quality Promotion
FONDAP Fondos de Estudios Avanzados en Areas Prioritarias
Fund for Advanced Research in Priority Areas
FONDART Fondo Nacional de Desarrollo Cultural y las Artes
National Fund for Cultural Development and the Arts
FONDECYT Fondo Nacional de Desarrollo Científico y Tecnológico
National Fund for Scientific and Technological Development
FONDEF Fondo de Fomento al Desarrollo Científico y Tecnológico
Fund for the Promotion of Scientific and Technological Development
FONSIP Fondo para Programmea y Proyectos de Investigación de Servicio e Interés Publico
Fund for Research Programmes and Projects of Public Interest and Service
FONTEC Fondo Nacional de Desarrollo Tecnológico y Productivo
National Fund for Technological and Productive Development
FOSIS Fondo de Solidaridad e Inversión Social
Solidarity and Social Investment Fund
GEA Instituto de Geología Aplicada Applied Geology Institute
GDP Producto Interno Bruto Gross Domestic Product
GORE Gobierno Regional Regional Government
HDI Índice de Desarrollo Humano Human Development Index
HEI Institución de Educación Superior Higher Education Institution
ICT Tecnologías de la Información y la Comunicación
Information and Communication Technologies
INACAP Instituto Nacional de Capacitación Profesional
National Institute of Professional Training
INE Instituto Nacional de Estadísticas National Statistics Institute
INFOR Instituto Forestal Forest Institute

xxv
INIA Instituto de Investigaciones Agropecuaria
Institute of Agricultural Research
INNOVA-BIOBIO Fondo de Innovación Tecnológica de la Región del Bío Bío
Fund for Technological Innovation of the Bío Bío Region
INPESCA Instituto de Investigación Pesquera Fisheries Research Institute
IP Institutos Profesionales Professional Institutes
ISI Instituto de Información Científica Information Sciences Institute
ISIC Clasificación Industrial Internacional Uniforme de las Actividades Económicas
Standard International Industrial Classification of all Economic Activities
JPO Oficina de Patentes de Japón Japan Patent Office
MECESUP Programmea de Mejoramiento de la Calidad y la Equidad de la Educación Superior
Programme for Improving Quality and Equity in Higher Education
MIDEPLAN Ministerio de Planificación y Coordinación
Ministry of Planning and Coordination
MINEDUC Ministerio de Educación Ministry of Education
MOPTT Ministerio de Obras Públicas, Transportes y Telecomunicaciones
Ministry of Public Works, Transport and Telecommunications
OECD Organización para la Cooperación y el Desarrollo Económico (OCDE).
Organisation for Economic Co-Operation and Development
PBCT Programa Bicentenario de Ciencia y Tecnología.
Bicentenary Programme for Science and Technology
PCT Programa de Ciencia y Tecnología Programme for Science and Technology
PDIT Programa de Desarrollo e Innovación Tecnológica
Programme for Development and Technological Innovation
PDP Programa de Desarrollo de Proveedores
Programme for Development of Suppliers
PDT Programa de Desarrollo Territorial Territorial Development Programme
PER-UDEC Programa de Energía Renovables, Programme of Renewable

xxvi
Universidad de Concepción Energies, Universidad de Concepción
PMC Plan de Mejora Competitiva Plan for Competitive Improvement
PNUD Programmea de las Naciones Unidas para el Desarrollo
United Nations Development Programme
PROCE Programa de Desarrollo Científico Escolar
Programme for the Scientific Scholarly Development
PROFOS Proyectos Asociativos de Fomento Associative Promotion Projects
PSU Prueba de Selección Universitaria University Selection Test
PTI Programa Territorial Integrado Integrated Territorial Programme
R&D Investigación y Desarrollo Research and Development
RICYT Red Iberoamericana de Indicadores de Ciencia y Tecnología
Ibero-American Network of Science and Technology Indicators
RSD Estrategia Regional para el Desarrollo Regional Strategy for Development
RSU Responsabilidad Social Universitaria University Social Responsibility
SCIELO Librería Electrónica Científica en Línea
Scientific Electronic Library Online
SENAME Servicio Nacional de Menores National Service for Minors
SERCOTEC Servicio de Cooperación Técnica Technical Co-operative Service
SIES Sistema Nacional de Información de Educación Superior
National Information System of Higher Education
SIMCE Sistema de Medición de la Calidad en Educación
System for Measuring Educational Quality
SNES Sistema Nacional de Educación Superior
National Higher Education System
SUBDERE Subsecretaría de Desarrollo Regional y Administrativo
Under-Secretary of Regional and Administrative Development
TFP Productividad Total de los Factores Total Factor Productivity

xxvii
TIGO Observatorio Geodésico Integrado Transportable
Transportable Integrated Geodesic Observatory
UBB Universidad del Bío-Bío Universidad del Bío-Bío
UCSC Universidad Católica de la Santísima Concepción
Universidad Católica de la Santísima Concepción
UdeC Universidad de Concepción Universidad de Concepción
UDT Unidad de Desarrollo Tecnológico Technological Development Unit
UP Universidades Privadas Private Universities
UPI Unidad de Propiedad Intelectual Intellectual Property Unit
USPTO Oficina de Patentes y Marcas de Estados Unidos
United States Patent and Trademark Office
UTFSM Universidad Técnica Federico Santa María
Universidad Técnica Federico Santa María

1
CHAPTER 1. OVERVIEW OF THE REGION
This chapter presents an overview of the Bío Bío Region, starting with a brief economic-historical review, followed by descriptions of some geographical, demographic, and socioeconomic characteristics. Then we explain some characteristics of the higher education system and briefly portray the Chilean governance structure.
Economic - Historical Overview of the Bío Bío Region
58. From early on in its development, what today constitutes the Bío Bío Region has shown a vocation for maritime, agricultural, and commercial activities. Spanish conquerors first settled here to take advantage of the broad, sheltered bays that facilitated military exchanges and trade with other national and foreign coastal areas. The main agricultural activity was wheat farming and wine production. Until the mid-19th century, an important percentage of this region’s population lived in rural zones.
59. At the end of the century, the economic structure of the region began to shift due to a slow migratory process from the countryside to the city. The first significant migration began with the exploitation of coal deposits along the coast (from the town of Lirquén in the north to the town of Lebu in the south). Coal activities are highly intensive in manpower and their onset triggered a coastal settlement process that generated communication and transportation facilities, including harbour infrastructure that would later be essential for further regional development. In this period, the region’s ports were also used as landing ports by vessels shipping saltpetre through the Strait of Magellan. The city of Concepción grew with the construction of public buildings. In the financial area, the Bank of Concepción was born. The public sector developed important projects such as a railroad connecting Talcahuano and Chillán and the first graving dock, allowing for the future emergence of Chile’s most important shipbuilding industry in Talcahuano.
60. The population growth allowed new industries to emerge at the beginning of the 20th century. These were also situated along the regional coast, following a strong pattern of local specialisation. Hence, the wool and textile industry grew up in Tomé, the sheet glass industry in Lirquén, china manufacturing and sugar production in Penco, and brick fabrication in Coronel. In this period, development continued on the harbour infrastructure with the projects known as “sea wall 500” and “graving dock No. 2”.
61. In the early decades of the 20th century, the first road bridge was built over the Bío Bío River and the Universidad de Concepción was founded. However, the definite impulse to regional industrial activity occurred in the 1940s with the creation of CORFO, a government corporation intended to support national re-construction after the earthquake in 1939. CORFO played an important role in promoting the industrialisation of the region, both directly through the creation of new companies such as the iron and steel factory “Huachipato” in San Vicente Bay and the Hydroelectric Plant “Abanico”, and indirectly through the support and promotion of industrialized fishing. The establishment of these enterprises in the region generated backward and forward linkages that induced the creation of an important number of related industries (iron-steel, petrochemical, glass, and cement), as well as the firms providing supplies for the operation of these plants. Thus, an industrial pole developed in the cities of Concepción and Talcahuano and the resulting new wave of urban settlement concentrated a high percentage of the regional population in these cities. During these years, national economic activity was

2
heavily protected from external competition through high and differentiated tariffs. However, as of the mid-1970s, the opening of the national markets to international trade generated important changes in the regional productive structure.
62. After 1974, micro and macro economic reforms were instated in an attempt to eliminate the obstacles limiting trade, to balance the public budget, and to reduce inflation. These measures generated an important decline in the population’s income and high unemployment rates, which contributed to worsen the impact on demand, causing a strong process of industrial restructuring in the region. The recovery of the regional economy, which started definitely only after the 1982 crisis, was framed by a strong export bias led by two activities based on natural resources: fishing (including the extraction and processing of sea products) and forestry (including the plantation, logging, and processing of wood-based products such as cellulose). Although these activities began back in the 1960s, they did not become relevant development poles until the 1980s. The growth of these industries gave birth to new settlements in the region. The forest industry generated new industrial centres in the provinces of Bío Bío and Arauco. At the same time, the need to promote long-term sustainable forest exploitation triggered a first stage of accelerated forest plantation that produced emigration from rural zones. The industry spread to new centres other than those traditionally located in the communes of Talcahuano, Coronel, and Tomé.
63. The changes experienced by the national and regional economy in the last few decades have also affected agriculture. In the Bío Bío Region, this activity focused mainly on the production of traditional crops, especially wheat. In fact, the process of opening the economy to international trade has implied a systematic decrease in the region’s cultivated area. This land has, at least partially, been redirected to the forest activity.
Geography and Connectivity
64. Currently, Chile is divided into 15 political-administrative regions. The Bío Bío region is situated at the centre of continental Chile, between the parallels 36º and 38º20’ South and at 71º West. It is located between the regions of Maule (to the north) and Araucanía (to the south). On the West, the region is bordered by the Pacific Ocean and, on the east, the Andes Mountains act as a natural frontier with Argentina. The region covers an area of 37,063 km2, corresponding to 5% of the national territory and includes three islands: Quiriquina, Santa María, and Mocha.
65. The landscapes and climates of the Bio Bio Region are varied. The territory stretches across rolling hills and valleys watered by the broad basins of the Itata and Bío Bío rivers and their main tributaries, respectively, the Ñuble and Laja rivers. The region’s main land formations are the coastal plains, which are largest to the south of the Bío Bío River (average width: 25 km); the Coastal Range (Cordillera de la Costa), a complex series of rolling hills separated by a basin in the north and the Nahuelbuta Range in the south; the Intermediate Depression; and the Andes Mountains. The region encompasses several different climates: warm temperate with similar dry and wet seasons, wet temperate and high altitude. Temperature and rainfall vary with latitude and height (http://www.cinver.gob.cl).
66. The region is located in central continental Chile, which is a privileged position. The distance between the regional seat (Concepción) and the country’s capital (Santiago) is 500 km (see Tables A.1.1 and A.1.2) and from the former to Chile’s two most remote cities is 2,570 km in the case of Arica (north) and 2,713 km in the case of Punta Arenas (south). The travel time to Santiago ranges from 2 to 6.5 hours, and the transport cost is between US$30 and US$380, depending on the means of transport (car, bus, train, or airplane).

3
67. The Bío Bío Region is connected to the rest of the country by air, sea, and land. By air, it is inserted in Chile’s international airport network through Carriel Sur airport located near Concepción. However, no direct international flights are made from this airport. Moreover, the region has two secondary airports (Maria Dolores in Los Angeles and Bernardo O’Higgins in Chillán) and four small airfields aimed at connecting the more isolated places of the regional territory: Los Pehuenches in Lebu, Lequecahue in Tirúa, Puerto Sur on Santa María Island, and Isla Mocha on the island of the same name. According to the civil aeronautics authorities of the Bío Bío Region, in 2008, 12% of the passengers and 4% of the cargo transported by air in the country went through the Bío Bío Region’s airports. By sea, the region is connected through four commercial ports (Talcahuano, San Vicente, Lirquén, and Coronel), five docks (Penco, CAP, Abastible, Puchoco, and Jureles), and one terminal (Oxíquim Escuadron) (MOPTT, 2005). The regional port system is the second most important in the country after the Valparaíso-San Antonio complex. In 2007, 27 million tons (25% of the total cargo) were moved through the regional port system and 2,152 ships landed (11% of all nationally landed ships) (INE 2008). By land, the region is connected through roads and railroads. The Public Railroad Company (EFE) offers passenger transport between the cities of Chillan and San Carlos in the Bío Bío Region, and nationally from Chillán to Santiago and other intermediary cities. The region has good connectivity through land roads. The regional road network totals 9,300 kilometres (12% of the national network), of which 22% are paved (similar to the national average of 21%) and 403 km (17% of the national network) are two-way roads. Regarding telecommunications, telephone intensity is less developed in the Bio Bio Region than in the rest of the country. In fact, figures for 2008 show 14.7 telephone lines per hundred inhabitants1. However, Internet access is similar to that in the rest of the country, with 6.4 Internet connections per hundred inhabitants regionally (the national figure is slightly higher) (8.6). In terms of internal regional connectivity and the public transport system, the national passenger record (Under Secretary of Transport) shows 4,635 public transport buses registered in the region, or 13% of all buses registered nationally. Of the regional registered buses, 55% were urban, 42% were inter-urban, and only 3% were rural buses.
68. From the point of view of the region’s connectivity with the rest of the world, there is marked interest in developing bi-national corridors with Argentina through the frontier passes at Pino Hachado and Pehuenche, which would connect the region (and other three regions in Chile) with Bahía Blanca in the Buenos Aires province, La Pampa, Río Negro, Neuquen, and the north of Chubut. This connection would provide an additional impulse to the regional port system through the development of a logistical platform that would transform the region into a platform for importing and exporting goods between the southern cone of Latin America and the countries of the Pacific Asian and the west coast of United States (GOBIERNO REGIONAL, 2008). For this purpose, two Argentinean-Chilean integration committees (Los Pehuenches and Región de Los Lagos) have been meeting regularly and working on different commissions (see the reports of these meetings at www.difrol.cl). Among the different agreements reached, Chilean authorities are considering a pre-investment study in Victoria-Pino Hachado (Route 181) for improvements in Las Raíces tunnel, a private investment of US$140 million to build a two-lane road between Victoria (Araucanía Región) and Tres Pinos (Bío Bío Región), another private investment of US$330 million to build the route Tres Pinos-Coronel, a private investment of US$220 million to build the access into Greater Concepción, a third bridge specialized in cargo transport over the Bío Bío River, and a final private investment of US$220 million to build a two-lane road between Cabrero and Concepción that would be connected to the central highway (Subcomisión de Infraestructura, 2008).
69. Administratively, the Bio Bio Region is subdivided using two different perspectives: the political-administrative divisions and the so-called “planning territories”. From the political-administrative perspective, the region is divided into four provinces (Ñuble, Concepción, Bío Bío, and Arauco) that are, in turn, divided in 54 communes (see Map 1.1). The Concepción 1 This figure does not include mobile telephones.

4
province and its 12 communes are the most populated and cover about one-tenth of the regional area. The regional capital, Concepción, is located in this province. This province also has the second largest area, occupying 36% of the regional territory. Ñuble is the largest province, with 40% of the regional territory, and is subdivided into 21 communes; its capital is the city of Chillán. The Bío Bío province, on the other hand, is subdivided into 14 communes and its seat is located in the city of Los Ángeles. Finally, in the southwest of the regional territory, the province of Arauco and its seven communes cover 15% of the regional area. The capital of this province is the city of Lebu. The greatest distance between two provincial capitals does not exceed 250 km.
Map 1.1 Administrative and Political Divisions of the Bío Bío Region
2009
Source: Authors’ elaboration using Educarchile (www.educarchile.cl).
70. From a more functional perspective, as an element that contributes to the administration and coordination of public efforts, the region is subdivided into planning territories (see Map A.1.1). These are groups of communes or parts of communes that have

5
common institutional and/or economic characteristics. There are 10 planning territories in the region. These are used by regional authorities to design the regional strategy for development (RSD).
Demographic description
71. According to the last population census of 2002, the Bío Bío Region is the second most populated region in the country after the Metropolitan Region. The population of the Bío Bío Region is 1,861,562 inhabitants, or 12% of the country’s population (see Table 1.1). The percentage of the regional population living in rural areas is 18%. Moreover, this is one of the most densely populated regions in the country (50 inhabitants per km2), surpassed only by the Metropolitan and Valparaíso regions.
Table 1.1 Population: Inter-census Growth and Urban and Rural Shares of the Population
Bío Bío Region Year Population Inter-Census Growth (%) Urban (%) Rural (%)1970 1,253,865 15.7 67 33 1982 1,518,888 21.1 76 24 1992 1,734,305 14.2 77 23 2002 1,861,562 7.3 82 18
Source: Authors’ elaboration using census data.
72. Within the region, most of the population lives in the coastal zones of Concepción Province (see Map A.1.2). Half of the regional population (912,889) is concentrated in this province. Moreover, within this province, the communes of Concepción, Hualpén, and Talcahuano concentrate 25% of the regional population. The large conurbation known as Greater Concepción, including the three above-mentioned communes plus those of Penco, San Pedro de la Paz, and Chiguayante, comprehends 36% of the total population living in the Bío Bío Region.
73. Another important concentration of the population is found in the province of Ñuble, the second most populated province in the region, with 24% of the regional population (483,103 inhabitants). Around the central highway (Ruta 5), the communes of Chillán, Chillán Viejo, Bulnes, and San Carlos concentrate 255,000 inhabitants, representing almost 14% of the regional population.
74. The third most populated province is Bío Bío, with 19% of the regional population (353,315 inhabitants). Los Ángeles is one of the big cities in the region. Its population exceeds 150,000 inhabitants.
75. The population in the Bío Bío Region grew over the last inter-census period (1992-2002) by 7% (see Table 1.1). This was lower than the national growth rate (21%) and implied a reduction in the inter-census regional population growth rate. Of the total regional population, 7.8% declare themselves to belong to one of the eight officially recognized ethnic groups, although the great majority of these minorities are Mapuche.
76. In terms of migration, the Bío Bío Region has been the most important net exporter of population to other regions (see Table 1.2). The net migration from the region was 19,000 persons from 1997 to 2002, which is about 1% of the total regional population2. Nevertheless, 2 The Metropolitan Region was the second most important net exporter of population: 12,000 persons left this region in the same period.

6
this flow is still lower than the net emigration in the previous census. The most attractive regions are Valparaíso and Coquimbo (Rodriguez and González, 2006). About half of all regional emigrants moved to the Metropolitan Region. Other frequent destinations are the Valparaíso, Araucanía, Los Lagos, and Antofagasta regions (INE, 2007). Dresdner et al. (2005) suggest that, in the Bío Bío Region, people tend to emigrate when they finish their secondary education and, to a lesser extent, when they finish higher education. Aroca (2004) finds that the main variable explaining emigration among Chilean regions is income differences, whereas migration costs reduce the probability of migration. Moreover, the migratory process from rural to urban areas continued, implying that the proportion of people living in urban areas increased over the last 40 years from 67% in 1962 to 82% in 2002.
Table 1.2 Net Migration Rate (%) (Immigrants – Emigrants) per 1,000 Inhabitants
for Selected Regions
Region 1965-1970 (1970 census)
1977-1982 (1982 census)
1987-1992 (1992 census)
1997-2002 (2002 census)
Bío Bío -4.0 -7.2 -5.1 -2.2 Metropolitana 7.7 6.5 6.5 -0.5 Valparaíso 0.9 0.6 -0.4 3.1 Source: Rodríguez and González (2006).
77. Within the Bio Bio Region, the communes in the Concepción province that receive net immigration are San Pedro de la Paz, Chiguayante, and Coronel (see Table A.1.3). Those attracting less people are Concepción, Talcahuano, and Lota. Within the other provinces, the communes of Chillán Viejo and Los Ángeles exert a strong attraction on the population. Chillan, however, has a net emigration of people.
78. The population pyramid in the Bío Bío Region is symmetrical (see Figure A.1.1). This means that the different age groups are distributed evenly between men and women. In fact, according to the last census, 49% of the population was male and 51% female. Nonetheless, a certain asymmetry can be detected towards the top of the population pyramid, indicating that life expectancy is higher among women than men. When comparing the population pyramids for 1992 and 2002, an important aging process can be seen.
79. In 2002, life expectancy at birth was 73 years for males and almost 80 years for females; these figures are similar in magnitude to the life expectancy of some developed countries and show an increase of just over three years in relation to the same indicators from 1992. On the other hand, the average age at death was 63 years for men and 70 years for women. Regionally, the main causes of death are similar to the national ones, although they differ for men and women. Most men die due to external causes stemming from accidents and poisoning (28%), tumours (17%), and circulatory problems (16%), whereas most women die from tumours (30%) and circulatory diseases (18%).
80. The global fertility rate in the region in 2004 was 1.84 children, slightly less than the national rate of 1.913. These rates were significantly higher – reaching nearly 5 – at the end of the 1960s. These figures differ for women that are economically active in the work force and those that are not. The latter have, on average, more children. Fertility among teenagers does not differ too much at the regional level from the national situation and it has experienced a notable decline from 1997 to 2004 (see Table A.1.4).
3 This rate is calculated as the average number of live children born to a woman by the age of 59 years.

7
81. Educational indicators have improved in the Bío Bío Region between the last two census years. Most remarkable is the enormous improvement in literacy: the percentage of the population that can write and read increased from 49% to 88% between 1992 and 2002.4 When considering only the population over 15 years of age, the increase is even higher. In this group, the literacy rate increased from 47% to 94% in the same period. Moreover, the average years of schooling also increased (see Figure A.1.2). Years of schooling are higher in men than in women, but the differences are minimal. However, when comparing the regional and national schooling situations (see Figure A.1.3), schooling levels can be seen to be lower in the Bío Bío Region than in the rest of the country (on average). This is because the over-40 age groups present lower levels of schooling in the region than do their national counterparts. Nonetheless, this gap is tending to disappear and is not observed for the under-40 age groups. Inter-census progress can also be observed in the case of higher education. The share of the regional population with tertiary education increased from 13% to 21% in this time period. The latter figure is slightly less than the national figure for the same year.
Economic and Social Characteristics
82. Chilean economic activity has grown quickly in the last two decades. The GDP per capita, corrected by Purchasing Power Parity, was 2,827 current international dollars in 1980, according to the International Monetary Fund. This amount was slightly higher than the per capita income of countries such as Korea, Jamaica, Panamá, and Turkey; and lower than the per capita income of some Latin American countries such as Peru, Costa Rica, Uruguay, Brazil, Argentina, Mexico, and Venezuela. This situation changed drastically in 2008. The Chilean per capita income was five times higher, at 14,510 current international dollars; similar to countries such as Argentina, Gabon, Libya, and Mexico, and higher than in the other Latin American countries.
83. The Bío Bío Region is the second most important region in the country in terms of its contribution (9%) to the Gross Domestic Product. Nevertheless, its share of regional production at the national level decreased significantly in recent decades. In fact, from the 1960s to the 1980s, regional participation in the national product was relatively stable (13-14%). This situation started to change in the late 1980s and early 1990s when national production grew faster than regional production. This reduced the regional share in the national product to 9% in the lapse of one decade. Sustained regional and national growth in economic activity has allowed the per capita income to increase steadily from 1990 to 2006. The regional economy grew 60% in this period, increasing the per capita income from US$2,500 to US$4,000 (see Figure 1.1). However, for the reasons stated above, the national per capita income grew more quickly than the regional per capita income. Quiroga (2000) reports that the low flow of private investment in the Bío Bío Region could explain the low regional economic growth. For instance, the Bio Bio Region captures a very low flow of the direct foreign investments that come into the country.
4 Literacy rates are not directly comparable between these periods because the response rate to this question was very low in 1992 (only 21% percent of the population answered the question). This fact might explain why people usually have the impression that the temporal gap in the literacy rate was smaller than reported.

8
Figure 1.1 Per Capita Gross Domestic Product
Bío Bío Region and Country 1990-2006
2751
5259
2562
4097
2000
2500
3000
3500
4000
4500
5000
5500
1990
1991
1992
1993
1994
1995
1996
1997
1998
1999
2000
2001
2002
2003
2004
2005
2006
Year
US$
Country Bío Bío Region
Source: Authors’ elaboration using data from Instituto Nacional de Estadísticas and Banco Central de Chile (BCCH).
Note: Gross Domestic Product in dollars from 2003.
84. Industrial manufacturing constitutes the most important sector of economic activity in the regional economy (see Figure 1.2). Its importance at the regional level doubles that at the national level. This sector, along with that of personal services, represents 48% of the regional product.
85. Agriculture is an important economic activity stretching back to the period of the Spanish conquest, when the main activity was raising wheat. At present, although wheat and other traditional crops continue to be highly important in the regional production, the share of the total area dedicated to these crops has been reduced by, among other things, the development of forestry. According to the 2007 Agricultural Census, 17% of the regional agricultural area, i.e. 300,000 ha, was cultivated. Of this, 209,000 ha were allocated to intensive uses (annual growths, fruit and vineyards, vegetables and flowers, artificial grasslands, and fallow fields). The rest of the agricultural areas were used for grazing land and native and planted forests.

9
Figure 1.2 Share of the Economic Sectors in the Gross Domestic Product
Bío Bío Region 2006
Agriculture, Hunting and Fishing
6%
Manufacturing35%
Electricity, Gas and Water
6%Construction8%
Financial Services 8%
Transportation and Telecommunications
8%
Social and Personal Services
13%
Others17%
Source: Authors’ elaboration using data from Banco Central de Chile (BCCH). Note: “Others” includes Mining, Retail, Restaurants and Hotels, Real Estate, and Public Administration.
86. The favorable geographical conditions of the regional coast have made feasible the existence of a large port infrastructure. This, in turn, has permitted the development of maritime transportation services, encouraging the development of productive activities oriented towards the international markets. The incursion of the Bío Bío Region into the international markets has been one of the aspects that have changed the region’s economic structure, as reflected in the importance of the region’s exports within the national context. At present, the region exports products with a value over US$ 4 billion (FOB), representing 8% of the commercial value that Chile sends abroad. Its regional export development has been closely related to the manufacturing industry that processes forest and fishing resources. In addition, the region is highly important in terms of these activities at the national level. The generation of electric power is another of the nationally important productive activities. This field has been developed heavily over the last few decades due to the exploitation of the hydroelectric potential in the Bío Bío basin. Finally, construction, financial services, and commerce have experienced considerable growth in the last decade of the 20th century due to their extraordinary dynamism, which has permitted the development of global economic activity in the region.
87. The sustained growth of exports has allowed the export of new products every year, the opening of new markets, and the incorporation of more companies into the international markets. For instance, in 2006, 630 firms exported 855 different products to 130 different countries.
88. The three most important markets for regional exports are the U.S.A. (25.3%), China (9%), and Peru (7%). All told, 57% of the exports are sent to North and South America, 25% to Asia, and 14% to Europe.

10
89. Forestry is a considerably important area for the regional economy. Forests cover 1,642,000 ha in the Bio Bio Region. Of these, 53% are plantations and the rest are native woods. The area covered by plantations (856,000 ha) is the largest in any region and represents 37% of all Chile’s planted surfaces. The main species is radiata pine. This species covers 70% of the regional planted surface, whereas eucalyptus plantations (28%) occupy nearly all the rest. Forestry is developed mainly in the provinces of Ñuble, Bío Bío, and Arauco, which share homogeneously 97.5% of the region’s planted surfaces. The development of forest growing activities has been encouraged by favourable weather conditions, the opening to international markets, and subsidies favouring plantations and forest management.
90. The development of forest activity has developed in parallel to that of the forest industry. Presently, the manufacturing industry represents 35% of the regional production and approximately one-third of that production is provided by the industry dedicated to making paper and paper products (including the production of cellulose), the wood industry, and furniture manufacture. An important percentage of forest production is marketed overseas. In fact, 66% of the regional exports correspond to forest exports. The main product is cellulose followed by sawn wood, laths and wood mouldings, newsprint, and others. In recent years, the growth rate of plantations has decreased, due partly to the strong demand for new land that has increased the cost of land. This has led to greater participation of reforested surfaces and decreased deforestation rates. Furthermore, production efforts are being re-directed to more elaborate products. Exports of round logs and the participation of the production of pulp chunks have decreased considerably, whereas the production of sawing logs has grown.
91. Consistent with the national trend, most regional firms are micro firms. That is, 82% of the regional firms sold less than US$100,000 yearly in 2007. More specifically, 15% of the firms were small firms that sold less than US$1 million; 2% were medium firms that sold less than US$4 million, and only 558 were large firms (1% of the firms) that sold more than US$4 million (SII, 2009)5. According to Benavente et al. (2008), the Bío Bío Region has one of the lowest rates of firm creation, surpassed only by the regions of Maule and O’Higgins. Nevertheless, these two regions also have the lowest rates of firm destruction. Thus, although the net rate of firm creation is still greater than zero in the Bío Bío Región, it is slightly lower than the national average.
92. In 2008, the average work force in the Bío Bío Region was 760,000 workers. Of these, slightly more than 91% were employed. The participation rate was 49%. The work force and occupation in the Bío Bío Region constitute one-tenth of the national labour force and occupation. Of the employed workers, 67% are dependent workers and 25% are independent workers, 4% are employers, 4% are service workers, and 2% are unsalaried relatives working in family firms.
93. The share of employment by sector of economic activity differs from the share of production. The major contribution to employment comes from social services (see Figure A1.4). The other main employment sectors, in order of importance, are commerce, industrial manufacturing, agriculture, and fishing. The most important change from 1986 has been the reduced contribution of agricultural and fishing activities (down by 50%) and mining (from 3% to 0.5%) to employment. The other sectors such as construction, commerce, transport, and financial services have increased their shares. These are all non-tradable sectors.
94. The rate of unemployment follows systematically the evolution of the level of economic activity. At the same time, it is systematically higher than the national average (see Figure 1.3). In some periods, a gap of over two percentage points has occurred between the average regional and national unemployment rates. Different hypotheses attempt to explain this 5 There is no information available to divide the firm ownership structure between domestic and foreign-owned companies.

11
behaviour. Bruhn and Inostroza (1997) suggested that the high regional unemployment rate was due to the increased female participation in the labour force since 1986. That is, the regional economy has not been able to absorb the increase in the female labour force. This fact has increased the female unemployment rate in the Bío Bío Region more than in the rest of the country. Dresdner et al. (2005) pointed out that the Asian Crisis in 1998 was a factor that punished the region severely, raising unemployment rates, especially for the young labour force and the workers with low levels of formal education.
Figure 1.3 Unemployment Rate
Bío Bío Region and Country Annual Average 1997-2008
6.1
7.77.0
6.8
12.0
8.78.5
2
4
6
8
10
12
14
1997 1998 1999 2000 2001 2002 2003 2004 2005 2006 2007 2008
Year
%
Country Bío Bío Region
Source: Authors’ elaboration using data from Instituto Nacional de Estadísticas (INE).
95. Like the country, the region has experienced enormous improvement in social conditions over the last two decades. The share of people in conditions of poverty and indigence has been reduced drastically (see Table 1.3)At both national and regional levels, the proportion of families that cannot meet their basic needs with their own income has been cut in half in a period of 12 years (1994-2006), whereas the proportion of indigents, a more serious state of poverty, was reduced to one-third over the course of 14 years (1992-2006). Nonetheless, a national comparison shows that the Bío Bío Region has the highest proportion of poor and indigent families in the country. It seems that the cost to acquire the commodity basket that defines the poverty line is lower in the Bío Bío Region than in other areas of the country. Thus, poverty rates could have been overestimated in the Bío Bío Region in relation to the rest of the country since the poverty line does not consider price differences among different areas of the country (Quiroga, 2008). However, this fact cannot fully explain the regional poverty gap. Quiroga (2008) suggests that the remaining difference could be attributed to differences in household characteristics or differences in remuneration to these household characteristics at the regional level. This could explain one-third of the poverty difference between the Bío Bío

12
Region and the Metropolitan Region (the region with the lowest poverty rate): the Metropolitan Region concentrates households endowed with more favourable characteristics. The most important of these characteristics is the educational attainment of the head of the household and his/her spouse. However, more than two-thirds of the differences could be attributable to differences in the remuneration to these characteristics. i.e., a household with the same characteristics would have a lower probability of having an income under the poverty line if residing in the Metropolitan Region.
Table 1.3 Proportion of the Population that is Poor and Indigent
Bío Bío Region and Country
Year Bío Bío Region Country Poor (%) Indigent (%) Poor (%) Indigent (%)
1992 44.5 15.5 32.8 9.0 1994 39.6 13.2 27.7 7.6 1996 30.4 10.5 23.2 5.7 1998 33.3 10.3 21.6 5.6 2000 27.1 8.0 20.2 5.6 2003 28.0 8.4 18.7 4.7 2006 20.7 5.2 13.7 3.2
Source: Encuesta de Caracterización Socioeconómica Nacional (CASEN) Survey, years indicated in column one.
96. The Bío Bío Region is culturally diverse, as recognized in the Regional Strategy for Development (RSD) 2008-2015 (Gobierno Regional, 2009). The region is home to an important proportion of the country’s native peoples, mostly Mapuche, although some concentrations of Pehuenches and Lafquenches are also found. The majority of these have moved to urban centers and live in conditions of poverty and indigence. They are located mainly in the communes of Cañete, Talcahuano, Concepción, Tirúa, Coronel, and San Pedro de la Paz. Moreover, the Bío Bío Region is home to other non-ethnic identities that are associated with certain socioproductive activities such as coal mining, forestry, artisanal fishing, agriculture, and the textile and steel industries. In spite of this, there is no important recognition or knowledge of this vast historical and cultural heritage and the level of regional identity appears to be low.
Higher Education in the Bío Bío Region
97. Higher education is mostly provided in the main urban centres. The communes of Concepción and Talcahuano concentrate three-quarters of the total regional enrolment in higher education. Chillán and Los Ángeles also have an important supply of higher education programmes and some higher education institutions have branches in communes such as Lota, Cañete, and Lebu (see Map A.1.3).
98. The higher education sector has grown rapidly over the last several decades. The number of enrolled students in the Bío Bío Region increased more than three times from 1983 (21,000) to 2007 (94,000). The share of the Bío Bío Region in total national enrolment remained stable (~12%) in this period. Enrolment by sex slightly favours men: on average, from 1998 to 2007, 53% of all enrolled students were men. But in 2008, the share of men was similar to that of women. Nevertheless, there are differences by kind of institution. The share of women enrolled in professional institutes and universities is higher than that of men, whereas the opposite is true in technical formation centres (CFT). These features are similar to the national trend. However, more women than men graduate from undergraduate studies: 57% of all such graduates were women in 2008. Enrolment in postgraduate studies almost doubled between 1999 and 2007, increasing from 1,500 to almost 2,880 students. Of these, 58% percent of the students enrolled in master’s programmes were men. However, 65% of all the graduates from

13
these programmes were men. This growth rate was slightly less than the national one, so the regional share of postgraduate enrolment decreased from 11.5% to 10.2%.
99. There is no information available about the participation levels of the local population by social group, but according to the regional authorities: “seven out of ten students come from a household in which the parents did not achieve this educational level” (Jaime Tohá, Public Account, Thursday, June 25, 2009).
100. The number of branches of higher education institutions (HEI) also increased rapidly in the region (see Table A.1.5) from 44 branches in 2000 to 70 in 2007. Thus, almost 13% of all HEI seats in the country are located in the Bío Bío Region.
101. Of all enrolled students in HEI in the Bío Bío Region, 68% are enrolled in universities, 21% in professional institutes (IP), and 11% in CFT (see Table A.1.6).
102. Moreover, most of the students enrolled in the regional HEI come from the Bío Bío Region; on average, only 6% come from other regions (see Figure A.1.5). Monthly student expenditure in Concepción is around US$ 450, including dwelling, food and transport. This is one of the most expensive cities (together with Valparaiso) (El Mercurio, Sunday January 4th, 2009). Moreover, the secondary schools of most of these students focused on sciences-humanities and the largest proportion of these students attended municipal (as opposed to private) secondary schools (see Table A.1.7).
103. The academic staff of the HEI is hired full-time, half-time, or part-time. The total academic staffs, measured in equivalent hours, was approximately 3,868 in 2009, 83% of which were employed by universities, 13% by IP, and 5% by CFT. The Universidad de Concepción shows clear leadership (32%) in terms of the total academic demand, followed by the Universidad del Bío Bío (12%), the Universidad Católica de la Santísima Concepción (9%), the Universidad San Sebastian (8%), and the Universidad del Desarrollo (4%). These five universities represent two-thirds of the total demand for academic staff in the regional HEI.
104. There is no measure of the global contribution of HEI to the regional economy, but we know from the regional input-output matrix of 1996 that this contribution cannot be higher than 2.83%, which is the contribution of the entire educational sector to the regional product6.
Governance Structure
105. Chile is a state with a unitary and relatively centralized government. The Chilean President is both “head of state” and “head of government”. The executive branch is composed of 22 ministries. Ministers are appointed directly by the President. Each Ministry is required to lay out a set of goals for each fiscal year; these goals are assessed periodically. Most ministries have regional level offices that are called SEREMI (Secretaría Regional Ministerial). These offices constitute the delegation of the ministries at the regional level. Two cabinet agencies, the Production Development Corporation (CORFO) and Central Bank, are other executive branches. However, they are more autonomous than the ministries and cabinet officers have significant authority over their own agencies. The national government recognizes 15 regions, 53 provinces, and 346 communes or municipalities.
106. The regional governments are legally based on the organic constitutional law No. 19,715 on Regional Governments and Administration from March 1993. The regional government (GORE) is led by the “Intendente” or Steward, who is appointed by the President of the Republic. The Intendente is also the president of the Regional Government’s General
6 A more up-to-date estimation is given in Chapter 2. The estimated HEI income in 2008 was equivalent to 2.6% of the regional GDP.

14
Council (CORE, for short). This council is composed of 22 members elected for four years from the communal council members of the region’s 54 communes. The General Council members are elected by provincial quotas. Presently, the province of Concepción has nine members, Ñuble and Bío Bío have five members each, and Arauco has three members.
107. The Intendente has an advisory staff composed of four divisions: Management Control and Analysis, Administration and Finance, Regional Development and Planning, and Executive Secretary of the Regional Council.
108. The duties of the regional government are:
• To prepare and approve regional development policies, plans, and programmes
• To prepare the regional budget proposition
• To designate resources from the National Fund for Regional Development (FNDR), as well as other sector funding sources
• To carry out actions aimed at productive promotion, territorial ordering, labour training, and technological, social, cultural, and environmental development, among others
• To advise the municipalities, pay attention to emergency or catastrophic situations, and participate in acts of international cooperation
109. The main duties of the Intendente are the following:
• To represent the President of the Republic in actions and contracts within the Intendente’s sphere of competencies
• To develop duties related to maintaining the public order and citizen security
• To coordinate and control the work of the public services
110. As mentioned above, the region is divided into four provinces that are administered by a governor and their communes are administered by municipalities. Each municipality is headed by an Alcalde (mayor) and a Municipal Council, both elected by universal suffrage. Municipalities are responsible for traffic regulation, urban planning and zoning, garbage collection, and primary and secondary municipal education. Local administrators work with state agencies on a host of other issues, ranging from public health to tourism and recreation. These administrators are authorized to create administrative units to oversee each of these activities. Most of the municipal resources come from the Common Municipal Fund, administered by the Ministry of the Interior, which endeavours to favour poorer areas in the distribution of resources for local government. The law on municipalities also calls for the creation of an economic and social council in each municipality. This advisory body is made up of representatives from local organized groups, including neighborhood associations and functional organisations such as parent-teacher associations and mothers’ groups, amongst others. Nevertheless, in general, local governments have a low level of autonomy in policy making vis-à-vis the central authority, “being forbidden to borrow or control tax revenues and remaining dependent on government transfers” (Burton, 2008).
111. The decentralisation efforts instituted by the authorities have created instruments for regional decisions on investments. These instruments include Urban Road Maintenance, Social Dynamic Housing, a National Sports Fund, Programmes of River Defense, a Competitive Community Housing Fund, and Programmes for Frontier Communities, among others. The investment decisions taken on the regional level have increased tremendously. In 1990, only

15
13% of all regional investments were decided locally. In 2000, 43% of all investment decisions were taken at the regional level and, in 2006, this share had increased to 57%. Moreover, the National Fund for Regional Development (FNDR) has increased significantly. Nowadays it is more than just a territorial compensating fund aimed at infrastructure projects; rather it is a more comprehensive regional development fund that finances social, cultural, scientific-technological, and international integration projects. The resources available through the Municipal Common Fund (Fondo Común Municipal) have also increased strongly.

16
CHAPTER 2. CHARACTERISTICS OF THE HIGHER EDUCATION SYSTEM
This chapter reviews the characteristics of the higher education system in Chile and in the Bío Bío Region. First we describe the principal institutions and their role in the national higher education system. Then we provide a short statistical description of the evolution of this system. Finally, we end with an analysis of the higher education system in the Bío Bío Region.
Review of the National Higher Education System
112. The national higher education system (SNES) is composed of three main agents: entities concerned with the functioning of the SNES, higher education institutions (HEI), and the students and their families.
113. First, the institutions that shape the SNES are the following:
Division of Higher Education (DES)
114. This institution depends on the Ministry of Education (MINEDUC) and supervises compliance with the current legislation relevant to higher education. Its competences include proposing the budget assignation to HEI, managing the supervision and accreditation of Technical Formation Centers (CFT) created before 1990, and participating in the process of official recognition of institutions (CSE, 2008).
Higher Council of Education (CSE)
115. This is an autonomous public organism created by the organic constitutional law of education No. 18962. The council is chaired by the Minister of Education and made up of HEI representatives, members of the judicial authority, members of the Superior Council for Sciences and Technological Development, and members of the Armed Forces and Carabineros de Chile (Uniformed Police). The mission of the council is to protect the public faith in the HEI and to promote the qualitative development of the accredited institutions (CSE, 2008). Its functions are the following:
• To guarantee minimum levels of quality in new HEI
• To promote transparency in the higher education system
• To promote the analysis and exchange of information regarding higher education
• To support the development of the HEI
• To assess the curricular framework for primary and secondary school education

17
Council of Rectors from Chilean Universities (CRUCH)7
116. This public-held institution is administered autonomously. It was founded on 14 August 1954 and its mission is to “…coordinate at the national level the academic activity of the 25 member institutions, protecting their quality and academic excellence through the generation of university and public policies by refining lines of under- and postgraduate formation; scientific, humanities, and technological research of excellence; sustained activities with the community and supporting the country’s cultural world; and constant respect for the autonomy and particular nature of each of the member institutions…” (CRUCH, 2008, own translation).
National Commission for Scientific Research and Technology (CONICYT)
117. An autonomous institution created in 1967, this commission is part of the National Innovation System. It is administratively dependent on the Ministry of Education. Presently, the aim of CONICYT is to promote the formation of advanced human capital and to develop and strengthen the country’s scientific and technological base.
National Accreditation Commission (CNA)
118. This institution was created under the wing of law No. 20,129 for the assurance of quality in higher education (CNA, 2008). This law was officially published on 17 November 2006. The duties of the CNA are to declare the accreditation of HEI; supervise the functioning of the accreditation agencies; and perform the accreditation process for undergraduate programmes (through the National Commission of Undergraduate Accreditation, CNAP) and postgraduate programmes (through the Commission for Quality Assessment of Postgraduate Programmes, CONAP) of the autonomous HEI.
Administration Commission of the Credit System for Higher Education (Comisión Ingresa, 2008)
119. This autonomous state organism was created in 2005 by law No. 20,027. It is also called “Comisión Ingresa”. It is in charge of “…designing and implementing public and private financial instruments for higher education studies, oriented towards persons that comply with certain academic and socioeconomic standards…” (Own translation).
120. Second, the SNES is composed of three types of HEI: Technical Formation Centers (CFT), Professional Institutes (IP), and universities8. The universities are usually divided into those that belong to the Council of Rectors from Chilean Universities (CRUCH), also known as the “traditional universities”, and the newer universities that are known as the “private
7 The universities members of CRUCH, by region, are as follows: Universidad de Tarapacá for Arica-Parinacota region. Universidad Arturo Prat for Tarapacá region. Universidad Católica del Norte and Universidad de Antofagasta for Antofagasta region. Universidad de Atacama for Atacama region. Universidad de La Serena for Coquimbo region. Pontificia Universidad Católica de Valparaíso, Universidad Técnica Federico Santa María, Universidad de Valparaíso and Universidad de Playa Ancha de Ciencias de la Educación for Valparaíso region. Universidad de Chile, Pontificia Universidad Católica de Chile, Universidad de Santiago de Chile, Universidad Metropolitana de Ciencias de la Educación, and Universidad Tecnológica Metropolitana for Metropolitan region. Universidad de Talca and Universidad Católica del Maule for Maule region. Universidad de Concepción, Universidad del Bío-Bío and Universidad Católica de la Santísima Concepción for Bio Bio region. Universidad de La Frontera and Universidad Católica de Temuco for Araucanía region. Universidad Austral de Chile for Los Ríos region. Universidad de Los Lagos for Los Lagos region. Universidad de Magallanes for Magallanes region. 8 Additionally, law No. 18,962, article 75, recognizes the formative establishments of the armed forces, the general direction of civil aeronautics, Carabineros (Uniformed Police), and the Policía de Investigaciones de Chile (Civil Police) as higher education institutions.

18
universities”9. The main differences between these type of institutions are the degrees each can confer: CFT can only grant “Higher Level Technician” degrees, IP can give “Professional Degrees”, and the universities can give “Academic Degrees”; all these degrees are officially recognized by the Chilean State10.
121. These institutions can attain autonomy, which gives them the right to award professional titles and academic degrees. To obtain autonomy, the institutions have to approve the following regimes11:
• Examination regime: In this regime, the institution is supervised by another (already accredited) HEI, with respect to the approval of the curricular plans and the graduation mechanisms for their students.
• Accreditation regime: In this stage, the institution is supervised by the CSE in order to assess the quality of education offered and, if the institution fulfills the minimum standards, it may award professional and academic degrees.
122. The HEI have three public sources of finance that complement the funds they receive from their own or private sources12:
• Direct Public Contribution, AFD (MINEDUC, 2008). This subsidy is given exclusively to CRUCH universities. Its distribution among these universities is based largely (95%) on historical standards and, to a lesser degree (5%), on annual efficiency indicators.
• Indirect Public Contribution, AFI (MINEDUC, 2008). This is a competitive subsidy available to all HEI. It is assigned according to the number of new students enrolled in the institution that are among those with the 27,500 best results in the University Selection Test (PSU).
• Institutional Development Fund, FDI (MINEDUC, 2008). This subsidy is granted exclusively to CRUCH universities. It aims to improve the internal designation of resources by strengthening operational, administrative, financial, and academic management.
123. Third, students entering into the SNES must meet the following requirements:
• Completed secondary education, obtained in Chile or abroad, but certified by the MINEDUC
• Fulfillment of any requirement of the HEI they wish to enter
124. Related to the above requirement, the universities belonging to the CRUCH also request that the students take the so-called University Selection Test (PSU). These universities
9 This nomenclature is inaccurate, since the CRUCH universities include some traditional universities that are privately held. However, since the daily use of the concept of “private universities” to refer to those universities that do not belong to the CRUCH is so widespread, we shall maintain these labels. 10 The academic degrees recognized by law and bestowed exclusively by the universities are licenciado, magíster, and doctor. 11 Autonomy covers the academic, economic, and administrative fields. 12 Besides these general sources of finance, the HEI may apply, through competitive projects, to the funds offered by the Programme for Improving Higher Education Quality (MECESUP). This programme is intended to increase the effectiveness of public funding for tertiary education.

19
establish minimum scores based on this test in order for applicants to be accepted to each programme.
125. Moreover, students have several alternative financial sources to personal funding, including the Solidarity Fund for University Credit13 (Fondo Solidario de Crédito Universitario); the State Guarantee Loans, available to students attending autonomous HEI and with institutional certification; and the indirect credit given by CORFO, which is allocated through private banking (CSE, 2009).
126. In addition, the Chilean state gives financial support to students through scholarships. The available scholarships are the following:
• Bicentennial scholarship
• Reparations Programme, aimed at children and families of human rights victims and those politically exonerated
• Juan Gómez Millas scholarship, available to students from low-income families
• Scholarship for children of education professionals
• New millennium scholarship
• Academic excellence scholarship
• Indigenous scholarship
• President of the Republic scholarship
• First Lady scholarship
Evolution of the National Education System
127. The number of HEI has fallen by one-third during the study period (see Figure A.2.1), from 302 institutions in 1990 to only 196 in 2008. The types of institutions that have lost importance, in terms of the number of operating institutions, are CFT and IP (see Table A.2.1 for the 2002-2008 period). Universities have maintained a relatively stable number of institutions on the market over this period, with a remarkably higher number of private universities in comparison to CRUCH universities.
128. Regarding the functional regime of the HEI, many institutions have obtained autonomy (see Table A.2.1). In fact, by 2008, 93.4% of the universities, 70.5% of the IP, and 41.9% of the CFT had attained this status.
129. In terms of financial management, the HEI obtain most resources from tuition fees14, sales of goods and services (i.e. consulting, patents, spin-off), and additional fiscal resources. The availability of fiscal financial resources has grown rapidly from 1990 to 2008. The AFD doubled whereas the FDI grew 6.4 times in this period. The total public contribution to higher
13 This fund is restricted to students attending the CRUCH universities 14 The official data sources only maintain financial records for CRUCH universities. In 2007, these institutions obtained 31.8% of their income from tuition fees, 24.5% from selling goods and services, and 17.2% from fiscal resources. In this period, CRUCH universities obtained 1,278.6 billions pesos from 2008 in income, which represents a GDP share of 1.4%.

20
education in 2008 was about 2.4 times the amount spent in 1990, reaching 330,316 million pesos from 2008 (see Figure A.2.2).
130. In 1990, 60.7% of all AFD resources were concentrated in only five universities of the CRUCH: Universidad de Chile (25.1%), Pontificia Universidad Católica de Chile (13.2%), Universidad de Concepción (9.2%), Universidad de Santiago (7.6%), and Universidad Austral (5.6%). However, in 2008, these universities had 53% of these resources, and the Universidad Austral was displaced in relative importance by the Universidad Católica de Valparaíso. Additionally, the Universidad de Talca increased, in a remarkable way, its share of total resources (from 1.8% in 1990 to 5.6% in 2008). This means a real increase of 511.4% in the total resources received in the sample period.
131. The AFI resources are almost exclusively absorbed by the universities, which concentrated 99% of these resources in 2008; the shares of the IP and CFT were 0.54% and 0.1%, respectively. Within the universities, the CRUCH universities concentrated most of the AFI resources. In 1990, six universities (Universidad de Chile, Pontificia Universidad Católica de Chile, Universidad de Concepción, Universidad de Santiago, Universidad Católica de Valparaíso, and Universidad Técnica Federico Santa María), all members of the CRUCH, concentrated 60.1% of all AFI resources. This share had increased to 79.7% by 2008. Within the private universities, few institutions concentrated the AFI resources. In 1990, Universidad Diego Portales (36.1%), Universidad Central (21.1%), and Universidad Nacional Andrés Bello (13.6%) concentrated almost 71% of all AFI resources obtained by private universities. However, in 2008, the distribution had changed somewhat, due primarily to the incorporation of some new universities. Universidad Adolfo Ibáñez, Universidad de Los Andes, Universidad Nacional Andrés Bello, Universidad del Desarrollo, and Universidad Diego Portales obtained almost 74% of the resources. The AFI resources are also highly concentrated within the IP and CFT. In other words, most resources are obtained by just a few institutions.
132. The HEI offer a wide number of academic programmes. In 2008, the SNES provided 6,679 majors. This number implies that the supply increased 175.5% between 2001 and 2008. The areas that concentrated most of the educational supply were technology (26.7%), commerce and administration (21.5%), education (14.7%), and health (9.5%).
133. The demand for higher education, measured by the number of students enrolled in the HEI, grew 222.7% during the 1990-2008 period (see Figure A.2.3). This figure, when disaggregated by education level, showed a 213.3% increase in undergraduate enrollment, 458.4% in post-professional enrollment, and 1,082.8% in postgraduate enrollment during this period (see Table 2.1). In 2008, the national enrollment in HEI consisted of 768,851 undergraduate students15, 10,782 post-professional students, and 25,348 postgraduate students. This reveals national coverage of 40.3% for the population between 18 and 24 years old, a figure that was scarcely 14.4% in 1990, bearing testimony to a huge increase in access to higher education for this age group.
15 Of the undergraduate students, 66.3% went to universities, 21.2% to IP, and 12.5% to CFT.

21
Table 2.1
Total National Enrollment in Higher Education by Type of Institution
1990-2008
Type of institution 1990 1995 2000 2005 2006 2007 2008 CFT 77,774 72,735 53,184 63,104 69,933 86,847 95,903 IP 40,006 40,980 79,904 114,546 113,134 156,126 162,870 Universities 131,702 231,227 319,089 468,497 478,075 519,557 546,208 CRUCH 112,193 161,850 215,284 252,936 262,151 285,984 295,158 Non traditional 19,509 69,377 103,805 215,561 215,924 233,573 251,050
Total 249,482 344,942 452,177 646,147 661,142 762,530 804,981
Source: Compendio Estadístico Educación Superior, Ministerio de Educación, Chile.
134. In geographic terms, in 2008, the highest shares of national enrollment were concentrated in the Metropolitan (47.7%), Bío Bío (12.8%), and Valparaíso (12.5%) regions. That is, jointly, these regions captured 73% of the total enrollment.16
135. By type of institution, in 2008, the universities had 67.9% of the total enrollment, whereas the IP and CFT had 20.2% and 11.9% of this, respectively. Moreover, the individual universities that concentrated national enrollment in 2008 were Universidad de Chile (5.6%), Universidad Nacional Andrés Bello (5.5%), Universidad de las Américas (4.9%), Universidad de Concepción (4.4%), and Pontificia Universidad Católica de Chile (4.2%). That same year, the enrollment in IP was distributed principally between DUOC-UC (25.3%), IP INACAP (17.8%), and AIEP (11.4%)17. Within the CFT, student enrollment was concentrated in CFT INACAP (30.7%) and CFT Santo Tomás (19.2%).
136. The fields in which enrollment was concentrated suffered drastic changes between 2000 and 2008. In 2008, the four most preferred fields were technology (25.2%), health (15.2%), education (14.5%), and social sciences (13.8%) whereas, in 2001, the preferences were biased towards technology (28.1%), social sciences (15.8%), commerce and administration (15%), and education (11.2) (see Figure A.2.4).
137. By type of institution, the situation by field of knowledge was the following: university enrollment was concentrated in technology (21.8%), education (18%), social sciences (17%), and health (15.8%); IP enrollment in technology (33.1%), commerce and administration (20.2%), art and architecture (11.1%), and social sciences (10.9%); and CFT enrollment in commerce and administration (30.6%), technology (29.8%), health (20.3%), and law (7%).
138. From 1998 to 2007, 542,833 new professionals graduated with the different degrees offered by the SNES (see Figure A.2.5). The trend of new graduates increased throughout this period. From a gender perspective, the fields of knowledge that concentrated a higher proportion of women were education (78.3%), humanities (73.9%), social sciences (63%), and
16 These three regions jointly make up 62.5% of the total population and 63% of the domestic product. 17 DUOC-UC stands for Departamento Universitario Obrero y Campesino (University Department for Peasants and Workers) of Universidad Católica de Chile, which has branches in the regions of Valparaiso, Bio Bio and Metropolitan. And INACAP for Instituto Nacional de Capacitación Profesional (National Institute of Professional Training), which has offices around the country. AIEP is a professional institute dependent from Universidad Nacional Andres Bello with offices in the regions of Antofagasta, Coquimbo, Valparaiso, O’Higgins, Maule, Bio Bio, and Los Lagos.

22
health (62.7%); men were the preponderant graduates in technology (76.5%) and agriculture (60.8%).
139. The National Information System of Higher Education (SIES) estimated the HEI staff responsible for teaching, research, or community programmes to be 58,019 persons in 2008. Of these, 36.9% had a postgraduate degree (master or doctor). The CRUCH universities employed 10,671 of this staff with postgraduate degrees and the private universities 10,581.
140. The secondary school system consists of municipal, private, and public-subsidized private schools. In 2008, 59% of the total undergraduate enrollment by students coming from municipal schools was in CFT and 45% in IP. In universities, 40% of the students came from public-subsidized private schools (see Table A.2.3).
141. Moreover, in the last 20 years, the Chilean education authorities have shown an increasing concern to ensure access to higher education to all young people. In fact, the financial support granted in 2008 reached 227,807.2 M$, 7.6 times greater than in 1990. On the other hand, the number of recipients has also grown since 1990 at an average rate of 8%, reaching 281,310 beneficiaries in 2008 (see Figure A.2.6).
Description of the Higher Education System in the Bío Bío Region
142. The Bío Bío Region was, in 2008, the second region in importance according to its share of the gross domestic product (GDP) and of the population. At the same time, it was home to 14% of all the HEI headquarters in the country, 12.8% of the total national HEI enrollment, and 13.4% of the supply of undergraduate programmes. This region is a center for the elevated generation of human capital in the southern part of the country. The higher education sector developed quickly from 1990 to 2008, as it did in the rest of the country. In fact, the coverage of undergraduate education for 18-24-year-olds was 13.7% in 1990 and 42.3% in 2008, when it surpassed the national coverage by almost four percentage points (see Figure 2.1).
Figure 2.1
Evolution of National and Regional Undergraduate Coverage of the 18-24-Year-Old Age Group
1990-2008
10%
15%
20%
25%
30%
35%
40%
45%
1990 1991 1992 1993 1994 1995 1996 1997 1998 1999 2000 2001 2002 2003 2004 2005 2006 2007 2008
National Coverage Regional Coverage Source: Authors’ elaboration based on information from the Compendio Estadístico Educación
Superior and population projections from Instituto Nacional de Estadísticas

23
143. The history of HEI in the Bío Bío Region dates back to the beginning of the 20th century, when in 1919, the Universidad de Concepción was opened in the city of Concepción, due largely to the efforts of Enrique Molina and Dr. Virginio Gomez, members of the Pro-University Commitee.
144. An important milestone was the creation of the Universidad Técnica del Estado (UTE) in 1947, during the government of President Gabriel González Videla. The UTE opened an office in the city of Concepción in 1952. In 1966, the Universidad de Chile founded a branch in the city of Chillan, which lead to the creation of the Instituto Profesional de Chillán. In 1988, these two institutions merged, giving rise to the Universidad del Bío-Bío. In 1972, a branch of the Universidad Técnica Federico Santa María (whose creation dates back to 1929) was inaugurated in Concepción due to the efforts of the Industrial Corporation for Regional Development of Bío Bío (CIDERE BIOBIO), and with financial support from the Belgian government.
145. Additionally, at the end of the 1980s, the Bío Bío Region witnessed the emergence of private universities, with the opening of the Universidad San Sebastian in 1989 and the Universidad del Desarrollo in 1990, both with headquarters in the city of Concepción. The last CRUCH institution to open its doors was the Universidad Católica de la Santísima Concepcion, created in 1991 under an initiative of the Archbishop of the Holy Conception.
146. Moreover, the Bío Bío Region has long-standing branches of professional institutes such as DUOC-UC and INACAP, created respectively in 1966 and 1973. New professional institutes augmented the regional higher education supply with the 1982 creation of the Instituto de Estudios Bancarios Guillermo Subercaseaux and the 1984 creation of the IPROC GAMMA (resulting from the merger of the Instituto Profesional Concepción, IP Luis Galdames, and IP Gamma). In 1989, the Universidad de Concepcion created the Instituto Profesional Virginio Gomez, which has branches in the cities of Los Ángeles, Chillán, and Concepción.
147. The Bio Bio Region has benefited from the creation of technical formation centers since the 1970s, with initiatives such as CFT Santo Tomás and CFT Diego Portales. However, their existence was only legally recognized by the MINEDUC in the 1980s. For instance, the existence of CFT Diego Portales was legally recognized in 1983 and MINEDUC authorized the creation of CFT CRECIC in 1985.
148. The number of HEI with headquarters in the region diverges from the behavior of the rest of the country (see Figure 2.2). This figure has almost doubled from 2000 to 2008, with an especially high growth rate of IP and private universities.
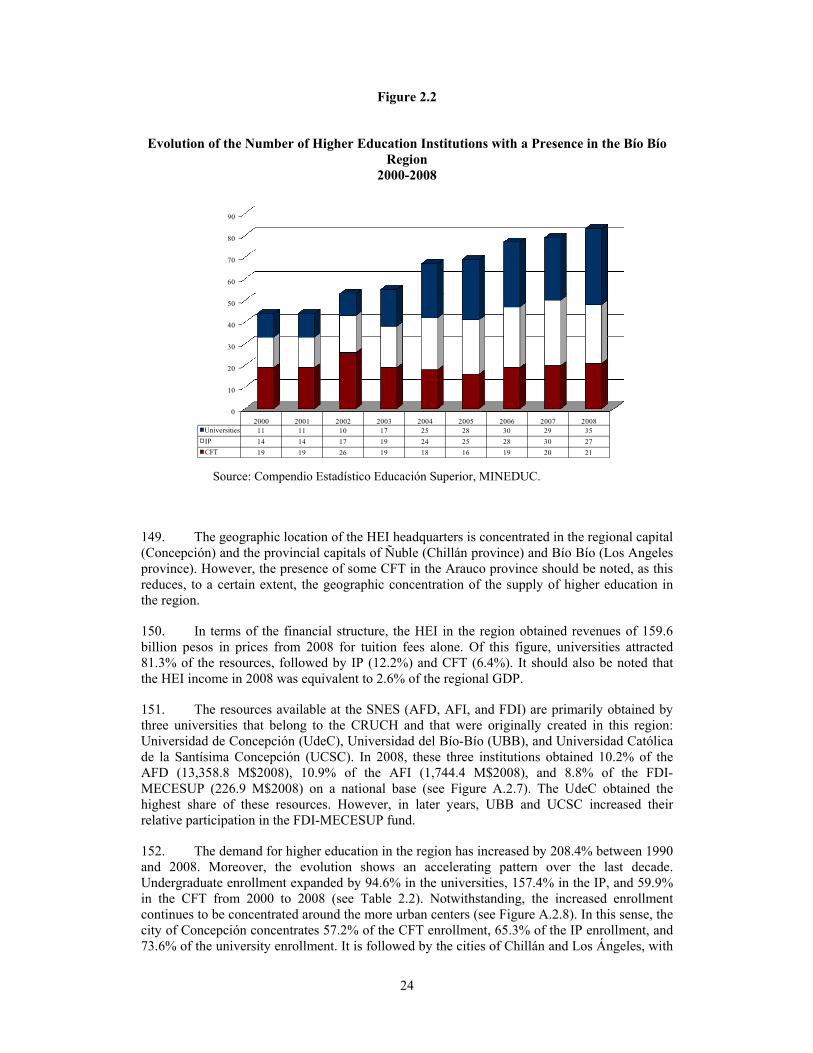
24
Figure 2.2
Evolution of the Number of Higher Education Institutions with a Presence in the Bío Bío
Region 2000-2008
0
10
20
30
40
50
60
70
80
90
2000 2001 2002 2003 2004 2005 2006 2007 2008Universities 11 11 10 17 25 28 30 29 35IP 14 14 17 19 24 25 28 30 27CFT 19 19 26 19 18 16 19 20 21
Source: Compendio Estadístico Educación Superior, MINEDUC.
149. The geographic location of the HEI headquarters is concentrated in the regional capital (Concepción) and the provincial capitals of Ñuble (Chillán province) and Bío Bío (Los Angeles province). However, the presence of some CFT in the Arauco province should be noted, as this reduces, to a certain extent, the geographic concentration of the supply of higher education in the region.
150. In terms of the financial structure, the HEI in the region obtained revenues of 159.6 billion pesos in prices from 2008 for tuition fees alone. Of this figure, universities attracted 81.3% of the resources, followed by IP (12.2%) and CFT (6.4%). It should also be noted that the HEI income in 2008 was equivalent to 2.6% of the regional GDP.
151. The resources available at the SNES (AFD, AFI, and FDI) are primarily obtained by three universities that belong to the CRUCH and that were originally created in this region: Universidad de Concepción (UdeC), Universidad del Bío-Bío (UBB), and Universidad Católica de la Santísima Concepción (UCSC). In 2008, these three institutions obtained 10.2% of the AFD (13,358.8 M$2008), 10.9% of the AFI (1,744.4 M$2008), and 8.8% of the FDI-MECESUP (226.9 M$2008) on a national base (see Figure A.2.7). The UdeC obtained the highest share of these resources. However, in later years, UBB and UCSC increased their relative participation in the FDI-MECESUP fund.
152. The demand for higher education in the region has increased by 208.4% between 1990 and 2008. Moreover, the evolution shows an accelerating pattern over the last decade. Undergraduate enrollment expanded by 94.6% in the universities, 157.4% in the IP, and 59.9% in the CFT from 2000 to 2008 (see Table 2.2). Notwithstanding, the increased enrollment continues to be concentrated around the more urban centers (see Figure A.2.8). In this sense, the city of Concepción concentrates 57.2% of the CFT enrollment, 65.3% of the IP enrollment, and 73.6% of the university enrollment. It is followed by the cities of Chillán and Los Ángeles, with

25
20.5% and 10.5% of the CFT enrollment, 12.5% and 11.2% of the IP enrollment, and 14% and 5.7% of the university enrollment, respectively.
Table 2.2
Enrollment in the Bío Bío Region by Higher Education Institution and Level (Undergraduate, Post-Professional, Postgraduate)
1990-2008 Type of Institution 1990 1995 2000 2005 2006 2007 2008
Undergraduate enrollment 32,264 41,433 49,624 76,029 80,732 93,743 99,512 CFT 6,919 7,450 8,106 10,532 11,065 IP 8,518 15,739 16,499 21,114 21,927 Universities 34,187 52,840 56,127 62,097 66,520 Post-professional and postgraduate enrollment
1,560 1,847 2,524 2,837 3,170
Total Regional Enrollment 51,184 77,876 83,256 96,580 102,682Source: Compendio Estadístico Educación Superior, Ministerio de Educación, Chile. 153. In general terms, the fields of knowledge that concentrate regional undergraduate student enrollment coincide with the national situation. That is, the orientation shifted from 2001 to 2008. In fact, in 2001, the four principal areas were technology (30.4%), commerce and administration (14.6%), social sciences (11.3%), and education (10.7%). In 2008, the preferences had shifted to technology (24.8%), health (20.4%), education (17.9%), and commerce and administration (10.7%).
154. By type of institution, the distribution of enrollment by field of knowledge in 2008 was the following: university enrollment was concentrated in education (21.4%), health (20.9%), technology (19.6%), and social sciences (9.4%); IP enrollment in technology (34.1%), health (17.1%), commerce and administration (14.6%), and education (12.3%); and CFT enrollment in technology (38.1%), health (23.1%), commerce and administration (20.3%), and education (7.3%).
155. The composition of student enrollment in the CRUCH universities with a regional presence18 has deteriorated in terms of the score obtained from the selection test (PSU) (see Figure A.2.9). In effect, the share of incoming students with average scores19 higher than 700 points was 8.6% of the total cohort entering in 1998 (see Figure A.2.9). By 2008, this share had fallen to only 4.4% of the total.
156. The socioeconomic composition of the students that belong to the CRUCH universities has shown that an increasing share of students come from the lowest income quintiles (quintiles 1 and 2). According to the information recovered from the survey applied to higher education institutions in the Bío Bío Region by this consulting team, of the students that entered the system in 2008, 36.5% belonged to the first quintile, 28.1% to the second quintile, 18.2% to the third quintile, 13.1% to the fourth quintile, and 4.1% to the fifth quintile. It should also be noted that, in the CFT, as in IP and universities, over 60% of the students belong to the lowest income quintiles, i.e. 1 and 2 (see Table 2.3). This means that the higher education system in the Bío Bío Region has an important equalizing effect on the educational opportunities for young people from lower income groups.
18 Universidad de Concepción (UdeC), Universidad del Bío Bío (UBB), Universidad Católica de la Santísima Concepción (UCSC), and Universidad Técnica Federico Santa María (UTFSM). 19 This average is calculated based on the scores obtained on the partial tests of mathematics and language.

26
Table 2.3
Social-Economic Composition of the Enrollment in the Bío Bío Region by Income Quintile and according to Type of Higher Education Institution
2008
Type of Institution
Regional Enrollment
Quintile 1
Quintile 2
Quintile 3
Quintile 4
Quintile 5
CFT 11,065 13.8% 58.7% 26.7% 0.9% 0.0%IP 21,927 38.5% 39.1% 15.8% 3.7% 2.9%Universities 66,520 37.2% 25.8% 18.1% 14.5% 4.4%
TOTAL HEI 99,512 36.5% 28.1% 18.2% 13.1% 4.1%
Source: Encuesta Instituciones de Educación Superior Región del Biobío, 2009.
157. A latent concern within the IES is the dropout rate of students from quintiles 1 and 220. In this regard, the HEI in the Bío Bío Region offer a wide range of benefits to vulnerable students, other than those provided by MINEDUC. Indeed, according to the regional HEI survey, the resources offered by the HEI for social support almost quadrupled from 1998 to 2008. In 2008, the regional resources amounted to 4,753.9 million Chilean pesos of 2008, which benefited more than 4,700 students (see Figure A.2.10).
158. Moreover, the HEI students have a strong commitment to the regional community, which is expressed through several instances such as activities in the areas of health, society, recreation, and religion. In fact, every HEI has a Direction of Student Affairs that acts as a link between the students and civil society. It also provides the student association (e.g. Student Federation) with the human and financial resources required for successfully organizing several community activities such as summer volunteer programmes, national social campaigns (e.g. A Roof for Chile, Big Brothers/Big Sisters), nursing home assistance, training for micro-entrepreneurs, promoting nutrition and healthy living in the younger school population, community health programmes (e.g. open dental clinics, clinical internships), religious activities, and so on.
Regional Dimension in the National Higher Education Policy
159. In Chile, the Higher Education Policy is decided at the Ministry of Education, with little coordination between this and several government ministries regarding the definition of long-term guidelines. So, regional HEI interfere little, if at all, in these critical matters.
160. In the Bío Bío Region, several HEI representatives indicate that this characteristic of the SNES has weakened the associative management. Initiatives from CRUCH are limited to just one sector of the Chilean HEI, and discussions about the development of higher education have only taken place within traditional state universities21, resulting in a weaker impact of policies for regional development.
161. Nevertheless, the HEI have played an important role in several instances of development for the Bío Bío Region. Firstly, a 2004 initiative proposed by the Chile Califica
20 The student dropout rate cannot be further analyzed due to the lack of information available at the regional level. 21 The Chilean State universities are the following: Universidad de Tarapacá, Universidad Arturo Prat, Universidad de Antofagasta, Universidad de Atacama, Universidad de La Serena, Universidad de Valparaíso, Universidad de Playa Ancha, Universidad de Santiago de Chile, Universidad de Chile, Universidad Metropolitana de Ciencias de la Educación, Universidad Tecnológica Metropolitana, Universidad de Talca, Universidad del Bío-Bío, Universidad de La Frontera, Universidad de los Lagos, and Universidad de Magallanes.

27
Programme22 reflects the decentralisation of the national education policy. This initiative proposes creating a connective network for labour training involving HEI, business associations, and secondary education institutions. In Chile, there are 37 joint technical training projects, four of which are in the Bío Bío Region: Red de Administración y Comercio, Red de Formación Metalmecánica Región del Bío Bío (pilot scheme), Red de Formación Técnica Forestal Maderera (REDFORMA), and Articulación y Mejoramiento de la Educación Técnico Profesional Agropecuaria y Agroindustrial de la Octava Región. The CFT, IP, and universities with a strong regional presence participated heavily in these initiatives, opening a space for establishing new instances of cooperation and coordination between educational institutions.
162. Secondly, regional HEI have increased their participation in key activities in the last five years, including updating the regional government and defining the regional public policy. In this regard, universities have participated in the following instances23:
• Setting up the Regional Council of Science and Technology (CORECYT Bío Bío), and basic consulting regarding institutional definition;
• Definition of the Agenda for Productive Development, for the Agency of Regional Innovation and Productive Development (ARIDP);
• Formulation of the Strategy for Regional Development 2008-2015, for the Regional Government of Bío Bío (GORE BIO BIO)
163. Moreover, regional HEI have worked in conjunction with the private sector through the creation of several business incubators. These regional incubators are IDEA Incuba (which belongs to UdeC), Centro de Desarrollo de Empresas (CDE-UBB), Incubadora de Negocios Tecnológicos (INETEC-INACAP), and Incubadora de Empresas Agropecuarias y Agroindustriales (which also belongs to UdeC). Finally, regional HEI form part of the organisations that promote entrepreneurship and economic development such as the Industrial Corporation for the Development of Bío Bío region (CIDERE BIOBIO).
164. On the other hand, regional HEI managers surveyed by the Consulting Team highlighted the need to establish a regional bias in the National Higher Education Policy. Indeed, they argued that the current system furthers the initial advantages of some institutions (those with a presence in the Metropolitan Region), amplifying the regional imbalances.
165. Therefore, our focus should be geared towards the strengthening of regional capacities, which implies reducing the role of the central state and increasing that of the local territories, as well as exploiting comparative advantages possessed by the IES with respect to regional peers in order to create a powerful network of institutions within the country, all working towards a knowledge-based economy in constrast to the current one, which is based on the exploitation of raw materials.
166. Ultimately, the Institutional Accreditation process created by the CNA, to which every HEI must adhere, incorporates “community ties”. This area presents an interesting challenge for HEI seeking to give a regional dimension to their policies. In fact, in order to achieve accreditation, the HEI have to generate a permanent, stable, cooperative attachment that has a real impact on society. So, the challenge in the medium- and long-term is to articulate all the
22 The Chilecalifica Programme is an initiative created in 2002 by the Chilean Government, in which the Ministries of Economy, Education, and labour and Social Welfare are working together. The aim of the programme is to establish a continuous learning system in which Chilean workers are able to improve their skills. 23 The Universidad del Bío-Bío, through the Center of Urban Regional Studies (CEUR), the Universidad Católica de la Santísima Concepción, and the Universidad de Concepción have played an active role in all these initiatives.

28
HEI stakeholders to work towards a strategy committed to the development of the Bío Bío Region.

29
CHAPTER 3. CONTRIBUTION OF RESEARCH TO REGIONAL INNOVATION
This chapter reviews the contribution of the higher education institutions (HEI) in the Bío Bío Region to regional innovation. First, the national framework to promote research and innovation is described. This involves a short description of Chilean performance from an international perspective, a presentation of the efforts made by the authorities to develop policies and instruments to promote innovation, and a discussion as to whether a regional innovation policy exists. Second, we analyze the innovation policy for the Bío Bío Region, the main regional actors, and the extent to which they obtained results reflect regional priorities. Third, we describe the interactions between the regional HEI and the public and private sectors, reviewing the capabilities for cooperation and coordination shown by these actors in terms of the results of R&D. Fourth, an attempt are made to assess the innovative environment in the Bío Bío Region. Finally, two annexes present the survey that supports some of the results; and an analysis of strengths, weaknesses, opportunities, and threats of the Bio Bio Region’s Innovation System completes this chapter.
Framework conditions for promoting research and innovation
Chilean innovation performance
167. Nationwide, innovation is generally agreed to play a central role in economic growth. This was reflected in the first report of the National Council for Innovation and Competitiveness (Consejo Nacional para la Innovación y la Competitividad) in 2006, which laid the foundations for a national innovation strategy for competitiveness and in the 2006 and 2007 versions of the “White Book” (Libro Blanco) of this council, entitled “Towards a National Innovation Strategy for Competitiveness” (Hacia una Estrategia Nacional de Innovación para la Competitividad). Moreover, this strategy recognizes the central role that the higher education institutions (HEI) have had in the past and should have in the future in the country’s processes of innovation and economic and social development. Furthermore, this strategy also points out that the HEI are important for regional development and that public policies in this matter should have a regional dimension that increases the contribution of HEI to the different territories.
168. The Chilean authorities have shown special concern in recent years for increasing innovation. One reason for this concern has been the low growth rate shown by the country in the last decade, as compared with the previous decade. From 1987 to 1997, the Chilean economy grew an annual average of 8.4% whereas, between 1998 and 2008, this growth rate was barely 2.8%24. One factor that explained this reduction in the growth rate was the smaller growth of the total factor productivity (TFP). From 1987 to 1997, the TFP grew on average 4.8% and explained 57% of the total GDP growth; from 1998 to 2005, it only grew an average of 1.1% and explained 39% of the total GDP growth (see Table 3.1).
24 Figures are based on Chilean Central Bank data.

30
Table 3.1 GDP Growth and TFP Contribution in Chile. Different Periods Year GDP (a) Growth (%) TFP (b) Contribution (%)
1974-1986 2.3 -0.4 1987-1997 8.4 4.8 1998-2008 2.8 1.1 2002-2008 4.1 2.0 (c)
Source: (a) Banco Central de Chile, (b) Fuentes, Larraín and Scmidth-Hebbel (2006), (c) 2002-2005.
Note: GDP (Gross Domestic Product), TFP (Total Factor Productivity ) 169. Several studies have shown a positive relationship between innovation and TFP. A recent study by Bravo and García (2008) shows a strong association of R&D per capita with TFP, with an elasticity of 0.2 for low and medium income countries. Another study (Benavente, 2005) shows a statistically positive relationship between R&D and productivity at the firm level for the Chilean case.
170. Chile has shown lower innovation rates than developed countries. Moreover, even when compared with countries with similar GDP levels, the innovation rate is low. In 2004, the last year for which information is available, the rate of gross R&D expenditure to the GDP was 0.67. This is less than one-third of the average of the OECD countries (2.13 in 2007). Other countries with small populations, a GDP comparable to Chile, and that have attained high economic development show a much higher R&D rate than Chile. This is the case of Ireland (1.29), Denmark (2.55), and Finland (3.44). Nonetheless, the Chilean figures are within the values expected given its income per capita level (see Figures A.3.1 and A.3.2).
171. Whereas in most OECD countries R&D funding is predominantly private, in Chile it is biased towards public funding. In Chile, private funding is 45.7% of total funding. In OECD countries this figure, on average, is 64%. In countries with high innovation rates, such as Japan and Finland, private funding is approximately 70% of the total funding.
172. The private expenditure in R&D represents less than 50% of the total expenditure in R&D and its share has been falling recently. In 2003 and 2004, private expenditure in R&D was around 0.3% of the GDP, yet its share in 2005 and 2006 was only 0.27% of the GDP according to the information from the 2005-2006 innovation survey (see Table A.3.1).
173. The number of researchers that participate in R&D in Chile is low compared with other countries with higher R&D levels: in Chile there is about one researcher for each thousand inhabitants, whereas OECD countries have an average of three researchers per thousand inhabitants (see Table A.3.2). In countries like Sweden, Finland, and Japan, this figure climbs to values between 5 and 7. Notwithstanding, the level of researchers per GDP in Chile seems to correspond to the expected level (see Figure 3.1).
31
Figure 3.1 Relationship Between Gross Domestic Product and Number of Researchers
in Several Countries 2008
0.0
0.5
1.0
1.5
2.0
2.5
3.0
3.5
4.0
0.0 0.1 0.2 0.3 0.4 0.5 0.6 0.7 0.8Researchers per capita (%)
Sweden
Chile
Iceland
Ireland
GDP per capita (%)
y = 5.0733xR2 = 0.6682
Source: Table 3.3 in Annex 3.
Note: GDP (Gross Domestic Product).
174. Research and development is distributed between firms (45%), HEI (32%), and the public sector (10%) (see Table A.3.3). When compared with (average) countries in the OECD, private firms in Chile have less weight and HEI nearly double the importance of average OECD countries. This reflects the importance of HEI in Chile for R&D. For other Latin American countries, the importance of universities in R&D expenditure is even greater (see Table A.3.4).
175. Often patents are used as an indicator for how research and entrepreneurship can be converted into innovations. Chile has a low patenting rate. An international comparison shows that the rate of Chilean patents registered in the USA, Europe, and Japan is 0.2 per million inhabitants. This rate is substantially lower than the average for OECD countries, which is 43 per million inhabitants (see Table A.3.5). Moreover, of all patents registered in Chile in 2007, only 11% were registered by nationals (Table A.3.5) and all the rest by foreigners. Finally, only 6% of all patents requested were finally granted (see Table A.3.6); of these, universities received a scant 6.3% (see Table A.3.7).
176. In Chile, the research developed by HEI is heavily concentrated in a few institutions. These institutions dominate the principal research indicators, such as publications, research projects, Ph.D. programmes, and number of full-time researchers with Ph.D. degrees (see Table A.3.8). The Universidad de Chile is leading in these indicators, followed by the Pontificia Universidad Católica de Chile and the Universidad de Concepción. Of the six most important universities in this respect, three are located in the Metropolitan Region (Santiago), one in the Valparaíso Region, one in the Bío Bío Region, and one in the Los Ríos Region.

32
177. The number of Ph.D. programmes, as well as the number of students enrolled in these programmes, has grown rapidly in past years. The number of programmes increased from 15 in 1993 to 155 in 2008 (OECD 2008 and Indices 2009) and student enrolment increased from 238 to 3,337 in these same years (OECD 2008 and Consejo Superior de Educación). However, the number of graduates is low. Only 259 students have graduated from these programmes (Indices 2009). This represents 8% of enrolled students and only 16 graduates per million inhabitants. This last figure is much lower than the one for Finland, which has about 300 graduates per million inhabitants.
178. The quality of science in Chile is good. The number of ISI publications has grown rapidly in recent years, tripling between 1990 and 2008 (see Figure 3.2). The citation impact of Chilean publications is higher than the Latin American average, although it is still under the average for OECD countries. In some applied areas, such as Agriculture and Engineering, there is a lag both in number of publications as well as citation impact (see Table A.3.9). One of the reasons for this result is the low number of researchers to be found in HEI, as compared with international standards.
Figure 3.2 Number of Scientific Publications (ISI) in Chile
1988-2008
0500
1,0001,5002,0002,5003,0003,5004,0004,5005,000
1988 1990 1992 1994 1996 1998 2000 2002 2004 2006 2008
No. of Paper
Year
Source: ISI Web of Knowledge, Thomson Reuters.
179. In summary, Chile has low numbers in R&D and the authorities believe that there is a need to improve them rapidly for attaining long-term higher GDP growth rates. This requires increased engagement by the private sector, both in financing and implementing R&D, to increase the number of researchers and graduate students. The role played by the HEI has been important, but research and graduate programmes must have a higher impact on innovation.

33
National policies for innovation
180. The Chilean R&D system has historically been based largely in the universities and the technological institutes created within the public sector. Until the beginning of the 1980s, innovation in Chile was mainly done through the National Commission for Innovation, Science and Technology (CONICYT) and these technological institutes. CONICYT financed research (through the FONDECYT programme) and postgraduates scholarships, whereas the technological institutes were compelled to compete for financing. This basic system changed in 1990 with the introduction of some new programmes such as FONDEF and FONTEC, the former created by CONICYT and the latter by CORFO (an agency of the Ministry of Economy). These programmes aimed to promote innovation. Moreover, the first programme for Science and Technology was created (PCT). These programmes constituted the first experiences for the building of a System for National Innovation. In the middle of the 1990s, new programmes were created that augmented the impact and articulation with firms and programmes to form researchers25. Nonetheless, an important change in innovation policies would not take place until the beginning of the decade of 2000.
181. A new policy for Science, Technology and Innovation was initiated in this decade. In 2000, the Ministry of Economy launched the Programme for Development and Technological Innovation (PDIT). Later, CONICYT created the Bicentenary Programme for Science and Technology (PBCT). In 2005, the Committee Innova Chile, which seeks to contribute to competitiveness in the economy through innovation and the development of entrepreneurship, was created by CORFO through the fusion of two funds: FONTEC (Technological Fund) and FDI (Fund for Innovation Development). Additionally, three important initiatives began in 2005: the creation of the National Council for Competitiveness, an ambitious plan for postgraduate scholarships that increased these from about 280 (in 2005) to more than 1100 (CONICYT, 2009), and the creation of the Fund for Innovation for Competitiveness (FIC), generated from the income from a mining royalty. As a result of all these initiatives, the public resources allocated to R&D increased from US$ 75 million in 2005 to US$ 162 million in 2007. Additionally, the Ministry of Economy increased its expenditures from US$ 91 million in 2007 to US$ 170 million in 2008 (CNIC, 2008).
182. The present National System for Innovation divides innovation tasks into two large areas: Science, Technology, and Human Capital, which lie under the Ministry of Education, through CONICYT; and Entrepreneurship and Firm Innovation, which depends on the Ministry of Economy, through CORFO. Two high-level institutions coordinate and define innovation policies: the National Innovation Council for Competitiveness (CNIC) and the Ministerial Commission for Innovation (CMI) (see Diagram A.3.1). Presently, other institutions such as MIDEPLAN, the Ministry of Agriculture, and the Ministry of Health have specific competences in Research and Development. This situation generates some duplication of efforts and complicates coordination.
183. There are a wide number of institutions that finance R&D and a large number of programmes that support it, among these, Innova Chile, Innova Bío Bío, FONDECYT, FONDEF, FONDAP, Consortia, Regional Centers, Millenium Institutes, Base Centers (Centros Basales), the Bicentenary programme, MECESUP, etc. (see Table A.3.10 and Diagram A.3.1). These programmes support research, innovation, technological transfer, dissemination of results, entrepreneurship, and funding to universities, excellence centers, technological institutes, and public and private firms.
25 These initiatives include the Fund for Innovation Development (FDI) and the Fund for Public Interest (FONSIP) in CORFO. Other funds are the Fund for Agrarian Innovation (FIA), the Fund for Mining Research (FIM), and the Fund for Fishery Research (FIP). Moreover, CONYCYT created the Excellency Funds (FONDAP) and the Ministry of Coordination and Planning (MIDEPLAN) the Millenium initiatives.

34
184. The National Council for Competitiveness is an institution that determines priorities, coordinates actions, and develops studies useful for the design of medium and long-term policies. This council generated the “White Book” for innovation, in which the strategy for innovation for competitiveness is defined and proposed to the government. The first part of this book was published in 2006 and the second part in 2008.
185. The national innovation policy has been based on a setting in which different actors compete for funding and are evaluated by peers. In spite of this, government agencies have made some efforts to prioritize specific areas of research and innovation efforts. In recent years, some of these areas were aquaculture, astronomy, agriculture, mining, information and communication technologies (ICT), and others. Lately, some efforts have been directed at the development of industrial clusters and the definition of priorities in order to focus better public funding.
Regional policies for innovation
186. The national innovation policy described above does not have an explicit regional dimension. More accurately, the policy was designed to be spatially neutral. Nonetheless, the selection of priorities and thematic areas has generated – indirectly – support for certain regions. For instance, an important part of the resources directed towards aquaculture have concentrated on the two regions (Coquimbo and Los Lagos) where aquaculture activity is important. A similar situation occurred in Antofagasta, where regional mining activities have received important financial resources.
187. Moreover, since 2001, CONICYT has explicitly supported the creation of regional centres to promote local research in areas of regional relevance. Up to now, 12 regional research centres have been created, one in each region, and CONICYT continues to promote the creation of new centres, provided that the research staffs needed to run such centres is available.
188. In the last few years, the innovation policy has been indirectly favouring regions other than the Metropolitan Region. First, the National Fund for Regional Development (FNDR) has allowed the policy to finance regional projects in science and technology. Second, it supports the development of industrial clusters. Third, it has provided the Innovation Fund for Competitiveness (FIC).
189. Two parallel areas have been developed in terms of cluster development. On one hand, the Innovation Council proposed a list of national clusters that should be given priority. The vast majority of these clusters are located in regions other than the Metropolitan Region. On the other hand, in 2006, the Regional Agencies for Productive Development (ARDP) were created. One of the first tasks performed by these agencies was to identify and support clusters at the local level. Support for innovation plays a central role within the development of the clusters. Therefore, part of the funding must be directed to these areas, and to the regions and locations in which these clusters exist or have influence. This means that the public policy will have a spatial dimension in the coming years.
190. Likewise, as of 2007, the Innovation Fund for Competitiveness (FIC) has been funding research and innovation. This fund uses royalties collected from copper extraction; in 2007, this amounted to US$150 million, which was about 50% of all public funds for R&D. According to the law that determines the use of these funds, 25% is to be decided by regional governments.

35
Responding to regional needs in the Bío Bío Region
The regional innovation policy in the Bío Bío Region
191. The regional government of the Bío Bío Region has, for several years, been emphasizing innovation as an engine for regional growth. This has been expressed in the Regional Strategy for Development (RSD) for the periods 2000-2006 and 2008-2015. The last of these documents identifies science, technology, and innovation for a dynamic and competitive economy as a “strategic line” for regional development.
192. This concern for competitiveness was materialized in 2001 with the creation of the programme Innova Bío Bío, as a part of an agreement between the regional government and CORFO. Both institutions assigned resources, in equal shares, to support actions that increased competitiveness in the Bío Bío region. This programme aimed to promote, with non-refundable resources, the implementation of relevant innovation and technological projects for regional productive development. The initial three-year budget was around US$ 10 million. This initiative was, at the time, unique in Chile and served as a model for what later would be known as Innova Chile. The agreement has been renewed continuously. From its beginning until 2009, Innova Bío Bío has spent approximately US$ 43 million and has funded nearly 700 projects (see Box 3.1). In 2008, a new agreement was signed for the period 2008-2011 for approximately US$ 30 million.
Box 3.1: Innova Bío Bío
Innova Bío Bío was created in 2001 as a part of an agreement between the Government of the Bío-Bío Region, the Ministry of Economy, and the Corporation for the Promotion of Production (CORFO). Its objective is to promote innovation, transfer, and technology capabilities in the Bío-Bío Region. Its mission is to contribute to regional competitiveness and to the creation of sustainable sources of employment through strengthening innovation and regional development. This is the first fund for regional decisions on matters of regional innovation created in the country. Since the beginning of its operation to date, Innova Bío Bío has allocated a total of 23,867,637,000 pesos (around 42 million dollars) to a total of 698 projects, funding 53% of the total project costs. Innova Bío Bío has funded firms that produce goods and services, technological institutes, foundations, and universities located in the Bío-Bío Region. To date, it has benefited around 1,500 institutions and firms. Of the total projects allocated, 30% belong to the agricultural sector, 17% to the forestry sector, 18% to industrial manufacturing, 25% to the service sector, 6% to the fisheries and aquaculture sector, 3% to electronic and computer sector, and 3% to the health sector.
193. In May 2004, a new step was taken to promote science and technology at the regional level: Chile’s first Regional Council for Science and Technology (CORECYT) was founded. This private-public institution was created with the purpose of designing and proposing regional strategies and policies to promote scientific and technological research, maintaining close ties with the regional private and public sectors. CORECYT is a forum for coordination, promotion, articulation, and dissemination, among the interested actors, of scientific and technological developments. It aims to contribute to the generation and development of capabilities in this matter and to support the creation of knowledge networks.
Main science and technology actors in the Bío Bío Region
194. The Bío Bío Region is one of the leading regions in science, technology, and innovation efforts. It is only surpassed by the Metropolitan Region (Santiago). Table 3.2 shows some indicators of performance. With regards to enrolment and number of doctoral

36
programmes, FONDECYT (research) projects, and ISI publications, it stands as the second region in importance, after the Metropolitan Region. In innovation funds (FONDEF and Innova), it stands third in the regional ranking. When one looks at innovation spending by firm, it is possible to observe that the Bío Bío Region, on average, spends $350,000 Chilean pesos per year per firm (approximately US$ 600). In this case, the region falls to fifth place in the regional ranking.

37
Table 3.2 Main Indicators of Science, Technology and Innovation
by Regions in Chile, Several Years
Región
Science and Technology 2007 (1) Innovation
Ph.D Students
Ph.D Programs (Numbers)
Research Projects
FONDECYT
ISI Publications
Research Projects FONDEF
Research Funds Innovation*
Innovation/No. of Firms (Average. 2005-2007)
Thousand**
Tarapacá 0.0% 1.3% 1.0% 0.9% 7.8% 2.5% 23.9 Antofagasta 1.1% 4.7% 2.9% 3.6% 10.8% 2.4% 25.6 Atacama 0.0% 0.0% 0.0% 0.0% 0.0% 3.2% 63.2 Coquimbo 1.2% 2.7% 0.6% 0.7% 2.6% 5.0% 40.7 Valparaíso 7.1% 10.7% 7.9% 7.2% 8.7% 8.5% 25.2 O`Higgins 0.0% 0.0% 0.0% 0.0% 0.0% 2.3% 13.7 Maule 0.0% 1.3% 1.4% 2.1% 0.9% 3.3% 14.6 Bío Bío 14.8% 12.1% 11.3% 15.5% 14.1% 11.9% 35.2 Araucanía 2.8% 2.7% 2.8% 1.6% 5.6% 2.9% 17.9 Los Lagos 5.1% 4.7% 6.8% 6.0% 19.8% 12.7% 56.9 Aisén 0.0% 0.0% 0.0% 0.0% 0.0% 1.1% 49.5 Magallanes 0.0% 0.0% 0.4% 0.6% 0.7% 1.1% 29.7 Metropolitana 67.8% 59.7% 64.8% 61.7% 29.0% 47.2% 34.7 TOTAL 100.0% 100.0% 100.0% 100.0% 100.0% 100.0% 30.8 Source: (1) Consejo Superior de Educación (CSE), 2009. * Including funds from Innova Chile and Innova Bío Bío, average of period 2005-2007. ** Research funds for innovation over number of firms.

38
195. An indicator of innovation performance is the number of patents. In 2007, 21 patents were requested through the Department of Intellectual Property (DPI). This corresponded to 7.2% of all patents requested by nationals. In the same manner, if the number of patents requested in the USA is analyzed, only 3% of the petitioners had residence in the Bío Bio Region (Kawax, 2008).
196. Three universities in the Bío Bío Region regularly develop science and technology and are present in the ISI publication indicators, research (FONDECYT) projects, and patents. These are the Universidad de Concepción, the Universidad del Bío Bío, and the Universidad Católica de la Santísima Concepción. Nonetheless, the Universidad de Concepción concentrates about 90% of all such activity.
197. Table A.3.11 depicts the importance of regional universities in national ISI publications. As can be observed, only the Universidad de Concepción stands out in a national comparison and ranks in third place among all HEI in the country, with about 11% of all publications. Nonetheless, regionally, it concentrates 92% of all ISI publications, followed by the Universidad del Bío Bío and the Universidad Católica de la Santísima Concepción. Moreover, the Universidad de Concepción leads university patenting in Chile. It concentrates 27% of all patents granted to universities from 1995 to 2007. At the regional level, this university concentrates 91% of all patents, followed distantly by the Universidad Católica de la Santísima Concepción and the Universidad del Bío Bío, both with 4.7% of regional patents (see Table A.3.12). Another indicator is the publications citation index. Table A.3.13 shows that, on average, Chilean publications were cited 9.2 times between 1988 and 2008. The average for regional papers (7.2 citations) is not too far from that. So, we conclude that there is no great difference in the citation index between regional and national publications.
198. The indicators show that the Universidad de Concepción competes at a similar level with the country’s largest universities. It has high publication marks and even better marks in patenting. This is reflected in the number of programmes and centres that this university has created in recent times26. In Table A.3.14, we list the centres associated with regional HEI. Of the 24 existing centres, nine belong to the Universidad de Concepción. Among the mentioned centres in the table, stand out some of them such as CIPA, EULA, UDT, COPAS, CATEM, Biotechnology centre, CREA, CEUR, which have done a significant contribution to research in the Region in the last years. Others are younger and are just beginning to show results.
199. Other regional public research institutions that are not associated with HEI are the technological institutes. The INIA performs applied research and technological transfer in agriculture and INFOR does technological transfer in the forestry sector, mainly for medium and small-sized firms. There are also two private research centers: INPESCA, associated with the fishing industry, and BIOFOREST, associated with the main forestry company in Chile, Arauco. This last center is also one of the main private research center in the country with a network of 39 associated researchers around the world working in issues related to forestry biotechnology.
Responding to regional priorities
200. In general, there are no specific, explicit policies within the regional HEI to induce researchers to consider regional priorities in their work. In the institutional strategic plans, the importance of national and regional development is mentioned, but a specific reference to the special importance of the regional dimension is lacking. This also is reflected in the systems of academic evaluation for researchers used by the regional HEI; the traditional performance
26 Most of these centers are less than five years old and they are just beginning to show results, so it is not possible to evaluate them yet.

39
indicators are the number of indexed publications (ISI and SCIELO), the number of FONDECYT or FONDEF projects, patents, etc. But no special consideration is given for research in regionally relevant areas.
201. Despite this, an analysis of the research results shows that the huge majority is related to themes of regional relevance. An analysis published by CEUR (2003) about the assignment of research resources from 1991 to 2000 through competitive funds such as FONDECYT, FONDEF, FONTEC, FIA, and FDI indicated that the sector distribution of R&D efforts was directed mainly at forestry (38%), fishery and aquaculture (28%), and agriculture and horticulture (25%), all relevant regional sectors.
202. By the same token, the orientation of the consortia (see Table A.3.15) and regional research centres (see Table A.3.14) is mainly directed at areas of regional relevance. This is the case of the consortia for the plastic industry (CIPA), environment (EULA and Regional Centre for Environmental Studies), oceanography (COPAS), aquaculture (Aquaculture Technological Consortium), biotechnology (Biotechnology centre), forestry (Wood Technology Centre, Biotechnology Centre, Forestry Genomics Consortium), harbour (Maritime-Port Research Centre), agriculture (Centre for Wine Grapes and Wine), and energy (Centre for Energy Innovation).
203. The publishing areas for regional researchers also reveals research priorities. In Table A.3.16, it can be seen that the areas in which regional researchers have the highest participation in the total national publications are oceanography (43.4%) and marine ecology (20.3%), polymers (38.4%), chemistry (30.6%), chemical engineering (30.1%), and environment (26.7%). Moreover, regional forestry publications represent 30% of all national publications. Thus, to a large extent, academic publications are directed at areas of great regional relevance from a productive point of view.
204. In spite of the fact that regional priorities are reflected in the research results, an explicit policy that stimulates researchers to solve local problems does not exist. The main part of the national and regional funds, where researchers seek resources, are evaluated by peers that are neutral to spatial considerations. There might be a sector priority, but not a regional one. Therefore, if it is a priority to direct innovation efforts to regional or local problems, it seems necessary to introduce regional considerations for resource use. Presently, the FIC resources allow for this type of consideration, but the proper institutional setting seems to be lacking to assign resources with a medium and long-term regional view. In addition, in the last years, Innova Bío Bío and CORECYT have been establishing some regional priorities in the funding of projects.
205. In order to have a close perception of the main actors of Regional Science and Technology, a survey was applied to 45 researchers from regional universities and to 34 actors from private firms and public institutions. The results are presented in Appendix 2. The first six questions of the survey applied to researchers are related to the relationship between the research performed by HEI and the regional needs. In general, the investigators agree that the regional HEI assign priority to the research oriented to regional issues. However, they believe that their institutions lack formal procedures that direct this research towards regional issues. Despite this, they agree that informal processes exist and, as a consequence, the HEI often do research activities oriented to regional issues. The survey respondents from firms and public institutions did not agree with respect to whether the HEI prioritize regional research and how often they perform research activities oriented to regional issues. However, all respondents believed that HEI should assign priority to issues of regional relevance.

40
Collaboration links between institutions and researchers
206. The collaboration between different regional actors for innovation purposes is a very important subject to analyze. At the research level, collaboration can be measured by an indicator of the number of researchers from different institutions that participate jointly in ISI publications. Table A.3.17 presents such an indicator. For instance, the Pontificia Universidad Católica de Chile has an index of 1.71, which means that, on average, 1.71 researchers from other institutions participated in each publication. We can observe that the Universidad de Concepción has a high level of collaboration at the aggregated level, even higher than the Universidad de Chile. We also present the regional collaboration index. This index is an indicator of cooperation with other researchers from the Bío Bío Region. In this case, we can see that the collaboration of the researchers from the Universidad de Concepción with researchers from institutions in the same region is very low. In contrast, the regional participation index for the Universidad Católica de la Santísima Concepción is higher, despite the generally lower collaboration index. In summary, this finding shows that a researcher from the Bío Bío Region develops more frequent collaboration efforts in research with institutions outside the region than with other institutions within the same region.
207. An important step, aiming to increase collaboration, has been the creation of Base Centers (Centros Basales), Excellence Centers (Centros de Excelencia), and Consortia. These institutions require minimum numbers of researchers, thereby promoting agreements with other research centres, universities, and firms to form the required research teams. A notable case has been the creation of consortia in which several HEI must collaborate with productive firms to generate research that leads to innovative results with spin-offs in the productive sphere. One of the most important consortiums in the Bío Bío Region is Genómica Forestal, in which the Universidad de Concepción, Fundación Chile, Forestal Arauco S.A., Forestal Mininco S.A., and the Universidad Austral de Chile participate.
208. Large-sized firms have usually been important university partners for these projects or consortia. But such collaboration has been much lower in the case of medium and small-sized firms, which have less contact with universities and fewer resources to invest in research. No explicit regional policy promotes collaboration with medium and small-sized firms. Nevertheless, this collaboration exists in some cases, such as the Wood High Technological Centre of the Universidad del Bío Bío (See Box 3.2) and the work programme with the metallurgical sector of the Universidad Técnica Federico Santa María.
209. A survey applied by the Unit of Technological Development (UDT) of the Universidad de Concepción in 2008 showed that regional business managers have little interest in developing collaborative work in innovation matters with university researchers (UDT, 2008). Firm managers tend to cooperate with dealers, technological institutes, or laboratories. The main reason for this is that company managers believe that university researchers do not understand well how businesses act and that they lack the training necessary to solve practical business problems with the required speed

41
.
Box 3.2: Centro de Alta Tecnología en Maderas (CATEM)
The Advanced Technological Centre in Wood (Centro de Alta Tecnología en Maderas, CATEM) was created by Universidad del Bío Bío in January 1988, as a result of funding obtained through some Fondef projects that the university had won. The objective of the Centre is to contribute to the development of the wood industry and its derived products through research, innovation, creation and transfer of technology, training, and technical assistance. At the beginning, the professionals of the centre came mainly from the wood industry, but later new staffs was formed with professionals, technicians, and instructors, graduates of the Universidad of Bío Bío. Nowadays, the centre has professionals from different disciplines (e.g., architects, designers, builders, and engineers) with solid knowledge of wood technology and the application of materials in the development of new processes and products. In addition, the centre has highly specialized equipment for manufacture and furniture. The centre obtains around 65% of its income selling services and the remainder through undergraduate and graduate level teaching at the Universidad del Bío Bío.
Since the beginning, CATEM has maintained a very close relationship with the region’s SME (small and medium enterprises) through technical transfer and training activities. The technical assistance has focused on searching for and prospecting markets, attendance at international fairs, the design and development of products and processes, the creation of prototypes, assistance in logistics, and the exploration of new business, etc. In the last few years, the centre has implemented an assistance programme aiding 19 small wood and furniture firms, supported by Corfo. In addition, similar programmes have been applied to another 35 regional SME, and 217 small firms have been assisted by programmes for competitive improvement. The training assistance has benefited more than 170 workers from different firms in the wood industry, 40 teachers from technical schools, and 200 professionals from the sector. In addition, the centre supports the Universidad del Bío Bío through different courses that enrol more than 350 undergraduate and graduate students of the university.
210. In addition, the last national survey of innovation has some numbers related to collaboration efforts by regions. The information is presented in Table A.3.18. The data shows that collaboration is low in general, with no more than 13% of the firms generating some collaborative activity. This is more insufficient in the case of cooperation with universities, with no more than 11% of surveyed firms carrying out some type of collaborative action with these institutions. The Bío Bío Region has not been an exception and its results are even worse for this indicator, with numbers below the national average (see Table A.3.18).
211. In the survey applied to researchers, businesspeople, and public officials, a section was designated to analyze the existence of cooperation and joint work among the HEI researchers. According to the results obtained, in general, the respondents find that the HEI do not have formal mechanisms of cooperation to carry out research activities among them. However, they agree that some research activities are carried out cooperatively, but mostly with researchers from other regions and other countries, and not with researchers from other regional institutions. This could be due to a lack of incentives promoting this kind of cooperation.

42
The Innovative Environment in the Bío Bío Region27
212. In spite of the efforts made for almost a decade to generate infrastructure, design programmes, and generate local policies to promote innovation, the innovative environment in the Bío Bío Region is still scarce. One of the reasons might be that the existing goods and services produced by firms in the region have a low technological content. An attempt to measure the proportion of technological firms in this region, and a comparison with countries like Spain and Italy, is made in Table 3.3. The proportion of firms with high and medium-high technological content is relatively low in the Bío Bío Region, whereas the proportion of firms with low or null technology is high.
Table 3.3 Number and Distribution of Firms Classified by Technological Level
in the Bío Bío Region, Spain, and Italy
Technology Level No. Total Bío Bío
Bío Bío (%)
Spain (%)
Italy (%)
High-Technology 94 0.9 3.2 6.2
Medium-High Technology 336 3.3 31.5 12.3
Medium-Low Technology 433 4.3 27.7 26.1 Low-Technology 1,110 10.9
37.6
55.4 Non-Technology 8,177 80.6Total 10,150 100.0 100.0 100.0 Source: Authors’ elaboarion according to OECD methodology, using Servicios de Impuestos
Internos (SII) information.
213. However, compared with other regions in Chile and with the national average, the Bío Bío Region has good standards of innovative performance. According to the last survey of innovation, 41% of all the firms surveyed in the Bío Bío Region made some kind of innovation, as compared to 33% nationally and 34% in the Metropolitan Region. In the large companies of the region, around 64% of the firms made an innovation. In small firms, this indicator was 35%, much higher than the national rate of 23%. In conclusion, the information shows that the Bío Bío Region has a larger share of innovative firms with a large portion of small firms involved in innovative activities (see Table A.3.19).
214. The information obtained in the last survey of innovation shows low awareness of the different funds available to finance innovative projects and even lower use of the funding sources. According to the information in Table A.3.20, the indicators for the Bío Bío Region are higher than the national average and the Metropolitan Region. For example, 48% of the regional firms know about Innova Chile and 43% about FONDEF. However, the percentage of firms that use these funds is very low: only 0.5% for Innova Chile and 5.7% for FONDEF. Likewise, although 53% of the firms are aware of Innova Bio Bio, only 2.7% are using it. This shows that, although many firms seem to be involved in innovative activities, only a few are using public funds to innovate.
215. Specifically, the Universidad de Concepción has implemented various actions to transform science and knowledge into innovative solutions for companies. First, in 1996, it
27 A summary of an analysis of the strengths, weaknesses, opportunities, and threats of the Bío Bío Region’s innovation system is presented in Appendix 3.

43
created the Unit of Technological Development (UDT). This centre has fulfilled an important role for process escalation, product development, and specialized technical assistance for the productive sector (see Box 3.3). In collaboration with different national and foreign technological centres, it has focused on biomass from forestry, where it has a leading position nowadays. The UDT has presented 10 industrial patents, participated in four technological licenses, and in the creation of five spin-off firms. Second, it has created the Intellectual Property Unit (UPI), which assists researchers and external persons with the intellectual property of their ideas and has contributed to the university’s leading position in the country in patent registration. Third, the university has created EmpreUdec, an institution that links researchers with the entrepreneurial world, and that aims to generate an adequate environment for the development of science, technological innovation and transfer, marketing of intellectual property, and the management of knowledge for economic and social development. Fourth, the university is presently building a technological park. Finally, the university has a programme to promote entrepreneurship among its students, develops programmes for the continuous formation of high school teachers, and gives training and technical assistance to medium and small-sized business managers.
Box 3.3: Unidad de Desarrollo Tecnológico (UDT)
The Unit of Technological Development (UDT) at the Universidad de Concepción was created in 1996 with the objective of helping the industry in the development of new products or processes, in scaling processes, and with specialized technical assistance in collaboration with the main national and international technology centres. In 2007, UDT, along with academic staff from the faculties of Engineering and Pharmacy of the Universidad de Concepción, achieved significant recognition by the National Commission for Research in Science and Technology, CONICYT, being one of eight national institutions favoured by the Basal Financing Programme for Scientific and Technological Centres of Excellence (CCTE). The thematic scope of action of the UDT-CCTE is developing technologies and products related to new uses of forest biomass. Its basic aim is to establish and maintain conditions conducive to the industrial application of R & D. In this context, the ability to up-scale processes and transfer knowledge and experience from the laboratory to a pilot programme and then on to a manufacturing industry is an essential aspect. The project’s working areas are biomaterials, bio-energy, chemicals, the environment, technological transfer, and innovation management. As a result of its activities, the UDT has, to date, filed for 10 patents and participated in the licensing of four technologies and in the creation of five spin-offs. Its current annual sales are around 4 million dollars and it has 80 employees.
216. In addition, the Universidad Catolica de la Santísima Concepción has been leading the region in research related to marine studies, fisheries, and aquaculture. It recently created a research center with the objective to provide technical support to the industry, especially in environmental issues (See Box 3.4).

44
Box 3.4: Centro Regional de Estudios Ambientales (CREA)
The Regional Centre for Environmental Studies (CREA) is a research and services unit created by Universidad Católica de la Santísima Concepción on June 5, 2006, with the objective to generate scientific research and develop studies in the environmental area. It has significant laboratories (e.g., BIOTECMAR) in which to perform microbiological and chemical-physical laboratory tests. The centre does research in a variety of scientific and technical areas such as eco-toxicology, oceanography, aquaculture, and fisheries. It has over 14 professionals in the areas of oceanography, marine and terrestrial biology, engineering, the environment, and aquaculture. The centre conducts environmental impact assessments, monitoring programmes, environmental monitoring programmes, innovation studies in aquaculture, and environmental declarations. From 2008 to 2009, the centre provided services to 12 companies from various industrial sectors at the national and regional level, including pulp, oil refining, mining, ports, steel, and chemicals.
217. As a way to contribute to this innovative environment, a policy of promoting regional entrepreneurship has been carried out in the last years, lead by HEI through the creation of incubators and partially funded by CORFO. Currently, 24 business incubators exist in Chile, three of which are located in the Bío Bío Region: i) Idea-Incuba, of the Universidad de Concepción; ii) CDEUBB, of the Universidad del Bío Bío, and iii) INETEC, of the Universidad Tecnológica (INACAP). 218. Idea-Incuba started in 2002 with funding from the Regional Government and CORFO, through Innova Bío Bío. At present, it has 25 incubated projects, seven of which have successfully completed the entire incubation process and today operate independently in the market. Of these 25 projects, around 40% correspond to businesses of industrial services and engineering, 24% to information and communications technologies (ICT), 20% to biotechnology and health, and the remaining 16% are related to agriculture, industry, and tourism.
219. CDEUBB was also founded in 2002 using the same line of financing as Idea-Incuba. This incubator has, to date, 16 incubated projects. Of the projects presently supported, 32% are related to ICT, 25% to industrial design, 22% to industry and agriculture, and 21% are linked to health, services, and tourism.
220. Finally, INETEC-INACAP (Concepción) is the latest of the regional incubators. It was started in 2006. This institution is defined as a “business incubator network” and is present not only in Concepción but also in other cities of Chile such as La Serena, Santiago, Valdivia, and Punta Arenas. INETEC has 23 projects in the pre-incubation phase (without initiation of activities). Particularly, in the Bío Bío Region, it is supporting seven projects.
221. Innova Bío Bío, the main public institution funding innovation in the region, has funded more than 600 projects in the last eight years with relative success. However, it is still very early to evaluate the results of this programme. A preliminary evaluation performed by researchers of the Universidad Católica de la Santísima Concepción showed that the main success factor of this programme has been the promotion of a collaborative environment among firms, government, and regional universities (Ulloa & Llanos, 2008). Businesses, especially small and medium-sized firms (SME) that do not have experience in innovation or high qualified human resources have to create networks with HEI researchers in order to increase the probability of success for their projects. Thus, the funding assigned by Innova Bio Bio has helped create part of this innovative environment.
222. In addition, the HEI have been successfully applying internal policies and incentives to promote research, as mentioned above. However, these policies have been biased, to a

45
significant extent, to encourage indexed publications and basic research, and not to promote applied research, patenting, transfer, commercialisation, and dissemination of results.
223. In the survey conducted, we asked researchers about incentive mechanisms. They consider that the regional HEI offer internal incentives for promoting research, patenting, technological transfer, and the diffusion of results. Nevertheless, they do not believe that there are internal incentives to develop initiatives that support the processes of innovation in large businesses in the Bío Bío Region, and especially in small and medium firms. They also feel that the funds assigned by CONICYT, Corfo, and Innova Bío Bío are not sufficient to support the development of science and technology in the region, although they consider that the instruments are adequate.
224. On the other hand, the businesspeople and public actors surveyed believe that the HEI do not have formal mechanisms to promote research, technological transfer, and dissemination, and even less so for supporting innovation in larger businesses. This belief is stronger with respect to the existence of mechanisms that promote patents or innovation in SME.
225. In summary, the perception of these two groups of respondents are quite different from each other with respect to the existence of incentives to promote research, technological transfer, and dissemination, but not with respect to the lack of incentives to promote innovation in firms, especially in SME, in which both groups agree that the HEI are not doing very well.

46
CHAPTER 4. CONTRIBUTION OF TEACHING AND LEARNING TO THE LABOUR MARKET AND SKILLS
This chapter reviews the contribution of HEI in the Bío Bío Region to the labour market and skills. First, a brief description of the supply of graduates from the regional HEI is presented. Then, we discuss the relationship between supply and demand for regional education in the short- and long-term, paying special attention to the localisation of the learning process. Thereafter, the skills and competences attained by graduates from the HEI are assessed. Finally, we assess the vision of the actors regarding the existence of a regional dimension in the development strategies of the local HEI.
Education Supply from Regional HEI
226. The Bío Bío Region has a widely diversified supply of higher education, both in terms of the number of institutions participating in the market and the number of areas of knowledge covered by the professional majors offered in the system. There are four main categories of HEI. These categories and the corresponding number of institutions at present are: traditional universities grouped under the Council of Chilean University Rectors (CRUCH), seven institutions; private universities (UP), 22 institutions; professional institutes (IP), 30 institutions; and technical formation centers (CFT), 20 institutions.
227. The regional HEI have followed the general national trend, with higher numbers of institutions and enrolled students in the last seven years (see Figures A.4.1 and A.4.2). From 2000 to 2007, the total regional enrollment in HEI increased from 49,624 to 93,941 students, for an average growth rate of 9.6% per year. In comparison to the total national enrollment, the regional HEI have maintained their market share of total enrollment in this period, increasing slightly from 12.1% in 2000 to 12.9% in 2007.
228. However, within the regional HEI, the allocation of student enrollment changed drastically from 2000 to 2007, in favor of the UP and IP. The CRUCH universities and CFT decreased their share in total enrollment. The increase in the UP share (from 11% to 23%) and decline in the CRUCH share (from 58% to 43%) have been particularly important in this period. Notwithstanding, the CRUCH universities are still the most important category in terms of student enrollment.
229. Although the CRUCH universities concentrate the largest proportion of student enrollment, this is not the case for the number of degrees offered (see Figure A.4.3). The IP and UP provide the highest proportion of degrees offered, with 40% and 22% of these, respectively, in 2008. The CRUCH universities supplied only 17% of the total offered degrees.
230. An additional element relevant to the description of HEI is that postgraduate education is concentrated only in the universities, with overwhelming participation by the CRUCH universities.
Matching the Supply and Demand in the Educational Process
231. This section analyzes whether or not the education offered by the regional HEI matches the demands (or needs) that arise from the regional economy. Although there is no established way to define univocally what one should understand by regional needs, we have

47
chosen to operationalise this concept according to the demands of the labour market in terms of type of workers by educational category.
232. Moreover, we distinguish between short-term and long-term demands. To operationalise the short-term demand, we chose to look at what presently is being “demanded” in the labour market, as it emerges from the analysis of the regional employment by sector of economic activity and educational category. However, this measurement responds to the employment structure that arises from past history, but does not consider the strategic vision or development plans of the authorities and regional actors. Thus, we have chosen to operationalise a second, long-term concept of demand, as reflected in the Bío Bío Regional Strategy for Development (RSD), in the understanding that this strategy reflects the views of the different actors in the region regarding how they expect future regional development to be pursued.
233. To analyze if the supply of undergraduate education of the regional HEI corresponds to the present (short-term) demands of the regional economy, we compared the composition of the supply of degrees with the employment share of employed workers with higher education degrees in different sectors of economic activity to one digit of the International Standard Industrial Classification of all economic activities (ISIC).
234. Using data from CASEN-2006 (MIDEPLAN, 2006), we find that social, communal, and personal services are by large the biggest labor-hiring sector for graduates from HEI, reaching a share of 53%, followed by industrial manufacturing (13%) and financial, insurance, and real estate (11%) (see Figure A.4.4). The distribution of employment of HEI graduates differs markedly from the general distribution of employment in the region, as can be seen in Figure 4.1. Splitting the employment information by type of HEI reveals important differences in the composition of labour demand by sector of economic activity (see Figure A.4.5). For instance, in the social, communal, and personal services sector, 75% of the employees with higher education come from universities and only 11% from CFT. Similar allocation patterns for higher educated employees occur in the agricultural sector. For mining, on the other hand, most employees come from IP.

48
Figure 4.1 Employment Distribution of Higher Education Graduates by Sector of Economic Activity
Bío Bío Region 2006
Social and Personal Services
53%
Electricity, Gas and Water
1%
Construction5%
Commerce10%
Agriculture, Hunting and Fishing
4%
Transportation and Telecommunications
3%
Manufacturing13%
Mining0%
Financial Services11%
Source: National Survey of Socioeconomic Characterization (CASEN), 2006.
235. On the supply side, however, the evaluation of the composition of supply is more challenging, since several degrees offered by the HEI are not sector-specific. That is, graduates from these programmes can be employed in any economic sector. Some examples of these degrees are engineering, business administration, and economics. These degrees were grouped in a special category of “General or Transversal”. Additionally, since we lacked information on the number of enrolled students in several programmes, we had to work only with the number of undergraduate (and sometimes graduate) programmes offered by the HEI. This is clearly suboptimal since it does not necessarily reflect the total individuals trained in a specific area. However, we did an approximation of the composition of supply that can give us a rough idea of the extent to which this supply is consistent with the employment demand. We assigned majors to different economic sectors based on both the International Standard Industrial classification and the description of the majors and their labour market provided on the Web pages of the Universidad de Concepción and the Virginio Gomez Professional Institute. It is possible that some majors are classified in more than one economic sector.
236. Bearing this in mind, Figures A.4.6, A.4.7, and A.4.8 present the shares of the HEI graduate supply. The category of commercial services concentrates the highest share of degrees, with 32% of all degrees offered by the HEI. Following in participation are the categories financial services (22%) and general or transversal (21%). In contrast, the majors associated with industrial manufacturing only represent 8% of all degrees. The category agriculture includes forestry and fishing. As can be recalled, these two last sectors are connected to the leading regional export sectors. The supply of degrees oriented to these sectors is only 21% of all degrees offered in the agricultural category. Most (58%) degrees are oriented to agricultural and stockbreeding activities.

49
237. Within each type of HEI, we observed some differences in the allocation of the supply of majors. For example, private universities (UP) concentrate on commercial services (53%) whereas CRUCH universities concentrate only 35% of their offers in this economic activity. General and transversal careers are more significant in the IP (27%) but are very limited in the CRUCH (11%). Finally, CFT concentrate most of their supply in commerce and manufacture, whereas CRUCH universities also focus on agriculture and financial services. In other words, it seems that the CRUCH universities are more diversified than other institutions.
238. When we consider the employment shares described above, we can say that, in very broad terms, the supply of degrees of the regional HEI does not seem to be heavily misaligned with short-term regional needs.
239. To define long-term needs, we used the Regional Strategy for Development (RSD) for the Bío Bío Region, 2008-2015 (GOBIERNO REGIONAL, 2009). This strategy identifies priority areas and key productive sectors fundamentally linked to the region’s international insertion. The RSD identifies six priority areas: economic development, social development and equity, institutional development, culture and diversity, environment and sustainability, and territorial organisation and infrastructure. Within the economic field, emergent sectors and regional challenges are identified, such as tourism development, increased worker training, development of connectivity, alternative energy source development, and technological transfer. In the social field, education (primary and secondary) and social mobility are target areas.
240. We classified all majors offered by the HEI into one of these categories. As with the previous analysis, we worked only with the number of majors offered by the institutions and we defined an “unclassified” category to incorporate those programmes that were either transversal to several areas or were difficult to assign to a specific field (see Figures A.4.10 and A.4.11). By and large, social and equity development (38%) and economic development (27%) captured most of the supply of majors in terms of the categories defined by the RSD. Not surprisingly, many majors were either transversal or could not be classified into any of the specific fields (20%). The areas of territorial organisation and infrastructure, environment and sustainability, culture and diversity, and institutional development represented only 7%, 5%, 2%, and 1% of the total supply. Within each category, we underscore the fact that CRUCH universities offered almost of 60% of the majors in the area of environment and sustainability and almost 50% in the area of culture and diversity. The presence of CFT was significant in institutional development, whereas IP had large participation in the economical and unclassified categories.
241. As expected, the learning process focuses mainly on the short-term because it has to respond to current needs faced by the region. Nevertheless, the offer of majors is diversified enough to aim at several aspects that are part of the RSD, with a great potential of development in areas such as tourism, environmental science, and alternative energy. It is worth noting that some HEI also provide majors in areas that are of more general interest for the country like aerospace engineering, geology, and geosciences.
Localizing the learning processes
242. In order to describe the localisation of the learning process, we use regional map information provided by the EULA Centre (Universidad de Concepción) that allowed us (using ARCVIEW) to highlight with colours the different parts of the regional territory that are relevant for the analysis.
243. These maps and several sources of information show a highly concentrated localisation of the regional supply of degrees from HEI (see Figures A.4.12 and A.4.13). Most (66%) of the degrees are located in the province of Concepción. If we look at the concentration at the communal level, this is even higher. There is a HEI in only seven out of 54 communes. Of these seven communes, five have more than one type of HEI, whereas the two other have only

50
technical formation centres (CFT). The pattern of concentration is clear. The HEI are located mainly in the biggest cities, the provincial capitals (Concepción, Chillán, and Los Angeles). Moreover, a huge part of all degrees are located in Concepción, the capital of the region. The only exceptions are the two CFT that are located in poor and underdeveloped zones (Lota and Lebu). Thus, the potential for decentralisation seems to lie with the CFT.
244. In quantitative terms, undergraduate student density is highest in the Concepción commune (see Map 4.1), reaching 290 students for each 1,000 inhabitants. This density falls to 85 in Chillán and 43 in Los Angeles. If we separate students by type of HEI, the difference in density is higher for university students in Concepción. Graduate programmes, as mentioned above, are concentrated only in CRUCH universities and, in terms of localisation, are highly concentrated in Concepción.

51
Map 4.1 Presence of Higher Education Institutions and Total Enrollment per each One Thousand Inhabitants in Different Communes
Bío Bío Region 2008
Presence of Higher Education Institutions in the Bío Bío Region Total Enrollment / 1000 Inhabitants
CañeteLebu
Los ÁngelesConcepciónLota
TalcahuanoChillán
CañeteLebu
Los ÁngelesConcepciónLota
TalcahuanoChillán
Technical Formation CenterProfessional Institute
University
Armed Forces
Technical Formation CenterProfessional Institute
University
Armed Forces
Source: Based on information from the Consejo Superior de Educación (CSE) 2008.

52
245. Additionally, the postgraduate supply is concentrated in universities, with a significantly larger participation of CRUCH universities and with a supply located in the regional capital (see Figure A.4.13).
246. We tried to identify the demand for higher educated labour and the main productive activities by communal localisation in order to assess the institutional and territorial integration of the learning process. Therefore, we defined the principal economic activities in each commune and identified whether the required type of HEI degree was given within this commune.
247. To classify each area, we used the information provided by the Domestic Tax Service (SII) that contains the number of firms classified by size (micro, small, medium, and large) together with the area of economic activity given in the International Standard Industrial Classification. Agriculture, given its relevance for the region, was again divided into the areas of fishing, agriculture, and forestry. For each commune, we calculated the total revenue per firm using the values specified per segment by the SII. These express the total revenue in terms of an index adjusted for inflation so that the purchase power remains constant; this index is called Incremental Units, or the “Unidad de Fomento” (UF)28.
248. Using this information, companies were classified into the following categories: micro (with an upper limit of 2,400 UF/year), small (on average, 13,700 UF/year), medium (on average, 62,500UF/year), and large (with a lower limit of 100,000UF/year). We defined a commune as “intensive” in a specific economic sector if the share of this sector in the total revenue of the commune was higher than the average share in revenues of this (same) economic sector in all the communes in the Bío Bío Region. Finally, we counted the number of degrees given in each commune and compared them with the classification of the communes. In the annex, we provide maps for locating the institutions in the region, highlighting those communes where there is a presence of each HEI and maps showing a classification of communes in terms of their principal economic activity together with an identification of the location of majors supplied in that economic sector.
249. The results are mixed. For some communes, the degree of localisation and primary activity seems to match whereas, in others, this is not the case (see Map A.4.1). For instance, in the case of the communes in which commerce, restaurants, and hotels are the main activities (e.g., Chillán, Concepción, Los Angeles, and Talcahuano), the match is almost perfect. For agriculture and cattle breeding, there seems to be a relationship between the number of degrees given in Chillán and Los Angeles and their neighbouring communes’ main economic activity (communes like Bulnes, Coihueco, El Carmen, Florida, Portezuelo, Quilaco, among several others). In the fields of forestry and fishing, there does not seem to be any relationship between the location of the degrees and the communes (Arauco, Coronel, Lebu, Lota, Penco, Talcahuano, Tirúa, and Tomé) where these activities are the main economic activities.
250. In terms of migration, the census data for 2002 show that the Bío Bío Region is a net expeller of HEI graduates (see Figure 4.2). Moreover, the salaries paid to workers with higher education in the Bío Bío Region are, on average, lower than the salaries paid in the rest of the country (see Figures A.4.14, A.4.15, and A.4.16). This suggests the existence of a (relative) excess supply of high educated labour in the Bío Bío Region.
28 Presently (July 2009), the UF has a value of around $21,000 pesos, equivalent to almost US$ 40.

53
Figure 4.2 Net Migration from the Bío Bío Region in Numbers of People by Type of Education
2006
-1,000
-500
0
500
1,000
1,500
2,000
2,500
Technical FormationCenters
Professional Institutes Universities Graduates
Institution
Nº
Source: National Survey of Socioeconomic Characterization (CASEN), 2006.
251. This information shows that, in general, the total number of people that emigrate from the region surpass the number of immigrants for all higher education levels. The only exception is the number of immigrants with postgraduate education, which show a positive influx to the region. This seems to be directly related to the relative level of wages in the region, since the region pays lower salaries in all areas of economic activity and for each category of HEI (see Figures A.4.14, A.4.15, and A.4.16).29 Finally, the unemployment rate in the region is higher than in the whole country, again for each type of higher education level except postgraduate (see Figure A.4.17).
252. A study done by the Ministry of Development and Cooperation (MIDEPLAN, 2000) showed that the returns on education were higher for people with college degrees. For instance, for 1990-1998, their estimates show that the returns for people with a college education were 7 points higher than returns for people with a CFT or IP education. However, working in the Bío Bío Region is punished in terms of returns for all types of higher education as compared with other regions of the county like the Metropolitan, Antofagasta, Atacama, and others. Clearly, lower returns on education, lower salaries, and higher unemployment rates generate a high incentive to migrate from the region. Thus, the Bío Bío Region can be characterized as a net expeller for high education graduates.
Broader access to higher education
253. To the best of our knowledge, most of the efforts to broaden access to education and to reduce inequalities in gender, place of residence, and socioeconomic background have been
29 Unfortunately, CASEN is not fully representative at this level of disaggregation; however, it is the only available source of information.

54
made by the central national government through some 27 different scholarships, fellowships, or financial programmes available at a national level (see Table A.4.1).
The institutions providing these scholarships are concentrated in the Ministry of Education (MINEDUC), the National Council for Education Aid and Scholarships (JUNAEB), the Ministry of Planning (MIDEPLAN), the National Commission for Indigenous Development (CONADI), postgraduate education, CONICYT, and the Agency for International Cooperation (AGCI) of the Ministry of International Affairs (MIREX).
254. Some of these are intended to favour specific socioeconomic groups that experience difficulties gaining access to higher education due to social, political, racial, or other types of discrimination. For instance, the Indigenous Scholarship (JUNAEB/MINEDUC) benefits children and youth from native groups in primary, secondary, or tertiary education. A programme of subsidies for training and specialisation for indigenous people targets the same group (CONADI/MIDEPLAN), but also includes adults of ethnic minorities desiring technical or professional education, supporting their specialisation for one year in priority areas linked to identity formation and development.
255. Other relevant scholarships also exist. One scholarship targets people with any type of physical or mental disability, especially among the poorest groups. This scholarship supports, totally or partially, equipment, personal materials, transportation, etc., that help students participate in academic activities. Unfortunately, at the regional level, most of the HEI lack the infrastructure to facilitate physical access to classrooms or buildings. Another special scholarship targets victims of political prison and torture (Valech Scholarship) during the military regime, allowing them to continue their higher education in any HEI. This scholarship covers 100% of the cost of the majors and any other expenditures needed for graduation. Third, the distant zones scholarship is a programme to help poor students with good academic performance but living far from the educational centers. Table 4.1 shows all the available scholarships in the country. Among the variety of objectives and programmes, some scholarships help students pay for the exams required to enter the universities, others reduce the cost of public transportation, or provide accommodation, food, or cheap credit to higher education students
256. Even though we do not know of specific regional initiatives to increase access to education, secondary data (CASEN) shows that HEI in the region have been accepting more students from the lower quintile, following the national trend of increased participation of students from the lowest quintile in higher education. This tendency can be at least partially explained by policies implemented in the last 15 years to increase access for students from lower income families to HEI. It is well known that, nowadays, six or seven out of every ten students in the university are the first generation of a family reaching such a level of education. This fact, which is a significant change from the previous situation, brings new challenges to the HEI since the new generation of students have a different and sometimes lower background or lower human and social capital to support them through their college education, increasing desertion, low grades, course failure, and longer periods to finish a major. Table 4.2 shows the distribution of students by gender according to quintile and type of education in 2003 and 2006. In 2003, the presence of females was notorious in all types of education and from almost all quintiles (except the fifth quintile) for any type of education. This scenario was reversed in 2006, when the gender distribution became more even. In general, we can say that a gender gap does not exist in the HEI against women, as might have been expected.
257. Table 4.3 shows the distribution of students by quintile according to gender and type of HEI. For instance, in 2003 only 8.86% of the students enrolled in CRUCH universities were from the poorest quintile, whereas 38% belonged to the richest quintile. This income inequality was even greater among private universities and professional institutes. In 2003, 52% of the students at private universities were from the fifth quintile and only 3.45% were from the first

55
quintile. Most enrolment in IP was concentrated in the middle stratum, with an insignificant portion of students from the first quintile. Notice that the CFT concentrated most of their students in the lowest quintiles. This distribution changed slightly in 2006, especially regarding the enrolment of poor students in IP but, by and large, the picture is similar. Private universities concentrate over 77% of their students in the two highest quintiles (down from 81% in 2003).
258. Finally, Table 4.1 presents the distribution of students by type of HEI according to gender and quintile. Here the picture is even clearer: CRUCH universities captured most of the students from poor families (75%) in 2003; this was reduced to 58% in 2006. Of course, since CRUCH universities have more enrolment, they also have more students from any quintile. However, as this proportion was around 52% in all other quintiles in 2003, the 75% participation in the lowest quintile is significant. Notice that the CRUCH universities reduced their market participation in all quintiles in 2006; the strongest reduction was in the first quintile, which was captured by the IP. The participation of the poorest students in private universities remained almost unchanged.
259. In general, and bearing in mind the differences in total enrolment, we could say that CFT and, to some extent, the CRUCH universities help reduce the inequality in access to higher education among the poorest. But, at the same time, we have to remember that graduates from CFT also have lower salaries than graduates from other institutions. In the CFT, approximately 80% of their students are from the lowest three quintiles. In other words, the distribution of students among HEI also reproduces income inequality in society. That is, most students in CFT are from the lower quintile and, after graduation, will have lower salaries than graduates from the other institutions. Those graduates from universities will have noticeably higher salaries. In this sense, one can say that the CRUCH universities are helping reduce income differences.
Skills and Attainments of the Regional HEI Graduates
260. In order to identify the level of labour competences and skills attained by the graduates of the HEI through their educational process, we asked different regional actors about their perception of these skill levels using a survey (see Tables A.4.4 and A.4.5). This survey was applied in two workshops, some regional business meetings, and sent by e-mail to all programmes offered by the HEI of the region. An additional effort was made to obtain the opinion of employers and, therefore, one of the workshops was aimed specifically at this type of actor. Unfortunately, the number of useful surveys is relatively low in spite of our efforts to cover most of the target population. Notwithstanding, we think that the results approximate people’s perceptions about the skills and competences of HEI graduates because their opinions were similar to the results of the interviews applied to qualified actors. Moreover, these results seem to be consistent with our own general view about the skills of students from the target population.
261. Therefore, we report some conclusions that can be derived from this data, although the size of the sample is not high enough to assure a high statistical power. In the first workshop, we recorded the opinion of 13 participants who were asked to classify 10 competences on a Likert scale for three types of institutions: universities, IP, and CFT. We have 39 valid surveys from the first workshop, of which 12 were answered by employers, 12 by members of the public sector, and nine by people not classified in any of the previous categories. We received 64 of the surveys sent to members of the HEI with complete information for the same 10 competences. Adding up the surveys applied in the regional business meetings and the first and second workshops, we had a total of 48 valid employer surveys; 36 of which faced the task to which classified 23 competences on the same Likert scale. Therefore, the total number of 160 surveys is distributed as follows: 91 from HEI, 48 from employers, and 18 from the public sector and others. The difference in the number of questions asked on each survey is explained by the time constraints of the workshops; since we had several other topics to discuss, we had to reduce the number of questions in order to allow a reasonable time for the workshop.

56
Table 4.1 Percent Distribution of Students (%) by Type of Higher Education Institution According to Gender and Quintile
2003 and 2006 Quintile I II III IV V
2003 Male Female Total Male Female Total Male Female Total Male Female Total Male Female Total CRUCH 66.40 78.13 75.10 43.79 57.21 52.69 40.15 55.28 49.49 53.39 44.68 47.99 50.83 56.90 53.54 UP 5.18 14.66 12.21 10.56 8.06 8.90 7.95 14.00 11.68 11.48 32.18 24.30 28.37 33.55 30.68 IP 5.06 2.08 2.85 25.78 27.93 27.21 41.67 23.30 30.33 32.10 17.23 22.89 19.82 9.02 15.00 CFT 23.36 5.13 9.83 19.88 6.80 11.20 10.23 7.42 8.49 3.04 5.91 4.82 0.97 0.53 0.77
2006 Male Female Total Male Female Total Male Female Total Male Female Total Male Female Total CRUCH 51.9 63.7 57.9 42.9 49.7 45.9 44.5 44.0 44.2 45.0 43.3 44.2 45.8 42.2 44.1 UP 14.7 9.1 11.9 12.0 14.0 12.9 12.1 13.4 12.7 17.6 30.8 24.0 32.1 34.8 33.4 IP 26.9 21.5 24.2 28.9 21.9 25.8 31.9 37.4 34.4 32.9 23.6 28.4 19.4 18.6 19.0 CFT 6.5 5.7 6.1 16.2 14.4 15.4 11.5 5.3 8.6 4.5 2.2 3.4 2.6 4.4 3.5 Source: National Survey of Socioeconomic Characterization (CASEN), 2003 and 2006. Note: CRUCH (Council of Chilean University Rectors), UP (Private Universities), IP (Professional Institutes), CFT (Technical Formation Centers).

57
262. We organize the results according to the respondents’ affiliation, distinguishing between the following categories: HEI, businesses or business associations, public sector (regional government), and others. The list of competences and summary of results are shown in the annex. Some of the general conclusions are the following:
263. First, a differentiated evaluation of graduates from different types of institutions is difficult because today many institutions offer degrees that were historically given by other institutions. For example, universities nowadays grant degrees in disciplines that were traditionally provided by IP or CFT; likewise, the IP and CFT have diversified their supply to cover areas that traditionally were exclusively dealt with by universities. Thus, it is difficult for the interviewees to differentiate the competences of graduates coming from different types of institutions.
264. Second, a high portion of the interviewees (48%) classified the competences obtained by the graduates from the regional HEI as high or very high, 36% classified these competences as insufficient or regular. Finally, an important share of the interviewees (16%) did not answer the questions about the classification of competences, suggesting that it is difficult to evaluate these competences for the respondents.
265. Third, the interviewees reported that the graduates from regional HEI have a good technical and professional formation within each discipline and respondents also have a positive opinion of the graduates’ capacity to apply the skills attained to specific tasks. At the same time, they find that these graduates have difficulties inserting themselves into the working world and that they are ignorant about several aspects of the labour market. Participants suggest the need for a more dual formation, offering students more and better interactions with the productive and labour sector. This, according to participants, could facilitate the transition from the academic to the working world.
266. Fourth, most respondents seem to agree that there is disparity in the development of social vs technical abilities. Graduates, especially from some types of institutions, lack written and oral communicational abilities, knowledge of a second language, and the capability to establish networks.
267. When one disaggregates the opinions by the respondents’ affiliations, some interesting differences emerge. The view of the HEI regarding their graduates is that the latter are weak in terms of written and oral communication abilities and knowledge of a second language. On the other hand, they believe their strengths are a good level of knowledge and ability to apply it, capacity to work autonomously, and the management of information technologies.
268. The business and public sector finds that the HEI graduates are deficient in their abilities of abstraction, analysis, and synthesis; in their ability to apply knowledge to concrete situations; in their interpersonal abilities; and in the capacity to work autonomously. They coincide with the HEI, finding that the graduates lack written and oral communication abilities and knowledge of a second language. Moreover, they classify very few attained competences as very high.
269. The differences in percentage for the classification of categories among different actors seem to be significant: 20% of the interviewees belonging to a HEI classified some of the competences as very high, whereas this percentage fell to 6% for the respondents from the business sector and to 1% for the respondents from the public sector and others. On the other side of the scale, 22% of the respondents from the HEI classified the competences of the graduates as insufficient or regular, a figure that increased to 55% among respondents from the business and public sectors.

58
270. Some interesting issues also arise from surveys applied to business people. Skills such as the capacity to make decisions; interpersonal and social skills; the capacity to seek, process, and analyze information; and commitments to cultural and social environments are mentioned as insufficiently developed in HEI graduates. On the other hand, commitments to ethics and computational and technological skills are evaluated as good or very good.
271. Two technical reports done by the Facultad de Ciencias Empresariales of the Universidad del Bío Bío offer an independent source of information about the competences obtained by the graduates of regional HEI. These studies analyze the demand and supply of labour and the competences of workers in two regional economic sectors: tourism and construction and maritime and harbor. Both sectors are labelled as priority areas in the Regional Strategy of Development. These studies identify several companies (small, medium, and large) and businesses associated with each of these two sectors, characterizing the structure of their employees in terms of their educational profiles. They also characterize the supply of education, that is, careers and degrees offered by HEI and other institutions in these two sectors. Both primary (INE) and secondary (surveys) sources of information are used.
272. Results for the tourist sector show that the most demanded generic and specific competences are commitment to quality, oral and written communication, capacity to motivate and obtain shared goals, and capacity for team work. Moreover, the study detects strengths among the professional and technical graduates from HEI in the areas of commitment to quality, capacity to take decisions, and capacity to identify functional interrelations in the organisation, among others. The study identifies weaknesses in the capacity to communicate in a second language; perform research; carry out strategic planning, abstraction, analysis, and synthesis; and work in international contexts (Chile Califica, 2008).
273. The results for the maritime and harbor sector show that, for professionals, the most demanded competence is the capacity to apply knowledge in practice. The strengths of workers at this level are an adequate level of knowledge in the area and the capacity to organize and plan time. The weaknesses are the capacity to communicate in a second language, the capacity to perform criticism and self-criticism, the ability to work in international contexts, and the capacity to use information technologies (Chile Califica, 2007).
Regional Dimension in the Development of HEI Strategies
Enhancing the Regional Learning System
274. An analysis of statements of “missions and visions” from a sample of respondents to the survey applied to regional HEI reveals that, for a number of them, the regional dimension of the learning process is a priority. For example, the regional dimension is mentioned explicitly in the institutional mission statement in two out of four CRUCH universities, in three out of 11 UP, in three out of 10 IP, and in four out of nine CFT. These statements explicitly recognize the relevance of having strong community ties and of providing regionally pertinent studies. It is also important to take into account that some of these institutions, especially the CRUCH universities, have missions with national horizons. For example, research activities are defined as an essential component of these universities whereas, in UP, research is defined as a complementary activity.
275. Therefore, each type of institution follows different strategies to incorporate the regional dimension into the creation of courses and majors. For example, some CFT use market research, either performed by them or by other institutions, to define courses and academic programmes. Additionally some consider the Regional Strategy of Development (RSD) to define majors or courses, and sometimes they ask the help of consulting committees, made up by members of business world, that help them to define the regionally needed competences that they can contribute through education and training. Professional institutes also use market
59
research, but they also follow a leading institution in the definition of their programmes. Finally, these institutes also base their decisions regarding majors on studies about social and productive regional needs.
276. Private universities (UP) have a more diversified strategy for considering the regional dimension when defining majors. Some strategies consist of internships done by their students in regional institutions (health centres, companies, etc.), research on topics of regional interest, studies of regional labour demands, and students’ preferences for majors (demand for majors by high school graduates). Their objective is to offer academic programmes that satisfy local needs or that are aligned with regional needs described in the RSD. These institutions also use employability studies of graduates from regional and national majors. Finally, CRUCH universities follow similar strategies, and many emphasize the gravitation of the regional dimension when making decisions about changes in the content of courses and in the creation of new majors. They require explicitly that new majors respond to the productive structure of the region and provinces.
277. In terms of joint initiatives, common efforts, and links among different institutions (that is, among HEI or between these and the public sector or business firms), CFT and IP explicitly state that, in general, they do not know of any, or there is no link between them and other HEI. When these links do exist, the assessment of such programmes is mediocre. For instance, CFT Lota-Arauco has some academic articulation with IP Virginio Gomez and Universidad de Concepción, but the success of this initiative has been limited. Only one IP refers to an agreement with some universities that allow students from the IP to continue their studies in that university. Some IP have agreements with universities that allow their students access to libraries in those universities.
278. Universities are more active in terms of interactions with other institutions; all of them have agreements with other universities. However, in general, these joint programmes are more common between universities of the same type. For instance, some private universities have common sport activities for their students. They also have health programmes in which students from some universities have access to medical and psychological treatment. Additionally, there are some joint entrepreneur programmes for students among private universities. Some of the private universities have international agreements and some joint research programmes with other private universities.
279. All CRUCH universities have agreements for joint academic or research programmes with other universities, mainly CRUCH universities, or international relationships with foreign universities that allow student exchanges, research programmes, and other types of projects that are executed together with these international universities.
280. Relationships with the public sector are also important for all types of HEI. CFT have several links with governmental institutions such as CORFO, INNOVA Bío Bío, FOSIS, and Chile Califica. Their association with Chile Califica aims specifically at improved formation at the technical levels in several economic sectors (e.g., services, commerce, and industry). IP also mentioned associations with MINEDUC, municipalities, SERCOTEC, and the territorial integrated metal mechanic programme (PTI metal mechanic from CORFO). All of these associations are assessed as good or excellent by these institutions. Private universities and CRUCH universities also have associations with municipalities, health services, public schools, and other institutions. They also evaluated these links as good or very good.
281. Another regional initiative that aims to improve the regional learning system is the “Bío Bío Region’s Improvement and Articulation Network for Technical-Professional Formation in the Service, Commerce, and Industrial Sector” (aimed at medium and small-sized firms), whose goal is to match the supply and demand of technical education at a regional level; that is to create a link between CFT, IP, or other institutions providing technical formation with

60
the labour market in regional priority sectors. Not only HEI participate in this effort, but also technical high schools and business organisations.
282. Finally, in general, CFT and IP do not have much interaction with the private sector, although some of them have some relationships with forestry, metal mechanics, and design industries, and some students do their internships in these companies. Private universities, on the other hand, have more interactions with the private sector. For example, they participate actively with organisations such as the Red Cross, children’s protection organisations, private entrepreneurial and innovation organisations, and charities and health institutions such as hospitals. Finally, CRUCH universities have R&D programmes with firms in areas such as construction, forestry, metal mechanics, and food. They also have several joint programmes with companies in biotechnology, bio-fuel, marine resources, environmental impacts, and firms like the publicly owned copper firm, CODELCO. They also train company employees through several courses for companies with a regional presence, such as ENAP, Foster Weller, and OXIQUIM. Finally, these universities participate in guild associations like CIDERE and CORBIOBIO and public-private task forces on matters such as port infrastructure and aquaculture. An interesting example of both interactions among HEI and education in competences is presented in Box 4.1.
Box 4.1: Programme for Education in Competences FORCOM-INACAP-COLBUN
The project FORCOM is a joint programme between INACAP and the company Colbún S.A. The objectives of FORCOM are to train high school students (sophomores in 2008 and juniors in 2009) in labour skills and competence, thereby helping them increase their chances of finding a job; to create a better relationship between the Colbún company and the community; and to articulate this level of learning with the higher education level provided by INACAP. This project will be implemented in several communes of the country and in one commune of the Bío Bío Region (Coronel). The main focus will be the formation of skilled workers in the area of electric energy and energy efficiency, that is, a rational and environmentally friendly use of energy. Training in energy efficiency is both a national need and a requirement of employers. INACAP will create a curriculum that teaches a) individual competences such as responsibility, punctuality, proactive behaviour, and organisation; b) social competences such as team work, respect, and integration to organisational culture; and c) practical competences. Since the programme is still being implemented, there are no lessons or results to report yet.
Student Recruitment and Regional Employment
283. In order to attract regional students, all institutions focus their efforts on reaching graduates from regional high schools, via visits to students in their schools and advertising on TV and radio. Another common recruitment strategy is the “open house”, a guided tour inside the institutions for junior and senior students, or the possibility for these students to take classes or participate in special programmes within the institution. Some CFT and IP also distribute flyers with information to social and cultural organisations, unions, businesses, and public activities. This is an important recruitment strategy, since in this process the institutions encourage the use of certain governmental subsidies for employee training, especially for their night programmes. Finally, some universities have fellowships for regional or local students.
284. At the end of the learning process, the HEI have some strategies to encourage the employability of their graduates. For instance, some CFT have an internship department for their students and keep track of their student labour performance through surveys and follow-up phone calls. The IP and UP have specialized departments for labour insertion that help make the first contact between graduates and companies; they also have work agreements with some firms that give priority to their graduates. Additionally, they maintain a Web page with constantly updated work offers, and hold annual meetings with companies and students in the labour market. They also keep track of their student via phone contacts. For CRUCH

61
universities, the strategy seems to be a little different. The main strategy is to provide a high quality offer of majors; this quality is assured through academic accreditation, which also requires studies of employability and contact with employers. This is complemented with Internet information and surveys of former students. Only one of these universities has a follow-up system for graduates; in this case, information is up-dated using telephone and Internet surveys.
Promoting Lifelong Learning, Continuing Professional Development, and Training
285. The HEI offer a significant amount of continuing professional development and training, and systems to enhance and change educational provisions. Unfortunately, information about these programmes is not centralized, which requires asking each institution directly about their academic activities. In an effort to collect information about this issue, a survey was distributed among HEI in the region. Unfortunately, only the Universidad de Concepción and two colleges (Economics and Business, and Sciences) from the Universidad Católica de la Santísima Concepción replied to our request. The information is obviously not representative of the general situation in the region, but gives us some ideas about these activities.
286. For instance, some colleges of Economics and Business in the region have certificates in areas such as small and medium-sized firms, public education management, international businesses and logistics management, finances, project evaluation, human resources, etc. Additionally, they have some short courses designed in conjunction with the demanding institutions, covering topics like taxes, human resources, management skills, etc. with an interaction between them and institutions like the Cámara Chilena de la Construcción and SOFOFA. Such certificates and short courses are very common in all HEI and depend mostly on decentralized organisms like colleges or departments. Massive summer training programmes are held for teachers, supported by the Ministry of Education and implemented in several regional HEI by the College of Education, whereas other programmes for worker training and employment are supported by the Labour Ministry, and programmes for public health or for companies are available in diverse areas of economic activity.
287. In terms of e-learning, academic training programmes are available for public and private institutions. For instance, there are many programmes of English as a second language, courses in dental procedures, courses and programmes focused on social responsibility, networks of cultural integration among countries, and programmes in biology, ergonomics, women’s health, nursing, alcoholism, oceanic islands, etc. Many of these programmes are administrated through outreach centres created by the universities.
288. Our own experience tells us that outreach activities, e-learning, training, continuing education, development of new methods of teaching, etc., are vast in the region, and we regret that we do not have the information required to provide a more detailed and quantitative description of the contribution of HEI to these areas. Box 4.2 presents the articulation initiative of INACAP to link the different levels of CFT, IP, and university formation.

62
Box 4.2: Articulation of Higher Education at Different Levels: CFT-IP-University. INACAP
INACAP has a highly functional system of continuing education, following the Bologna declaration. This system contains two cycles. The first cycle, called professional qualification, last two years and the students obtain an “advanced technical level” degree. This education cycle or level can be complemented with scientific level studies, which require another two years. At the end of this second period, the students will receive a professional degree. In both cases, students can either enter the labour market or continue to study another cycle of professional specialization, giving them the opportunity to obtain an academic degree at the university level. This gradual and flexible level of education allows students to participate in the continuous education system at all three levels provided by INACAP: CFT, IP, and university.
Diagram 4.1: Higher Education Articulation in INACAP
1 2 3 4
E.g. Business Administration
Advanced Technical Level Degree
Engineering in Business
Administration
Professional Degree
5 6 7 8Commercial Engineering
University level degree
9 10

63
CHAPTER 5. CONTRIBUTION TO SOCIAL, CULTURAL, AND ENVIRONMENTAL DEVELOPMENT
This chapter reviews the contribution of the higher education institutions (HEI) in the Bío Bío Region to the social, cultural, and environmental development of the region. For this, we first describe the institutional conditions that help to strengthen the impact of HEI on these areas. Then we describe the methodology used to arrive at the results presented herein. Finally, we present the results obtained for this chapter, in order, for each area. The analysis includes a swift presentation of the state-of-the-art of the region’s social, cultural, and environmental conditions, and reviews the main fields in which the contribution of HEI was assessed.
Framework conditions that encourage contributions by HEI to social, cultural, and environmental development
289. To analyze the contribution of HEI to social, cultural, and environmental development in the Bío Bío Region, we used the concept of development implicit in the last Regional Development Strategy (ERD) report of the Bío Bío regional government (Gobierno Regional, 2009). Of the six strategic dimensions established in the ERD, three are related to the aim of this chapter. These are: “Social Development and Equity”, “Cultural Development and Diversity”, and “Environmental Development and Sustainability”.
290. We detected two specific and explicit “framework” conditions that might strengthen the contribution of HEI to social, cultural, and environmental development. First, the ERD Strategic Plans explicitly declare an intention to integrate the regional universities as key players that should help implement these plans in 2008-2015. That is, HEI are considered to be relevant actors for attaining the goals established in the different programmes, and they are expected to contribute in this sense. Second, the National Accreditation Commission (CNAP) considers an institution’s “connections with the environment” to be an important dimension for accreditation. In particular, the CNAP stresses the importance of the institutional links with the environment to “update knowledge; develop local relevant research; link students with local employers, the professional field, and community organisations; and identify and develop an education more pertinent to reality” (CNAP, own transcription).
The Methodological Design of the Analysis
291. The methodological design of this chapter incorporated different techniques for gathering and analyzing information. First, we analyzed secondary sources: documents and statistical information. We reviewed on-line information systems, bibliographic material, and the available empirical research. We analyzed the strategic plans of the HEI, their missions and visions, and shared values in order to analyze their commitment to regional development. We identified degrees, programmes, research centers, and cultural corporations. All this work focused on the HEI activities related to social, cultural, and environmental sustainability.
292. Second, we used semi-structured interviews with qualified informants. We recovered perceptions and qualitative information from informed respondents. This type of instrument made it possible to capture heterogeneous and rich contents for both specific and transversal interview topics. The results of these interviews were analyzed using Thematic Content Analysis. To select the sample, we formed a list of all potential informers in the Bío Bío Region

64
and made contact to establish the interview. We informed each positive contact about the purpose and importance of the interview. Finally, we interviewed five qualified informers for social development, four for cultural and sports development, and two for environmental sustainability30. At least four of the informers provided information about more than one of these fields.
293. Third, we used the survey on HEI, developed by our team, to obtain additional relevant information for the chapter. The fourth section of this survey contained four questions regarding the priorities given by each institution to the development of activities for social, cultural, and environmental preservation and perceptions about their own contributions in these fields.
The Contribution of HEI to Social Development in the Bío Bío Region
Social Conditions in the Bío Bío Region
294. The Human Development Index (HDI) combines life expectancy, scholarship level, and per capita income to build an indicator of human well-being. On this index, the Bío Bío Region attained a value of 0.686 for the year 2003 (PNUD, 2006); this is lower than the national average (0.725). If we arrange all 13 regions in the country from the highest to lowest index values, the Bío Bío Region ranks 10th.
295. The HDI for the country has improved over time. According to the 2003 index, no single commune had a value lower than 0.5. However, eight of the 12 communes with indexes below 0.6 belonged to the Bío Bío Region. On the other hand, some urban communes in the region – those where most HEI are located – have (relatively) higher values for this index. Thus, the living standards in the Bío Bío Region are highly homogeneous.
296. Other information related to the description of the regional population’s health conditions and perception of quality of life is the following (INE, 2006):
• Women show lower satisfaction levels than do men in areas such as privacy, mental and emotional well-being, couple relationships, leisure activity, family life, sexual life, etc. The worst valued aspects are access to monetary means and physical condition.
• The older population presents lower levels of satisfaction in almost all aspects when compared with other age groups.
• The rural population reports negative values regarding access to recreational activities.
• The indices of sedentary life are high (73% for the whole population and 83% for women) and of practicing sports low (72% of the population declares they never practice a sport).
• 58% of all interviewees state that they have permanent oral hygiene problems.
• 25% of the population reports having depression, anguish, or neurosis.
• 35% of the population works more than eight hours per day.
30 The complete list of interviewed persons is given in Appendix 5.

65
Participation of the HEI in the Definition of Public Policies and Collaboration with Social Services
297. Universities are represented in public-private task forces and regional councils. The qualified informers perceive a growing representation and participation of traditional regional universities on regional councils, public-private task forces, and consulting committees for State institutions. These forums often help define and design the regional government’s general social policy. In this sense, universities make a constant contribution to social policy. This process of growing participation is related to greater decentralization efforts in the country and its onset was identified around the year 2000. This has also played a role in the fact that the latest version of the Regional Strategy of Development (RSD) for the Bío Bío Region includes universities and their respective faculties as relevant actors in more than 90% of the declared programmes.
298. With respect to participation on public-private task forces, the inclusion of academic staff in these instances occurs either by institutional representation or by direct invitations to publically recognized academics. An example of this is the Urban Development task force convoked by the Municipality of Concepción and on which academic staff from the Universidad del Bío Bío, Universidad de Concepción, and Universidad de la Santísima Concepción are participating. Some academics were directly invited, whereas others participate in representation of their institution. Likewise, we can mention that some public services have offered some recognition activities, such as municipal prizes in sciences and arts, to reward the contribution of academics to social development.
299. The relation between HEI participation on government consulting committees and the definition of social policy is low. The qualified informers also perceive that, due to the highly centralized manner of deciding social policy, the aforementioned participation of HEI in different public consulting instances does not guarantee that their views and opinions are taken into account when regional social policy is decided and designed. This is a consequence of the centralized bias that exists in the design of Chilean policy, and it limits the inclusion of regional considerations into the design of these policies.
Human Capital Formation in Areas Related to Social Development
300. Undergraduate and postgraduate education is important in the fields of social development. The qualified informers, as well as the secondary information reviewed, indicated that the participation of HEI, especially universities and professional institutes, is important in the formation of professionals for the different disciplinary areas aimed at social development (e.g., education, social sciences, and health) (see Table 5.1). A portion of these professionals will later work in the regional private and public sectors. Postgraduate formation is concentrated in the regional universities, with the traditional universities offering a large supply of programmes in important social development areas (e.g., public health, family, social and educational research). Moreover, the qualified informers stressed that, during the discussion of the RSD, education was held as very important for regional development, especially in two aspects: education for competitiveness, as demanded from the productive side; and education for the democratic participation of citizens, as required by cultural and social organisations.

66
Table 5.1
Human Capital Formation in Areas Linked to Social Development by Type of Higher Education Institution
Undergraduate
Education Programs
PostgraduateEducation Programs
ContinuingEducation Programs
UndergraduateSocial Science
Programs
Postgraduate Social Science
Programs
Continuing Social Science
Programs
UndergraduateHealth
Programs
PostgraduateHealth
Programs
ContinuingHealth
Programs
CRUCH 40 15 3 17 7 1 24 19 - UP 21 6 5 13 6 6 17 10 8 IP 4 - 1 1 - - 8 - - CFT 10 - - - - - 11 - - Source: Own elaboration based on secondary information analysis, memories, and Higher Education Institutions web pages. Note: CRUCH (Council of Rectors of the Chilean Universities), UP (Private Universities), IP (Professional Institutes), CFT (Technical Formation Centers).

67
301. The supply of continuing education programmes is spatially concentrated. One of the main challenges identified regarding the improved contribution of regional HEI to social development was the weaknesses of public secondary education. The supply of post-professional programmes and courses for teachers is highly concentrated in more urban locations. Thus, access to continuing studies is limited for teachers and administrative school staffs located in areas, such as the Arauco province, that are far from these urban centres.
302. Undergraduate and postgraduate teacher training is not oriented towards working with socially vulnerable populations. A second challenge calls for placing more importance on professional training for working with socially vulnerable populations. This lack impedes strengthening the contribution of HEI, in this area, to social development.
HEI Policies Oriented to Strengthen Social Development
303. The traditional policy of “community relations” is extended to comprise the social sphere. Traditionally, the policy of community relations, especially among the traditional regional universities, was linked to the idea of “disseminating culture” to the community. This policy has evolved to include activities with social impact and that are directed at low and medium-low socioeconomic groups. Table A.5.1 summarizes the sponsored centres, activities, and programmes with social content declared by the regional HEI. The traditional universities include this dimension explicitly in their community relations policies, as established in their strategic plans. According to the survey applied to the HEI in the Bío Bío Region, seven institutions declared that activities related to social development are “high priority”: three traditional universities, two private universities, and two technical formation centres (CFT). Moreover, all the institutions assessed their contribution to social development as high or medium-high. Finally, all the HEI consulted agreed that the regional traditional universities are very important for the region’s social development. In Annex 5, we present tables with disaggregated information by type of institution about the perception of the qualified informers on the contribution of the HEI to social development (see Tables A.5.2 to A.5.7).
304. The HEI profiles for graduates are increasingly oriented at covering the social needs of the region. The intention to meet the social demands of the local population is declared in different official documents of the traditional universities such as strategic plans, educational models, and professional profiles of graduates. Some private universities have incorporated this orientation towards covering social needs through “public responsibility” courses.
305. Regional HEI contribute to the discussion on social development. The HEI contribute information, technical support, and opinions to the public debate on social development issues. The HEI contribute a substantial amount of theses, publications, programmes, conferences, etc. directed at social development. Moreover, they contribute to the discussion of specific issues of special social concern, such as the situation of the native peoples, gender equity, and the situation of vulnerable groups such as the handicapped. The number of researchers in the region tied to social development areas (humanities and social sciences) was about 100 in 2006 (CEUR, 2008). This research group is one of the largest in the region, along with those of Basic and Forest Sciences. Moreover, the number of approved FONDECYT research projects granted to the regional universities in social areas has increased from the year 2000 (CONICYT, 2009). Of these projects, 85% have been awarded to the Universidad de Concepción (see Table A.5.8).
306. The HEI do not prioritize participation in competitive funds for social development. The participation of regional HEI in competitive funds for social development is an additional way in which to link the activity of these institutions to the social conditions in the region. However, the HEI have not yet declared this to be a priority, to orientate researchers towards

68
this type of activity. Many times participation in competitive funds is seen only as an activity for financing academic activity.
307. Activities with the community lack successful institutionalization. An important amount of activities directed at the community have been successful. However, many times these activities are generated and sustained by individual academic staff, without institutional support. Consequently, many such activities are sporadic, not sustained over time, and finally abandoned. If the HEI consider the activities directed towards the community to be important, they should make an effort to institutionalize successful activities in order to sustain them over time.
HEI Contributions to Strengthen Issues of Social Inclusion
308. HEI contribute to special issues. There is a high consensus among qualified informers that the universities make an important contribution through the creation of forums for the discussion of the “ethnic question”. This is especially important in the schools, departments, and faculties of social sciences in the traditional universities. This contribution takes the form of undergraduate and postgraduate theses on ethnic issues, special multicultural formation programmes to support the ethnic identity, links with related public support programmes, and the development of activities related to the community such as seminars, congresses, etc. No specific institutional policies exist in the HEI to increase or guarantee the access of young indigenous people to higher education. The special indigenous stipends given to native people are directly administered and allocated by the Ministry of Education in a centralized manner. Moreover, the qualified informers also value the contribution of universities to the gender equity discussion. This contribution comes particularly from the schools, departments, and faculties of social sciences and education. Finally, there is also a positive assessment of the role played by the HEI in matters related to the integration of social minorities such as handicapped and elderly persons. The HEI not only develop activities directed towards minorities, but also to the organisations that care for minorities. For example, the Universidad del Bío Bío has a programme that develops materials, designs, and devices for handicapped persons; this programme is implemented through the final projects that students from different majors must develop. The products of these activities are then donated to institutions such as COALIVI (Corporation for the Visually Handicapped), TELETON (Institute for Physical Rehabilitation), the Down’s Institute, and some special schools in the region, to be used with their clients. Another experience is described in Box 5.1.

69
Box 5.1: ARTIUC, an Institutionalized Integration Experience with Handicapped Students
Multidisciplinary Support Programme for Students with Visual Handicaps. The programme was initiated in 1996 in the Universidad de Concepción. It started with the donation of equipment by the Spanish National Organisation of Blind People (ONCE), and was complemented with a contribution made by the Lion’s Social Club of Concepción. These technological resources were installed in a hall of the university’s Central Library, with the objective of improving the academic performance of blind students that enter the university through a special admission quota. Before the onset of this programme, the university had had some experience with blind students, especially in the Law Faculty, with high drop-out rates in the third or fourth term. ARTIUC was a pioneer at the national level to install such a support programme. The programme has become institutionalized and consolidated with time. Today it has more space, better technology, and a multidisciplinary staff to support the processes of entrance, permanence, integration, and the graduation of handicapped students. Moreover, the programme helps to sensitize the different faculties regarding the necessary architectural adaptations and, if needed, any curricular and evaluation adaptation requirements for these students. Today, students from 20 different majors in the areas of pedagogy, social sciences, humanities, law, and civil engineering participate in the programme. In total, 42 students have access to the programme.
Contribution of CFT to Social Development in the Region
309. Some Technical Formation Centres (CFT) are located in zones of high social vulnerability. The technical formation centres located in zones of high social vulnerability in the Bío Bío Region are considered to have a high impact on social development. The “social role” played by some CFT was specially stressed by some qualified informers. This is the case of the Centro de Formación Técnica Lota-Arauco, created by the Universidad de Concepción in 1997 as part of the Plan to Recover the Coal Mining zone. As of 2008, almost 5,000 students from the communes of Lota and Coronel and the Arauco province have acceded to higher technical education in this institution (see Box 5.2). Other experiences are the Instituto Tecnológico UCSC, created by the Universidad Católica de la Santísima Concepción, in the city of Cañete and the Centro de Formación Técnica CEDUC, created by the Universidad Católica del Norte in 2007, in the Lebu commune. No other HEI exist in these zones, and there are families that cannot afford to pay the transportation and lodging costs for their children to study in the cities where most HEI are located. These centres offer students the opportunity to acquire, in a short period of time (2 years), a technical formation, thereby enhancing their possibilities of finding work or continuing their education. The impact in terms of student enrolment is important.
310. The social valuation of technical careers offered by CFT in zones with high social vulnerability is low. According to the qualified informers, although the activity developed by these centres is declared to be highly valuable, the “signals” given by the national higher educational policy tend to favor university majors, to the detriment of technical careers.

70
Box 5.2: The Technical Formation Centre CFT Lota Arauco. Human Capital Formation in a Highly Vulnerable Population
In 1997, the CFT Lota Arauco was created and it began functioning in 1998. This is a project of the Corporation Universidad de Concepción and its objective is to give the young people of the Arauco Province a high quality technical formation. This project was initially seen as a fundamental component of the Restructuring Plan for the Former Coal Zone. From this zone, 4,000 students graduate annually from high school and no more than 400 graduates from higher education. Funding comes from the Universidad de Concepción, and an important part comes from the State through stipends and fee subsidies. The CFT has operated for 11 years with 10 majors and 1,500 enrolled students. The centre is adequately equipped with classrooms, laboratories, and more than 300 computers. To date, almost 5,000 students have gone through the institution. Of these, 41% have been female students. Due to this project, an important number of young people have obtained a higher technical degree. People primarily from Lota and Coronel make use of the opportunity to pursue higher studies with public funds. The socioeconomic conditions of the students that come to this institution justify the public support given to this project. Many of the students, who would only have to pay 15% of the student fee with the CORFO subsidy, cannot study because their family income is too low. The socioeconomic conditions and relatively high transport costs prevent this institution from attracting more students from communes such as Lebu, Cañete, Arauco, Contulmo, Tirúa, and Curanilahue, which form part of the Arauco province. The CORFO stipend does not consider transport, lodging, and food costs.
Other HEI Activities that Contribute to Social Development
311. Professional internships make an impact. There is a general trend for the different professional majors and programmes offered by the regional HEI to develop internships in local workplaces and institutions as part of their academic requisites. This situation has a double positive impact on social development. On the one hand, students learn from “real life” experiences in places such as hospitals, schools, etc., and become familiar with governmental social programmes. This contributes to a “socially conscious” formation. On the other hand, the centres offering internships increase their professional resources in different areas. Internships in the following areas are emphasized: health services, schools and pre-schools, courts, and governmental social programmes.
312. Universities have created centres for social services and judicial orientation that have impacted the community. A growing tendency can be seen among universities, both CRUCH and private, to create open centres for public assistance in areas such as oral hygiene, mental health, nutritional care, and socio-educational dimensions, among others. In turn, their students acquire working experience at these centres. This effort constitutes a direct impact on social well-being, since the costs of these community services are highly subsidized.
The Contribution of HEI to Cultural Development in the Bío Bío Region
Cultural Conditions in the Bío Bío Region
313. According to regional statistics about artistic, cultural, and sports development, the Bío Bío Region ranks in the middle of the different Chilean regions (PNUD, 2002), being second in folk and local festivities and in the number of volumes in university libraries; fourth in open book markets, theatre, and movie festivals; fifth in spaces for cultural events; sixth in art projects (FONDART); and seventh in number of historical monuments (see Table A.5.9). With regards to strengthening the indigenous identity, in spite of the fact that 3% of the population has recognized ethnical origins, only 0.6% of the population participates in organisations linked to ethnical and indigenous development. Finally, in general, the regional population’s participation in cultural events and activities is low in comparison to the national averages (see

71
Table A.5.10). Only 3.8% of the population participates in community organisations and in art and cultural events (INE, 2006).
HEI Policies for the Development of Culture and Arts
314. HEI have explicit community relations policies. The review of secondary information revealed that several HEI have explicit community relations policies. The traditional universities maintain explicit policies for the dissemination of academic and cultural expressions, as reflected in their strategic plans and the activities they offer to the community. In the survey applied to regional HEI, university representatives declared that these cultural dissemination actions also connect them with the social environment. Moreover, for the students, these actions act as complementary activities to the formal curricula, providing them with an integrated formation. All HEI consulted agreed that the contribution of the CRUCH universities is very important for the regional development of arts and culture (see Table A.5.11). It is apparent that the CRUCH universities develop more actions and activities related to cultural development, they have more communications means, more under- and postgraduate programmes related to arts and culture, and they are the only ones that participate in the FONDART fund (National Fund for the Development of Arts and Culture) (see Table A.5.12). Moreover, specifically, they agreed that the University of Concepción is highly important in connecting the community with cultural events (see Box 5.3). In contrast, private universities and professional institutes self-report that they are institutions that give importance or medium importance to the task of developing regional arts and culture.
Box 5.3: The Symphony at the Forum. Symphonic Orchestra of the Universidad de Concepción
The symphonic orchestra of the Universidad de Concepción was created in 1952 as a “Group of Chamber Music of Concepción”. This group performed concert seasons for six years. In 1958, the Directorate of the Universidad de Concepción incorporated it into the institution, with the aim of forming a symphonic orchestra. Since then, it has provided an instance for professional development for symphonic musicians in regions. The cultural impact of this symphonic orchestra has become more massive with time, attaining wider audiences. As a consequence of the growing activities developed by this orchestra in the university forum (an open space), people have been able to enjoy symphonic concerts free of charge. This has been part of a public relations policy developed by the Universidad de Concepción that attempts to give access to and disseminate cultural expressions to wider audiences. In recognition of its trajectory, in 2004, the orchestra was awarded the President of the Republic Prize in National Music, in the classical music genre. Today, this orchestra is administered by the Corporation Universidad de Concepción.
315. The universities participate in regional art and culture councils. The universities participate as active members of the relevant State institutions such as the Art and Culture Council, Regional Cultural Secretary, Consulting Committees, etc. In particular, the institutional setting of the Art and Culture Council allows participation at the national and regional levels, leading to policies that better reflect the regional demands and needs.
Cultural Areas Covered by the HEI
316. The regional universities promote the development of arts and culture in various areas (see Tables A.5.13). One traditional regional university has oriented its artistic and cultural contribution to the development of literature, painting, and music. Another has emphasized theater and the conservation of heritage. In general, the qualified informers assess positively the contribution of HEI to arts and cultural expressions in the region. However, some informers indicate that it is necessary to increment the supply of undergraduate studies in certain cultural areas in which a demand exists. Evident demands exist in some areas (e.g., scenic arts) that have

72
long been left out of the available course and programme supply of the regional HEI. Moreover, the effort laid out by the regional HEI for the development of more traditional art and cultural expressions is perceived as inadequate.
317. Art and cultural infrastructure is open to the local community. The qualified informers reported that the HEI make an important contribution to the cultural and artistic supply of infrastructure available to the regional community. Mainly, the universities concentrate an important portion of available infrastructure and spaces for artistic and cultural activities (see Table A.5.13).
318. The HEI contribute to cultural development through the ownership of mass media. Some traditional universities own mass media (e.g., television, radio, newspaper) and have a permanent presence in the regional media. This increases access to information for the community and these media allow the HEI to generate and provide access to information with more regional and local pertinence.
319. The formation of cultural managers is insufficient. The development of cultural expressions is hampered, in part, because artists and people connected to the cultural world often lack competences in planning, administration, and resource development. The HEI could help overcome this problem by offering undergraduate and postgraduate courses or programmes in the management of cultural development.
320. More research is needed in cultural expressions. Only a small research group works in this area and more investigation is needed. The HEI could develop internal incentive mechanisms for the development of research teams on cultural subjects.
The Contribution of HEI to the Development of Sports and Recreation
321. The HEI contribute to regional sports development. The HEI have increasingly strengthened actions to promote sports activities, as a part of their students’ integral formation and the development of social attitudes and abilities. Moreover, they have increased the supply of spaces and places for sports and recreational activities. This has impacted not only the development of sports in the region, but also the opportunities to develop these activities for the regional population. The qualified informers reported that the Professional Institutes (IP) organize sports tournaments for their students and that are open to the participation of students from local primary and secondary schools. Finally, the offer of physical education programmes was listed as an additional contribution to the development of sports in the region (See Table A.5.14).
The Contribution of HEI to Environmental Development in the Bío Bío Region
Environmental Conditions in the Bío Bío Region
322. The Regional Strategy for Development (Gobierno Regional, 2009) and other secondary information allowed us to diagnose the environmental conditions in the Bío Bío Region. The main conclusions indicated that, despite improvement in the management of environmental problems in recent years, various types of environmental risks still exist in the region. Some of these are soil degradation due to monocultures, reduced marine biomass due to polluted bays, atmospheric pollution from industrial activity, potential damage to local ecosystems through the construction of hydroelectric power plants, and risks associated with fuel distribution, garbage dumps, and stocking areas. Therefore, more research, innovation, intervention, formation, and inspection are required in terms of environmental matters.

73
Contribution of HEI to the Development of Environmental Sustainability
323. The HEI support research on environmental matters. A large body of knowledge on regional environmental conditions has been compiled through the research efforts of the regional HEI, which have the research teams and equipment necessary to generate information and analyze several regional environmental issues (see Table A.5.15). Moreover, a certain level of specialization exists among the HEI, since each institution has focused on different aspects of environmental sustainability. For example, the Universidad Católica de la Santísima Concepción (UCSC) has a Centre of Maritime and Harbour Research (CIMP) that focuses on research about the organisation of coastal border territories, and a Regional Centre for Environmental Studies (CREA) aimed at the study of marine populations and marine ecology. The Universidad de Concepción has a Centre for Environmental Sciences (EULA), which develops research on environmental impacts and offers a doctoral programme in environmental studies with specialization in aquatic systems, territorial planning, and environmental engineering (see Box 5.4). This university also has a Programme of Renewable Energies (PER-UDEC) and collaborates in the BIENERCEL Consortium, which works with bio-fuel production using forest biomass. The Universidad del Bío Bío has a Centre of Wood Technology that contributes to the development of products with higher added value in the forest industry, and an Urban Laboratory, oriented toward territorial and urban ordering. The Universidad de San Sebastián has a Centre for Rescuing and Rehabilitating Wild Animals and a Recovery Project for the pond “Tres Pascualas”. The Universidad del Desarrollo has a Centre for Environmental Engineering Studies (CEIA). Notwithstanding, the quantity of researchers in environmental areas is still low. In particular, there is a lack of researchers in soil and environment (CEUR, 2008).
Box 5.4: The International Europe Latin America Centre for Research and Formation in Environmental Sciences (Centro EULA Chile)
EULA was created in 1990 as an inter-university cooperation project between Italy and Chile for the management of the hydro resources in the Bío Bío basin and the adjacent marine area. Today, EULA is a research, formation, and public relations institution in environmental sciences. It is characterized by multi- and interdisciplinary organisation that is oriented towards scientific research of aquatic systems, environmental engineering, and territorial planning. It is also oriented to the formation of human resources for environmental analysis, with a Ph.D. programme in Environmental Sciences with a mention in Continental Aquatic Systems; a Master’s programme in Integrated Management, Environment, Labour Hazards, and Social Entrepreneurial Responsibility; and a professional degree in Analysis and Environmental Management. For the provision of services, EULA uses its infrastructure, laboratories, and field equipment, but also operates in an integrated manner with the laboratories and services of the different (16) faculties of the Universidad de Concepción. This boosts its consulting capacities in different areas such as water quality, hydrologic and soil use studies, bio-aquatic and terrestrial evaluations, etc. Consulting is an efficient means to link the researchers with the regional and national reality. During its 19 years of operation, the centre has created a wide base of knowledge on the environmental issues at the regional and national level. Its activities have favoured numerous research and technological transfer activities, thus contributing to regional development.
324. The HEI offers programmes in the environmental sciences. Recognized post-graduate formation programmes are available in environmental matters (e.g., the EULA doctoral programme). However, in general, the HEI are increasingly interested in including environmental matters in educational programmes and dissemination actions within the community (see Table A.5.16). However, according to some informers, environmental sustainability does not appear to cross all academic curricula, as they feel it should. This situation is widespread in undergraduate programmes and specific to areas of law and engineering studies at the postgraduate level. Moreover, specialists are lacking in different
74
environmental areas, including environmental supervision and enforcement, air quality, and participative planning.
325. Research done by the HEI has impacted environmental policies and actions. One example of this is the sustained monitoring of water quality over 12 years by the EULA Centre; this has provided empirical support for the formulation of the Norms for Water Quality. Moreover, there is increasing interest in the development of alternative energy technologies based on research in alternative energy sources. Regional territorial ordering and planning has been based on the research developed by the regional HEI. The Centres of Biotechnology at the traditional universities have aided regional environmental sustainability. However, according to some informers, the regional private and public sectors have failed to take full advantage of the capabilities and opportunities for environmental sustainability available through the HEI.

75
CHAPTER 6. CAPACITY BUILDING FOR REGIONAL COOPERATION
This chapter analyzes the capacity for building regional cooperation. The first section describes the institutional setting for promoting development in the Bío Bío Region. The second section discusses the existing mechanisms that allow the participation of the regional HEI in the promotion of regional development. The third section presents the analysis of interviews applied to regional authorities and agents in charge of economic promotion in the Bío Bío Region. This section presents the opinion of regional authorities on the importance of cooperation among HEI, their views about the most important obstacles to cooperation, and the efforts that have been made at the regional level to overcome these. The fourth section presents the vision of the HEI regarding the importance they give to participation in processes that promote regional development, and the form in which they respond and adapt to social requirements. Fifth, this section analyzes the principal obstacles to the development of collaborative work among regional HEI. Finally, in the last section, we discuss some aspects for which we did not find information that could be used to derive any reliable results.
The Institutional Setting for the Promotion of Productive Development Processes in the Bío Bío Region
326. Regionally, the political representative of the President is the Intendente, as mentioned in Chapter 1. The organism in charge of the regional administration is the Regional Government (GORE), headed by the Intendente and consisting of the Regional Council (Consejo Regional, CORE), a decision-making, normative, and supervising organism. This council is composed of 22 members that are elected on a communal basis and represent different political parties.
327. Historically, the promotion of economic and productive development has been done with a national focus, without incorporating regional priorities into policy making. The main agency in charge of economic and productive development at the national level has been CORFO. Using a network of regional representatives and private-public committees, CORFO has been promoting productive development since 1939. The current committees held by CORFO include: Sistema de Empresas, Chile Calidad, Chile-Suecia, Consejo Nacional de Producción Limpia, Innova BioBio, Seguro Agrícola, and Imagen País.
328. Since 2006, the implementation and execution of activities promoting regional development are the responsibility, principally, of the Regional Agency for Innovation and Productive Development (Agencia Regional de Innovación y Desarrollo Productivo, ARIDP), whose goal is to incorporate regional leadership into the promotion of regional development. It should be noted that, although these agencies have been created for all the regions of the country, only the Bío Bío Region has introduced the concept of innovation into its name, demonstrating that the regional authorities consider this to be a central aspect of development efforts in the region. Moreover, the ARIDP has also been pioneer in the country, incorporating the private sector and HEI into its functioning. These agencies were constituted as CORFO committees with the aim of providing them a flexible institutional framework.
329. At the national level, the regional agencies for productive development (ARDP) have the following goals:

76
• Install local capacities through “Networks of Competitive Intelligence.” The agencies are in charge of promoting collaboration between the higher capacities in each region, thereby forming qualified working teams. All agents able to contribute to regional development should actively participate in these “networks of competitive intelligence”. The exchange of information within these networks should drive entrepreneurial and development initiatives.
• Build, validate, and promote regional agendas for productive development. The agencies are responsible for defining a regional agenda for productive development based on local productive aptitudes and according to the Regional Strategy for Development and the regional government’s programme. This agenda should be constructed and validated through the use of mechanisms that promote region-wide participation and generate a consensual strategic view. This view should guide entrepreneurial, innovation, investment, promotional, and development actions from both the public and private sectors. Moreover, the agency should generate a monitoring system for the agenda and give periodical public accounts of the progress made.
• Coordinate the supply of productive promotion programmes and articulate initiatives of public and private interest with territorial impact. A central purpose of the agencies is to stimulate agreements and commitments between public and private agents to develop initiatives that increase the regional economy’s competitive capacity and strengthen clusters and territories through the integrated supply of public promotional instruments. This should avoid the duplication of efforts by different agencies and result in synergies. In the same manner, the agencies must promote greater articulation of local productive networks and favour the integration of complementary productive promotion programmes.
• Provide information on regional productive opportunities. Another goal of the agencies is to provide information about the local productive situation, reporting the comparative advantages and opportunities of sustainable businesses offered by each region, also providing guidance in terms of the entities supporting productive development in each territory.
• Favour an environment that promotes business and entrepreneurship. The agencies should generate territorial and institutional conditions that foster an appropriate environment for productive and sustainable development. To this end, they should use resources and capacities to acquire managerial expertise that will help overcome shortcomings in infrastructure, the quality of human resources, R&D, the regulatory framework, financing, environmental issues, and other areas essential for regional competitiveness. By the same token, the agencies can assist the regional government in the process of coordinating important investments for productive development.
• Develop inter-regional and international cooperation. Inter-agency and international cooperation are important fields of competence for the agencies. Projects and opportunities for productive development that incorporate these cooperative models are privileged in an effort to attain synergies between larger territories.
330. In the Bío Bío Region, ARIDP depends administratively on CORFO. However, unlike CORFO, which is a regional representative of the national institution, ARIDP is regional in nature with the main goal of incorporating regional public and private stakeholders in the regional decision making processes. The ARIDP has three different entities to promote innovation and productive development: the Regional Council for Science and Technology (CORECYT), the Fund for Technological Innovation in the Bío Bío Region (INNOVA-BIOBIO), and the Under-Committee for Innovative Productive Promotion.

77
331. CORECYT is in charge of planning and promoting regional policies for scientific and technological innovation. For this purpose, CORECYT incorporates private businesses and universities in its directory. We present some details about its functioning in Box 6.1.
Box 6.1: The Role of CORECYT in Capacity Building for Regional Cooperation among HEI
The Regional Council for Science and Technology (CORECYT) was created in the Bío Bío Region in May 2004 as a public-private entity serving as an advising body for the Regional Government. CORECYT is in charge of planning and promoting regional policies for scientific and technological innovation. Its directory incorporates private businesses and universities, with two regional council members from the regional government (GORE), four from the public sector, four from the private business sector, four from universities (Universidad del Bío Bío, Universidad de Concepción, Universidad Católica de la Santísima Concepción, and Universidad Técnica Federico Santa María), and one member from the ARIDP. With the aim of including other actors, a wider council was created in which other HEI participate. Through meetings and different activities, CORECYT offers the regional HEI the greatest possibility for interaction and participation in the promotion of regional development. One of the main results of CORECYT was the definition of a Regional Policy for the Promotion of Science and Technology in the Bío Bío Region. The strategy of this policy is to position science and technology as a key factor for economic, environmental, and social development in the region. The policy agenda includes several activities and action programmes, amongst which we find the promotion of associative activities between private firms, government, and HEI; the positioning of science and technology at the service of key regional economic sectors; regional capacity building (physical and human) for the promotion of science and technology; and the promotion of access of SME to science and technology. Since 2007, CORECYT has been incorporated as one of the working areas of the ARIDP.
332. INNOVA-BIOBIO is an institution that provides financial support for innovation, technological transfer, and the development of technological capacities in the region in order to contribute to regional competitiveness and generate employment opportunities. To fulfil its goals, INNOVA-BIOBIO works closely with business firms, technological institutes, foundations, and HEI from the Bío Bío Region. At present, INNOVA-BIOBIO has four financial lines: (1) pre-competitive innovation and public interest; (2) entrepreneurial innovation; (3) technological transfer; and (4) entrepreneurship. This institution directs its activities at priority sectors, as defined by the regional agenda of productive development. Currently, these priority sectors are the wood industry, aquaculture, fishing industry, agricultural industry, metal-mechanics, and the service industry.
333. Finally, the goal of the Under-Committee for Productive Promotion is to meet the goals of regional development by coordinating the promotion network and the different financial instruments existing at the national level. In 2008, $550 million Chilean pesos (almost 1 million US$) were invested in 25 projects. Of these, 11 were associative promotion projects (PROFOS), 11 were programmes for the development of dealers (PDP), two were programmes for quality promotion (FOCAL), and one was a pre-investment study for marine resource management. All the projects were directed towards regional priority sectors.
334. Financing the design and implementation of regionally determined regional development policies is problematic. According to several opinions given during the interviews, one of the biggest challenges encountered in the promotion of regional development has been the lack of funds assigned through regional decision-making. Only the National Fund for Regional Development (FNDR) is designated through regional decision-making. This fund is administered by the regional government and the Under-Secretary of Productive Development (SUBDERE). The organic constitutional law on Regional Governments and Administration defines this fund as “a public investment programme with territorial compensatory ends, aimed

78
at funding actions in different fields of regional social and economic infrastructure, with the object of obtaining homogeneous and harmonic territorial development” (own translation).
335. However, the regional government is not entitled to transfer resources from the FNDR to other public entities, such as ARIDP. Therefore, in order to fund promotion activities developed by ARIDP, the GORE uses alternatives such as assigning part of the national funds through CORFO. Thus, the principal financial instrument supporting the actions of the ARIDP is a regionalized assignment of the Fund for Innovation for Regional Competitiveness (FIC). This funding is assigned through the law that approves the general budget for the Chilean Government. In particular, in 2008, $20.226 billion pesos (approx. US$ 37 million) were assigned to all the regions in the country. About 6.5% of these resources ($1.316 billion pesos, approximately US$ 2.35 million) were assigned to the Bío Bío Region, occupying the 9th place among the 15 Chilean regions. The three regions that obtained a higher share on this fund were Antofagasta (13.6%), Valparaiso (8,8%) and Coquimbo (8%).
336. Another instrument that the ARIDP uses to promote regional development is the Plan for Improvement of Competitiveness (PMC), which promotes industrial clusters in priority areas. When the agencies were created and launched, three sectors were defined in each region as priorities for regional development. In each of these sectors, an industrial cluster, funded by a PMC, has to be developed. The ARIDP defined “Education, Science and Technology”, “Tourism”, and “Food Industry” as priority sectors for the Bío Bío Region. It is important to notice that these sectors differ from the priority sectors for INNOVA BIO BIO, because the ARIDP sectors have as goal the creation of three industrial clusters while INNOVA sectors are more specific intending to promote innovative productive projects within those areas. INNOVA sectors were defined in 2001 while ARIDP sectors in 2008.
Mechanisms that promote the participation of higher education institutions (HEI) in regional development
337. In this section, we look at how the HEI participate in the identification and definition of priorities for regional needs. Moreover, we discuss the level of knowledge that the regional authorities have on the existing research and innovative capabilities of the regional HEI, and the role that the HEI play in regional development planning.
338. We have identified four principal mechanisms through which the regional development priorities are defined (see Figure 6.1). First, the central government defines priorities that are implemented by the Intendente and the different public offices with regional headquarters. Second, long-term regional plans are expressed in the Regional Strategy for Development, whose execution depends on the Regional Council (CORE), the highest entity in the Regional Government. The third mechanism is organized community demands, which are presented through public-private task forces (mesas de trabajo publico-privadas). In particular, the Territorial Management Plans (Planes de Gestión Territorial), headed by the Territorial Development Programme (PDT), are designed to capture the specific development priorities of the different territories in the region. Fourth, a series of forums and private organisations contribute to the public debate, highlighting issues that are of specific interest. These organisations include the Industrial Corporation for Regional Development (CIDERE BIOBIO), the Corporation for the Regionalization of the Bío Bío Region (CORBIOBIO), and the Chamber of Production and Commerce of Concepción (CPCC), amongst others.

79
Figure 6.1 Organizations in Charge of Promoting Economic and Productive Development in the Bío Bío Region
REGIONALGOVERNMENT
PDTARIDP(Agency)
CORECYT
INNOVA BIOBIO
Fomento Productivo
Other Public-PrivatesTask Forces
Private Entities
CIDERE
CORBIOBIO
Other
Reconversión
Pencopolitano
Secano InteriorDe Concepción
Biobío Centro
Arauco
Biobío Cordillera
Secano Costero
Laja Diguillín
Punilla
Territorial Task Force
Public-Privates Task Forces
Territorial Task Force
Public-Privates Task Forces
Territorial Task Force
Public-Privates Task Forces
Territorial Task Force
Public-Privates Task Forces
Territorial Task Force
Public-Privates Task Forces
Territorial Task Force
Public-Privates Task Forces
Territorial Task Force
Public-Privates Task Forces
Territorial Task Force
Public-Privates Task Forces
Territorial Task Force
Public-Privates Task Forces
ChillánTerritorial Task Force
Public-Privates Task Forces
Source: Own design.

80
339. Some HEI participate in these different mechanisms. In general, the largest traditional universities (Universidad de Concepción, Universidad del Biobío, and Universidad Católica de la Santísima Concepción) have the greatest presence. For instance, a consulting team from the Universidad del Biobío provided methodological guidance for the generation of the Regional Strategy for Development. Additionally, researchers from different universities participate on several public-private task forces. As will be seen later, the HEI also participate actively in the discussion forums developed by private corporations for regional development.
340. We consider the main formal mechanisms for defining regional priorities to be the generation of the RSD and the Agenda for Productive Development of the ARIDP. The HEI participate directly in both instances through paid research teams in charge of elaborating these strategies and indirectly through voluntary participation in different meetings and working groups to define these regional priorities.
341. A second issue dealt with herein is the amount of information that the regional authorities have about the available knowledge capabilities in the region. In general, our interviews with regional authorities show that there is adequate knowledge of the characteristics of the principal HEI and their primary institutional strengths. This has led the regional government to develop a strategy for promoting research and innovation activities that relies on the regional industry of HEI. This has been one of the principal reasons for encouraging the development of ARIDP and CORECYT.
342. Regional medium- and long-term planning recognizes the core activities of the HEI industry as being a central pillar for regional development (Regional Development Strategy, 2008 – 2015), offering proof of its importance for the regional authorities. Thus, education, science, and technology occupy a fundamental position in regional planning. More specifically, in two of its seven strategic lines, the ERD explicitly considers the higher education industry. In fact, strategic line 3 refers to “Education of quality at the service of the persons, social mobility, economic competitiveness, and democratic participation”, and strategic line 4 refers to “Science, technology, and innovation for a dynamic and competitive regional economy, for social development, and for the prevention and mitigation of natural and anthropogenic risks”.
343. In terms of the importance given to the HEI for development promotion, the Regional Agenda for Innovation and productive development of the ARIDP establishes higher education as one of the key sectors for economic development, recognizing the existence of important impacts on other productive sectors such as industrial manufacturing, forestry, fishing, and tourism, among others. The agenda also highlights that the higher education industry presents a high level of competitiveness and constitutes a mature industry with very high growth rates in recent years. Additionally, the agenda mentions that the HEI industry presents highly productive human resources, an adequate regulatory framework, adequate public infrastructure, and no important internal or external conflicts.
344. The agenda summarizes the great importance assigned by the ARIDP to the industry of HEI, which it considers to be a key sector for promoting innovation and productive development in the region. Moreover, it neatly presents the view that the ARIDP has on the advantages of this industry.
345. Perhaps for the previous reasons, the first of the PMC programme to develop priority sectors, “PMC Biobio Educating and Innovating”, is in the area of higher education (see Box 6.2). This PMC is composed of a managing group in which authorities from the Universidad de Concepción and Universidad Católica de la Santísima Concepción participate, as along with one representative from the private business sector and another from the government. This programme will launch different projects with an investment of over $7.213 billion Chilean

81
pesos (almost US$ 13 million) that comes both from the public and private sectors; the goal is to finance initiatives that support and promote the educational sector.
346. Other than those previously mentioned, we have no knowledge of other signed agreements among regional HEI with the goal of contributing to regional development. Similarly, there are no known joint marketing initiatives among the HEI to promote the region or to attract human capital to the region. In the next section, we will discuss, among other things, the views of the HEI about cooperation with other institutions and we will present the main factors that explain the low level of cooperation among them.
Box 6.2: A Cluster in Higher Education, Science, and Technology, Bío Bío Educating and Innovating
One of the main goals of the ARIDP Agency is to define and create industrial clusters in three priority productive areas in the region. After a study conducted in 2008 that set out to define regional priorities, a programme called Bío Bío Educating and Innovating was created to develop a cluster in the area of Higher Education, Science, and Technology. This cluster was funded as a Programme for Improvement of Competitiveness (PMC) with funds from the ARIDP for the years 2008-2010. This funding amounted to almost 10 billion pesos (about 20 million dollars) for three years. The programme has a manager hired by the ARIDP and a management committee integrated by representatives from two universities (Universidad Católica de la Santísima Concepción and Universidad de Concepción), and representatives from four private firms related to the areas of science and technology. Additionally, high technology firms, HEI, and other institutions can join the PMC by signing an agreement with the PMC. Currently, there are 20 members that have joined the programme, including seven institutions associated with regional HEI. The initiatives considered for promotion by this programme include a regional promotion campaign, an investment attraction programme, a business centre for competitiveness improvement, a business fair, biotechnological services in the region, TIC services, Centre for the Study of Asia-Pacific Region, aquaculture activities, development of the health industry and a promotional programme, and a Web page with the agenda including regional activities, among others. It is important to note that, at the date of this report, all these programmes were being implemented with no results observed yet. During its first year, the programme consisted of a series of meetings and planning instances to build confidence among the public sector, private firms, and HEI. It is expected that, by the end of 2010, all these initiatives will be implemented and the concrete results observed.
347. A review of the private sector shows that several private entities in the region promote regional development and are relevant for the purposes of the present chapter. One of these entities is the Industrial Corporation for the Regional Development of the Bío Bío Region (Corporación Industrial para el Desarrollo Regional de la Región del Biobío, CIDERE BIOBIO). According to its own description: “CIDERE BIOBIO is a private-held, non-profit company whose goal is to promote, in an integral form and in all its aspects, the development of the geographic zone comprehended by the provinces of Arauco, Biobío, Concepción, Malleco, and Ñuble”(CIDERE BIOBIO, 2008, own translation). In general, CIDERE BIOBIO funds activities of productive and innovative promotion that are aimed principally at rural areas. Moreover, the corporation is also working on forming a task force in Corporate Social Responsibility in the Bío Bío Region. CIDERE BIO BIO is funded by contributions from private firms, including several HEI such as Universidad Tecnológica de Chile INACAP, Universidad Andrés Bello, Universidad Católica de la Santísima Concepción, Universidad de Concepción, Universidad del Biobío, Universidad del Desarrollo, Universidad San Sebastián, Universidad Santo Tomás, and Universidad Técnica Federico Santa María. From this point of view, these HEI participate directly in this corporation and fund the productive promotion projects supported by CIDERE BIOBIO.

82
348. Presently, CIDERE BIOBIO is developing an associative work group with the HEI that are members of this corporation. This entity aims to work towards the development of soft competences among first-year students of the higher education system. This working group is still in its implementation stage and no results have been observed yet.
349. Another of the private entities that promote regional development is the Organisation for the Decentralization of the Biobio Region (Corporación para la Regionalización del Bío bío, CORBIOBIO). This organisation promotes effective decentralization processes that contribute to regional development. Among its most important actions are periodic surveys and campaigns to elicit the regional opinion regarding decentralization issues. Nine HEI are members of this organisation, including CFT Crecic S.A., Universidad Tecnológica de Chile INACAP, IP Virginio Gómez, Universidad Católica de la Santísima Concepción, Universidad de Concepción, Universidad del Biobío, Universidad del Desarrollo, Universidad San Sebastián, and Universidad Técnica Federico Santa María.
350. The creation of the Economic Council of the Bío Bío Region in 2009 is probably the most relevant activity conducted by CORBIOBIO in terms of the participation of the HEI in the institutional setting for promoting regional development. This entity aims to constitute an Economic Council with the goal of generating regional opinion to be presented as proposals to the central authorities when defining priorities to increase competitiveness and productivity in the region. This council consists of representatives from the private sector and the HEI in the region.
351. One national mechanism that promotes the regional involvement of HEI is the accreditation process of the National Accreditation Commission (CNA). The accreditation process consists of institutional accreditation, which includes “links with the community” as a voluntary subject of accreditation. In the region, three universities (Universidad del Desarrollo, Universidad de Concepción, and Universidad Católica de la Santísima Concepción, UCSC) have obtained this voluntary accreditation. Notably, UCSC has created a position of vice-chancellor that is responsible for coordinating all community outreach activities. More details on this are presented in Box 6.3. This is the only way in which regional engagement is monitored and evaluated. There are no other regional mechanisms to monitor and evaluate the regional engagement of HEI.

83
Box 6.3: The Creation of a Community Liaison Vice-Chancellor in the UCSC
In 2008, as part of the accreditation process for the National Commission for Accreditation (CNA), the Universidad Católica de la Santísima Concepción (UCSC) generated an organisational structure change that included the designation of a Vice-Chancellor in charge of coordinating all matters related to the relationship between the university and the external environment. This vice-chancellor is one of the four main areas with a direct link to the University Chancellor, demonstrating the importance that the UCSC has given to the impacts of its activities on the external community; it is the only regional HEI that has incorporated important administrative changes to respond better to regional needs. After this process, UCSC became one of three regional universities to receive accreditation for their links with the external society, a voluntary field of the institutional accreditation. The Community Liaison Vice-Chancellor (Vicerectoria de Vinculación con la Sociedad) is responsible for planning, proposing, coordinating, supervising, and supporting all the units within the university in all the aspects related to ties with the external society. This includes public relations and communication activities with the goal of positioning the image of the university at the regional, national, and international level. One innovative project implemented by English language students of the UCSC, with the support of this Vice-Chancellor, was the English-language training of low-skilled sales employees in small stores in downtown Concepción to provide them with the abilities to communicate with international visitors and tourists. The programme consisted of providing communication skills to the workers in order to be able to answer basic questions, provide guidance, and perform sales in English.
Participation of Higher Education Institutions (HEI) in Regional Development as Perceived by the Authorities
352. The regional authorities were consulted about how they assess the actual level of HEI participation. The opinions were diverse. Some authorities mentioned the high level of participation that these institutions have in CORECYT and active participation by some researchers in the formulation of the Regional Strategy for Development (Universidad del Bío Bío) and in studies to define regional priority sectors for the ARIDP productive development agenda (Universidad Católica de la Santísima Concepción). The participation in the creation of both documents was direct, through the public contracting of research teams, and indirect, with voluntary representatives of the HEI in different meetings and working groups. Some authorities also noted that individual researchers participate on different private-public task forces, such as those for the fishing sector (researchers from Universidad Católica de la Santísima Concepción and Universidad de Concepción) or tourism (Universidad Tecnológica de Chile INACAP). The participation of the HEI in these private-public task forces is voluntary, which might reduce the commitment and dedication in terms of the time the researchers dedicate to the tasks involved.
353. Nevertheless, some authorities pointed out that the contribution of the universities in the forums for promoting regional development is still low. These authorities felt that the HEI should make a greater institutional commitment, participating not only as individual researchers but with more vigorous institutional support. Moreover, although the heads of the HEI often intend to participate in different forums, this intention is diluted at the moment of defining which academic staff will be in charge of implementing the agreements. Therefore, greater coordination is needed between the director and the academic staff, as are greater incentives within the HEI for academic staff to be involved in the promotion of regional productive development. The authorities stated that the HEI assess the performance of their researchers primarily by their scientific productivity and that participation in activities that promote local development is not included in these assessments. Additionally, the authorities reported that the HEI should attempt to collaborate with each other more actively in order to increase the impact of their participation in the processes of regional development promotion.

84
354. The authorities recognize that increasing associations among the HEI and increasing participation in the processes of regional development promotion are complex matters. The main perceptions of why this is the case, are the following:
• Elevated heterogeneity among the HEI with regards to fields of action, types of research developed, and organisational cultures
• High levels of competition among regional HEI, as opposed to competition with HEI from other regions or other countries
• Reluctance on the part of researchers to disclose research results and difficulty in sharing research with peers or firms
• Emphasis on pure basic research on the part of many researchers, without considering the applicability of their results, despite the close ties between the processes of productive development promotion and applied results able to solve existing problems; this makes it harder for firms and researchers to carry out collaborative work
• The lack of adequate incentives offered by the HEI to their researchers for collaborating with other HEI or participating in processes of regional development promotion
• Administrative and legal obstacles that impede greater participation
355. To facilitate associative processes and augmented participation of the HEI in promoting economic regional development, the authorities have considered the creation of a Regional Council for Higher Education. This should be a forum for continuous discussion among the HEI to develop common development strategies for the HEI industry. Notwithstanding, there is as yet no consensus regarding the necessity to create this council.
356. Another attempt to promote collaborative work between the HEI was a call by CORECYT to fund associative projects between regional universities, under the FIC. Several projects were presented, but most of them lacked the fundamental component, which was precisely an association among HEI. A consortium formed by the Universidad Católica de la Santísima Concepción, Universidad del Biobío, and Universidad Técnica Federico Santa María presented an associative project to develop a management model between HEI. This was the only project awarded with funding. This project includes a study of automation, a study of human capital formation in innovation and entrepreneurship for public and private institutions, a study of training in innovation and entrepreneurship oriented towards teachers of technical-professional secondary education, and a study of the labour market for advanced human capital.
Internal Analysis of the Participation in Regional Development by Higher Education Institutions (HEI)
357. This section is based on the analysis of the fifth section of the survey on the Bío Bío Region’s HEI. This survey elicited primary information from the HEI in different fields related to this study. The present results are based on the responses of the 12 HEI that participated in the survey. Of these, four are “traditional” (CRUCH) universities, four are private universities (UP), and another four are technical formation centres and professional institutes (CFT&IP). For the analysis of the results, the institutions have been classified into these three groups.
358. A first query was directed at identifying the institutions/instruments that the HEI believe to be the most important for defining and identifying regional priorities. They could rank each one of these as very important, important, somewhat important, or not very important. All institutions indicated that the Regional Strategy for Development was the most important instrument in defining regional priorities. The Regional Agenda for Innovation and Productive Development came in second place (very important for 10 institutions and important for the

85
other two). In third place were the public-private task committees. Table A.6.1 presents the relative answers of the different HEI to this question.
359. A second query was made as to the participation of the HEI in funds that finance projects with a direct impact on regional development. The results show important differences among the types of HEI. First, all CRUCH institutions participated in the four funds mentioned (FNDR, FIC, INNOVA BIOBIO, and CORFO). The UP, on the other hand, have only participated in INNOVA BIOBIO, and the CFT-IP have only participated in CORFO. Table 6.1 shows these results.
360. All of the HEI report participating in entities that promote regional development, collaborating directly or indirectly in the formulation of the Regional Strategy for Development and the Regional Agenda for Innovation and Productive Development. Additionally, all the CRUCH universities have participated actively and the UP passively in CORECYT. Moreover, the CRUCH and UP report having participated actively in CIDERE, CORBIOBIO, and several public-private task forces (e.g., task forces for education, science, and technology; information technology design; apiculture; entrepreneurial social responsibility; tourism; advanced polymers; energy; biotechnology; Chile Califica; and IRADE). In this regard, we consider direct participation to be direct involvement in the previously mentioned working groups and indirect participation to be when the institutions are invited to different meetings and workshop prepared by the working groups. The complete list of instances and working groups is presented in Table A.6.2.
361. We asked the HEI whether they feel that the regional authorities recognize and promote their participation in regional development, and through which mechanisms this is done. All institutions responded positively to this query, mentioning the following mechanisms:
• Invitations to participate in different forums, calls, competitive funds for HEI, technological missions, etc
• CORECYT and ARIDP
• Invitations to participate on public-private task forces
• The formulation and coordination of activities between HEI

86
Table 6.1 Participation in Public Funds with Direct Impact on Regional Development
(% of Institutions by Type and Year)
FUND CRUCH Private Universities Technical Formation Centers –
Professional Institutes 2004 2005 2006 2007 2008 2004 2005 2006 2007 2008 2004 2005 2006 2007 2008
FNDR 25 50 25 25 50 - - - - - - - - - - FIC - - - - 50 - - - - - - - - - -
INNOVA 50 50 50 50 50 25 50 - 25 50 - - - - - CORFO 50 50 50 75 50 - - - - - 25 25 25 25 25
Source: Own elaboration using Higher Education Institutions survey, 2009. Note: CRUCH (Council of Rectors of the Chilean Universities).

87
362. When asked about the orientation of regional headquarters of national HEI to local matters, all HEI indicated that the existing regional HEI headquarters have a clear regional orientation, and almost all listed different initiatives that include regional needs and priorities as part of their institution’s activities in different fields. The list of the initiatives for each institution is presented in Table A.6.3.
363. With regards to the availability of specialized staff for the formulation and participation of activities related to the promotion of regional productive development, nine of the 12 HEI stated that they have a particular person in charge of the institution’s formal participation in the process of productive promotion. Additionally, seven out of 12 HEI have a special office in charge of the different applications to different competitive regional funds.
364. Another of the assessed items was the percentage of the HEI budget that is decided regionally. For the CRUCH universities, this was between 75% and 100% of the budget. One UP reported that less than 25% of the budget was decided regionally and another that this figure was between 50% and 75%. Finally, for two of the CFT-IP institutions, less than 25% of the budget was decided regionally and for the other two this was between 75% and 100%.
Obstacles for collaboration among regional HEI
365. Herein, we analyze an issue that emerged as important during the execution of the present study, which are the observed and perceived difficulties for collaboration between regional HEI. This analysis is based on the survey of HEI in the Bío Bío Region, presented in the previous section.
366. We asked what the HEI perceive to be the reasons for difficulties in collaborating and developing associative work between different HEI. We were interested in comparing these answers to those given by other regional agents, also reported in a previous section. The following reasons were mentioned:
• Institutional egoism and serious conceptual differences about the role of the institution in higher education
• Different styles, rhythms, and aims among HEI, which implies high costs of time association to achieve results
• Lack of time and available resources, and lack of cooperation with the business sector
• Distrust and asymmetry in terms of the resources assigned to the regional HEI, with the Universidad de Concepción capturing a large amount of the resources available at the national level
• The distinction between CRUCH HEI and other HEI excludes the private universities from entities such as CORECYT
• The competition between private and traditional universities for students and government funds
• Lack of staff and time for developing collaborative activities, lack of information, and the existence of high institutional bureaucracy
367. The perceptions of the HEI about the obstacles for collaboration are similar to those of the other agents presented previously. However, some new perceptions arise. One of these, raised by the private universities, is the negative perception of the differentiation between traditional and private universities. Another important issue is the asymmetry in the assignment

88
of public funds to different universities, with the Universidad de Concepción receiving much more funding than the other universities. This obviously makes integration more difficult. Also, some issues such as “institutional egoism” and the existence of “different views” about the aim of higher education are suggested. This can be interpreted as competition to sustain a dominant position in the market and the perception that the CRUCH universities work for the development of education as a public good, whereas the private universities are oriented towards education as a fundamentally private good.
368. To delve further into the preceding issue, we asked the HEI to consider their relationships with other HEI, dividing the query into different categories: CRUCH, UP, and CFT-IP. We asked the HEI to indicate whether they consider the relationship to be one of “strategic competitor”, “strategic ally”, or “not related” in the following fields: academics, research, community relations, student recruitment, obtaining external funds, and promotion of the regional image.
369. The CRUCH universities declared scarce relationships with the CFT-IP. All four institutions reported that they are not related with respect to academics, research, community relations, and obtaining external funds. Two out of the four CRUCH institutions consider themselves to be strategic allies with respect to the promotion of the regional image. In the field of student recruitment, one CRUCH university reports that they are strategic competitors, one that they are strategic allies, and two that they are not related.
370. The assessment changes when CRUCH universities respond in terms of their relationship with UP. The highest proportion of answers is concentrated in the non-related option. However, two universities consider the UP to be competitors in terms of academics and student recruitment and one in community relations and obtaining external funds. Additionally, one university considers these institutions to be allies with respect to research and two with respect to promotion of the regional image.
371. A completely different assessment arises when one asks the CRUCH universities about other CRUCH universities. Here, the assessments are concentrated in the categories competitors and allies. All four universities consider other CRUCH universities to be allies in research, three consider them to be allies in academics, community relations, and promotion of the regional image. However, in terms of student recruitment and obtaining external funds, three of the four CRUCH universities consider the other CRUCH universities to be competition.
372. When the UP universities were asked about their relationships with other HEI, the results were similar to those obtained for the CRUCH universities regarding their relationship with the CFT-IP. That is, the majority responded that they are not related in almost any fields, and they only consider the CFT-IP to be competitors in terms of student recruitment (two of four).
373. When the UP universities were consulted about their relationship with the CRUCH universities, most answers were concentrated in the non-related option. Here, three of the four institutions reported no relationships in matters of promotion of the regional image and two of the four in those of academics, research, student recruitment, and obtaining external funds. Additionally, two of three UP stated that they compete with the CRUCH universities in academics, community relations, and student recruitment. Moreover, two institutions feel that other UP are strategic allies in research and community relations.
374. The results for the relations these universities have with other universities in the same category, also differ from what we found for the CRUCH universities: three of the four consider that they are strategic competitors with other UP in academics and student recruitment, and two of four report competing in community relations. The majority of these institutions report no

89
relationship in the fields obtaining external funds and research, and two of four consider them to be allies in research.
375. The answers obtained from the survey on CFT-IP are diverse, and it is hard to obtain a clear general picture of how they see their relationships with other HEI. Two of the four report that they compete with other CFT-IP in academics, and three of the four in student recruitment. This last field seems to be the one in which most competition is identified with other types of HEI: three of the four report competition with UP and two of the four with CRUCH universities. The field where there seems to be more interaction as allies, with all other types of HEI, is promotion of the regional image.
376. In summary, the HEI have different relationships with other HEI depending on the type of HEI. Moreover, all three categories consider report scarce relationships between universities and CFT-IP, generally of the non-related type. Additionally, the CRUCH universities consider other CRUCH universities to be allies or competitors, but the UP universities to be mostly non-related. The UP universities consider other institutions of the same category to be competitors, but their view about the CRUCH universities is divided between those that consider them to be competitors and those that consider them to be non-related.
377. The fields that generate the most competition between HEI within each category are academics and student recruitment, i.e., those that refer to competition in staff (workers) and students (clients). This competition seems to be greater within each category than between categories.
378. The major alliances are generated, in contrast, within the universities that belong to the CRUCH in terms of academics, research, and community relations. Additionally, the majority of the HEI consider other HEI to be allies in the promotion of the regional image.
379. The preceding analysis is helpful to understand the conceptions that different agents within the regional HEI have of each other. This information is important for understanding the motivation to collaborate or not collaborate with other HEI. Moreover, the information can be used to identify fields with greater possibilities for collaboration and association among the HEI. The proportion of answers to each one of the subjects discussed previously is presented in Table A.6.4.
380. Another angle to the collaborative issue was obtained by asking the HEI to identify the fields in which they presently develop associative activities with other HEI. Once again, we divided the HEI into three categories: CRUCH, UP, and CFT-IP. The differences detected by type of institutions are interesting. The CFT-IP have very few associative activities and those existing are with CRUCH universities. However, it should be noted that, in the sample, there are institutional/property relationships between some CFT-IP and these universities. Additionally, it seems that UP universities have some degree of association with other universities (CRUCH and UP). The highest level of association is found between CRUCH universities. Moreover, the fields in which associative activities are developed correspond to the fields in which the HEI declared themselves to be strategic allies. The proportion of answers in each category is presented in Table A.6.5.
381. Finally, we asked the HEI about the principal obstacles to developing associative activities in the aforementioned fields, offering them the following options:
• High heterogeneity in terms of scope and type of activities developed by different HEI (heterogeneity)
• Different objective markets (objective market)

90
• No common interests in the objectives of the institutions (common interests)
• High costs of institutional coordination (coordination costs)
• Low association benefits (association benefits)
• Diminish competitive position due to inter-institutional cooperation (competitive position)
382. Once again, the answers were markedly different between different types of institutions. The CFT-IP indicated obstacles related to heterogeneity, objective market, and common interests. All four institutions indicated no common interests for the research field, whereas two institutions pointed out high heterogeneity in their relations with CRUCH universities for community relations, student recruitment, and promotion of the regional image. Additionally, two institutions indicated the option high heterogeneity in their relationships with the UP in student recruitment and obtaining external resources, the option objective markets with regards to community relations, and the option no common interests in terms of academics. Thus, the main reasons given by the CFT-IP for not acting in association with the universities (CRUCH and UP) is that they are oriented to different markets, that they develop different activities, and that they have different institutional aims.
383. The main reasons given by the UP for not developing associative activities were heterogeneity, association benefits, and common interests with the CFT-IP; objective market and association benefits with the CRUCH universities; and coordination costs, association benefits, and competitive position with the UP. In terms of their relationship with the CRUCH universities, they indicated the option objective market as the main reason for not developing associative activities in academics and research, and the option association benefits as the principal reason for student recruitment and obtaining external resources. In relation with other UP universities, the most important options are association benefits in academics and student recruitment, and the option coordination costs in obtaining external resources and promoting the regional image. Thus, the UP gave different reasons depending on the type of institution considered. With respect to CFT-IP, the reasons coincided with those offered by the CFT-IP themselves, in terms of differences in objectives, developed activities, a low association benefits. With respect to the CRUCH universities, the reasons given point to different markets and low association benefits.
384. Finally, the CRUCH universities also gave different answers depending on the type of institution. The motives given for association difficulties with CFT-IP are distributed between the options heterogeneity, objective market, and common interests. The obstacles to developing relationships with UP are primarily due to heterogeneity, common interests, and competitive position. This difference is important because it suggests that the CRUCH universities find more important differences in actions and objectives with the UP universities, and that cooperative activities will reduce their competitive position. This complements and explains the fact, already presented, that the CRUCH universities consider themselves to be strategic competitors of the UP in the fields of academics and student recruitment. They indicate various reasons for the obstacles in their associative relationships with other CRUCH universities, including heterogeneity, common interests, association benefits, and competitive position. The option common interests is important in academics, heterogeneity in research, and association benefits and competitive position in academics and obtaining external resources. Thus, the existence of different objectives and activities between institutions and the low perceived benefits from associations are presented as the important reasons for the low associative activity. Additionally, the institutions feel that associative actions with other CRUCH universities will jeopardize their competitive position.
91
385. Finally, the respondents listed other additional reasons for the low associative activity, as follows:
• Mistrust, perception of superiority of some institutions over others
• Essentially the high competition for resources in all fields
• Factors external to the institutions that affect their relationships, e.g., the design of government policies that generates discrimination within the HEI (e.g. the CRUCH)
• Hegemony of one university that does not consider the other universities to be peers, and that considers that its development is so far beyond the others that it is unable to interact with these
• INACAP has an academic model that differs from the rest of the regional HEI
Other subjects and gaps in information
386. There are many aspects included in the self-evaluation guidelines for which we were unable to find information for each institution. In this short section, we describe the limited information we have about the most important of these areas.
387. We did not detect any cases in which external bodies to the HEI played an important role in internal decision-making within the HEI. Each institution has its own organisational structure: the Catholic Church plays an important role in the Universidad Católica de la Santísima Concepción, the Universidad de Concepción is governed as a private corporation, the Universidad Técnica Federico Santa María is a private foundation, and the Universidad del Bío Bío is publicly owned. All other HEI are private institutions without external bodies affecting their decision-making.
388. We could not find information about evaluations or the mapping of the impact of the regional HE system conducted in the region. This includes specific impacts of the HEI and contributions to local economic development. Nor was any mechanism detected that would raise awareness as to the role of the HEI in the region.
389. We were also unable to find specific information about formal mechanisms through which the HEI and the regional stakeholders communicate or how the HEI make decisions about promoting institutional regional involvement.
390. Even though most of the regional universities have a campus open to the community and some of them use public infrastructure, we could not find any systematic information about how they share their infrastructure with the community or how the community accesses the HEI laboratories, libraries, and sporting and cultural facilities, other than what was mentioned in Chapter 4.
391. When consulted through the HEI survey, the institution representatives that responded did not provide any information on strategic, organisational, managerial, or academic changes with the goal of improving the impact of the institution on regional development. A noticeable exception is the recent organisational change in the Universidad Católica de la Santísima Concepción, which created a vice-chancellor in community outreach, as presented in detail in Box 6.2.
392. The previous paragraph also applies to human and financial resource management practices with a regional impact. We did not detect any examples of practices in which the

92
regional dimension is incorporated into internal management practices within the HEI. The same is true about changes to the organisational culture.

93
CHAPTER 7. CONCLUSIONS: MOVING BEYOND THE SELF-EVALUATION
This chapter summarizes some lessons that can be extracted from the self-evaluation process performed in the Bío Bío Region. First, the self-evaluation process is described briefly. Second, the participation of regional stakeholders in the self-evaluation process is assessed. Third, the vision and expectations of regional stakeholders regarding the potential of the HEI, as perceived by the working group, are summarized. Finally, we analyze the principal challenges that must be met by the regional agents in order to enhance the contribution of HEI to regional development.
A brief description of the self-evaluation process
393. The self-evaluation process for the Bío Bío Region began, in practice, in December 2008, when the working group was completely constituted and its activities began. However, prior to this date, the Executive Committee for the Bío Bío Region was created and the project that allowed financing the self-evaluation process was developed and approved31. Moreover, in the case of this region, an additional committee, the Directive Committee (Comité Directivo), was formed. This large committee allows the representation of an important number of regional stakeholders and meets only on special occasions. A small number of the members of this larger committee constitute the Executive Committee, which meets weekly32.
394. The working group is composed of a team of academic staff from three of the traditional regional universities: Universidad de Concepción, Universidad del Bío Bío, and Universidad Católica de la Santisima Concepción.
Participation in the self-evaluation process
395. The general methodology for the self-evaluation was designed to obtain the most complete and representative vision of the different regional stakeholders regarding the contribution of regional HEI to regional development (see Appendix 1 for the methodological description). The activities included three workshops with regional stakeholders; surveys of regional HEI and business representatives; interviews with qualified informers from the public and private sectors, HEI, and research centres; reviews of existing material such as reports, studies, proceedings, legal documents, etc.; and the analysis and processing of available statistical information.
396. Due to time constraints, the working group included only two workshops in the initial design of the self-evaluation (see Dresdner et al., 2008). However, after the second workshop was finished, the assessment made by the working group and the Executive Committee indicated that the business sector was not well represented in the evaluation; participation by this sector, especially in the second workshop, had been scarce. Therefore, a third workshop was incorporated that focused particularly on this group of stakeholders. This was the workshop developed in May. A total of 71 persons participated in all three workshops.
31 The project was financed by the “Subcomité de Innovación de la Región del Bío Bío” (Under-Committee for Innovative Promotion), code No. 08-IR 438 F10. 32 Appendix 4 lists all the members of the Working Group, the Executive Committee, and the Directive Committee.

94
397. Four surveys were applied to regional stakeholders. The first was a general survey of all HEI in the Bío Bío Region. Each headquarter received a survey form. Of the 27 forms sent to 27 different HEI headquarters, 12 were completed and returned. Two of these corresponded to the same HEI, which has headquarters in Chillán and Concepción-Talcahuano. We tried to improve the reply rate by direct telephone calls and e-mail reminders, without success. The second survey was directed at researchers and research centres (Chapter 3) and was related to innovation matters. In this case, 330 forms were sent, of which 79 were returned completed. The third survey was applied to directors of under- and postgraduate programmes (Chapter 4). We sent 900 forms by e-mail, obtaining 85 responses. The fourth survey was aimed at business people in an attempt to recover the opinion of employers about the competences of the graduates from the regional HEI. This survey was directly applied to business representatives in three different meetings: the first and third workshops and a forestry business meeting held in May in Concepción. We recovered a total of 26 answers from these private (non-HEI) firms.
398. Finally, we performed a total of 36 interviews to different national and regional qualified informers. The interviewed persons are identified in Appendix 1.
The vision of and expectations for regional HEIs
399. In general, we perceived that the self-evaluation process generated interest in the people that participated in the workshops, interviews, and surveys. Moreover, the participants seemed to be aware of the potential importance that the study could have for enhancing future regional development. However, participation rates were not very high. In spite of all the efforts made to incorporate people into the different activities, the participation rate was lower than what the working group initially expected. In our view, this is not because the subject is uninteresting for people, but that there are many different activities “going around” simultaneously, making it hard for people to distinguish which are more relevant. Moreover, we perceived that especially the stakeholders related to the business world are not inclined to participate in this type of study unless they can perceive direct benefits for their business from said participation. All these factors constitute obstacles for future efforts to generate synergies around this project and should be considered in any strategy that attempts to apply the review’s recommendations.
400. The public authorities seem to be well aware of the potential importance of the regional HEI for future regional development. This has been reflected in the formulation of the Regional Strategy for Development (RSD) and in the Regional Agenda for Productive Development, but also in the interest in creating institutions such as CORECYT, the attempt to promote associations between regional HEIs, and the discussion about the creation of a Regional Council for Higher Education. However, the public authorities do not seem to assess properly the difficulties related to enhancing the contribution of HEIs to regional development. There is no clear distinction between different types of HEI, their goals, and their contradictions. The sector is highly heterogeneous, with competing interests and areas of high competition among HEIs (and, therefore, low possibilities for collaboration). Moreover, certain collaborative goals might be more easily obtained through a less transversal approach and by focusing on certain HEIs.
401. In the business sector, there is a little interest to develop collaborative activities with HEI, especially with respect to productive innovations. Apparently, the different priorities, perspectives, work styles, and cultures existing between private (non-HEI) firms and HEI frequently make such collaboration difficult. Managers of firms often prefer to work with private consulting offices instead of universities because they perceive that the former offer better service and that the HEI do not have formal mechanisms to promote technological transfer and innovation in large firms. Moreover, most regional firms produce goods and services with low technological content. Thus, the market for technological innovations, probably, is not very extensive.

95
402. The HEIs, especially the universities (both CRUCH and private), seem to be interested in regional development. This can be seen in their official statements of institutional missions and goals, but also in their support for and impact on different aspects of regional development. On the other hand, HEI officials are not always aware of the obstacles or contradictory incentives they give their staff about involvement in regional development. Nonetheless, there seems to be good receptivity of projects that enhance their contribution to the region.
403. However, we believe that a core of people from different types of institutions have a genuine interest in the evaluation process and have followed it with interest. These people also seem to occupy important seats and meet in different public and private instances at the regional level, so they know each other. Finally, these actors seem to be aware of the potential importance of HEI for innovation and regional development. Many of these persons are easy to identify, having participated in this study’s interviews and workshops or currently participating in the Directive Committee of the self-evaluation process.
Challenges for increasing the contribution of HEI to regional development
404. In past decades, the Bío Bío Region has made impressive progress in educational levels. Compared with the rest of the country, the negative educational gap in literacy, years of schooling, and participation in higher education has been drastically reduced, and it is highly likely that this gap will be completely closed in a few years. Thus, it seems that the emphasis on educational matters will shift from coverage to quality. This is especially relevant since it seems that the relative inflow of students from low income quintiles to the HEI is more important in this region than elsewhere in the country. Therefore, the focus should now be on offering the students a high quality education, improving their actual chances for obtaining jobs after graduating and reducing drop-out rates from graduate studies. Moreover, improving the articulation between different higher education levels and reducing the years of permanency in higher education seem to be complementary challenges in this area.
405. The important impact of the HEI on regional development in different dimensions has been acknowledged by the regional community and public authorities. Therefore, an important role is reserved for the HEI in the Regional Strategy for Development (RSD) and the Regional Agenda of Productive Development. However, if the HEI are to generate further impacts on some of the main social regional problems (e.g., poverty and unemployment), they must strengthen their contribution to regional development through the various channels identified in this report. Especially, the contribution of HEI, in terms of more innovation and greater labour market skills, must be improved substantially to have a significant impact on the needed higher regional growth.
406. To improve the contribution of the HEI to regional development, several challenges must be faced by both the HEI and other regional stakeholders. Individually, the HEI must revise their internal functioning and incentive systems to give effective priority to matters related to regional development. Specifically, they should create institutions and generate incentives for the academic staff that promote activities of applied research, diffusion, patenting, and technological transfer. Moreover, they should develop and decentralize the supply of post-professional programmes as a way to improve the regional labour force skills. A specific focus should be given to the socially vulnerable population, as a direct route to affect living standards in more backward areas. Finally, the HEI should direct their programme supply to areas in which the regional demand is not satisfied.
407. There are few collaborative efforts between different HEI. Moreover, the collaboration between HEI and other stakeholders is also deemed insufficient. Between HEI, difficulties for collaboration seem to be based on the high heterogeneity of HEI in different fields and the different visions existing among their representatives. Tensions between CFT-IP and universities are due to the perception of the former that the universities are given priority over

96
CFT-IP by “society”, whereas tensions between private and traditional universities are based on the beliefs by the former that they are discriminated against in terms of access to funding and other matters (for example, participation in CORECYT) by the authorities. Moreover, tensions between the public and non-public CRUCH universities replicate tensions at the national level within the CRUCH. The perceptions of the fields in which the different HEI can collaborate also differ between institutions. The institutions compete in some fields (funding, students, staff), but are able to cooperate in others (regional image, decentralization, information systems, regional development). We believe that good knowledge of the different views and the creation of instances in which it is possible to discuss the differences could help bridge these gaps and promote cooperative efforts. Moreover, to the extent that the HEI are able to effectively emphasize regional development, collaborative activities among academic staff should increase naturally.
408. The organisation of the HEI is not functional in terms of collaborative research and innovation activities with the business sector, given the needs of the latter, particularly considering the associated services required and time responses. The apparent institutional gap in this area should be bridged by developing specific organisational structures (service units to attend to business firms) within the HEI, or by developing independent firms that function as interfaces between applied research in the HEI and innovations in the business sector. The most appropriate solution is not clear, but probably lies in an area that also requires some thought and effort on the part of the regional agents. Moreover, the specific issue of the transfer of knowledge to innovative activities in the sector of small and medium-sized enterprises (SME) is especially relevant in the Bío Bío Region, given the importance of this sector on the generation of employment and, therefore, on the living conditions of a large part of the population.
409. The regional authorities have played an active role in past years, incorporating the HEI into regional development and attempting to reduce the obstacles for collaborative work within and between the HEI and other stakeholders. Furthermore, the regional authorities have managed to create an important network for promoting regional cooperation around science, technology, and innovation. These efforts should continue. Moreover, the authorities must assure the administrative and financial tools to support and speed up initiatives that promote regional growth and contribute to the creation of institutions that can catalyze development efforts. Finally, areas for potential improvement in this effort include better coordination between the regional and national levels; the creation of channels to allow a higher participation of CFT and IP in this network; a better understanding of the different types of HEI, their goals, their contradictions, and the areas in which collaboration is most feasible between some types of institutions; and the promotion of monitoring and information systems for the whole industry.
410. Several challenges need to be met on the level of the entire system. First, the regional higher education system is expanding and new actors (HEI) have come onto the scene. It is not clear what impact these actors will have in the future on the system; they were, to a great extent, absent from the self-evaluation study. Moreover, it is not clear whether these actors have a regional perspective in their activities. The inclusion of these actors in the efforts to mobilize the HEI for regional development remains pending. Second, specific labour supply requirements emerge from the RSD in terms of specific occupational profiles that will be required to develop certain key sectors. The HEI should respond to these requirements in a timely fashion. This means that there should be open, efficient channels of communication between the regional authorities and the HEI, allowing the future regional demands in terms of labour skills to be incorporated into the programme supply of the HEI. Third, historically the Bío Bío Region was a centre for higher education in the country. The regional higher education system was a net attractor of students from the whole country, especially to the south of Santiago. This role has been eroded with the development of the higher education centre in the rest of the country, and nowadays student recruitment is heavily concentrated on students that come from the Bío Bío Region, despite the lack of an important apparent reason for this. The quality of the regional HEI is sufficient to compete for students successfully on a nation-wide basis. The promotion of

97
the region as a centre for higher education and of the characteristics of its HEI should help to attract more students from other regions, widening the base to select recruited students. Fourth, the general economic conditions of the region (low growth, high unemployment, and low relative wages) discourage graduates from staying in the region, likely leading to a “brain drain” of good graduates. The reversal of these economic tendencies is not a matter that is under the control of the HEI. However, they should be aware of these facts and try to develop compensatory mechanisms that allow them to support a highly skilled academic staff and recruit the best graduates.

98
REFERENCES
Academia Chilena de Ciencias (2005). Análisis y proyecciones de la ciencia chilena, http://www.academia-ciencias.cl.
Aroca, Patricio (2004). Migración interregional en Chile. Modelos y resultados 1987-2002, Notas de Población, CELADE-CEPAL, Year 31, Vol. 78, 97-154.
Benavente, J. M.; C. Külzer; I. Gutiérrez; A. Domínguez (2008). La dinámica empresarial en Chile (1999-2006), Foro Pro Innovación, May.
Bravo Ortega, Claudio and Álvaro García Marín (2008). Exploring the relationship between R&D and productivity: A country-level study, Central Bank of Chile, Working Papers, No. 472, June.
Bruhn, V. and P. Inostroza (1997). Mujer y desempleo en la VIII Región. Informe Económico Regional 26, April, pp. 31-42.
Burton, G. (2008). Local government in Chile. Citymayors, Government, December 27. (http://citymayors.com/government/chile_government.html).
CEUR (2003). Ciencia, tecnología y desarrollo regional: 1991-2000, una década de estudios en la VIII Región, Chile. Centro de Estudios Urbanos (CEUR), October, Universidad del Bío Bío.
CEUR (2008). Prospectiva tecnológica en sectores claves Región del Bío-Bío, Centro de Estudios Urbanos (CEUR), Universidad del Bío Bío.
Chile Califica (2008). Estudio de la demanda de mano de obra por el mercado del trabajo del sector turismo y oferta formativa existente, en los territorios de planificación de la Región del Bío Bío, Executive Report, Facultad de Ciencias Empresariales, Universidad del Bío Bío, (January), pp. 28.
Chile Califica (2007). Estudio de la demanda de mano de obra en los sectores, construcción y marítimo portuario, y proyección de la demanda futura, contrastado con la identificación de la oferta formativa a nivel de perfiles de egreso/trabajador, en la Región del Bío Bío, Executive Report, Facultad de Ciencias Empresariales, Universidad del Bío-Bío, (December), pp. 1-28.
Chile Sustentable (2009). Mapa de los impactos ambientales en Chile. Santiago de Chile.
CIDERE BIOBIO (2008). Memoria 2007/2008, Concepción.
Comisión Ingresa (2008). Quiénes somos? Available at: http://www.ingresa.cl/website/index2.php?id_seccion=5&id_contenido=161.
Consejo Superior de Educación. www.cse.cl.
CNA (2008). Comisión Nacional de Acreditación “Presentación general”. Available at: http://www.cnachile.cl/portada/port_pres_general.html.

99
CNCA (2005). “Encuesta de consumo cultural y uso del tiempo libre 2005”, Consejo Nacional de la Cultura y las Artes.
CNAP. (2009). Orientaciones de la CNAP para las autoevaluaciones de las carreras en vinculación con el medio. Available at: http://www.cnachile.cl
CNIC (2008). Hacia una estrategia nacional de innovación para la competitividad, Vol. II, http://www.cnic.cl/.
CONICYT (2008). Qué es CONICYT? Comisión Nacional de Investigación Científica y Tecnológica. Available at: http://www.conicyt.cl/573/article-7554.html.
CONICYT (2009). Logros 2006-2008, más ciencia y tecnología para Chile, http://www.conicyt.cl/573/articles-31980_recurso_1.pdf.
CORBIOBIO (2008). Encuesta Bío Bío y su identidad de marca, Centro de Estudios CORBIOBIO, November.
CRUCH (2008). Sobre el CRUCH, Consejo de Rectores de las Universidades Chilenas. Available at: http://www.cruch.cl/cruch.html.
CSE (2008). Educación Superior en Chile, Consejo Superior de Educación. Available at: http://www.cse.cl/public/Secciones/seccioneducacionsuperior/educacion_superior_home.aspx and http://www.cse.cl/public/Secciones/seccionestudios/estudios_y_documentos_de_la_SecTec.aspx.
Departamento de Propiedad Intelectual (DPI). http://www.dpi.cl.
Dresdner, J.; A. Acuña; B. Castro; M. Quiroga; H. Salgado; A. Ulloa; and F. Vásquez (2008). Contribución de las instituciones de educación superior al desarrollo de la Región del Bío Bío, Technical Proposal presented to Innova Bío Bío, (October), pp. 38.
Dresdner et al. (2005). Análisis sobre el mercado laboral en Chile a través del procesamiento de información secundaria disponible. Zona 3: Región del Bío Bío. Requested by Chile Califica of the Departamento de Economía, Universidad de Concepción, third progress report, August.
Fuentes, Larraín, and Schmidt-Hebbel (2006). Sources of growth and behavior of TFP in Chile, Cuadernos de Economía, Vol. 43 (May), pp. 113-142.
Gobierno Regional (2008). Estrategia Regional de Desarrollo Región del Bío-Bío, Gobierno Regional Región del Bío, Elaborated by a consulting team of the Universidad del Bío-Bío, December.
INE (2006). Fecundidad en Chile. Situación Reciente, Instituto Nacional de Estadísticas, November.
INE (2006). Resultados encuesta sobre calidad de vida y salud 2006, Santiago de Chile.
INE (2007). Migraciones internas regionales. 1992-2002, Instituto Nacional de Estadísticas, January.
INE (2008). Transporte y comunicaciones. Annual Report 2007, Instituto Nacional de Estadísticas, September.

100
Kawax (2008). Análisis de los mecanismos de innovación de la Región del Bío Bío, Kawax Project, PBCT, Unidad de Desarrollo Tecnológico, Universidad de Concepción.
MINEDUC (2008). Educación Superior, Ministerio de Educación, Chile. Available at: http://www.educacionsuperiorchile.cl/.
MIDEPLAN (2006). Encuesta de caracterización socio-económica nacional (CASEN) 2006, División Social, Ministerio de Planificación y Coordinación, Gobierno de Chile.
MIDEPLAN (2000). Relación entre salarios y tipo de educación. Evidencia para hombres en Chile: 1990-1998, Unidad de Estudios Prospectivos, MIDEPLAN.
MOPTT (2005). Sistema portuario de Chile 2005, MOPTT, Dirección de Obras Portuarias del Gobierno de Chile, May.
OECD (2008). Main science and technology indicators.
OECD (2007): “OECD Reviews of Innovation Policy: Chile”
Pérez, M. (2004). Aseguramiento de la calidad de la Educación Superior en América Latina: ¿Vamos por el camino correcto? Consejo Superior de Educación, Estudios y Documentos, December.
PNUD (2002). Datos del mapa del campo cultural en Chile, PNUD 2002, “Nosotros los Chilenos”.
PNUD (2006). Las trayectorias del desarrollo humano en las comunas de Chile (1994-2003). Programmea de Naciones Unidas, Santiago de Chile.
Quiroga, M. (2000). Economía regional e inversión, Informe Económico Regional 36, August, pp. 29-36.
Quiroga, M. (2008). Poor areas or poor people: Decomposing differences in living standards and poverty. Working paper presented in the 7th Nordic Conference in Development Economics, University of Stockholm, Stockholm-Sweden, 16-17 June 2008.
Rodríguez, Jorge and Daniela González (2006). Redistribución de la población y migración interna en Chile: Continuidad y cambio según los últimos cuatro censos nacionales de población y vivienda, Revista de Geografía, Norte Grande, July, No. 035, Pontificia Universidad Católica de Chile, Santiago Chile, pp. 7-28.
SII (2009). Servicios de Impuestos Internos. https://zeus.sii.cl/cvc_cgi/dfmun/dfmun_estu.cgi
Subcomisión de Infraestructura (2008). Minutes. XXVI Encuentro del Comité de Integración de la Macro Región de los Lagos, Valdivia, de los Ríos Región, September 4.
UDT (2008). Análisis de los mecanismos de innovación de la Región del Bío Bío, Kawax Project, PBCT, carried out by the Unidad de Desarrollo Tecnológico, Universidad de Concepción.
Ulloa, Andrés and Orlando Llanos (2008). Factores críticos en el éxito de proyectos de innovación. Paper presented at ENEFA, November.

A-0
ANNEXES

A-1
ANNEX 1
Table A.1.1 Distance from the Provincial Capital Cities of the Bío Bío Region to Selected Cities (Kilometres)
Distance between cities Provincial Capital Cities of the Bío Bío Region Chillán Concepción Los Ángeles Lebu
Arica La Serena Valparaíso Santiago
2,474 2,570 2,583 2,713 874 970 984 1113 510 606 620 749 404 500 514 643
Bío Bío Region
Chillán 0 98 112 241 Concepción 98 0 140 143 Los Ángeles 112 140 0 216 Lebu 241 143 216 0
Puerto Montt Punta Arenas (*)
623 622 514 609 2,713 2,713 2,605 2,700
Source: Authors’ elaboration using data from the Chilean Government website: www.vialidad.cl/Distancias/Distancias.asp.
(*) Part of the route crosses into Argentina.
Table A.1.2 Time and Cost of Transport from Concepción to Chile’s Two Main Cities (January 2009)
Transport Time Travel Cost US$ (**) Santiago Valparaíso Santiago Valparaíso
Car 5 hrs. 30 min. 7 hrs. 105-130 130-155 Bus 6 hrs. 30 min. 8 hrs. 30-70 36-75
Train 6 hrs. 7 hrs. 30 min. 40-60 50-70 Airplane (*) 2 hrs. 3 hrs. 30 min. 70-380 80-400
Source: Authors’ elaboration using data requested directly from the service providers.
(*) Including arriving one hour prior to boarding.
(**) Calculated using an exchange rate of Chilean $560/US$.

A-2
Table A.1.3 Communal Immigration and Emigration between 1997 and 2002
Share of Total Population (%)
Commune Immigrant Emigrant Difference Concepción 16.4 22.9 -6.5
Coronel 4.9 2.9 2.0 Chiguayante 8.4 4.6 3.8
Florida 0.7 1.0 -0.3 Hualqui 1.9 1.1 0.8
Lota 1.1 2.5 -1.4 Penco 2.3 1.9 0.5
San Pedro de la Paz 9.5 3.1 6.4 Santa Juana 0.6 0.7 -0.1 Talcahuano 10.4 14.1 -3.6
Tomé 1.4 1.8 -0.4 Province of Concepción 44.6 40.3 4.3
Lebu 1.0 1.1 -0.1 Arauco 1.5 1.6 -0.1 Cañete 1.3 1.4 -0.1
Contulmo 0.2 0.4 -0.2 Curanilahue 0.8 1.4 -0.5 Los Alamos 1.0 0.6 0.4
Tirúa 0.3 0.5 -0.2 Province of Arauco 11.4 14.0 -2.6
Los Ángeles 6.2 4.7 1.5 Antuco 0.3 0.4 -0.1 Cabrero 1.4 1.0 0.4
Laja 0.7 1.5 -0.7 Mulchén 0.7 1.2 -0.6
Nacimiento 0.8 1.2 -0.4 Negrete 0.5 0.4 0.1 Quilaco 0.3 0.4 -0.1 Quilleco 0.5 0.6 -0.1
San Rosendo 0.3 0.3 0.0 Santa Bárbara 0.9 1.2 -0.2
Tucapel 0.5 0.5 0.0 Yumbel 0.9 1.0 -0.1
Province of Bío Bío 21.8 23.0 -1.2

A-3
Table A.1.3 (continued) Communal Immigration and Emigration between 1997 and 2002
Share of Total Population (%)
Commune Immigrant Emigrant Difference Chillán 7.8 9.1 -1.2 Bulnes 0.9 1.0 -0.1
Cobquecura 0.1 0.4 -0.3 Coelemu 0.6 1.2 -0.5 Coihueco 0.8 1.1 -0.3
Chillan Viejo 4.7 0.9 3.8 El Carmen 0.4 0.9 -0.6
Ninhue 0.1 0.3 -0.1 Ñiquén 0.3 0.4 -0.1 Pemuco 0.4 0.4 -0.1
Pinto 0.6 0.6 -0.1 Portezuelo 0.2 0.3 -0.1
Quillón 0.8 0.9 -0.1 Quirihue 0.4 0.5 -0.1 Ránquil 0.3 0.3 0.0
San Carlos 1.2 1.6 -0.4 San Fabián 0.2 0.2 0.0 San Ignacio 0.6 0.8 -0.1 San Nicolás 0.5 0.5 0.1
Treguaco 0.3 0.1 0.2 Yungay 0.8 0.7 0.1
Province of Ñuble 22.3 22.7 -0.4 Source: Intra and Inter Regional Migration, Instituto Nacional de Estadísticas (INE), December, 2004.

A-4
Table A.1.4 Fertility of Mothers Younger than 20 Years Old (*) per 1,000 Women
Bío Bío Region and Country
1990 1997 2004 Bío Bío Region 66.8 62.3 44.5
Country 66.0 67.2 48.8 Source: Authors’ elaboration using data from Instituto Nacional de Estadísticas (INE). (*) Calculated as the number of children born to mothers older than 15 and younger than 20 years, in relation to the population of this age.

A-5
Table A.1.5 Higher Education Institutions with Presence in the Bío Bío Region (2009)
Name of the Institution Seat Address Type of Institution
Centro de Formación Técnica Barros Arana Head Office Barros Arana 102,
Concepción CFT
Centro de Formación Técnica CEDUC-UCN Headquarters Lebu Ramírez s/n, Lebu CFT
Centro de Formación Técnica CRECIC
Headquarters Cabrero
Avenida Vial s/n, Cabrero CFT
Centro de Formación Técnica CRECIC Head Office Janequeo 454,
Concepción CFT
Centro de Formación Técnica Diego Portales
Office* authorization being processed
Diego Portales 136, Chillán CFT
Centro de Formación Técnica Diego Portales Headquarters No. 3 Constitución 647, 2º
Piso, Chillán CFT
Centro de Formación Técnica Diego Portales Head Office Barros Arana 738,
Concepción CFT
Centro de Formación Técnica DUOC UC Headquarters No. 5 Angol 470, Concepción CFT
Centro de Formación Técnica ICADE (currently in the process of closing down)
Head Office Avenida O´Higgins 292, Concepción CFT
Centro de Formación Técnica INACAP
Headquarters Los Ángeles
Villagrán 251, Los Ángeles CFT
Centro de Formación Técnica INACAP
Headquarters Chillán
Constitución 757, Chillán CFT
Centro de Formación Técnica INACAP
Headquarters Concepción – Talcahuano
Autopista Concepción-Talcahuano 7421 CFT
Centro de Formación Técnica Instituto Chileno Británico de Concepción
Head Office San Martín 531, Concepción CFT
Centro de Formación Técnica Lota-Arauco Head Office Carlos Cousiño 184 and
199, Lota CFT
Centro de Formación Técnica Lota-Arauco
Headquarters Cañete
Séptimo de Línea 512, Cañete CFT
Centro de Formación Técnica Salesianos Don Bosco Headquarters No. 6 Irarrázaval 140,
Concepción CFT
Centro de Formación Técnica San Alonso Head Office O'Higgins 980, Depto. E,
2º piso, Concepción CFT
Centro de Formación Técnica Santo Tomás
Headquarters Barros
Barros Arana 299, Concepción CFT
Centro de Formación Técnica Santo Tomás
Headquarters Los Ángeles
Mendoza 120, Los Ángeles CFT
Centro de Formación Técnica Santo Tomás Headquarters Prat Avenida Prat 855,
Concepción CFT
Centro de Formación Técnica Santo Tomás
Headquarters Chillán 5 de Abril 416, Chillán CFT
Centro de Formación Técnica Headquarters Arauco 950, Chillán CFT

A-6
Table A.1.5 Higher Education Institutions with Presence in the Bío Bío Region (2009)
Name of the Institution Seat Address Type of Institution
Santo Tomás Chillán
Instituto Profesional Adventista Head Office Fundo Las Mariposas Km. 12. Coihueco IP
Instituto Profesional AIEP Headquarters Concepción
Lincoyán 444, Concepción IP
Instituto Profesional CAMPUS or Instituto Profesional Instituto Nacional de Computación y Administración de Empresas INDAE
Headquarters Concepción
Chacabuco 539, Concepción IP
Instituto Profesional Arturo Prat (currently undergoing change of name)
Headquarters Chillán
Avenida Padre Hurtado 852 B, Chillán IP
Instituto Profesional Concepción Headquarters Arauco Condell 237, Arauco IP
Instituto Profesional Concepción Head Office Rengo 316, Concepción IP Instituto Profesional de Los Ángeles Head Office Ricardo Vicuña 776, Los
Ángeles IP
Instituto Profesional del Valle Central
Headquarters Los Ángeles
Valdivia 485, Los Ángeles IP
Instituto Profesional del Valle Central
Headquarters Chillán Bulnes 695, Chillán IP
Instituto Profesional del Valle Central
Head Office Concepción
Barros Arana 231, Concepción IP
Instituto Profesional Diego Portales
Headquarters Chillán
Constitución 647, Chillán IP
Instituto Profesional Diego Portales Head Office Maipú 301, Concepción IP
Instituto Profesional Dr. Virginio Gómez G.
Headquarters Chillán
Vicente Mendez 595, Chillán IP
Instituto Profesional Dr. Virginio Gómez G.
Headquarters Los Ángeles Ercilla 444, Los Ángeles IP
Instituto Profesional Dr. Virginio Gómez G. Head Office Cochrane 32,
Concepción IP
Instituto Profesional DUOC UC Headquarters Concepción
Paicaví 3280, Concepción IP
Instituto Profesional DUOC UC Headquarters Concepción Angol 470, Concepción IP
Instituto Profesional INACAP or Instituto Profesional Instituto Nacional de Capacitación Profesional INACAP
Headquarters Chillán
Constitución 757, Chillán IP
Instituto Profesional INACAP or Instituto Profesional Instituto Nacional de Capacitación Profesional INACAP
Headquarters Los Ángeles
Villagrán 251, Los Ángeles IP
Instituto Profesional INACAP or Instituto Profesional Instituto Nacional de Capacitación Profesional INACAP
Headquarters Concepción-Talcahuano
Autopista Concepción-Talcahuano 7421 IP

A-7
Table A.1.5 Higher Education Institutions with Presence in the Bío Bío Region (2009)
Name of the Institution Seat Address Type of Institution
Instituto Profesional Instituto de Estudios Bancarios Guillermo Subercaseaux
Headquarters Concepción
O'Higgins 445, Concepción IP
Instituto Profesional La Araucana Headquarters Concepción
Barros Arana 1423, Concepción IP
Instituto Profesional Latinoamericano de Comercio Exterior
Headquarters Concepción
Castellón 80, Concepción IP
Instituto Profesional Providencia Headquarters Concepción
O'Higgins 301, Concepción IP
Instituto Profesional Santo Tomás Headquarters Chillán Gamero 227, Chillán IP
Instituto Profesional Santo Tomás Headquarters Concepción
Barros Arana 299, Concepción IP
Instituto Profesional Santo Tomás Headquarters Los Ángeles
Mendoza 120, Los Ángeles IP
Universidad Adventista de Chile Head Office Km. 12, Chillán UP
Universidad Bolivariana Headquarters Los Ángeles
O'Higgins 334, Los Ángeles UP
Universidad Bolivariana Headquarters Chillán 5 de Abril 380, Chillán UP
Universidad Católica de la Santísima Concepción
Headquarters Cañete Saavedra 1096, Cañete CRUCH
Universidad Católica de la Santísima Concepción
Headquarters Los Ángeles
Caupolicán 276, Los Ángeles CRUCH
Universidad Católica de la Santísima Concepción
Headquarters Talcahuano Colón 2766, Talcahuano CRUCH
Universidad Católica de la Santísima Concepción
Headquarters Chillán Arauco 449, Chillán CRUCH
Universidad Católica de la Santísima Concepción Head Office Caupolicán 491,
Concepción CRUCH
Universidad de Arte y Ciencias Sociales Arcis
Headquarters Cabrero Rio Claro 1030, Cabrero UP
Universidad de Arte y Ciencias Sociales Arcis
Headquarters Portezuelo
Baquedano 315A, Portezuelo UP
Universidad de Arte y Ciencias Sociales Arcis
Headquarters Cañete Hullinco S/N, Cañete UP
Universidad de Concepción Headquarters Chillán
Avenida. Vicente Méndez 95. Casilla 537, Chillán
CRUCH
Universidad de Concepción Head Office Avenida Víctor Lamas 1290, Casilla 160 C, Correo 3, Concepción
CRUCH
Universidad de Concepción Headquarters Los Ángeles
Juan Antonio Coloma 0201, Casilla 341, Los Ángeles
CRUCH
Universidad de Las Américas Headquarters Concepción
Chacabuco 539, Concepción UP
Universidad de Viña del Mar Headquarters Los Ángeles
Valdivia 1101, Los Ángeles UP

A-8
Table A.1.5 Higher Education Institutions with Presence in the Bío Bío Region (2009)
Name of the Institution Seat Address Type of Institution
Universidad de Viña del Mar Headquarters Coronel Lautaro 431, Coronel UP
Universidad del Bío Bío Head Office Avenida Collao 1202, Concepción
CRUCH
Universidad del Bío Bío Headquarters Chillán
Avenida. Andrés Bello s/n, Casilla 447, Chillán
CRUCH
Universidad del Desarrollo Headquarters Concepción
Sanhueza 1750, sector Pedro de Valdivia, Concepción
UP
Universidad del Desarrollo Head Office Ainavillo 456, Concepción UP
Universidad La República Headquarters Los Ángeles Lynch 284, Los Ángeles UP
Universidad La República Headquarters Concepción
Orompello 235, Concepción UP
Universidad La República Headquarters Chillán Libertad 68, Chillán UP
Universidad La República Headquarters San Carlos
O'Higgins 525, San Carlos UP
Universidad Pedro de Valdivia Headquarters Concepción
Avenida Pedro de Valdivia 1585, Concepción
UP
Universidad Regional San Marcos Head Office Tucapel 3158, Concepción UP
Universidad San Sebastián Headquarters Talcahuano
Avenida Colón 3050, Talcahuano UP
Universidad San Sebastián Head Office Las Tres Pascualas
Calle Cruz 1577, Concepción UP
Universidad Santo Tomás Headquarters Los Ángeles
Lautaro 286, Los Ángeles UP
Universidad Santo Tomás Headquarters Prat Avenida Prat 855, Concepción UP
Universidad Técnica Federico Santa María
Headquarters Rey Balduino de Bélgica, Talcahuano
Alemparte 850, Talcahuano CRUCH
Universidad Tecnológica de Chile INACAP
Headquarters Chillán
Constitución 757, Chillán UP
Universidad Tecnológica de Chile INACAP
Headquarters Los Ángeles
Villagrán 2551, Los Ángeles UP
Universidad Tecnológica de Chile INACAP
Headquarters Concepción-Talcahuano
Autopista Concepción-Talcahuano 7421 UP
Source: Ministry of Education, 2009.
Note: CFT (Technical Formation Centre), IP (Professional Institute), UP (Private University), CRUCH (Council of Rectors of the Chilean Universities).

A-9
Table A.1.6 Students Enrolled in Higher Education Institutions by Type of Institution and City of Origin
Bío Bío Region (2008)
City Type of Institution First Year Enrolment Total Enrolment
Concepción University 13,053 48,483
Professional Institute 5,565 12,376 Technical Formation Centre 1,163 2,938
Talcahuano University 722 2,454
Professional Institute 735 2,102 Technical Formation Centre 1,466 2,836
Los Ángeles University 959 3,609
Professional Institute 1,003 2,078 Technical Formation Centre 514 1,100
Chillán University 1,879 8,561
Professional Institute 1,131 2,546 Technical Formation Centre 994 2,063
Cañete University 216 390 Technical Formation Centre 52 67
Lota Technical Formation Centre 775 1,139 Lebu Technical Formation Centre 100 100
Source: Authors elaboration using data from the Consejo Superior de Educación (CSE), 2008; and personal communication with the institutions, 2009.

A-10
Table A.1.7 Origin (Secondary School) of Students Enrolled in the Higher Education Institutions, by Type of Institution, in the Bío Bío Region
Percentage (%) of Total Students (2008)
University Office
Administrative Dependency of the School Geographic Origin Secondary Education Orientation
Private Non
Subsidized
Private Subsidized Municipal Other Bío Bío
Region Other
Regions Scientific-Humanities
Technical Professional
Bolivariana Chillan 6 17 70 7 89 0 92 8
UCSC Cañete 2 35 52 11 98 2 43 57 ARCIS Cañete 1 18 78 3 100 0 - -
De Concepción Concepción 17 40 43 0 75 25 90 10 Los Ángeles 1 30 69 0 84 16 72 28
Chillan 8 56 36 0 59 41 84 16 Del Bío Bío Concepción 7 38 53 2 89 9 68 32
Regional San Marcos Concepción 16 20 59 5 94 6 84 16
San Sebastián Concepción 28 31 38 3 91 9 100 0 Talcahuano 2 5 93 0 96 4 98 2
Santo Tomás Concepción 5 30 58 7 99 1 82 18 Los Angeles 6 31 56 7 95 5 77 23
Técnica Federico Santa
María Talcahuano 3 32 65 0 87 13 61 39
Técnica de Chile INACAP
Concepción-Talcahuano. 8 10 23 59 95 5 - -
Chillán 12 19 17 52 97 3 - -

A-11
Table A.1.7 (continued) Origin (Secondary School) of Students Enrolled in the Higher Education Institutions, by Type of Institution, in the Bío Bío Region
Percentage (%) of Total Students (2008)
Professional Institute Office
Administrative Dependency of the School Geographic Origin Secondary Education Orientation
Private Non
Subsidized
Private Subsidized Municipal Other Bío Bío
Region Other
Regions Scientific-Humanities
Technical Professional
AIEP Concepción 8 30 61 1 100 0 39 61
Del Valle Central
Concepción 9 10 74 7 87 13 91 9Los Ángeles 2 29 66 3 96 4 100 0
Chillán 18 19 54 9 93 5 84 16
Diego Portales Concepción 2 15 76 7 99 1 85 15 Chillán 3 36 41 20 100 0 - -
Virginio Gómez
Concepción 20 21 59 0 88 12 78 22 Los Ángeles 9 17 74 0 89 11 63 37
Chillán 28 40 32 0 88 12 79 21 DUOC UC Concepción 22 32 42 4 96 4 77 23 Guillermo
Subercaseaux Concepción 8 8 74 10 96 4 31 69
INACAP Concepción-Talcahuano 11 15 38 36 94 6 - -
Chillán 12 26 32 30 94 6 - - La Araucana Concepción 2 16 82 0 100 0 80 20 Providencia Concepción 10 15 58 17 98 2 - -
Santo Tomás Concepción 10 25 61 4 99 1 71 29 Los Ángeles 4 23 67 6 96 4 58 42
Chillán 4 39 56 1 97 3 63 37

A-12
Table A.1.7 (continued) Origin (Secondary School) of Students Enrolled in the Higher Education Institutions, by Type of Institution, in the Bío Bío Region
Percentage (%) of Total Students (2008)
Technical Formation Center
Office
Administrative Dependency of the School Geographic Origin Secondary Education Orientation
Private Non
Subsidized
Private Subsidized Municipal Other Bío Bío
Region Other
Regions Scientific-Humanities
Technical Professional
CRECIC Concepción 3 36 61 0 100 0 - -
Diego Portales Concepción 1 10 87 2 88 12 66 34Chillán 0 22 76 2 94 6 73 27
INACAP
Concepción-Talcahuano 10 13 50 27 96 4 - -
Los Ángeles 4 16 62 18 92 8 - - Chillán 13 20 37 30 95 5 - -
Lota-Arauco Lota 0 0 100 0 100 0 36 64 Salesianos Don
Bosco Concepción 5 28 66 1 98 2 50 50
Santo Tomás Concepción 6 21 71 2 98 2 72 28 Los Ángeles 3 27 65 5 96 4 69 31
Chillán 5 36 57 2 98 2 67 33 Source: Consejo Superior de Educación (CSE), different years.

A-13
Map A.1.1 Planning Territories in the Bío Bío Region (2009)
a
Source: Authors’ elaboration using Atlas of Planning Territories (Bío Bío Regional Government website: www.gorebiobio.cl/atlasbiobio).

A-14
Map A.1.2 Four Main Populated Areas in the Bío Bío Region (2002)
Source: Authors’ elaboration using Atlas of Planning Territories (Bío Bío Regional Government website: www.gorebiobio.cl/atlasbiobio).

A-15
Map A.1.3 Students Enrolled in Higher Education Institutions
Bío Bío Region (2008)
..
Source: Authors’ elaboration using several sources, 2008.

A-16
Figure A.1.1 Composition of the Population by Age Groups and Sex
Bío Bío Region, 1992 and 2002
Year 2002
15105051015
0-4
10-14
20-24
30-34
40-44
50-54
60-64
70-74
80 and over
Age
Gro
up
Percentage of Population (%)
FemaleMale
Year 1992
15105051015
0-4
10-14
20-24
30-34
40-44
50-54
60-64
70-74
80 and over
Age
Gro
up
Percentage of Population (%)
FemaleMale
Source: Authors’ elaboration using census data from 2002 and 1992.

A-17
Figure A.1.2 Distribution of the Population by Years of Education
Bío Bío Region, 1992 and 2002
0
2
4
6
8
10
12
14
16
0 1 2 3 4 5 6 7 8 9 10 11 12 13 14 15 16 17 18 19 20
Years of Education
%
1992 2002
Source: Authors’ elaboration using census data from 2002 and 1992.
Note: Percentage with respect to the population.

A-18
Figure A.1.3 Distribution of the Population by Years of Education
Bío Bío Region and Country (2002)
0
2
4
6
8
10
12
14
16
18
0 1 2 3 4 5 6 7 8 9 10 11 12 13 14 15 16 17 18 19 20
Years of Education
%
Country Bío Bío Region
Source: Authors’ elaboration using census data 2002 and 1992.
Note: Percentage with respect to the population.

A-19
Figure A.1.4 Share of Sectors in Employment in the Bío Bío Region
Annual Average 2007
Financial Services7%
Social and Personal Services
30%
Others1%
Agriculture, Hunting and Fishing
15%Manufacturing
15%
Construction7%Retail
18%Transportation and
Telecommunications8%
Source: Authors’ elaboration using data from Instituto Nacional de Estadísticas (INE). Note: “Others” includes Mining, and Electricity, Gas and Water.

A-20
Figure A.1.5 Region of Origin of Student Enrolled in Higher Education Institutions in the Bío Bío Region
All Institutions
Other Regions6%
Bío Bío Region94%
Universidad de Concepción
Other Regions28%
Bío Bío Region72%
Source: Authors’ elaboration using data from Consejo Superior de Educación (CSE), 2005-2008. Note: Average of the years for which information was available.

A-21
ANNEX 2
Table A.2.1 Number of Higher Education Institutions in Chile According to Type and Regime
2002-2008
Type of Institution Regime 2002 2003 2004 2005 2006 2007 2008
Tech
nica
l Fo
rmat
ion
Cen
ters
On accreditation 50 56 47 57 55 49 24 On examination 0 0 0 0 0 0 0
Supervised 59 50 59 41 33 30 19 Autonomous 8 9 11 13 17 21 31 Total CFT 117 115 117 111 105 100 74
Prof
essi
onal
In
stitu
tes
On accreditation 14 6 0 4 1 2 3 On examination 26 25 22 19 14 13 10
Supervised 0 0 6 0 0 0 0 Autonomous 16 17 20 24 28 29 31
Total IP 56 48 48 47 43 44 44
Uni
vers
ities
CR
UC
H 0 0 0 0 0 0 0
0 0 0 0 0 0 0 0 0 0 0 0 0 0 25 25 25 25 25 25 25 25 25 25 25 25 25 25
Non
-Tr
aditi
onal
13 8 0 6 4 4 4 5 1 1 1 0 0 0 0 0 7 0 0 0 0 20 29 31 31 32 32 32 38 38 39 38 36 36 36
63 63 64 63 61 61 61 236 226 229 221 209 205 179
Source: Compendio Estadístico Educación Superior, Ministerio de Educación, Chile.
Table A.2.2 Academic Staff of Higher Education Institutions by Institution Type and Gender (2008)
CFT IP University Total HEI Female staff 1,499 2,253 17,816 21,568 Male staff 1,753 3,642 31,056 36,451
Total 3,252 5,895 48,872 58,019 Source: Base ÍNDICES, Higher Council of Education (CSE)

A-22
Table A.2.3 First Year (2008) Undergraduate Students by Origin and Type of Higher Education Institution (HEI)
Type of Institution CFT IP University Total SNES*
Municipal school 59% 45% 28% 36% Public-subsidized private school 35% 40% 40% 39%
Private school 4% 9% 21% 16% Other HEI 2% 3% 5% 4%
Other programmes 0.4% 2% 1% 1% Other origins 0.4% 2% 5% 3%
Total 100% 100% 100% 100% *National Higher Education System Source: Base ÍNDICES, Higher Council of Education (CSE)

A-23
Figure A.2.1Evolution of the Number of Higher Education Institutions in Chile by Type of Institution (1990-2008)
0
50
100
150
200
250
300
350
1990 1991 1992 1993 1994 1995 1996 1997 1998 1999 2000 2001 2002 2003 2004 2005 2006 2007 2008Universities 60 62 67 70 70 70 68 68 66 65 64 60 63 63 64 63 61 61 61IP 81 81 76 76 76 73 69 70 66 65 60 51 51 51 48 47 43 44 45CFT 161 160 143 134 135 127 126 119 119 120 116 111 112 115 117 111 105 100 90
Source: Compendio Estadístico Educación Superior, Ministerio de Educación, Chile.
Figure A.2.2 Evolution of Public Contributions to Higher Education Institutions in Chile through the Direct (AFD) and Indirect (AFI) Contributions, and the Institutional
Development Fund and MECESUP (FDI-MECESUP), 1990-2008
(in Millions of Pesos of 2008)
0
20000
40000
60000
80000
100000
120000
140000
160000
180000
200000
1990 1991 1992 1993 1994 1995 1996 1997 1998 1999 2000 2001 2002 2003 2004 2005 2006 2007 2008
AFD AFI FDI and MECESUP
Source: Compendio Estadístico Educación Superior, Ministerio de Educación, Chile.

A-24
Figure A.2.3 National Undergraduate, Post-Professional, and Postgraduate Enrollment in Chile (1990-2008)
0
100,000
200,000
300,000
400,000
500,000
600,000
700,000
800,000
1990 1991 1992 1993 1994 1995 1996 1997 1998 1999 2000 2001 2002 2003 2004 2005 2006 2007 2008
Undergraduate Post-Professional Postgraduate
Source: Compendio Estadístico Educación Superior, Ministerio de Educación, Chile.
Figure A.2.4 Distribution of National Undergraduate Enrollment by Area of Knowledge (2008)
3.5% 6.4% 1.5%
13.8%
6.1%1.5%
14.5%25.2%
15.2%
12.3%
Agriculture Art and Architecture Basic SciencesSocial Sciences Law HumanitiesEducation Technology HealthAdministration and Commerce
Source: Compendio Estadístico Educación Superior, Ministerio de Educación, Chile.

A-25
Figure A.2.5 Number of Graduates from Higher Education Institutions in Chile by Gender (1998-2007)
0
10,000
20,000
30,000
40,000
50,000
60,000
70,000
80,000
90,000
1998 1999 2000 2001 2002 2003 2004 2005 2006 2007Women with Degrees 18,333 15,587 21,698 24,284 27,005 28,737 25,779 39,293 41,161 44,657Men with Degrees 17,072 15,138 20,299 23,200 25,231 25,203 22,155 34,183 36,268 37,550
Source: Compendio Estadístico Educación Superior, Ministerio de Educación, Chile.
Figure A.2.6 Evolution of Public Support for Students and the Number of Beneficiaries (1990-2008)
(millions of Chilean pesos of 2008)
0
50,000
100,000
150,000
200,000
250,000
300,000
0
50,000
100,000
150,000
200,000
250,000
1990 1991 1992 1993 1994 1995 1996 1997 1998 1999 2000 2001 2002 2003 2004 2005 2006 2007 2008
Num
berM
illio
ns o
f pes
os fr
om 2
008
Government Resources No. of Beneficiaries
Source: Compendio Estadístico Educación Superior, Ministerio de Educación, Chile

A-26
Figure A.2.7 Evolution of the Public Contributions Obtained by the Universidad de Concepción, the Universidad del Bío-Bío, and the Universidad Católica de la Santísima
Concepción (1990-2008)
(in Millions of Pesos of 2008)
0
2,000
4,000
6,000
8,000
10,000
12,000
14,000
16,000
18,000
1990 1991 1992 1993 1994 1995 1996 1997 1998 1999 2000 2001 2002 2003 2004 2005 2006 2007 2008
AFD AFI FDI and MECESUP
Source: Compendio Estadístico Educación Superior, Ministerio de Educación, Chile.
Figure A.2.8 Communal Share of Undergraduate Enrollment in the Bío Bío Region by Type of Institution (2008)
Technical Formation Centers (CFT)
Professional Institutes (IP) Universities
57.2%
10.5%0.7%20.5%
11.1%Cañete Los Ángeles ConcepciónLota Chillán
11.0%
65.3%
11.2%12.5%
Los Ángeles ConcepciónTalcahuano Chillán
73.6%
5.7%0.7%14.0%
5.9%
Cañete Los Ángeles ConcepciónTalcahuano Chillán
Source: Base ÍNDICES, Consejo Superior de Educación

A-27
Figure A.2.9 Distribution of the Average Scores Obtained by the Incoming Students for the CRUNCH Universities with Presence in the Bío Bío Region (1998-2008)
0
1000
2000
3000
4000
5000
6000
7000
8000
9000
10000
+800 0 1 1 7 8 10 8 12 13 10 12701-800 532 707 707 839 840 1,012 368 354 370 417 391601-700 2,245 2,818 2,715 2,846 3,056 3,133 2,161 2,193 2,280 2,835 2,862501-600 2,968 3,072 3,115 3,073 2,950 3,027 4,054 4,790 4,957 5,034 5,219450-500 470 297 211 230 195 280 746 854 841 576 757
1998 1999 2000 2001 2002 2003 2004 2005 2006 2007 2008
Source: Encuesta Instituciones de Educación Superior Región del Biobío, 2009.
Figure A.2.10 Evolution of Regional HEI Support to Students (millions of Chilean pesos of 2008) and the Number of Beneficiaries by Income Quintile (1998-2008)
0
1000
2000
3000
4000
5000
6000
7000
8000
1998 1999 2000 2001 2002 2003 2004 2005 2006 2007 2008
Quintile 1 Quintile 2 Quintile 3 Quintile 4 Regional HEI support
Source: Encuesta Instituciones de Educación Superior Región del Biobío, 2009.

A-28
ANNEX 3
Table A.3.1 Innovation Expenditure of Private Sector in Chile (2003-2006)
2003 2004 2005 2006 Innovation executed by firms 134,468 161,892 124,255 143,680
Innovation subcontracted to third parties 19,348 20,301 51,775 65,680
Total funded innovation 153,816 182,193 176,030 209,360 GDP (millions of Chilean pesos) 51,156,415 58,303,211 66,192,596 77,830,577 Total funded innovation / GDP 0.30% 0.31% 0.27% 0.27%
Sales (millions of Chilean pesos) 53,586,176 92,638,915 108,849,138 Total funded innovation / Sales 0.34% 0.21% 0.19%
Source: Chilean Survey of Innovation 2003 to 2006. Note: Number in millions of Chilean pesos of each year.

A-29
Table A.3.2 Research and Development (R&D) Indicators
Selected Countries
R&D Per Capita (US$)
R&D over GDP
Expenditure in R&D
Financed by Performed by Researcher Full-Time Equivalent
Researcher Per Capita Industry Government Industry Higher
Education Government
Australia 38,563 1.87% 14,867.5 57.2 38.4 57.3 25.7 14.1 87,270 0.42% Austria 37,341 2.59% 7,999.9 47.7 35.6 70.4 24.1 5.2 31,352 0.38% Belgium 35,755 1.86% 6,997.3 59.7 24.7 69.2 21.8 8.3 35,937 0.34% Canada 39,307 1.89% 23,970.0 47.8 32.8 54.4 36.0 9.2 134,300 0.42%Chile 11,021 0.67% 1,232.7 45.7 44.5 46.1 32.0 10.2 18,365 0.11%
Czech Republic 24,195 1.53% 3,802.7 54.0 41.2 63.8 16.9 18.9 27,878 0.27% Denmark 36,177 2.55% 5,015.7 59.5 27.6 64.9 27.5 7.0 29,572 0.54% Finland 34,919 3.44% 6,320.7 68.2 24.1 72.3 18.7 8.5 39,000 0.74% France 32,982 2.09% 43,359.5 52.4 38.4 63.2 19.2 16.5 211,129 0.34%
Germany 34,318 2.45% 69,334.4 68.1 27.8 70.0 16.3 13.7 286,000 0.35% Greece 28,596 0.58% 1,845.6 31.1 46.8 26.9 50.4 21.4 20,817 0.19%
Hungary 18,716 0.96% 1,818.8 43.9 44.4 50.3 23.3 24.2 17,391 0.17% Iceland 37,066 2.64% 293.0 48.0 40.5 51.5 22.0 23.5 2,155 0.72% Ireland 46,610 1.29% 2,522.5 59.3 30.1 66.8 26.4 6.8 12,169 0.29% Italy 30,862 1.07% 19,383.8 40.4 48.3 48.8 30.3 17.2 88,430 0.15% Japan 33,604 3.23% 138,782.1 77.1 16.2 77.2 12.7 8.3 709,691 0.56% Korea 24,883 2.99% 35,885.8 75.4 23.1 77.3 10.0 11.6 199,990 0.41%
Mexico 14,237 0.40% 5,919.0 46.5 45.3 49.5 27.4 22.1 48,401 0.05%

A-30
Table A.3.2 (continued) Research and Development (R&D) Indicators
Selected Countries
R&D Per Capita (US$)
R&D over GDP
Expenditure in R&D
Financed by Performed by Researcher Full Time Equivalent
Researcher Per Capita Industry Government Industry Higher
Education Government
Netherlands 39,327 1.70% 10,907.5 51.1 36.2 60.4 26.5 13.0 44,116 0.27% New Zealand 27,721 1.04% 1,189.3 41.2 43.0 41.8 32.5 25.7 17,235 0.42%
Norway 54,235 1.60% 4,015.1 46.4 44.0 51.2 32.8 15.9 23,054 0.50% Poland 16,074 0.51% 3,110.0 33.1 57.5 31.5 31.0 37.0 59,573 0.16%
Portugal 22,899 1.14% 2,754.3 36.3 55.2 51.5 29.9 9.1 27,986 0.26% Slovak Republic 20,106 0.46% 501.3 35.6 53.9 39.6 25.0 35.4 12,354 0.23%
Spain 32,391 1.10% 15,595.7 47.1 42.5 55.5 27.6 16.7 115,798 0.26% Sweden 37,038 3.69% 12,357.4 65.7 23.2 72.7 21.1 6.1 44,276 0.49%
Switzerland 41,375 2.42% 7,479.2 69.7 22.7 73.7 22.9 1.1 25,400 0.34% Turkey 13,241 0.51% 4,883.7 46.0 48.6 37.0 51.3 11.7 42,663 0.06%
United Kingdom 35,887 1.64% 35,590.8 45.2 31.9 61.7 26.1 10.0 183,535 0.30% United States 46,220 2.68% 368,799.0 66.4 27.7 71.9 13.3 10.7 1,387,882 0.47%
Average OECD 33,037 2.13% 825,562.6 63.9 28.5 69.1 17.2 11.4 3,883,289 0.33% Source: For OECD Countries, Main Science and Technology Indicators (2008). Chile: Red Iberoamericana de Indicadores de Ciencia y Tecnología, (RICYT) and Comisión Nacional de Investigación Cienctífica y Tecnoógica (CONICYT) (2004).

A-31
Table A.3.3 Science and Technology Indicators for Latin American Selected
Countries
Chile Argentina Brazil Colombia S&T INTENSITY (% OF GDP) 0.67 0.44 0.83 0.17 Expenditure on S&T per capita
population (US$) 31.0 17.8 30.3 10.54 EXPENDITURE ON R&D BY TYPE OF ACTIVITY
Basic Research 35.7% 24.4% NN 24.0% Applied Research 49.0% 44.1% NN 47.0%
Experimental Development 15.3% 31.5% NN 29.0% Total 100.0% 100.0% NN 100.0%
RESEARCHERS BY SECTOR
Government 3.3% 26.4% 3.7% 5% Enterprises 54.8% 10.0% 20.0% 1%
Higher Education 37.1% 61.3% 75.6% 88% Non-profit private organisations 4.7% 2.4% 0.7% 6%
Total 100% 100.0% 100% 100% PATENTS
Patent Applications (residents) 595 786 11,178 85 Patents Granted (residents) 52 108 4,066 11
Patents Granted (res.) / Patent Applications (res.) % 9% 14% 36% 13%
Per capita factor (Patent Applications) 36.97 21.02 61.55 1.88 Source: Red Iberoamericana de Indicadores de Ciencia y Tecnología, (RICYT). Note 1: For Chile, Argentina and Brazil data 2004; for Colombia, data from 2001. Note 2: S&T (Science and Technology), R&D (Research and Development), GDP (Gross Domestic Product).
Table A.3.4: Distribution of Expenditure in Science and Technology by Type of Institution for Selected Latin American Countries, 2001
Chile Argentina Brasil Colombia*
EXPENDITURE ON S&T BY
Fund
ing
(%)
Perf
orm
ance
(%
)
Fund
ing
(%)
Perf
orm
ance
(%
)
Fund
ing
(%)
Perf
orm
ance
(%
)
Fund
ing
(%)
Perf
orm
ance
(%
)
Government 44.5 10.2 64.5 39.7 57.9 21.3 n.a 8.0 Enterprises 45.7 46.1 30.7 33.0 39.9 40.2 n.a. 18.0 Higher Education 0.8 32.0 2.0 25.0 2.2 38.4 n.a. 60.0 Non-profit private organisations 0.3 3.2 1.7 2.3 0.0 0.1 n.a. 14.0 Foreign 8.7 8.5 1.1 0.0 0.0 0.0 n.a. 0.0 Total 100.0 100.0 100.0 100.0 100.0 100.0 n.a. 100.0 Source: Red Iberoamericana de Indicadores de Ciencia y Tecnología, (RICYT). Note: * Data from 2001; n.a. (non available).

A-32
Table A.3.5 Triadic Patent Families1 Per Million Inhabitants in Selected Countries2(2005)
Country 2005 Country 2005 Japan 117.21 New Zealand 15.32
Switzerland 107.56 Ireland 14.95 Sweden 81.01 Italy 12.33
Germany 76.38 Slovenia 6.36 Netherlands 66.94 Chinese Taipei 5.01
Israel 60.28 Spain 4.55 Korea 58.40 Hungary 4.06
United States 53.11 Czech Republic 1.54 Finland 53.04 Portugal 1.07
Luxembourg 50.48 Greece 1.00 OECD 42.97 South Africa 0.63
Denmark 42.18 Slovak Republic 0.53 Austria 39.70 Russian Federation 0.44 France 39.35 Turkey 0.36 EU27 37.52 Poland 0.34
Belgium 34.44 Brazil 0.31 EU15 29.41 China 0.27
United Kingdom 27.41 Argentina 0.23 Norway 25.59 CHILE 0.20
Singapore 24.31 Mexico 0.16 Canada 24.04 Romania 0.14 Iceland 21.53 India 0.12
Australia 18.74 Source: OECD, Patent Database, 2008. Note: Patent counts are based on the earliest priority date, the inventor's country of residence and fractional counts. The data mainly derive from the European Patent Office (EPO) Worldwide Statistical Patent Database (April, 2007). 1. Patents filed at the European Patent Office (EPO), the US Patent & Trademark Office (USPTO) and the Japan Patent Office (JPO) which protect the same invention. Data from 1998 onwards are OECD estimates. 2. Only countries/economies with more than 10 families in 2005 are included.

A-33
Table A.3.6 Patent Applications and Patent Granted at Chilean DPI by Origin
1995-2007
Year
Application Granted
% Fo
reig
n
Nat
iona
l
% N
atio
nal
Tota
l
Fore
ign
Nat
iona
l
% N
atio
nal
Tota
l
1995 1,759 329 16% 2 ,081 181 40 18% 221 11%
1996 2,022 374 16% 2,383 238 47 16% 285 12%
1997 2,649 281 10% 2,920 371 37 9% 408 14%
1998 2,888 315 10% 3,198 586 47 7% 633 20%
1999 2,855 355 11% 3,203 585 28 5% 613 19%
2000 3,241 421 12% 3,653 720 49 6% 769 21%
2001 2,788 426 13% 3,202 579 45 7% 624 19%
2002 2,477 555 18% 3,013 681 60 8% 741 25%
2003 2,290 506 18% 2,793 270 27 9% 297 11%
2004 2,772 594 18% 3,353 552 51 8% 603 18%
2005 2,927 572 16% 3,499 591 46 7% 637 18%
2006 3,255 475 13% 3,730 616 120 16% 736 20%
2007 3,417 465 11% 1,930 515 67 13% 125 6%
Source: Departamento de Propiedad Industrial (DPI), Ministerio de Economía.

A-34
Table A.3.7 Distribution of Total Patent Applications and Patents Granted by Type of Institution
1995-2004
% Total Applications 100.0 Total Individuals 69.3 Institutions 30.7
Universities 6.5 Technical Formation Centers 0.1 Professional Institutes 0.1 Foundations 0.4 Firms and Others 24.6
Total Granted 100.0 Total Individuals 57.2 Institutions 42.8
Universities 6.2 Technical Formation Centers 2.6 Professional Institutes 0.0 Foundations 0.5 Firms and Others 33.5
Source: Chilean Academy of Sciences 2005, based on Departamento de Propiedad Industrial (DPI), Ministerio de Economía.

A-35
Table A.3.8 Research Profile of the Main Chilean Universities (2008)
University Region No. of
Doctoral Programmes
No. of Doctoral
Graduates No. Enrolled
Projects (Thousands of Pesos *)
No. Full-Time
Doctors *
ISI 1987-2008
Universidad de Chile Metropolitana 35 92 941 8,524 500 17128 Pontificia Universidad Católica de Chile Metropolitana 23 69 681 5,354 636 7706
Universidad de Concepción Bío Bío 23 41* 387* 2,677 469 5353 Universidad Austral de Valdivia Los Ríos 7 5 * 133 * 1,464 243 2755 Universidad de Santiago de Chile Metropolitana 11 14 217 1,895 233 2247
Universidad Técnica Federico Santa María Valparaíso 6 5 80 696 102 1103 Total Main Universities 105 226 2439 20,611 2,183 36292
Total Country 155 259 3337 25,862 3,902 50208 Main Participation 68% 87% 73% 80% 56% 72%
Source: Consejo Superior de Educación (CSE) 2009 and 2007. Note: * Year 2007.

A-36
Table A.3.9 Impact and Number of Publications in Selected Disciplines and Countries
1993-2003
Mathematics Physics Chemistry Astronomy Agriculture Sciences Engineering
Country Impact No. Pub. Impact No.
Pub. Impact No. Pub. Impact No.
Pub. Impact No. Pub. Impact No.
Pub. Argentina 2.24 542 5.6 6,421 4.6 6,082 8.1 929 3.6 1,272 3.1 1,663 Australia 3.34 3,736 7.2 16,524 9.1 17,072 15.7 368 5.7 11,814 3.4 14,112
Brazil 2.30 204 4.9 17,288 4.8 10,247 9.6 1,695 1.6 3,891 2.2 4,576 Chile 2.67 629 6.1 1,387 4.1 2,741 14.8 1,965 2.1 500 2.8 879
France 3.02 17,011 7.8 83,325 9.3 67,719 13.1 9,265 4.5 8,712 3.8 25,522 Germany 2.76 14,061 8.8 111,934 10 100,529 16.2 1,136 2.7 19,713 3.4 31,662
Israel 3.15 4,348 9.3 15,626 10 100,529 15.3 1,207 5.5 142 4.2 6,509 Japan 2.26 8,057 6.3 135,953 8.3 133,264 11.3 5,936 3.7 12,006 3.0 46,975
Mexico 1.69 852 4.0 9,487 4.7 4,756 9.9 1,648 4.1 1,008 2.6 1,862 New Zealand 2.70 728 7.3 1,981 8.0 3,865 8.8 308 5.4 3,415 2.9 2,183
Spain 2.26 6,162 7.2 26,869 7.9 41,734 11.0 4,718 4.1 3,645 3.9 10,771 UK 3.93 10,044 9.0 65,372 10.7 69,397 14.9 13,383 8.0 18,428 3.8 46,771
USA 4.07 52,139 11.9 234,311 13.1 250,562 14.9 45,296 6.4 70,078 4.9 193,469 Pacific Asia (not Japan) 2.38 21,307 4.1 163,735 5.0 160,018 9.5 9,737 3.2 33,544 2.4 92,252
European Union 3.12 61,644 7.8 360,535 9.7 359,997 12.9 44,635 5.1 72,129 3.6 166,718 Latin America 2.40 4,522 4.8 35,007 4.8 26,565 11.0 6,107 2.5 871 2.5 10,108
Source: Chilean Academy of Science. Note: No. Pub. (Number of Publications).

A-37
Table A.3.10 Budget for Science and Technology From CONICYT by Programmes (2004-2007)
(in Thousand of Dollars)
Programme (Current Transfers) 2004 2005 2006 2007
Astronomy Programme - 19.15 1,153.4 1,064.9
National Postgraduate Programmes 6,585.1 6,592.45 9,720.5 15,822.7
FONDECYT 29,827.7 35,339.52 42,271.4 49,058.5
FONDAP 7,341.8 7,885.37 8,835.0 9,221.5
FONDEF 19,493.8 20,466.75 24,817.2 23,120.3
Department of Scientific Information 79.5 86.28 89.3 250.6
Department of International Relationships 536.3 582.27 979.6 624.5
Explora 1,263.8 13.72 2,368.1 6,139.7
Regional Scientific and Technological Research Programmes 1,252.4 1,359.68 6,498.3 4,495.5
Bicentenary Science and Technology Programme 8,967.0 15,202.74 33,912.3 35,522.1
Programme of Base Financing for Scientific and Technological Centers of Excellence - - - 17,131.3
Total Current Transfers 75,347.4 88,906.29 134,828.1 162,451.8
Source: Comisión Nacional de Investigación Científica y Tecnológica (CONICYT).

A-38
Table A.3.11 Number of Scientific Publications in Chile and its Distribution Among Institutions
Publications by Institutions No. of Publications (over 50.208)
% of Total
% of Bío Bío Region
Universidad de Chile 17,128 34.11 Pontificia Universidad Católica de Chile 10,350 20.61
Universidad de Concepción 5,353 10.66 91.8 Universidad Austral de Chile 2,793 5.56
Universidad de Santiago de Chile 2,705 5.39 Pontificia Universidad Católica de Valparaíso 1,116 2.22
Universidad Técnica Federico Santa Maria 1,103 2.20 Universidad Católica del Norte 1,026 2.04
Universidad del Bío-Bío 326 0.65 5.6 Universidad Católica de la Santísima Concepción 120 0.24 2.1
Universidad San Sebastián 34 0.07 0.6 Source: Departamento de Propiedad Industrial (DPI), Ministerio de Economía.
Table A.3.12 Number and Distribution of Patents Registered by Chilean Universities by Institution (1995-2007)
Universities No. National Share %
Regional Share %
Universidad de Concepción 77 26.6 90.6 Universidad Técnica Federico Santa Maria 52 17.9
Universidad de Chile 38 13.1 Pontifícia Universidad Católica de Chile 30 10.3
Universidad de Santiago de Chile 21 7.2 Universidad de Antofagasta 12 4.1
Pontificia Universidad Católica de Valparaíso 10 3.4 Universidad Austral de Chile 8 2.8
Universidad Tecnológica Metropolitana 6 2.1 Universidad Católica del Norte 5 1.7
Universidad del Bío-Bío 4 1.4 4.7 Universidad Católica de las Santísima Concepción 4 1.4 4.7
Others 23 7.9 TOTAL 290 100.0 100.0
Source: Departamento de Proiedad Industrial (DPI), Ministerio de Economía. Note: The Universidad de Concepción had more than 100 patents as of April 2009.

A-39
Table A.3.13 Citation Indicators for National Publications and those from the Bío Bío Region (1988-2008)
Year Publication Citation Indicator
Country Bío Bío Region Country Bío Bío
Region Country Biobío Region
1988 1,415 111 134 7 0.1 0.1 1989 1,160 69 770 29 0.7 0.4 1990 1,241 88 1,849 101 1.5 1.1 1991 1,242 81 2,925 136 2.4 1.7 1992 1,321 106 4,058 188 3.1 1.8 1993 1,460 103 5,314 235 3.6 2.3 1994 1,453 110 6,391 268 4.4 2.4 1995 1,672 151 8,006 364 4.8 2.4 1996 1,776 167 10,485 541 5.9 3.2 1997 1,826 181 11,710 665 6.4 3.7 1998 1,925 218 13,343 816 6.9 3.7 1999 2,168 269 17,710 1,087 8.2 4.0 2000 2,410 301 19,790 1,333 8.2 4.4 2001 2,454 329 22,993 1,601 9.4 4.9 2002 2,768 364 26,737 2,043 9.7 5.6 2003 3,101 430 32,634 2,800 10.5 6.5 2004 3,179 416 34,198 3,050 10.8 7.3 2005 3,468 499 44,379 4,288 12.8 8.6 2006 3,874 483 49,016 4,973 12.7 10.3 2007 4,349 546 53,096 5,713 12.2 10.5 2008 4,626 609 69,319 7,768 15.0 12.8 Total 49,995 5,720 461,102 41,145 9.2 7.2
Source: ISI web of knowledge.

A-40
Table A.3.14 Research Centers of Higher Education Institutions in the in the Bío Bío Region (2009)
Nº Name Responsible Institution Productive Area or Related Scientific Field
1 GEA (Instituto de Geología Aplicada) Universidad de Concepción Mining 2 EULA (Centro de Ciencias Ambientales) Universidad de Concepción Environment, energy3 UDT ( Unidad de Desarrollo Tecnológico) Universidad de Concepción Technological transfer 4 TIGO (Observatorio Geodésico Integrado Transportable) Universidad de Concepción Astronomy5 CIPA (Centro de Investigación de Polímeros Avanzados) Universidad de Concepción Chemical industry (polymers, plastic) 6 COPAS (Center for Oceanographic Research in the
Eastern South Pacific) Universidad de Concepción Oceanography
7 Centro de Biotecnología Universidad de Concepción Biotechnology 8 CIEP (Centro de Investigación en Ecosistemas de la
Patagonia) Universidad de Concepción Patagonian ecosystems
9 CIAM (Centro de Investigación Aplicada al Mercado) Universidad Tecnológica de Chile (INACAP Headquarters Chillán) Business administration
10 Centro de Innovación en Educación Universidad Tecnológica de Chile (INACAP Headquarters Concepción) Education
11 Centro de Innovación en Energía Universidad Tecnológica de Chile (INACAP Headquarters Concepción) Energy
12 Centro de Innovación en Capital Humano Universidad Tecnológica de Chile (INACAP Headquarters Concepción) Human capital development

A-41
Table A.3.14 (continued) Higher Education Institutions Research Centers in the Bío Bío Region (2009)
13 Centro de Estudios Urbano Regionales, CEUR Universidad del Bío-Bío Regional development 14 Centro de Polímeros Avanzados, CIPA-UBB Universidad del Bío-Bío Science and technology of materials, plastic 15 Centro de Desarrollo en Informática Educativa, CIDCIE Universidad del Bío-Bío Information technologies and education 16 Centro para la Calidad de la Vivienda Universidad del Bío-Bío Building and architecture 17 Centro de Tecnología de la Madera Universidad del Bío-Bío Product design, wood products 18 Centro de Investigación Marítimo Portuario (CIMP) Universidad Católica de la Santísima
Concepción Territorial ordering, coast border, ports, transport, logistics, territorial fishing rights
19 Centro Regional de Estudios Ambientales (CREA). Universidad Católica de la Santísima Concepción
Process control, impact assessment, alleviation measures
20 Centro Teológico, Universidad Católica de la Santísima Concepción
Universidad Católica de la Santísima Concepción Theology, philosophy
21 Centro de Economía y Finanzas de la Empresa CEFE Universidad del Desarrollo Economics and finance 22 CIDE Centro de Innovación y Desarrollo Empresarial Universidad del Desarrollo Strategic innovation in operations management 23 Centro de Innovación Curricular y Pedagogía
Universitaria Universidad San Sebastián Education
24 Centro de Tecnología Mineral
Universidad de Concepción, Fundación Chile, Empresa Tecnología Productiva Red Cettem
Technologic transfer for mineral processing plants
Source: Comisión Nacional de Investigación Científica y Tecnológica (CONICYT), Universidad de Concepción, Universidad del Desarrollo, Universidad Católica de la Santísima Concepción, Universidad del Bío-Bío.

A-42
Table A.3.15 Innovation Consortia in Chile (2009)
Nº Name of Consortium Associated Institutions Productive Sector or Related Scientific Field
1 Consorcio para la Vid y el Vino (VINNOVA)
Viñas de Chile, Pontificia Universidad Católica de Chile, Universidad de Concepción.
Generates knowledge and innovative technologies to strengthen the wine industry’s competitiveness in the global markets.
2 Centro Cooperativo para el Desarrollo Vitivinícola S.A.
Universidad de Talca, Universidad de Chile, Universidad Federíco Santa María, CCV A.G. Chilevid A.G. Tonelería Nacional.
Technological development of the Chilean wine-growing industry that allows to increased competitiveness of wine on the international markets.
3 Consorcio Genómica Forestal Universidad de Concepción, Fundación Chile, Forestal Arauco S.A., Forestal Mininco S.A., CEFOR.
Biotechnology applied to the forest sector.
4 Consorcio Bioanimal Centrovet, Diagnotec, Neos, Universidad de Santiago de Chile.
Natural products for habitual pathogen treatment in the pork, poultry, and salmon industry.
5
Sixlabs – Desarrollo de Servicios de Valor Agregado IMS y sus Tecnologías para la Industria de Telecomunicaciones
Sixtra S.A..Sixbell, Fundación para la Transferencia Tecnológica (UNTEC), Commlogik Corporation (Intel).
Services based on IMS technology, for the telecommunications industry.
6 Consorcio Aquainnova Pesquera Antares, Universidad de Chile, SGS Aquatic Health.
Genetics and biotechnology applied to the salmon-growing industry.
7 Consorcio Micomo S.A: Desarrollo de Sistema Operacional Geomecánico
CODELCO, NTT Advanced Technology Corporation (Japan) y NTT Leasing (USA).
Information and communications technology for the mining industry.

A-43
Table A.3.15 (continued) Innovation Consortia in Chile (2009)
Nº Name of Consortium Associated Institutions Productive Sector or Related Scientific Field
8 Consorcio tecnológico de la industria hortofrutícola de exportación
Asociación de Exportadores de Chile A.G. (ASOEX), Fundación para el Desarrollo Frutícola, Pontificia Universidad Católica de Chile, Productores y Exportadores de frutas y hortalizas frescas, Fundación Ciencias para la Vida.
Fruit-growing industry.
9 Consorcio Tecnológico de la Leche
Universidad Austral de Chile, INIA, FEDELECHE F.G, APROQUESO, Colún, Quillayes, Nestlé, Soprole, etc. Dairy industry.
10 Consorcio Tecnológico de Acuicultura en Zonas Expuestas en Chile
Universidad de Concepción, SITECNA S.A, Pontificia Universidad Católica de Valparaíso, Pesquera Friosur, Mallas Rivet S.A., International Cooper Association Ltda., Fundación Chile, etc.
Aquaculture in exposed zones.
11
Innovación Biotecnológica en la Producción de Nuevas Variedades de Vides y Frutales de Carozo
Viveros Requinoa, Viveros El Tambo Ltda.,Vivero Agrícola Los Olmos, Universidad Nacional Andrés Bello, Universidad de Talca, Universidad de Chile, Universidad Técnica Federico Santa María, Sociedad Agrícola Uni-Agri Copiapó Ltda.., INST. DE INVEST. AGROPECUARIAS- INIA, FUNDACION CHILE, etc.
Biotechnology applied to the vine and fruit tree industry.
12 Centro de Tecnología e Innovación para el Cáncer
INIS BIOTECH, Southern Tecnología S.A., Vitrogen S.A., Indena S.A., Farmindustria, Universidad de la Frontera, Universidad Austral de Chile, Universidad de Concepción.
Health industry (technological solutions for cancer).

A-44
Table A.3.15 (continued) Innovation Consortia in Chile (2009)
Nº Name of Consortium Associated Institutions Productive Sector or Related Scientific Field
13
Desarrollo de tecnologías innovadoras y competitivas para la obtención de productos de alto valor agregado a partir de corrientes residuales de la industria nacional forestal, pesquera y vitivinícola
YT Ingeniería, Campos de la Unión Ltda., Pontificia Universidad Católica de Valparaíso.
High-value products from residuals of the forest, fishing, and wine-growing industries.
14 Consorcio Tecnológico Aeronáutico, (CTA) Universidad de Concepción, ENAER, COINFA, EADS.
Aeronautic industry (innovative products, technological transfer).
15 Consorcio BIOENERCEL S.A. Universidad de Concepción, Universidad Católica de Valparaíso, Fundación Chile, Arauco, CMPC y Masisa.
Bio-fuel industry, energy.
16 Consorcio Ovino Carnes Ñuble, Agro Ñuble, Mafrisur, Frima, Tattersall, Agromarin, INIA. Technological development for the ovine industry
17 Consorcio Tecnológico Apícola para el Mercado Global
Universidad Austral de Chile, Inversiones Carmencita Ltda., Apicoop Ltda., Río San Pedro Miel Ltda., Colmenares Santa Inés S.A., Soc. Agrícola, Forestal y Ganadera San Francisco Ltda, etc.
Technological transfer in the beekeeping industry
18 Consorcio de la Papa Universidad de los Lagos, Universidad Mayor, Semillas SZ, Agropilar, Seegood, Productores de papas, Asociaciones, etc.
Innovation and technological transfer in the potato industry
19 Consorcio para el Desarrollo de Soluciones Robóticas en la Minería
High Service, Codelco, Nippon Mining Metals, Kuka Roboter. Robotics applied to the mining industry.
Source: Comisión Nacional de Investigación Científica y Tecnológica (CONICYT), Ministerio de Agricultura, Universidad de Concepción.

A-45
Table A.3.16 Publication Indicators by Knowledge Area
National and for the Bío Bío Region
Research Area Bío Bío Region
Num
ber o
f Pub
licat
ions
B
ío B
ío R
egio
n (o
ver
5.98
7)
Are
a Sh
are
of R
egio
nal
Tota
l (%
)
Num
ber P
ublic
atio
ns
from
Chi
le (o
ver
50.2
08)
Are
a Sh
are
of N
atio
nal
Tota
l (%
)
Shar
e of
Reg
iona
l Are
a O
ver C
ount
ry A
rea
(%)
Chemistry, Multidisciplinary 490 8.18 1,628 3.24 30.10 Astronomy & Astrophysics 416 6.95 5,416 10.79 7.68
Ecology 347 5.80 1,877 3.74 18.49 Biochemistry & Molecular Biology 342 5.71 2,595 5.17 13.18
Marine & Freshwater Biology 288 4.81 1,420 2.83 20.28 Chemistry, Physical 268 4.48 1,200 2.39 22.33
Environmental Sciences 267 4.46 1,001 1.99 26.67 Polymer Science 262 4.38 687 1.37 38.14 Oceanography 242 4.04 558 1.11 43.37
Engineering, Chemical 235 3.93 768 1.53 30.60 Mathematics, Applied 221 3.69 1,084 2.16 20.39
Medicine, General & Internal 221 3.69 4,855 9.67 4.55 Plant Sciences 183 3.06 1,104 2.20 16.58
Biotechnology & Applied Microbiology 163 2.72 774 1.54 21.06 Biodiversity Conservation 159 2.66 878 1.75 18.11
Pharmacology & Pharmacy 141 2.36 1,064 2.12 13.25 Cell Biology 137 2.29 1,178 2.35 11.63
Veterinary Sciences 136 2.27 885 1.76 15.37 Engineering, Electrical & Electronic 122 2.04 486 0.97 25.10
Biology 111 1.85 1,190 2.37 9.33 Physics, Multidisciplinary 111 1.85 940 1.87 11.81
Dentistry, Oral Surgery & Medicine 109 1.82 609 1.21 17.90 Geosciences, Multidisciplinary 103 1.72 592 1.18 17.40
Toxicology 98 1.64 421 0.84 23.28 Zoology 97 1.62 810 1.61 11.98
Physiology 93 1.55 738 1.47 12.60 Total 5,362 90 34,758 69
Source. Elaborated using data from ISI web of knowledge.
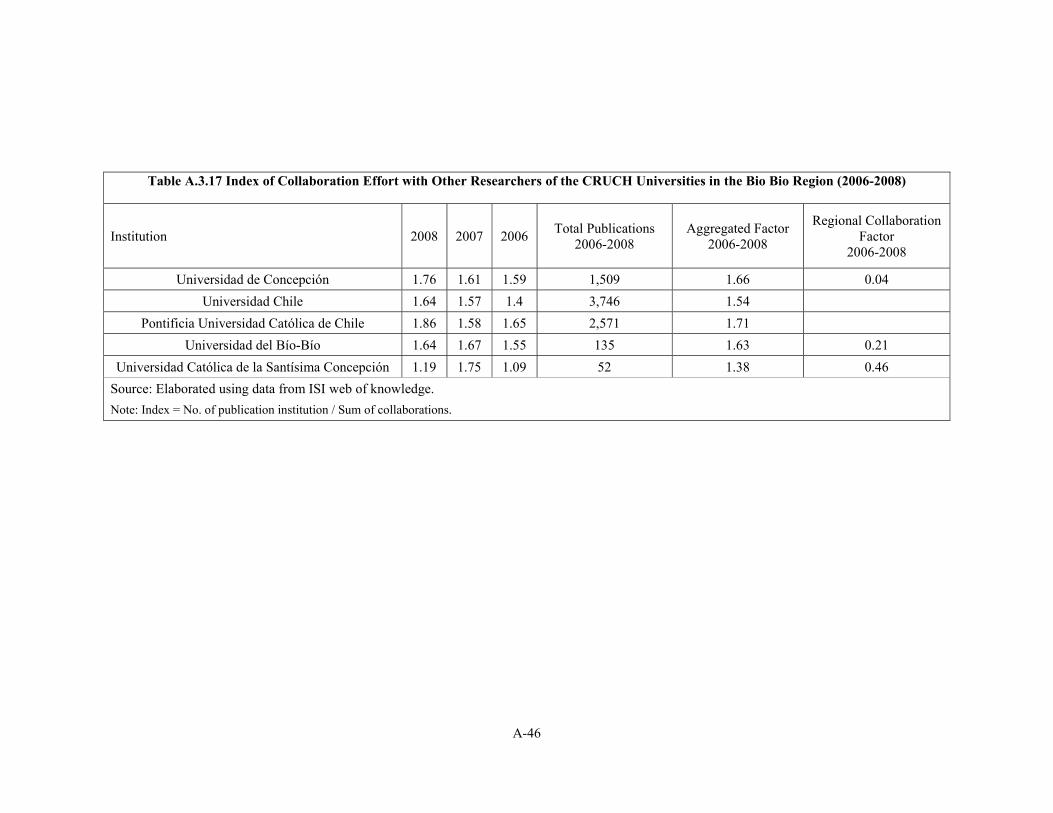
A-46
Table A.3.17 Index of Collaboration Effort with Other Researchers of the CRUCH Universities in the Bio Bio Region (2006-2008)
Institution 2008 2007 2006 Total Publications 2006-2008
Aggregated Factor 2006-2008
Regional Collaboration Factor
2006-2008
Universidad de Concepción 1.76 1.61 1.59 1,509 1.66 0.04 Universidad Chile 1.64 1.57 1.4 3,746 1.54
Pontificia Universidad Católica de Chile 1.86 1.58 1.65 2,571 1.71 Universidad del Bío-Bío 1.64 1.67 1.55 135 1.63 0.21
Universidad Católica de la Santísima Concepción 1.19 1.75 1.09 52 1.38 0.46 Source: Elaborated using data from ISI web of knowledge. Note: Index = No. of publication institution / Sum of collaborations.

A-47
.
Table A.3.18 Cooperation in Research and Development Activities by Region and Type of Cooperation (2005-2006)
Region Other Firms (%)
Chilean Universities (%)
Chilean Institutes or Centers (%)
Foreign Universities (%)
Foreign Institutes (%)
Tarapacá 16 6 35 1 0 Antofagasta 9 8 4 1 0
Atacama 43 25 19 2 0 Coquimbo 34 11 11 2 0 Valparaíso 18 11 3 1 5 O`Higgins 11 3 3 1 0
Maule 32 27 17 0 0 Bío Bío 28 7 9 1 1
Araucanía 16 12 10 0 0 Los Lagos 19 11 8 0 0
Aisen 5 5 3 0 0 Magallanes 20 7 8 0 0
Metropolitana 25 12 9 3 1 Non-classified firms 33 3 1 0 0
Total 24 11 9 2 1 Source. National Survey of Innovation, 2005-2006.
Note: Innovative firms considered.
Table A.3.19
Share of Innovative Firms in the Total by Size and According to Region (2006)
Región
Nº of innovative firms
Nº of firms in the survey Share
Classified by size Large Medium Small
Tarapacá 381 616 62% 59% 63% 62% Antofagasta 297 643 46% 67% 63% 31%
Atacama 83 353 24% 24% 20% 25% Coquimbo 352 860 41% 86% 60% 28% Valparaíso 610 2,183 28% 53% 50% 18% O`Higgins 427 1,558 27% 43% 55% 17%
Maule 473 1,697 28% 54% 17% 26% Bío Bío 1097 2,650 41% 64% 49% 35%
Araucanía 267 1,118 24% 68% 44% 17% Los Lagos 498 2,178 23% 35% 45% 14%
Aisen 88 219 40% 46% 70% 36% Magallanes 71 369 19% 44% 7% 18%
Metropolitana 3691 10,738 34% 53% 32% 30% Non-classified
firms 70 172 41% 27% 56% 41% Total 8303 25,356 33% 53% 40% 26%
Source: Elaborated using the National Survey of Innovation 2006.

A-48
Table A.3.20 Knowledge about Existence and Use of Funds by Source and According to Region
Regions
Knowing of funds by source Use of funds by source Innova Chile Fondef Fia
Innova Bio Bio
Innova Chile Fondef Fia
Innova Bio Bio
Tarapacá 15% 18% 2% 2% 1,8% 1,1% 0,0% 0,0% Antofagasta 19% 18% 2% 3% 0,7% 1,3% 0,0% 0,0%
Atacama 21% 30% 9% 7% 2,4% 2,4% 0,0% 0,0% Coquimbo 30% 41% 19% 15% 2,8% 2,8% 0,3% 0,0% Valparaíso 23% 35% 6% 14% 3,5% 3,0% 0,3% 0,3% O`Higgins 33% 28% 18% 2% 0,5% 6,8% 0,0% 0,0%
Maule 26% 30% 33% 16% 0,7% 0,0% 0,0% 0,0%Bío Bío 48% 43% 23% 53% 0,5% 5,7% 4,9% 2,7%
Araucanía 9% 28% 27% 3% 1,0% 0,4% 0,0% 0,4% Los Lagos 25% 23% 10% 5% 2,3% 2,4% 4,2% 0,7%
Aisen 37% 14% 23% 3% 2,3% 0,0% 0,0% 0,0% Magallanes 44% 50% 44% 29% 4,9% 0,0% 3,5% 0,0%
Metropolitana 25% 30% 8% 9% 3,7% 1,9% 0,3% 0,1% Non-classified
firms 20% 24% 12% 14% 1,4% 5,7% 0,0% 0,0% Total 28% 31% 13% 15% 2,5% 2,6% 1,1% 0,4%
Source: Elaborated using the National Survey of Innovation 2006

A-49
Figure A.3.1 Relationship Between Research and Development Intensity and Gross Domestic Product in Several Countries (2008)
(by Purchasing Power Parity)
0.0
0.5
1.0
1.5
2.0
2.5
3.0
3.5
4.0
10,000 20,000 30,000 40,000 50,000 60,000
GDP
R&D/GDP (%)
Finland
ChileIreland
USA
Source: OECD (2008) and Red Iberoamericana de Indicadores de Ciencia y Tecnología (RICYT).
Note: R&D (Research and Development), GDP (Gross Domestic Product).

A-50
Figure A.3.2 Relationship Between per Capita Research and Development and per Capita Gross Domestic Product in Several Countries (2008)
1.501.70
1.902.10
2.302.502.70
2.903.10
3.303.50
10,000 20,000 30,000 40,000 50,000 60,000GDP per capita
log
(R&
D p
er c
apita
)
Sweden
Chile
Korea
Mexico
Source: OECD, (2008).
Note: R&D (Research and Development), GDP (Gross Domestic Product).

A-51
Diagram A.3.1 Institutional Framework of the Chilean Innovation System
GobiernoNational Innovation
Council forCompetitiveness
National InnovationFund for
Competitiveness
Presidency of the Republica
Ministry ofTreasury
Risk financing and seed
capital sector
Universities
Technological Institutes
Centers of Excellence
Ministry ofEconomy
Ministry ofEducation
Sectorial Ministries of:Agriculture and Health
Ministry ofPlanning
FinancingAgencies
SupportPrograms
CORFO FIP CONICYT FIA FONIS
InnovaChile
InnovaBío-Bío
FONDEF FONDECYT FONDAPMECESUP
ICM
Executors:(Research andInnovation,Technological Transfer andDissemination)
Private and publicBusinesses
ConsorciaConsorcia
PBCT
FoundationsChile
FoundationsChile
Source: OECD Reviews of Innovation Policy, Chile. OECD (2007).

A-52
Diagram A.3.2 The Learning Trajectory of the Chilean Innovation System
Source: OECD Reviews of Innovation Policy; Chile, 2007

A-53
ANNEX 4
Table A.4.1 Integration and Coverage Initiatives in the Chilean System
Name Institution Beneficiaries Characteristics
INTE
GR
ATI
ON
Indigenous Scholarship JUNAEB / MINEDUC
Children, teenagers, and adults studying primary, secondary, or tertiary education with good academic performance and a vulnerable socioeconomic situation.
Economic support for indigenous students to access and stay in the educational system. It requires native ethnicity, a risky socioeconomic and family situation, and an average grade of 4.5 out of 7.
Subsidies, training, and specialization for Indigenous People
CONADI / MIDEPLAN
Professionals and workers belonging to the ethnic minorities.
Support during one year for specialization of professionals and workers of ethnic minorities to develop topics related to identity. It has three components: 1) competitive grants, 2) associations with universities for the education of teachers in a bilingual system, and 3) associations with universities and national institutions for scholarships for professionals of ethnic minorities.
Support for students with disabilities
FONADIS / MIDEPLAN
People with physical, mental, or other types of disabilities at any level of the educational system.
Support for the integration of disabled people into the educational system. It funds, totally or partially, the equipment, materials of personal use, technological elements, etc. that facilitate access to academic activities for one year.
Valech Law Fellowship MINEDUC Victims of political prison and torture in the past military regime. 100% of any cost of tuition at any HEI.

A-54
Table A.4.1 (continued) Integration and Coverage Initiatives in the Chilean System
Name Institution Beneficiaries Characteristics
CO
VER
AG
E
Student ID JUNAEB / MINEDUC
Students from 5th grade in primary school to university students, except those in the upper quintile.
ID that allows students a differentiated fee on public transportation.
Scholarship for the entrance exam to public universities (PSU)
JUNAEB / MINEDUC
Poor students that want to take the entrance exam required to apply to public universities.
Total cost of the exam.
Student housing programme
JUNAEB / MINEDUC
Vulnerable students required to relocate to another city. Shelter, food, and pedagogical help for these students.
Distant zone scholarship JUNAEB /MINEDUC
Poor students with outstanding academic performance from distant zones. Monthly stipend for shelter, food, and travel.
Food scholarship for tertiary education
JUNAEB / MINEDUC
Students who have obtained any other scholarship for tertiary education. 10 months of food support.
Solidarity credit fund for universities MINEDUC Poor students that want to continue
education in any CRUCH university.
Total or partial financial support through cheap credit (2% monthly interest rate) payable beginning two years after graduation and depending on the graduate’s labour status. The payment corresponds to 5% of the annual income.
Government-backed credit (Law 20.027)
Ingresa Commission / MINEDUC
Poor students.
Credit to students from poor families to continue university education. It covers 100% of the cost (using a standardized equivalent of price for higher education). The interest rate is lower than the market rate and can be paid over 20 years, beginning one and a half years after graduation.
Outstanding student fellowship for the university entrance exam (PSU)
MINEDUC
Students with the best mark on the PSU at the national and regional level (no private schools) and belonging to the first four quintiles.
Total or partial financial support of university studies.
President of the Republic Scholarship
JUNAEB / MINEDUC
Poor students with outstanding academic performance that have already obtained the President of the Republic Fellowship for their high school education.
Monthly stipend.

A-55
Table A.4.1 (continued) Integration and Coverage Initiatives in the Chilean System
Name Institution Beneficiaries Characteristics
CO
VER
AG
E
Juan Gómez Millas Scholarship MINEDUC Students of poor background with
outstanding academic performance. Total or partial financial support of university studies in a HEI.
Bicentenary Scholarship MINEDUC Students with outstanding academic performance enrolled in a CRUCH university.
Total financial support of university studies.
Outstanding Student Scholarship MINEDUC 5% of the best marks from public high
schools. Total financial support for university studies.
Stipend Scholarship JUNAEB / MINEDUC
Poor students that enter the first year of a HEI and that obtained the Bicentenary Scholarship, the Juan Gómez Millas Scholarship, Outstanding Student Scholarship or Outstanding Student fellowship for the PSU.
Monthly stipend.
Scholarship for students in pedagogy MINEDUC
Students that have decided to study pedagogy with good academic performance.
Total financial support for a major in pedagogy.
Scholarship for descendants of professionals working in the education system
MINEDUC Sons and daughters of professionals working in the educational system and graduates of non-private high schools.
Total or partial financial support of university studies.
New millennium scholarship MINEDUC
Graduates from non-private high schools from poor families enrolled in the first year of a technical major.
Total or partial financial support of CFT or IP studies.
Scholarship Juan Gómez Millas for foreign students MINEDUC
Foreign students from Latin America and the Caribbean with vulnerable socioeconomic backgrounds.
Total or partial financial support of university studies.

A-56
Table A.4.1 (continued) Integration and Coverage Initiatives in the Chilean System
Name Institution Beneficiaries Characteristics
POST
GR
AD
UA
TE
National scholarship programme for postgraduate education
CONICYT / MINEDUC
Chilean and non-Chilean students with outstanding academic performance.
Total or partial financial support of graduate, master’s or doctoral studies.
Scholarship for studies abroad
CONICY / MINEDUC
Chilean and non-Chilean students, residents in Chile. Monthly stipend for general expenditures and travel costs.
President of the Republic Scholarship for studies abroad
MIDEPLAN Public and academic workers of Chilean universities and IP graduates.
Monthly stipend, tuition, and other expenditures associated with graduate studies abroad.
President of the Republic Scholarship for studies in Chile
MIDEPLAN Public workers that want to study in Chile.
Monthly stipend, tuition, and other expenditures associated with graduate studies in Chile.
International cooperation scholarship
AGCI / MINREX
University graduates and high school graduates. Regular or special scholarships for different countries.
Opportunities for academic and professional training for Chileans
AGCI / MINREX
Chileans interested in any professional specialization abroad. Different support depending on the programme.
Source: Council for scholarly help and scholarships (Junta Nacional de Auxilio Escolar y Becas, JUNEAB), Ministry of Planning (Ministerio de Planificación y Cooperación, MIDEPLAN), Ministry of Education (Ministerio de Educación, MINEDUC).
Note: AGCI (International Cooperation Agency, Chile), CONICYT (National Commission for Scientific Research and Technology), CONADI (National Organisation for Indigenous Development), FONADIS (National Fund for Disability), MINREX (Ministry of International Affairs).
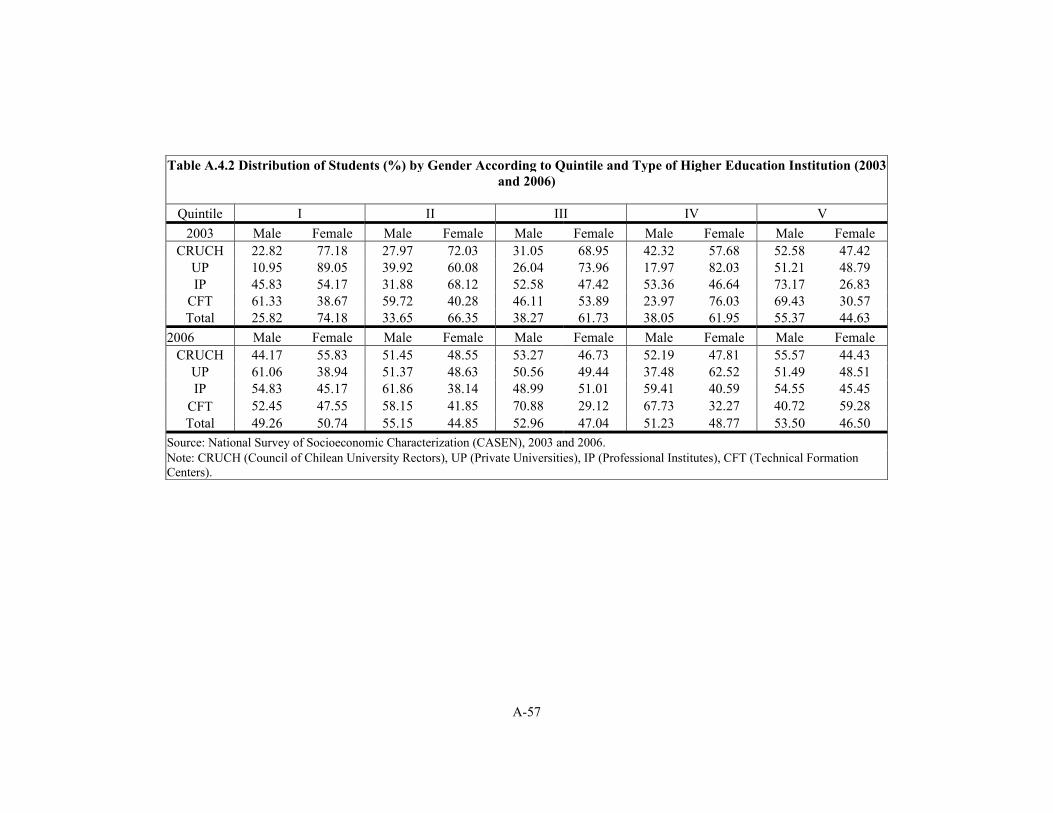
A-57
Table A.4.2 Distribution of Students (%) by Gender According to Quintile and Type of Higher Education Institution (2003 and 2006)
Quintile I II III IV V 2003 Male Female Male Female Male Female Male Female Male Female
CRUCH 22.82 77.18 27.97 72.03 31.05 68.95 42.32 57.68 52.58 47.42 UP 10.95 89.05 39.92 60.08 26.04 73.96 17.97 82.03 51.21 48.79 IP 45.83 54.17 31.88 68.12 52.58 47.42 53.36 46.64 73.17 26.83
CFT 61.33 38.67 59.72 40.28 46.11 53.89 23.97 76.03 69.43 30.57 Total 25.82 74.18 33.65 66.35 38.27 61.73 38.05 61.95 55.37 44.63
2006 Male Female Male Female Male Female Male Female Male Female CRUCH 44.17 55.83 51.45 48.55 53.27 46.73 52.19 47.81 55.57 44.43
UP 61.06 38.94 51.37 48.63 50.56 49.44 37.48 62.52 51.49 48.51 IP 54.83 45.17 61.86 38.14 48.99 51.01 59.41 40.59 54.55 45.45
CFT 52.45 47.55 58.15 41.85 70.88 29.12 67.73 32.27 40.72 59.28 Total 49.26 50.74 55.15 44.85 52.96 47.04 51.23 48.77 53.50 46.50
Source: National Survey of Socioeconomic Characterization (CASEN), 2003 and 2006. Note: CRUCH (Council of Chilean University Rectors), UP (Private Universities), IP (Professional Institutes), CFT (Technical Formation Centers).

A-58
Table A.4.3 Distribution of Students (%) by Quintile According to Gender and Type of Higher Education Institution (2003 and 2006)
Quintile I II III IV V 2003 Male Female Total Male Female Total Male Female Total Male Female Total Male Female Total
CRUCH 4.94 11.59 8.86 7.24 12.94 10.61 13.53 20.85 17.85 25.44 24.05 24.62 48.84 30.57 38.05 UP 1.03 4.87 3.45 4.65 4.09 4.29 7.14 11.83 10.10 14.57 38.82 29.88 72.62 40.39 52.27IP 0.71 1.05 0.86 8.04 21.39 13.99 26.49 29.75 27.94 28.85 31.40 29.98 35.92 16.41 27.23
CFT 16.01 8.88 12.21 30.28 17.96 23.73 31.78 32.66 32.25 13.33 37.17 26.01 8.60 3.33 5.79 2006 Male Female Total Male Female Total Male Female Total Male Female Total Male Female Total
CRUCH 11.83 16.33 13.98 10.39 10.69 10.53 18.07 17.30 17.70 28.17 28.16 28.16 31.54 27.52 29.62 UP 7.59 4.38 5.91 6.58 5.64 6.08 11.13 9.86 10.46 24.82 37.52 31.48 49.89 42.60 46.06 IP 10.23 10.53 10.36 11.67 8.99 10.48 21.56 28.05 24.45 34.34 29.31 32.10 22.21 23.12 22.62
CFT 10.05 13.30 11.37 26.78 28.14 27.33 31.78 19.06 26.61 19.04 13.24 16.68 12.35 26.26 18.00 Source: National Survey of Socioeconomic Characterization (CASEN), 2003 and 2006. Note: CRUCH (Council of Chilean University Rectors), UP (Private Universities), IP (Professional Institutes), CFT (Technical Formation Centers).

A-59
Table A.4.4 Assessment of Competences Obtained from the Higher Education Institutions of the Bío Bío Region by Type of Qualified Informers (2009)
Competencies
HEI Business Public Sector and Others
Total
Not
Res
pons
e
Insu
ffic
ient
Reg
ular
Goo
d
Ver
y G
ood
Not
Res
pons
e
Insu
ffic
ient
Reg
ular
Goo
d
Ver
y G
ood
Not
Res
pons
e
Insu
ffic
ient
Reg
ular
Goo
d
Ver
y G
ood
Capacity for abstraction, analysis, and synthesis 20 8 14 36 13 1 4 26 16 1 3 8 3 7 0 160
Ability to work autonomously 20 2 12 35 22 1 5 22 17 3 3 6 6 6 0 160
Knowledge of area of study and the profession 23 1 2 33 32 2 2 9 32 3 3 2 1 15 0 160
Capacity for oral and written communication 20 11 24 29 7 1 12 20 13 2 3 9 7 2 0 160
Capacity for practical application of knowledge 22 0 8 34 27 1 4 19 23 1 3 1 13 4 0 160
Capacity to communicate in a second language 21 34 23 11 2 2 31 12 1 2 3 13 4 1 0 160
Abilities to use information technologies 20 0 7 36 28 1 1 10 27 9 3 3 5 8 2 160
Decision-making capacity 23 1 18 34 15 3 7 25 11 2 3 2 12 4 0 160
Interpersonal abilities 22 0 17 39 13 1 7 21 19 0 3 4 12 2 0 160
Capacity to work as team 20 0 17 34 20 2 2 21 19 4 3 0 10 8 0 160
Total 211 57 142 321 179 15 75 185 178 27 30 48 73 57 2 1,600 Source: Surveys applied to different actors.

A-60
Table A.4.5 Assessment of Competences Obtained by Graduate of the Higher Education Institutions of the Bío Bío Region by Employers (2009)
Competencies NR Insufficient Regular Good Very Good Total1 Capacity for abstraction, and synthesis 1 4 26 16 1 48 2 Capacity to learn to up-date knowledge 13 0 8 25 2 48 3 Ability to work autonomously 1 5 22 17 3 48 4 Knowledge of are of study and the profession 2 2 9 32 3 48 5 Capacity to identify, pose, and solve problems 12 1 18 15 2 48 6 Capacity for criticism and self-criticism 12 6 17 13 0 48 7 Capacity to research 13 4 20 11 0 48 8 Abilities to seek for, process, and analyze information 12 1 12 20 3 48 9 Capacity for oral and written communication 1 12 20 13 2 48 10 Capacity for practical application of knowledge 1 4 19 23 1 48 11 Commitment to the social-cultural environment 12 7 15 12 2 48 12 Valuing and respect for diversity, multiculturality, and the environment 13 3 15 14 3 48 13 Social responsibility and citizenship 12 5 14 14 3 48 14 Ethnical commitment 12 1 9 21 5 48 15 Capacity to communicate in a second language 2 31 12 1 2 48 16 Ability to work in international contexts 12 15 17 3 1 48 17 Abilities to use information technologies 1 1 10 27 9 48 18 Decision-making capacity 3 7 25 11 2 48 19 Interpersonal abilities 1 7 21 19 0 48 20 Capacity to motivate and work towards common goals 12 5 15 13 3 48 21 Capacity to work as a team 2 2 21 19 4 48 22 Capacity to organize and plan time 12 5 17 13 1 48 23 Capacity to act in new situations 12 4 16 13 3 48
Total 174 132 378 365 55 1,104Source: Surveys applied to different actors.

A-61
Map A.4.1 Distribution of Offered Undergraduate Degrees from the Higher Education System by Sector of Economic Activity and Labour Demand According to Commune
Bío Bío Region (2008)
Commerce
Agriculture andStockbreeding

A-62
Map A.4.1 (continued) Distribution of Offered Undergraduate Degrees from the Higher Education System by Sector of Economic Activity and Labour Demand According to
Commune
Bío Bío Region (2008)
Forestry
Fishing

A-63
Map A.4.1 (continued) Distribution of Offered Undergraduate Degrees from the Higher Education System by Sector of Economic Activity and Labour Demand According to
Commune
Bío Bío Region (2008)
Electricity, Gas and Water
Construction

A-64
Map A.4.1 (continued) Distribution of Offered Undergraduate Degrees from the Higher Education System by Sector of Economic Activity and Labour Demand According to
Commune
Bío Bío Region (2008)
Mining
Manufacturing

A-65
Map A.4.1 (continued) Distribution of Offered Undergraduate Degrees from the Higher Education System by Sector of Economic Activity and Labour Demand According to
Commune
Bío Bío Region (2008)
Financial Services
Social and PersonalServices

A-66
Map A.4.1 (continued) Distribution of Offered Undergraduate Degrees from the Higher Education System by Sector of Economic Activity and Labour Demand According to
Commune
Bío Bío Region (2008)
Transportation andTelecommunications
Transversal
Source: Our own classification based on information from the Consejo Superior de Educación, 2008.

A-67
Figure A.4.1 Number Branches of Higher Education Institutions by Year and Type
Bío Bío Region (2000-2007)
0
5
10
15
20
25
30
2000 2002 2003 2004 2005 2006 2007
CRUCH Private Universities Professional Institutes Technical Formation Centers
Nº
Year
Source: Ministry of Education (www.educacionsuperiorchile.cl).
Note: CRUCH (Council of Chilean University Rectors).

A-68
Figure A.4.2 Enrollment by Year and Type of Higher Education Institution in the Bío Bío Region
Number of Students, 2000-2007
05,000
10,00015,00020,00025,00030,00035,00040,00045,000
2000 2001 2002 2003 2004 2005 2006 2007
CRUCH Private Universities Professional Institutes Technical Formation Centers
Nº
Year
Source: Ministry of Education (www.educacionsuperiorchile.cl).
Note: CRUCH (Council of Chilean University Rectors).

A-69
Figure A.4.3 Distribution of Degrees by Type of Institution
Bío Bío Region (2007)
Technical Formation Centers
21%
Private Universities22%
CRUCH17% Professional
Institutes40%
Source: Ministry of Education (www.educacionsuperiorchile.cl).
Note: CRUCH (Council of Chilean University Rectors).

A-70
Figure A.4.4 Employment by Sector of Economic Activity
Bío Bío Region (2006)
Electricity, Gas and Water
1%Construction
9%Tranportation and
Telecommunications7%
Financial Services5%
Social and Personal Services
28%
Agriculture, Hunting and Fishing
16% Mining0%
Manufacturing15%
Not Classified1%
Commerce18%
Source: Instituto Nacional de Estadísticas (INE).
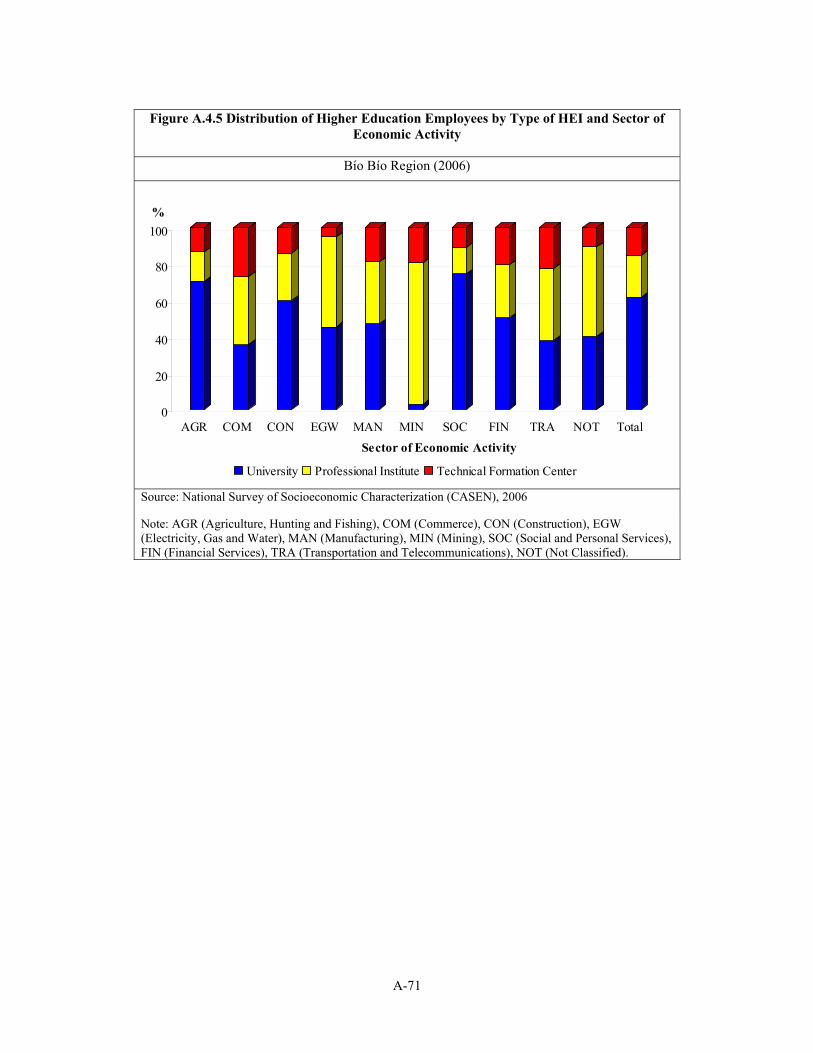
A-71
Figure A.4.5 Distribution of Higher Education Employees by Type of HEI and Sector of Economic Activity
Bío Bío Region (2006)
0
20
40
60
80
100
AGR COM CON EGW MAN MIN SOC FIN TRA NOT Total
University Professional Institute Technical Formation Center
%
Sector of Economic Activity
Source: National Survey of Socioeconomic Characterization (CASEN), 2006
Note: AGR (Agriculture, Hunting and Fishing), COM (Commerce), CON (Construction), EGW (Electricity, Gas and Water), MAN (Manufacturing), MIN (Mining), SOC (Social and Personal Services), FIN (Financial Services), TRA (Transportation and Telecommunications), NOT (Not Classified).

A-72
Figure A.4.6 Distribution of Offered Undergraduate Degrees from the Regional HE System by Sector of Economic Activity
Bío Bío Region (2008)
Transversal26%
Financial Services7%
Transportation and Telecommunications
2%
Social and Personal Services
37%
Agriculture, Hunting and Fishing
5%
Commerce5%
Mining0%
Manufacturing12%
Construction5%
Electricity, Gas and Water
1%
Source: Our own classification based on information from the Consejo Superior de Educación (CSE), 2008.

A-73
Figure A.4.7 Distribution of Undergraduate Degrees Offered by the Regional HEIs by Sector of Economic Activity
Bío Bío Region (2008)
0
20
40
60
80
100
AGR COM CON EGW GEN MAN SOC FIN TRA
CRUCH Private University Professional Institute Technical Formation Center
Sector of Economic Activity
%
Source: Our own classification based on information from the Consejo Superior de Educación (CSE), 2008. Note: AGR (Agriculture, Hunting and Fishing), COM (Commerce), CON (Construction), EGW (Electricity, Gas and Water), GEN (General), MAN (Manufacturing), MIN (Mining), SOC (Social and Personal Services), FIN (Financial Services), TRA (Transportation and Telecommunications).

A-74
Figure A.4.8 Distribution of Offered Undergraduate Degrees from the Regional HE System in Agriculture, Fish and Stockbreeding
Bío Bío Region (2008)
Fishing21%
Forestry21% Agricultura and
Stockbreeding58%
Source: Our own classification based on information from the Consejo Superior de Educación (CSE), 2008.

A-75
Figure A.4.9 Number of University Graduate Programmes by Institution and Province
Bío Bío Region in year 2008
0
10
20
30
40
50
60
70
80
CRUCH Private University
Arauco Bío-Bío Concepción Ñuble
Nº
Institution
Source: Consejo Superior de Educación (CSE), 2008.
Note: CRUCH (Council of Chilean University Rectors).
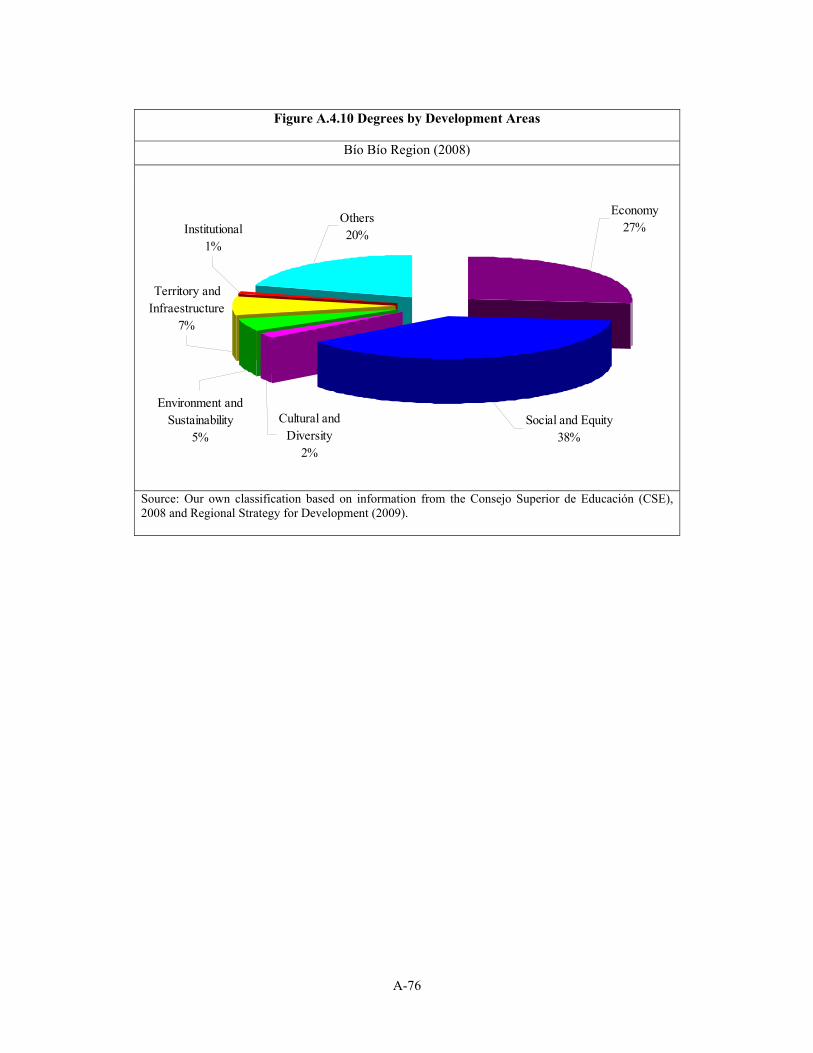
A-76
Figure A.4.10 Degrees by Development Areas
Bío Bío Region (2008)
Economy27%
Social and Equity38%
Others20%
Cultural and Diversity
2%
Environment and Sustainability
5%
Institutional1%
Territory and Infraestructure
7%
Source: Our own classification based on information from the Consejo Superior de Educación (CSE), 2008 and Regional Strategy for Development (2009).

A-77
Figure A.4.11 Distribution of Degrees Offered by the Regional HEIs by Type of Institution and Area of Development
Bío Bío Region (2008)
0
20
40
60
80
100
Economy Social andEquity
Cultural andDiversity
Environmentand
Sustainability
Territory andInfraestructure
Institutional Others
CRUCH Private University Professional Institute Technical Formation Center
Area of Development
%
Source: Our own classification based on information from the Consejo Superior de Educación (CSE), 2008 and Regional Strategy for Development (2009). Note: CRUCH (Council of Chilean University Rectors).

A-78
Figure A.4.12 Distribution of the Headquarters of the Higher Education Institutions by Locality
Bío Bío Region (2008)
Arauco1% Bío-Bío
12%
Concepción67%
Lebu0%
Ñuble20%
Source: Consejo Superior de Educación (CSE), 2008.

A-79
Figure A.4.13 Rate of Enrolment in HEIs per 1,000 Inhabitants in Different Localities
Distribution of Offered Undergraduate Degrees from the Higher Education System, Bío Bío Region (2008)
0
50
100
150
200
250
300
Talcahuano Concepción Chillán Los Ángeles Lebu Cañete Lota
University Professional Institute Technical Formation Center
Locality
Nº
Source: Consejo Superior de Educación (CSE), 2008.

A-80
Figure A.4.14 Average Wages Earned by Technical Formation Centers Graduates Employed by Sector of Economic Activity (pesos per month)
Bío Bío Region and Country (2006)
0
100,000
200,000
300,000
400,000
500,000
600,000
AGR COM CON EGW MAN MIN SOC FIN TRA NOT Total
Sector of Economic Activity
$/month
Bío Bío Region Country
Source: National Survey of Socioeconomic Characterization (CASEN), 2006.
Note: AGR (Agriculture, Hunting and Fishing), COM (Commerce), CON (Construction), EGW (Electricity, Gas and Water), MAN (Manufacturing), MIN (Mining), SOC (Social and Personal Services), FIN (Financial Services), TRA (Transportation and Telecommunications), NOT (Not Classified).

A-81
Figure A.4.15 Average Wages Earned by Professional Institute Graduates Employed by Sector of Economic Activity (pesos per month)
Bío Bío Region and Country (2006)
0
100,000
200,000
300,000
400,000
500,000
600,000
AGR COM CON EGW MAN MIN SOC FIN TRA NOT Total
Sector of Economic Activity
$/month
Bío Bío Region Country
Source: National Survey of Socioeconomic Characterization (CASEN), 2006.
Note: AGR (Agriculture, Hunting and Fishing), COM (Commerce), CON (Construction), EGW (Electricity, Gas and Water), MAN (Manufacturing), MIN (Mining), SOC (Social and Personal Services), FIN (Financial Services), TRA (Transportation and Telecommunications), NOT (Not Classified).

A-82
Figure A.4.16 Average Wages Earned By University Graduates Employed by Sector of Economic Activity (pesos per month)
Bío Bío Region and Country (2006)
0
200,000
400,000
600,000
800,000
1,000,000
1,200,000
1,400,000
1,600,000
AGR COM CON EGW MAN MIN SOC FIN TRA NOT Total
Sector of Economic Activity
$/month
Bío Bío Region Country
Source: National Survey of Socioeconomic Characterization (CASEN), 2006.
Note: AGR (Agriculture, Hunting and Fishing), COM (Commerce), CON (Construction), EGW (Electricity, Gas and Water), MAN (Manufacturing), MIN (Mining), SOC (Social and Personal Services), FIN (Financial Services), TRA (Transportation and Telecommunications), NOT (Not Classified).

A-83
Figure A.4.17 Rate of Unemployment by Type of Higher Education Graduate
Bío Bío Region and Country (2006)
0.0
2.0
4.0
6.0
8.0
10.0
12.0
TechnicalFormationCenters
ProfessionalInstitutes
Universities Graduates Other Total
Institution
%
Bío Bío Region Country
Source: National Survey of Socioeconomic Characterization (CASEN) 2006.

A-84
Figure A.4.18 Distribution of Export Value Originated in the Bío Bío Region
by Principal Export Sectors (2008)
Agricultura and Stockbreeding
7%
Fishing10%
Other Exports2%
Forestry70%
Other Manufacture11%
Source: Instituto Nacional de Estadísticas (INE).

A-85
ANNEX 5
Qualified Informers
The qualified informers that participated in the interviews aimed at recovering information about the contribution of the Higher Education Institutions (HEI) to regional development in the Bío Bío Region are as follows:
Social Development:
• Sergio Moffat, Head of Centro de Estudios Urbano Regionales (CEUR), Universidad del Bío Bío. Former Vice Rector of the Universidad del Bío Bío and former Regional Planning Secretary (Secretario Regional Ministerial de Planificación) of the Regional Government. Coordinator of the team that wrote the Regional Strategy for Development (2008-2015).
• German Dante Gebauer, Regional Government Secretary.
• Miguel Rojas Norambuena, Regional Education Secretary.
• Luis Quiñones, Head of the Technical Formation Center, CFT Lota-Arauco.
• Guillermo Schaffeld, General Director for Research and Community Relations Office of the Universidad San Sebastián.
Arts and Cultural Development:
• Nieves Alonso, Head of Community Relations Office, Universidad de Concepción.
• Patricio Clark, Head of Arts and Cultural Department, Universidad del Bío Bío. General Producer of theater seasons, Concepción/Chillán.
• Luis Manuel Aguirre, Head of the Regional Council of Arts and Culture.
• Francisco Pino Bustos, Representative of the universities to the Regional Sports Committee of CHILE DEPORTES. Head of the Sports and Physical Activity Department of the Universidad del Bío Bío.
Environmental Sustainability:
• Bolívar Ruiz, Head of Regional CONAMA (Comisión Nacional del Medio Ambiente), Bío Bío Region.
• Oscar Parra, Head of Environmental Sciences Center EULA, Universidad de Concepción.

A-86
Table A.5.1 Programmes, Agreements, and Actions Developed by the Higher Education Institutions in the Bío Bío Region for Social Development
Traditional Regional Universities
Centres Regular Programmes Collaborative Agreements Actions • CICAT Interactive Centre for
Science, Arts, and Technology, for regional students and communities.
• Centre of Urban and Regional Studies, CEUR.
• Centre for the Development of Computer-based Education, CIDCIE.
• Programme of Public Policies: consulting for the Health Services in participatory budgets, development of programmes on gender, the elderly, and citizenship.
• RSE, Corporate Social Responsibility.
• PROCE, Programme of Scientific Development in Schools.
• Interdisciplinary Drug Programme.
• Development of social responsibility in students.
• Science and Technology Fair for primary and secondary schools in the region and the country.
• Social programme of preparation for the college entrance exam.
• Support programmes for disabled students.
• Regular competitive funds for student initiatives that will impact the local community.
• FNDR project, Aula Magna for Talcahuano and Hualpén.
• Un Techo para Chile (A Roof for Chile).
• Adopta un Hermano (Big Brothers / Big Sisters).
• National Council for the Control of Drugs, CONACE.
• Municipalities: academic and professional collaboration in education, health, management, and social programmes.
• Regional Government (GORE): Elaboration of a Regional Development Strategy for the Bío Bío Region.
• Health Services: improving hospital management in the Bío Bío Region.
• Ministry of Education (MINEDUC): Support for priority primary and secondary schools.
• Uniformed Police: tertiary formation of technicians in construction for inmates of El Manzano penitentiary.
• Support projects for the ethnic identity of students.
• Summer work programmes.
• Support for students in local “campamentos”, informal, precarious residential sectors.
• Support for national and regional solidarity campaigns.
• Blood donation campaign.
• Workshops, seminars, and reflective colloquia regarding matters of ethnicity, gender, and social exclusion.

A-87
Table A.5.1 Programmes, Agreements, and Actions Developed by the Higher Education Institutions in the Bío Bío Region for Social Development
Private Traditional Regional Universities
Centres Regular Programmes Collaboration agreements Actions • Faculty of Medicine and Hogar de
Cristo: “Health Operations” in Concepción.
• Free preparation for college entrance exam.
• UTFSM: psychological care for students and employees of the Universidad Técnica Federico Santa María.
• Direction of Municipal Administration and Education (DAEM) Hualpén: psychological care for adults and children.
• Participation in the Regional Forum (Bío Bío) on the Quality of Education.
• Ministry of Education (MINEDUC): training for teachers from different priority secondary schools.
• TELETÓN: canine therapy.
• Social assistance, agreement with the Concepción branch of Hogar de Cristo.
• Psycho-educational diagnosis in Education in Talcahuano.
• Technical consulting for four secondary schools in the Bío Bío Region in deficient management areas.
• Support for the development of healthy schools.
• Workshops, seminars, and reflective colloquia on matters of social integration and vulnerability.

A-88
Table A.5.1 Programmes, Agreements, and Actions Developed by the Higher Education Institutions in the Bío Bío Region for Social Development
Professional Institutes
Centres Regular Programmes Collaboration agreements Actions • Network for Articulation and
Improvement of the Technical Professional Formation.
• Programme “Assistance in the Field”, to support the community.
• Free community workshops in winter and summer.
• Technical-professional high schools.
• Municipalities: early prevention of learning problems in vulnerable sectors.
• Ministry of Education (MINEDUC): Training of examiners and supervisors for the Educational Quality Assessment System (SIMCE).
• Community work.
• Blood donation campaign.
• Theatre for orphanages in the network of the National Service for Minors (SENAME).
• Prevention campaigns.
• Interscholastic Football Tournaments for secondary school students.
• Champions Cup for secondary school students.
• Collaboration with social re-insertion organisations through sports activities.
• Workshops, seminars, and reflective colloquia on matters of social integration and vulnerability.
Source: Own elaboration according to information obtained from the HEI Survey, sections 3, 4, and 5.

A-89
Table A.5.2 Summary of Self Evaluation: How Do You Perceive the Contribution of the Higher Education Institutions to Social Development in the Bío Bío Region?
By Type of Higher Education Institution
Very Important Important Somewhat Important Not Important CRUCH X
UP X X IP X
CFT X Source: Own elaboration based on secondary information analysis, memories, and Higher Education Institutions web pages. Note: CRUCH (Council of Rectors of the Chilean Universities), UP (Private Universities), IP (Professional Institutes), CFT (Technical Formation Centres).

A-90
Table A.5.3 Self Assessment by Regional CRUCH Universities of the Contribution of Higher Education Institutions to Social Development
Degree of Contribution to Social Development Total Missing
Values Very
Important Important Somewhat Important
Not Very Important
INST
ITU
TIO
N CRUCH
Count 0 3 0 0 0 3 % of Total 0.0% 27.3% 0.0% 0.0% 0.0% 27.3%
Private Universities Count 0 1 1 1 0 3
% of Total 0.0% 9.1% 9.1% 9.1% 0.0% 27.3%
Professional Institutes Count 0 2 1 0 0 3
% of Total 0.0% 18.2% 9.1% 0.0% 0.0% 27.3%
Technical Formation Centers Count 1 1 0 0 0 2
% of Total 9.1% 9.1% 0.0% 0.0% 0.0% 18.2%
Total Count 1 7 2 1 0 11
% of Total 9.1% 63.6% 18.2% 9.1% 0.0% 100.0% Source: Own elaboration according to information obtained from the HEI Survey, section 4. Note: CRUCH (Council of Rectors of the Chilean Universities).

A-91
Table A.5.4 Self Assessment of Private Regional Universities of the Contribution of Higher Education Institutions to Social Development
Degree of Contribution to Social Development Total Missing
Values Very Important Important Somewhat Important
Not Very Important
INST
ITU
TIO
N CRUCH
Count 0 0 1 2 0 3 % of Total 0.0% 0.0% 9.1% 18.2% 0.0% 27.3%
Private Universities Count 0 0 2 0 1 3
% of Total 0.0% 0.0% 18.2% 0.0% 9.1% 27.3%
Professional Institutes Count 0 0 2 1 0 3
% of Total 0.0% 0.0% 18.2% 9.1% 0.0% 27.3%
Technical Formation Centres Count 1 1 0 0 0 2
% of Total 9.1% 9.1% 0.0% 0.0% 0.0% 18.2%
Total Count 1 1 5 3 1 11
% of Total 9.1% 9.1% 45.5% 27.3% 9.1% 100.0% Source: Own elaboration according to information obtained from the HEI Survey, section 4. Note: CRUCH (Council of Rectors of the Chilean Universities).

A-92
Table A.5.5 Self Assessment of Regional Professional Institutes of the Contribution of Higher Education Institutions to Social Development
Degree of Contribution to Social Development Total Missing
Values Very Important Important Somewhat Important
Not Very Important
INST
ITU
TIO
N CRUCH
Count 0 1 1 1 0 3 % of Total 0.0% 9.1% 9.1% 9.1% 0.0% 27.3%
Private Universities Count 0 0 1 0 2 3
% of Total 0.0% 0.0% 9.1% 0.0% 18.2% 27.3%
Professional Institutes Count 0 2 0 1 0 3
% of Total 0.0% 18.2% 0.0% 9.1% 0.0% 27.3%
Technical Formation Centres Count 1 1 0 0 0 2
% of Total 9.1% 9.1% 0.0% 0.0% 0.0% 18.2%
Total Count 1 4 2 2 2 11
% of Total 9.1% 36.4% 18.2% 18.2% 18.2% 100.0% Source: Own elaboration according to information obtained from the HEI Survey, section 4.
Note: CRUCH (Council of Rectors of the Chilean Universities).

A-93
Table A.5.6 Self Assessment of the Regional Technical Formation Centers of the Contribution of Higher Education Institutions to Social Development
Degree of Contribution to Social Development Total Missing
Values Very Important Important Somewhat Important
Not Very Important
INST
ITU
TIO
N CRUCH
Count 0 2 0 1 0 3 % of Total 0.0% 18.2% 0.0% 9.1% 0.0% 27.3%
Private Universities Count 0 1 0 0 2 3
% of Total 0.0% 9.1% 0.0% 0.0% 18.2% 27.3%
Professional Institutes Count 0 1 1 0 1 3
% of Total 0.0% 9.1% 9.1% 0.0% 9.1% 27.3%
Technical Formation Centers Count 0 2 0 0 0 2
% of Total 0.0% 18.2% 0.0% 0.0% 0.0% 18.2%
Total Count 0 6 1 1 3 11
% of Total 0.0% 54.5% 9.1% 9.1% 27.3% 100.0% Source: Own elaboration according to information obtained from the HEI Survey, section 4. Note: CRUCH (Council of Rectors of the Chilean Universities).

A-94
Table A.5.7 Self Assessment of the Regional Higher Institutions of the Contribution of Higher Education Institutions to Social Development
Degree of Contribution to Social Development Total Missing
Values Very
Important Important Somewhat Important
Not Very Important
INST
ITU
TIO
N CRUCH
Count 0 3 0 0 0 3 % of Total 0.0% 27.3% 0.0% 0.0% 0.0% 27.3%
Private Universities Count 0 1 1 1 0 3
% of Total 0.0% 9.1% 9.1% 9.1% 0.0% 27.3%
Professional Institutes Count 0 2 1 0 0 3
% of Total 0.0% 18.2% 9.1% 0.0% 0.0% 27.3%
Technical Formation Centers Count 1 1 0 0 0 2
% of Total 9.1% 9.1% 0.0% 0.0% 0.0% 18.2%
Total Count 1 7 2 1 0 11
% of Total 9.1% 63.6% 18.2% 9.1% 0.0% 100.0% Source: Own elaboration according to information obtained from the HEI Survey, section 4. Note: CRUCH (Council of Rectors of the Chilean Universities).

A-95
Table A.5.8 Number of Research Projects Awarded by the FONDECYT Regular Programme in Socially Related Areas between 2000 and 2009, by University in the
Bío Bío Region
University Social Sciences
Arts and Architecture
Humanities / History
Education and Pedagogy
Universidad de Concepción 6 - 16 13 Universidad del Bío-Bío 1 5 4 2
Universidad. Católica de la Santísima.Concepción - - - 1
Source: Own elaboration with secondary information from CONICYT’s web page: http//:www.conicyt.cl.
Table A.5.9 Art and Culture Infrastructure in the Bío Bío Region
Type of Infrastructure Regional Regional Ranking (over 13)
Metropolitan Region Country
Cinema Seats 6,368 3º 42,815 81,887 Theaters 15 3º 59 154
Sites for Cultural Exhibitions 44 5ª 85 476 Public Libraries 44 2º 45 315
No. of Books in Public Libraries 212,090 3º 3,117,381 4,535,005 No. of Books in University Libraries 696,671 2º 4,002,004 6,592,458
No. of School Computers 5,711 2º 12,608 42,017 Culture Houses 13 4º 22 129
Museums 22 4º 64 278 Radios 167 2º 121 1,273
Newspapers and Periodicals 39 2º 75 236 Journals 78 3º 1,228 1,597
Book Shops 36 5º 223 538 Galleries 9 4º 69 129
Source: Own elaboration with information from “El Mapa del Campo Cultural en Chile, PNUD 2002”

A-96
Table A.5.10 Indicators of Participation in Artistic and Cultural Activities
Bío Bío Region (2005)
Type of Activity Regional (%)
Ranking in the Region (total of
13 positions)
Metropolitan Region (%) Country (%)
Exhibition attendance 29.0 3º 21.1 23.6 Museum attendance 4.6 2º 12.6 7.6 Theater attendance 17.8 9º 21.6 20.1 Dance attendance 22.1 1º 11.3 14.7
Concert and live recital attendance 35.5 6º 20.7 27.5
Movies attendance 39.7 3º 35.1 34.7 Library attendance 28.3 3º 10.3 23.8 Reading of books 45.2 5º 39.9 40.8
Reading of newspapers 72.4 5º 55.5 61.3 TV 98.0 10º 93.0 96.0
Internet use 42.1 6º 41.7 40.7 Source: Own elaboration based on information obtained from the survey on “Cultural Consumption and Free Time Use, 2005” from the National Council of Arts and Culture (CNCA).
Table A.5.11 Perception of the Contribution on the CRUCH to the Development of Arts and Culture
Bío Bío Region
Very Important Important Somewhat Important Not Important CRUCH X
UP X X IP X
CFT X Source: Own elaboration based on Results of Survey to HEI, section 4.
Note: CRUCH (Council of Rectors of the Chilean Universities), UP (Private Universities), IP (Professional Institutes), CFT (Technical Formation Centers).

A-97
Table A.5.12 Type of Cultural Activities in the Higher Education Institutions of the Bío Bío Region
by Type of Activity and According to Type of Higher Education Institution
Public Relations
Arts and Culture Infrastructure
Means of Communication
Undergraduate Programmes
Postgraduate Programmes
FONDART Projects
CRUCH 17 16 11 7 6 7 UP 5 4 2 6 3 - IP 4 4 2 22 - -
CFT - - - 13 - - Source: Own elaboration based on analysis of secondary information, memories, and Higher Education Institutions web pages Note: CRUCH (Council of Rectors of the Chilean Universities), UP (Private Universities), IP (Professional Institutes), CFT (Technical Formation Centers).

A-98
Table A.5.13 Programmes and Activities of HEIs related to Arts and Culture in the Bío Bío Region (2009)
Institution Orientation Type
Universidad de
Concepción
Culture and Public Relations
Corcudec Symphonic Orchestra Symphonic Choir UdeC Academic OutreachTheatre
Mass Media
Panorama Radio UdeC TVU (television) Diario La Discusión (newspaper) El Diario de Concepción (newspaper)
Undergraduate Programmes
Architecture Visual arts Pedagogy in Plastic Arts Pedagogy in Musical Education
Postgraduate Programmes
Master’s in Applied Linguistics Master’s in Hispanic Literature Doctorate in Linguistics Doctorate in Latin American Literature
Universidad del Bío-Bío
Culture and Public Relations
Folklore Music Conservatory Theatre
Mass Media Short-wave Radio Ediciones Ubiobio (Publishing house)
Undergraduate Programmes
Architecture Industrial Design Graphic Design
Postgraduate Programmes
Doctorate in Architecture and Urbanism
Universidad Católica de
la Santísima
Concepción
Culture and Public Relations
Academic Outreach Artistic Outreach Aula Magna of the Archbishopric Museum of Religious Art Dissemination Department Theatre Group Troupes Chamber Orchestra Chamber Choir Modern Dance
Mass Media Publications
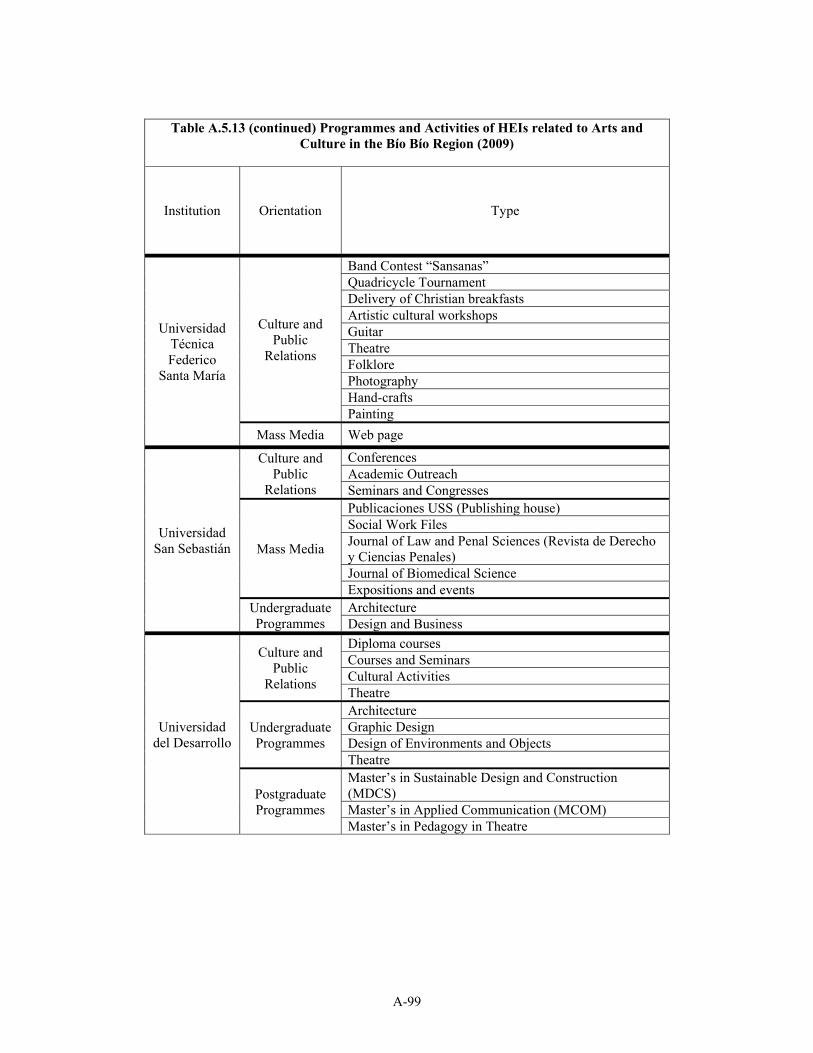
A-99
Table A.5.13 (continued) Programmes and Activities of HEIs related to Arts and Culture in the Bío Bío Region (2009)
Institution Orientation Type
Universidad Técnica Federico
Santa María
Culture and Public
Relations
Band Contest “Sansanas” Quadricycle Tournament Delivery of Christian breakfasts Artistic cultural workshopsGuitar Theatre Folklore Photography Hand-crafts Painting
Mass Media Web page
Universidad San Sebastián
Culture and Public
Relations
Conferences Academic OutreachSeminars and Congresses
Mass Media
Publicaciones USS (Publishing house)Social Work Files Journal of Law and Penal Sciences (Revista de Derecho y Ciencias Penales) Journal of Biomedical Science Expositions and events
Undergraduate Programmes
Architecture Design and Business
Universidad del Desarrollo
Culture and Public
Relations
Diploma courses Courses and Seminars Cultural Activities Theatre
Undergraduate Programmes
Architecture Graphic Design Design of Environments and Objects Theatre
Postgraduate Programmes
Master’s in Sustainable Design and Construction (MDCS) Master’s in Applied Communication (MCOM) Master’s in Pedagogy in Theatre

A-100
Table A.5.13 (continued) Programmes and Activities of HEIs related to Arts and Culture in the Bío Bío Region (2009)
Institution Orientation Type
I.P. DUOC
Culture and Public Relations
International Relationships Olympic Games Duoc UC Cultural Activities Pastoral ActivitiesCongresses and Seminars Continuing Education
Undergraduate Programmes
Audiovisual Communication Publicity Public Relations, Mention in Marketing Design of Environments Graphic Design Industrial Design Tourism Administration Gastronomy Adventure Tourism Architectonic and Structural Drawing
C.F.T. e I.P.
INACAP
Culture and Public Relations
Training Business Idea Competition Technological Project Competition Short Story Contest Contemporary Music Festival Interscholastic Sports Circus Arts Sports Activities Folklore Choir
Mass Media
Newsletter Website Publications Journal of Sound and Acoustics (Revista Sonido y Acústica) Editorial Design Drawing for Architecture and Engineering Projects Telecommunications Tourism Graphic Design
Source: Own elaboration, from review of secondary sources, websites, theses, etc.

A-101
Table A.5.14 Undergraduate and Postgraduate Programmes Oriented to Social, Cultural, and Environmental Areas Offered by the Regional Universities in the Bío Bío Region
Institution
Educ
atio
n Le
vel
Major
Hea
dqua
rter
Universidad de Concepción
Under Basic Education
Chi
llán
Under Special Education Under Pre-school Education Under Pedagogy in English Under Pedagogy in Physical Education – Girls Under Pedagogy in Physical Education – Boys Under Pedagogy in Musical Education Under Pedagogy in Spanish Under Pedagogy in Philosophy Under Pedagogy in History and Geography Under Pedagogy in Mathematics and Computers Under Pedagogy in Natural and Biological Sciences Under Pedagogy in Natural and Physical Sciences Under Pedagogy in Natural and Chemical Sciences Under Basic Education
Los Á
ngel
es
Under Special Education Under Pre-school Education Under Pedagogy in Natural and Biological Sciences Under Pedagogy in Mathematics and Technological Education

A-102
Table A.5.14 (continued) Undergraduate and Postgraduate Programmes Oriented to Social, Cultural, and Environmental Areas Offered by the Regional Universities in the Bío Bío Region
Institution
Educ
atio
n Le
vel
Major
Hea
dqua
rter
Universidad de Concepción
Post Social Sciences
Con
cepc
ión
Post Master’s in Social Research and Development
Post Master in Psychology, with mentions in Educational Psychology and Psychology of Health
Post Master’s in Social Work and Political Sciences Post Education Post Master’s in Education Post Master’s in Physical Education Post Master’s in Management, Leadership, and Educational Policy Post Humanities Post Master’s in Moral Philosophy Post Master’s in History Post Master’s in Applied linguistics Post Master’s in Hispanic Literature Post Environmental Sciences
Post Doctorate in Environmental Sciences, mention Continental Aquatic Systems
Post Health SciencesPost Doctorate in Nursing Post Doctorate in Mental Health Post Physical and Mathematical Sciences Post Doctorate in Applied Sciences, mention in Mathematical Engineering Post Doctorate in Physical SciencesPost Doctorate in MathematicsPost Natural and Oceanographic Sciences Post Doctorate in Biological Sciences, area Botany Post Doctorate in Oceanography Post Doctorate in Systematic and Biodiversity Post Chemical Sciences Post Doctorate in Geological Sciences Post Doctorate in Sciences, mention in Chemistry Post Humanities Post Doctorate in Linguistics Post Doctorate in Latin American Literature

A-103
Table A.5.14 (continued) Undergraduate and Postgraduate Programmes Oriented to Social, Cultural, and Environmental Areas Offered by the Regional Universities in the Bío Bío Region
Institution
Educ
atio
n Le
vel
Major
Hea
dqua
rters
Universidad del Bío-Bío
Under Pedagogy in Physical Education
Chi
llán
Under Pedagogy in Spanish and Communication Under Pedagogy in Natural Sciences, mention in Biology Under Pedagogy in Natural Sciences, mention in Physics Under Pedagogy in Natural Sciences, mention in ChemistryUnder Pedagogy in EnglishUnder Pedagogy in History and Geography Under Pedagogy in Pre-school Education Under Pedagogy in General Basic Education Under Pedagogy in Education Post Didactic Master’s in the Maternal Tongue
Con
cepc
ión
Post Didactic Master’s Projection
Post Master’s in Education, mention in Curricular Management or Education Orientation
Post Master’s in Science Teaching, mention in Mathematics, Physics, Biology, or Chemistry
Post Master’s in Teaching the Social Sciences Post Master’s in Human Resource Management and Directive Skills Post Master’s in Sustainable Habitat and Energy Efficiency Post Master’s in Mathematics, mentions in Applied Mathematics or Statistics Post Master’s in Pedagogy for Higher Education Post Master’s in Public Health
Universidad Católica de la
Santísima Concepción
Under School of Education
Con
cepc
ión
Under Pre-school Education Under Pedagogy in Special Education Under Pedagogy in General Basic Education Under Pedagogy in Secondary Education in Biology and Natural Sciences Under Pedagogy in Secondary Education in English Under Pedagogy in Secondary Education in Language and Communication Under Pedagogy in Secondary Education in Religion and Moral Education Post Master’s in the Sciences of Education Post Master’s in Higher EducationPost Master’s in Educational Informatics and Management of Knowledge Post Master’s in Sciences of the Family
Post Graduate Degree in Teaching of English as a Foreign Language for Basic and Pre-school Education
Post Graduate Degree, mention in Mathematics for Teachers of the Second Basic Educational Cycle
Post Graduate Degree in Religion and Moral

A-104
Table A.5.14 (continued) Undergraduate and Postgraduate Programmes Oriented to Social, Cultural, and Environmental Areas Offered by the Regional Universities in the Bío Bío Region
Institution
Educ
atio
n Le
vel
Major
Hea
dqua
rter
Universidad del Desarrollo
Under General Studies (Bachillerato)
Con
cepc
ión
Under Basic Pedagogy Post Master’s in Curricular Innovation and Educational Evaluation Post Master’s in Quality Scholarly Direction and Management Post Master’s in Pedagogy in Theater Post Mater’s in Psycho-pedagogy Post Diploma and Master’s in Humanities Post Graduate Degree in Psycho-pedagogy
Universidad San Sebastián
Under Pedagogy in Basic Education
Con
cepc
ión
Under Pedagogy in Special Education Under Pedagogy in Physical Education Under Pre-school Education Under Pedagogy in History and Social Sciences Under Pedagogy in English Under Pedagogy in Language, Communication, and Philosophy Under Pedagogy in Mathematics and Computers Post Specialized Graduate Degree in Learning Disorders Post Diploma Course in Educational Curriculum Post Diploma Course in Evaluation for Learning
Post Master’s in Educational Sciences, mention in Technological Resources for Learning
Post Graduate Degree in Physical Activity and the Promotion of Health Post Graduate Degree in Infant Motor skills Post Diploma Course in Intervention with Socially Vulnerable Families Post Diploma Course in Family Health Post Social Work
Source: Own elaboration based on secondary information, web pages, memories and others.
Note: Under (Undergraduate), Post (Postgraduate).

A-105
Table A.5.15 Regular FONDECYT Projects Awarded in the Environmental Area to Universities in the Bío Bío region
Period 2000-2009
HEI
Ecol
ogic
al a
nd
Envi
ronm
enta
l Sc
ienc
es
Earth
and
Soi
l Sc
ienc
es
Che
mis
try o
f the
En
viro
nmen
t
Oce
anog
raph
y
Bot
any
Urb
anis
m
Universidad de Concepción 12 7 6 16 5 1 Universidad del Bío-Bío - - - - - 1
Universidad Católica de la Santísima.Concepción 2 - - - 1 -
Source: Own elaboration based on secondary information from CONICYT’s web page, 2009.
Table A.5.16 Human Capital Formation in Areas Linked to Environmental Sustainability
HEI Undergraduate Postgraduate Continuing Formation
Regular FONDECYT 2000-2010
CRUCH 8 17 - 51 UP 1 1 - - IP - - - - CFT - - - - Source: Own elaboration based on analysis of secondary information, memories, and Higher Education Institutions web pages and CINICYT, 2009. Note: CRUCH (Council of Rectors of the Chilean Universities), UP (Private Universities), IP (Professional Institutes), CFT (Technical Formation Centers).

A-106
ANNEX 6
Table A.6.1 Level of Importance for Defining Regional Priorities and Needs
% of Total Answers
Instance Level of Importance Very Important Important Somewhat
Important Not Very Important
Priorities defined at the national level 67 25 8 -
Regional Development Strategy 100 - - -
Regional Agenda for Innovation and Productive Development
83 17 - -
Public-private task forces 67 33 - - Source: Own elaboration using Higher Education Institutions survey, 2009. Note: The Higher Education Institutions also mentioned research in CRUCH (Council of Rectors of the Chilean Universities) universities, regional working meetings, and round tables.

A-107
Table A.6.2 Participation of HEIs in Entities that Promote Regional Development in the Bío Bío Region
% of Institutions that Participate Actively or Passively
Entity Active Participation Passive Participation CRUCH UP CFT-IP CRUCH UP CFT-IP
Elaboration of the Regional Development Strategy 33 100 100 67 - -
Elaboration of the Regional Agenda for Innovation and Productive Development
67 100 100 33 - -
CORECYT 100 - - - 100 - Public-private Task Forces: - - - - - - Health 10 - - - - - CORFO Committees - - 13 - - - Education - 17 13 - - - INNOVA 10 17 - - - - Science and Education - - 13 - - - Design 10 - 13 - - - Technology 10 17 - - - - PMC Bio Bio Educando e Innovando 10 - - - - -
Apiculture 10 - - - - - CIDERE - 17 - - - - Corporate Social Responsibility - 17 - - - -
Tourism - - 25 - - - CORBIOBIO - - - - 100 - Quality of Education - 17 - - - - Polymers 10 - - - - - Higher Education 10 - - - - - Energy 10 - - - - - Bio-technology 10 - - - - - Business and Commerce ChileCalifica - - 13 - - -
IRADE - - 13 - - - Source: Own elaboration using Higher Education Institutions survey, 2009. Note: CRUCH (Council of Rectors of the Chilean Universities), UP (Private Universities), CFT (Technical Formation Centers), IP (Professional Institutes)

A-108
Table A.6.3 Activities Conducted at Each HEI that Contribute to Regional Development
Initiative
Area
Description
Teac
hing
Res
earc
h
Com
mun
ity R
elat
ions
Adm
inis
tratio
n H
uman
Res
ourc
es
Fina
ncia
l
UNIVERSIDAD CATÓLICA DE LA SANTÍSIMA CONCEPCIÓN
Institutional Strategic Planning 2007-2011 X X X X X X
Institutional Strategic Planning establishes the goal of promoting links with regional development, employees, the regional community, and the local population in the cities where the institution has headquarters (currently Cañete, Chillán Los Ángeles, Talcahuano). Among other things, this goal includes quantitative targets for participation in research related to regional development, in institutions and regional entities, joint agreements with private firms and public institutions, and the design of teaching plans.
Creation of Reference Centers X X X X X X
Development instruments that prioritize the improvement of multidisciplinary research and promote links with private firms and the regional environment.
Degrees offered by the Institute of
Technology X X X
The Institute of Technology is a teaching unit offering technical degrees in the four provinces of the Bío Bío Region, with offices in Talcahuano, Chillán, Los Ángeles, and Cañete. Many technical degrees are designed considering the needs and characteristics of the local community, including Técnico Universitario Agropecuario (University Technician in Agriculture), Técnico Universitario en Mecatrónica (University Technician in Mechatronics), Técnico Universitario en Alimentos (University Technician in Foods), etc. These degrees were designed based on student and local private sector opinions.

A-109
Table A.6.3 (continued)
Activities Conducted at Each Higher Education Institution that Contribute to Regional Development
Initiative
Area
Description
Teac
hing
Res
earc
h
Com
mun
ity R
elat
ions
Adm
inis
tratio
n H
uman
Res
ourc
es
Fina
ncia
l
UNIVERSIDAD CATÓLICA DE LA SANTÍSIMA CONCEPCIÓN
CREA, Regional Center on
Environmental Studies
X X X X X
Environmental Center oriented towards environmental impact assessments, environmental audits, eco-toxicity analyses, coastal management, environmental conflicts, etc.
New majors in Marine Biology and
Environmental Chemistry
X
Oriented towards the analysis of sciences related to oceans and the environment; graduates of these programmes work mainly in southern Chile, in the Bío Bío Region, and in national and foreign universities.
New majors in Civil Engineering, mention
in Logistics X
This programme is oriented towards international business, given the importance of the region in this area and the importance of its public infrastructure.
CITTA, Innovation and Agricultural Transfer Center
X X X X X X
This center is located in Cañete, with the goal of promoting productive chains from small local and family businesses through training and education, innovation techniques, and entrepreneurship skills.
UNIVERSIDAD DEL BÍO-BÍO
Regional Policies for creation of new
Careers X
Definition of rules for new study programmes requiring them to be in concordance with the UBB´s Strategic Planning and with regional needs and priorities.
Workplace professional training X
All careers require professional internship in different periods of student training. This has promoted links with public and private firms and allowing students to be in contact with regional needs and priorities.
Promotion of areas X Promotion of priority areas and participation of researchers in meetings and work groups.

A-110
Pre-feasibility studies for Technical
Professional High schools.
X X
Permanently conducting pre-feasibility studies for the implementation of technical professional high schools in the Bio Bio Region.
Research areas of regional relevance X X Financial resources prioritizing areas with
high regional impact.
Annual competition in relevant extension
programmes
X
These programmes include several activities (meetings, conferences, talks, documentaries, seminars, etc.) about central subjects concerning problems detected in the local community, in multidisciplinary working groups, with the goal of conducting concrete actions involving the local community to solve or minimize the detected problems, using student knowledge and teachers expertise.
Art public relations programmes X
The university conducts many art related activities open to the regional community. This includes cinema, visual arts, music season, theater, art expositions, music programmes, literary programmes, coral seasons, dance and singing seasons, among others.
Promotion of participation in
projects with public funding with
regional relevance
X
There is an internal competition of research projects and promotion of external funding of projects with an impact in regional needs and priorities, particularly focused in applied research and technology transfer.
Technology transfer programmes X X X
Different programmes of technology transfer trough which the UBB transfer to public and private sector their results of research and knowledge creation. This work is directed to support technologically firms and public sector institutions, to help finding solutions to regional problems and to contribute to regional and country economic development.
UNIVERSIDAD DE CONCEPCIÓN
Creation of Research Centers for the
Region X X X X X X
Support for the creation of regional research centers that promote productive development in regional priority areas.
Projects with high regional impact X X X X X
Collaborative work with private and public sectors to promote projects with high regional impact.
Science promotion programmes in
secondary schools X Encourages research and science in
secondary schools.

A-111
Promote thesis and workplace
preparation training requirements
X X Programmes to develop jointly with private and public institutions.
Training and Education X Training courses, seminars, and talks related
to regional priority areas.
UNIVERSIDAD DEL DESARROLLO
Clinics and internships in public health programmes.
X Activities that contribute to public health centres.
Seminars and talks X X Covering priority areas for regional development.
Training programmes for the local community
X Covering priority areas for regional development.
Research on regional subjects X

A-112
Table A.6.3 (continued)
Activities Conducted at Each Higher Education Institution that Contribute to Regional Development
Initiative
Area
Description
Teac
hing
Res
earc
h
Com
mun
ity R
elat
ions
Adm
inis
tratio
n H
uman
Res
ourc
es
Fina
ncia
l
INACAP Concepción
Adaptation of academic
programmes and services offered
X High quality academic management systems.
Educational services and prices adapted to
expected wages X X Pricing policies and flexibility adapted to
special cases.
Adapted equipment and infrastructure X X X Annual investment programme in academic
equipment.
Academic training in teaching and
technical skills X X X X X
Programme to support teaching, incentives, internal competitions, courses, diplomas, and teacher-training policies.
National and international cooperation
X X X X X X Different cooperative agreements for teachers, students, and other employees.
INACAP Chillán
Emergency plans for local public schools X
Field work and local help X X

A-113
Table A.6.3 (continued) Activities Conducted at Each Higher Education Institution that
Contribute to Regional Development
Initiative
Area
Description
Teac
hing
Res
earc
h
Com
mun
ity R
elat
ions
Adm
inis
tratio
n H
uman
Res
ourc
es
Fina
ncia
l
DUOC UC
Consulting committees with
private firms X X X Educational programmes and graduate
profiles based on labour competences.
Working groups: Design, Tourism,
Science and Education
X X X X Promotion of regional competitiveness and service quality.
CFT LOTA ARAUCO
Programmes offered X Increasing offer of technical programmes. Community-related
activities X Diverse community-related activities offered in local cities.
Training and technical assistance X Covering the formulation and evaluation of
projects. Creation of Info-
centres X In Lota and Cañete, to support medium and small-sized firms.
CEDUC UCN LEBU
Regional diagnosis and new projects X Pertinence of academic supply.
Source: Own elaboration using Higher Education Institutions survey, 2009.

114
Table A.6.4 Views of Strategic Interaction among Higher Education Institutions
% of Answers in Each Category
Area
CFT-IP CRUCH UP
Strategic Competitor
Strategic Ally
Not Related
Strategic Competitor
Strategic Ally
Not Related
Strategic Competitor
Strategic Ally
Not Related
ANSWERS OF CRUCH UNIVERSITIES
Teaching - - 100 50 75 - 50 - 50 Research - - 100 25 100 - - 25 75
Community Relations - - 100 25 75 25 25 - 75 Student Recruitment 25 25 50 75 25 - 50 - 50
Obtaining External Funds - - 100 75 50 - 25 - 75 Promotion of Regional Image - 50 50 - 75 25 - 50 50
ANSWERS OF UP UNIVERSITIES
Teaching 25 - 75 50 - 50 75 - 25 Research - - 100 - 50 50 - 50 50
Community Relations - - 100 50 50 25 50 25 50 Student Recruitment 25 - 75 50 - 50 75 - 25
Obtaining External Funds - - 100 25 25 50 25 - 75 Promotion of Regional Image - - 100 - 25 75 - 50 50

115
Table A.6.4 (continued) Views of Strategic Interaction among HEIs
% of Answers in Each Category
Area
CFT-IP CRUCH UP
Strategic Competitor
Strategic Ally
Not Related
Strategic Competitor
Strategic Ally
Not Related
Strategic Competitor
Strategic Ally
Not Related
ANSWERS OF CFT-IP
Teaching 50 25 25 - 25 75 - - 100 Research - 33 67 - 33 67 - - 100
Community Relations 25 25 50 25 25 50 33 - 67 Student Recruitment 75 - 25 50 - 50 67 - 33
Obtaining External Funds 25 25 50 25 25 50 33 - 67 Promotion of Regional Image - 75 25 - 75 25 - 67 33
Source: Own elaboration using Higher Education Institutions survey, 2009. Note: CRUCH (Council of Rectors of the Chilean Universities), UP (Private Universities), IP (Professional Institutes), CFT (Technical Formation Centers).
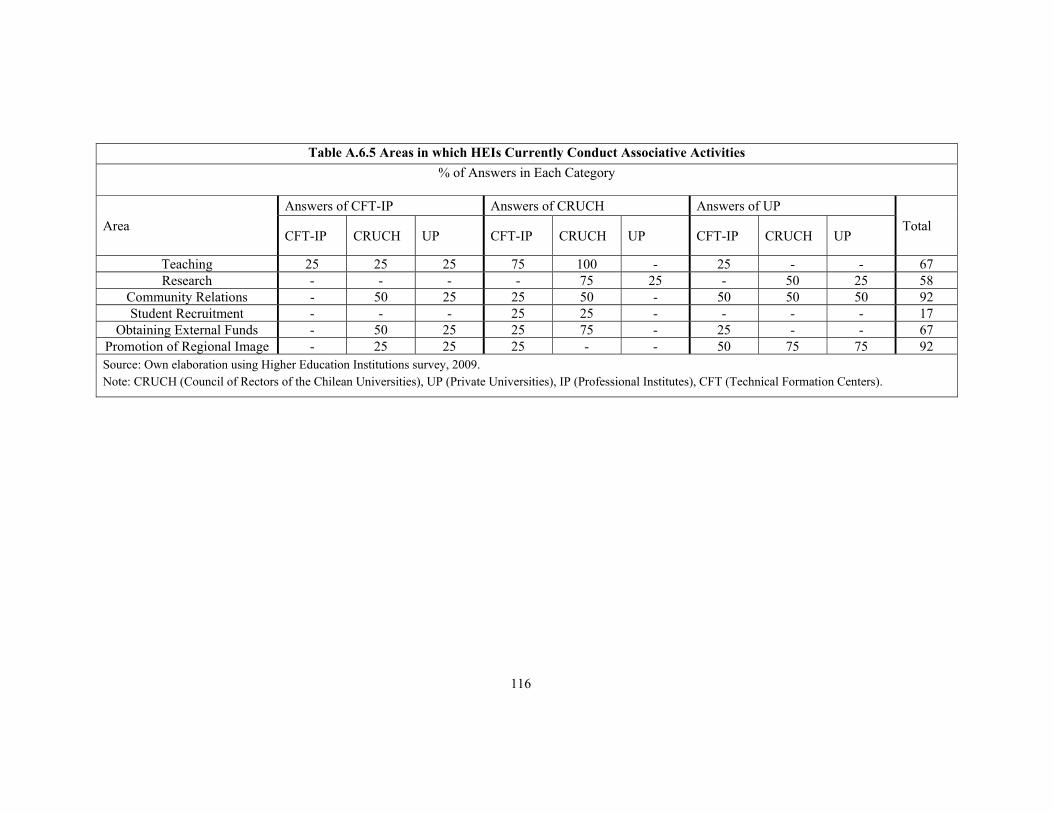
116
Table A.6.5 Areas in which HEIs Currently Conduct Associative Activities % of Answers in Each Category
Area Answers of CFT-IP Answers of CRUCH Answers of UP
Total CFT-IP CRUCH UP CFT-IP CRUCH UP CFT-IP CRUCH UP
Teaching 25 25 25 75 100 - 25 - - 67 Research - - - - 75 25 - 50 25 58
Community Relations - 50 25 25 50 - 50 50 50 92 Student Recruitment - - - 25 25 - - - - 17
Obtaining External Funds - 50 25 25 75 - 25 - - 67 Promotion of Regional Image - 25 25 25 - - 50 75 75 92Source: Own elaboration using Higher Education Institutions survey, 2009. Note: CRUCH (Council of Rectors of the Chilean Universities), UP (Private Universities), IP (Professional Institutes), CFT (Technical Formation Centers).