Embed Size (px)
Citation preview

THE BIOWALL FIELD TEST ANALYSIS AND OPTIMIZATION
by
Jacob J Torres Jr.
A Thesis
Submitted to the Faculty of Purdue University
In Partial Fulfillment of the Requirements for the degree of
Master of Science in Engineering Technology
Department of Engineering Technology
West Lafayette, Indiana
May 2019

ii
THE PURDUE UNIVERSITY GRADUATE SCHOOL
STATEMENT OF COMMITTEE APPROVAL
Professor William Hutzel
Purdue Polytechnic Institute
Dr. Jose Garcia Bravo
Purdue Polytechnic Institute
Distinguished Professor Anthony Hyde
New Mexico State University College of Engineering
Approved by:
Dr. Duane Dunlap
Head of the Graduate Program

iii
For the many who I carry on for. Your spirits live within and through me

iv
ACKNOWLEDGMENTS
Many people have made contributions to the research presented in this paper. To all who have at
one point or another gone out of their way to help, from the deepest part of my heart, thank you!
To my mom, sisters, lil' brother, family, mentors, professors, and friends (you all know who you
are), this is only the beginning.
I want to specifically acknowledge my research chair Professor William Hutzel who has allowed
this opportunity. My committee members Dr. Jose Garcia Bravo (Purdue SOET), and
Distinguished Professor Anthony Hyde (NMSU), all whose participation encouraged the results
and work completed.
To Bhargav Rajkhowa, Hannes Leuner, Osama Alraddadi, who I only know through their work;
Emily Rada, James Rieser, and all students who have worked on the Biowall before and during
my time. And the NASA VEGGIE and AECOM/LASSO teams at NASA Kennedy Space Center
who have given the most genuine direction and support throughout the process.
I acknowledge that failure is an opportunity. Difficulty experienced along the way is the lesson.
Humility is the true path to change.

v
TABLE OF CONTENTS
LIST OF FIGURES ..................................................................................................................... viii
LIST OF TABLES .......................................................................................................................... x
LIST OF ABBREVIATIONS ........................................................................................................ xi
ABSTRACT .................................................................................................................................. xii
CHAPTER 1. INTRODUCTION ................................................................................................ 1
1.2 Problem Statement .............................................................................................................. 1
1.3 Research Question .............................................................................................................. 1
1.4 Scope ................................................................................................................................... 1
1.5 Significance......................................................................................................................... 2
1.6 Definitions........................................................................................................................... 3
1.7 Assumptions ........................................................................................................................ 4
1.8 Limitations .......................................................................................................................... 4
1.9 Delimitations ....................................................................................................................... 4
1.10 Hypothesis ........................................................................................................................ 4
1.11 Summary ........................................................................................................................... 4
REVIEW OF LITERATURE .............................................................................. 6
2.2 Six Sigma and New Product Development ......................................................................... 6
2.3 HVAC Development and Regulation ................................................................................. 7
2.4 Reduce HVAC Energy Consumption ................................................................................. 8
2.5 Residential HVAC Air Filtration Technologies ................................................................. 8
2.6 Indoor Air Quality (IAQ) .................................................................................................. 11
2.7 Sick Building Syndrome (SBS) ........................................................................................ 12
2.8 Botanical Air Filtration ..................................................................................................... 12
2.8.1 The Biowall ............................................................................................................... 13
2.8.2 The ReNEWW Home ................................................................................................ 13
2.8.3 The Biowall Prototype ............................................................................................... 14
2.8.4 Air Flow Through the Biowall .................................................................................. 15
2.8.5 Plant Irrigation ........................................................................................................... 15
2.8.6 Biowall Lighting ........................................................................................................ 17

vi
2.8.7 Biowall Plant Trays and Fertilization ........................................................................ 19
2.9 Air Filtering Plants ............................................................................................................ 20
2.10 Plant Experimentation in Controlled Environments ....................................................... 20
2.11 ASHRAE Handbook Fundamentals: Measuring Air Flow Through a Duct .................. 21
2.11.1 Hot Wire Anemometer and Air Velocity Measurement ......................................... 22
2.12 Summary ......................................................................................................................... 23
RESEARCH METHODOLOGY ...................................................................... 24
3.1 Experimental Design ......................................................................................................... 24
3.2 Initial Assessment and Methodology ................................................................................ 25
3.3 Air Flow Analysis ............................................................................................................. 26
3.3.1 Initial Air Flow Assessment ...................................................................................... 26
3.3.2 Plant Tray Air Seals (Initial) ...................................................................................... 26
3.3.3 Initial Air Flow Analysis Experimental Markers ...................................................... 29
3.3.4 Air Flow Profile ......................................................................................................... 31
3.3.5 Air Flow Treatment Methodology ............................................................................. 33
3.4 Plant Growth Experiment ................................................................................................. 35
3.4.1 Initial Plant Tray Analysis ......................................................................................... 35
3.4.2 Plant Growth Experiment Guidelines ........................................................................ 38
3.4.3 Plant Experiment Methodology ................................................................................. 38
3.4.4 Biowall Environmental Measurements ...................................................................... 39
3.4.5 Plant Selection ........................................................................................................... 39
3.4.6 Growth Medium Mixing ............................................................................................ 39
3.4.7 Plant Tray Orientation ............................................................................................... 40
3.4.8 Plant Experiment Implementation ............................................................................. 41
3.5 Biowall Irrigation Optimization ........................................................................................ 41
3.5.1 Initial Irrigation Assessment ...................................................................................... 42
3.5.2 Irrigation Optimization Goals .................................................................................... 43
3.5.3 Irrigation Optimization Methodology ........................................................................ 44
3.5.4 Irrigation Optimization Implementation .................................................................... 46
RESULTS .......................................................................................................... 47
4.1 Air Flow Analysis Results ................................................................................................ 47

vii
4.1.1 Air Velocity Profile ................................................................................................... 47
4.1.2 Air Velocity Quantification ....................................................................................... 49
4.1.3 Differential Pressure (dP) Trend Data ....................................................................... 50
4.2 Biowall Plant Growth Experiment .................................................................................... 51
4.2.1 The Biowall Before and After ................................................................................... 52
4.2.2 Biowall Environmental Parameter Results ................................................................ 53
4.2.3 Plant Dimension Measurement Reconciliation ......................................................... 53
4.3 Irrigation Optimization Results......................................................................................... 54
SUMMARY, CONCLUSIONS, AND RECOMMENDATIONS .................... 56
5.1 Air Flow Analysis Conclusions ........................................................................................ 56
5.2 Biowall Plant Growth Experiment Conclusions ............................................................... 57
5.3 Irrigation Optimization Conclusions................................................................................. 57
5.4 Conclusion ........................................................................................................................ 58
REFERENCES ............................................................................................................................. 60
APPENDIX A. THE MERV CHART .......................................................................................... 62
APPENDIX B. AIR FLOW PATH THROUGH THE BIOWALL .............................................. 63
APPENDIX C. DELTA PRESSURE (DP) TREND DATA AND AIR FLOW .......................... 65
APPENDIX D. NCERA-101 MINIMUM GUIDLINES FOR MEASURING AND REPORTING
ENVIRONMENTAL PARAMETERS FOR EXPERIMENTS ON PLANTS IN GROWTH
ROOMS AND CHAMBERS ........................................................................................................ 67
APPENDIX E. PLANT EXPERIMENT ENVIRONMENTAL CONDITIONS ......................... 68
APPENDIX F. PLANT DIMENSIONS ....................................................................................... 69
APPENDIX G. INDIVIDUAL EXPERIMENT VARIABLES ................................................... 70
APPENDIX H. BIOWALL LED WIRING UPGRADE .............................................................. 72
APPENDIX I. PLANTS AND EXCESSIVE AIR FLOW ........................................................... 73
APPENDIX J. STATEMENT OF WORK ................................................................................... 74
APPENDIX K. RAW DATA ....................................................................................................... 75
PUBLICATIONS .......................................................................................................................... 84

viii
LIST OF FIGURES
Figure 2.1 New air filter.................................................................................................................. 9
Figure 2.2 Dirty air filter to be replaced. ...................................................................................... 10
Figure 2.3 The ReNEWW home in West Lafayette, Indiana. ...................................................... 14
Figure 2.4 Block diagram breaking down the Biowall design and operation (Rajkhowa, 2016). 15
Figure 2.5 Biowall irrigation plumbing schematic (rear view). .................................................... 16
Figure 2.6 Biowall plant tray and soaker hose orientation; (3/8”) at the bottom of each plant tray.
.................................................................................................................................. 17
Figure 2.7 A single Biowall plant tray shelf with broad-spectrum plant growth LEDs. .............. 18
Figure 2.8 ASHRAE Handbook-Fundamentals air flow through duct measurement point locations
in rectangular and circular ducts. ............................................................................. 22
Figure 2.9 Hot wire anemometer TSI VELOCICALC Plus 8386. ............................................... 23
Figure 3.1 Initial air seal assessment revealed Growstone rocks between the plant trays and Biowall
housing. .................................................................................................................... 27
Figure 3.2 The Biowall housing with plant trays removed. Tray 1 (Bottom). Tray 4 (Top). ....... 28
Figure 3.3 Tray 4 at an initial condition shows varying growth medium depths. (1) minimum, (2)
maximum growth medium depth. ............................................................................ 29
Figure 3.4 Biowall shelf 4 with tray removed: 1). Growstone obstructing air seal. 2). Signs of
Growstone wedged against the housing. 3). Damaged/torn air seals. ..................... 30
Figure 3.5 Hot Wire Anemometer (TSI VELOCICALC Plus 8386) used to record air velocity
readings through the Biowall. .................................................................................. 31
Figure 3.6 Initial air measurement positions per tray indicated with an X. Red). Measurement
within the tray. Blue). Measurement outside the tray. ............................................. 33
Figure 3.7 Biowall plant shelf with tray removed following Treatment 1. The arrows point to
tearing in tray air seals. ............................................................................................ 34
Figure 3.8 Tray 2 following Treatment 2 showing replacement of torn air seal insulation. ........ 34
Figure 3.9 Tray 4 during the initial assessment shows that the growth medium within the plant tray
has inconsistent depths. ............................................................................................ 36

ix
Figure 3.10 The Biowall tray 3 during the initial assessment shows the spider plant (Chlorophytm
comosum) as the dominant plant. ............................................................................ 37
Figure 3.11 A test plant tray with two dead 5-year-old ficus trees. .............................................. 37
Figure 3.12 A new plant tray acclimating in the plant nursery. .................................................... 40
Figure 3.13 Tray 3 with growth medium removed after initial assessment reveals the irrigation
soaker hose condition. .............................................................................................. 42
Figure 3.14 Initial plant tray 3; fertilizer pellets not dissolved. .................................................... 43
Figure 3.15 Drawing of optimized Biowall plant tray irrigation hose configuration (top and side
view). ....................................................................................................................... 45
Figure 4.1 Pie chart signifying the percent of all air velocity measurements through vs. outside the
trays (initial). ............................................................................................................ 49
Figure 4.2 Pie chart signifying the percent of air velocity measurements through vs. outside the
plant trays (After). .................................................................................................... 50
Figure 4.3 Differential Pressure trend data representing before (1) and after (2) airflow treatments,
as well as an open bypass door (3). .......................................................................... 51
Figure 4.4 The Biowall before (left) and after (right) implementing new plant trays. ................. 52
Figure 4.5 Biowall plant tray with optimized irrigation hose configuration. ............................... 55
Figure B.1 Biowall schematic (side view). ................................................................................... 63
Figure C.1 Biowall differential pressure trend data seen through the BAS interface WebCTRL. 65
Figure I.1 A plant tray following 14 days of continuous air through the roots shows plants deprived
of moisture. .............................................................................................................. 73
Figure J.1 Statement of work flowchart. ....................................................................................... 74
Figure K.1 Initial Air Velocity and Environment Measurements………………………………..75
Figure K.2 Middle Air Velocity and Environment Measurements……………………………….76
Figure K.3 Final Air Velocity and Environment Measurements………………………………….77

x
LIST OF TABLES
Table 2.1 Air cleaning technologies and limitations (EPA, 2008). .............................................. 10
Table 3.1 List of plants selected for the Biowall plant growth experiment. ................................. 39
Table 4.1 Biowall air velocity profile before, post-treatment 1 (Middle), and post-treatment 2
(after). .......................................................................................................................... 48
Table 4.2 Biowall irrigation specifications before and after. ........................................................ 54
Table A.1 MERV rating chart. ...................................................................................................... 62
Table D.1 NCERA-101 Minimum guidlines for measuring and reporting environmental
parameters for experiments on plants in growth rooms and chambers. ...................... 67
Table E.1 Biowall environmental conditions. ............................................................................... 68
Table F.1 Plant dimensions. .......................................................................................................... 69
Table K.1 Plant measurements (before). ....................................................................................... 78
Table K.2 Plant measurments (after). ........................................................................................... 79
Table K.3 Plant measurements (test trays). .................................................................................. 80
Table K.4 Plant measurements reconciled. ................................................................................... 81
Table K.5 The average and standard deviation of all plant measurements .................................. 82
Table K.6 Biowall plant tray nutrients. ......................................................................................... 83

xi
LIST OF ABBREVIATIONS
Abbreviation Description
AEL Applied Energy Laboratory. Purdue University
Polytechnic Institute. KNOY Hall Room 425
ASHRAE American Society of Heating, Refrigeration, and Air-
Conditioning Engineers
BAS Building Automation System
Biowall Name of the botanical air filter under review
CEBES Commercial Buildings Energy Consumption Survey,
the U.S Energy Information Administration
DOE Department of Energy
dP Differential pressure
EIA U.S. Energy Information Administration
EPA U.S. Environmental Protection Agency
HEPA High-Efficiency Particulate Arrestance-filter
HVAC Heating Ventilation and Air Conditioning
IAQ Indoor Air Quality
IRB Instructional Review Board
LED Light Emitting Diode
MERV Minimum Efficiency Reporting Value
NASA National Aeronautics and Space Administration
NCERA-101 North Central Extension & Research Activity-101
PAR Photosynthetically Available Radiation
ReNEWW Retrofit Net zero: Energy. Water. Waste.
SBS Sick Building Syndrome
VOC Volatile Organic Compound

xii
ABSTRACT
Author: Torres, Jacob, J. Jr. M.S.
Institution: Purdue University
Degree Received: May 2019
Title: The Biowall Field Test Analysis and Optimization
Committee Chair: William Hutzel
A residential botanical air filtration system (Biowall) to investigate the potential for using
phytoremediation to remove contaminants from indoor air was developed. A full scale and
functioning prototype was installed in a residence located in West Lafayette, Indiana. The
prototype was integrated into the central Heating, Ventilating, and Air Conditioning (HVAC)
system of the home. This research evaluated the Biowall operation to further its potential as an
energy efficient and sustainable residential air filtration system.
The main research effort began after the Biowall was installed in the residence. A field evaluation,
which involved a series of measurements and data analysis, was conducted to identify treatments
to improve Biowall performance. The study was conducted for approximately one year (Spring
2017-Spring 2018). Based on the initial data set, prioritization of systems in need of improvement
was identified and changes were imposed. Following a post-treatment testing period, a comparison
between the initial and final performances was completed with conclusions based on this
comparison.
The engineering and analysis reported in this document focus on the air flow path through the
Biowall, plant growth, and the irrigation system. The conclusions provide an extensive evaluation
of the design, operation, and function of the Biowall subsystems under review.

1
CHAPTER 1. INTRODUCTION
The organization of this document follows the approach to conducting the research. The effort
centers around articulating the problem statement, posing a research question, identifying the
scope of work, and listing overall assumptions, limitations, and delimitations, which also served
to keep the research on task. Chapter 1 introduces the research by defining the parameters
important to the experimental design. Listed in the following sections are the problem statement,
the research question, the scope, the significance, definitions, assumptions, limitations,
delimitations, and the hypothesis.
1.2 Problem Statement
Americans spend 90% of their time indoors; where indoor air is 2-5 times more polluted than
outdoor air (EPA, 2019). Residential air filtration methods are limited in contaminant removal
capability and design life. The limitations in conventional residential air filtration technologies
make people vulnerable to indoor air pollution. Consistent indoor air filtration completed to
ASHRAE recommendations would reduce Sick Building Syndrome (SBS) related illnesses
(ASHRAE, 2016). Botanical Air Filtration and specifically, the Biowall technology, have the
potential to help consistently meet indoor air quality standards.
1.3 Research Question
Is the Biowall prototype in a residential home operating within design specifications?
1.4 Scope
The research describes an evaluation of the Biowall prototype located within the ReNEWW home
near Purdue University in West Lafayette, Indiana. Observational/experimental studies into the
prototype’s nominal air flow characteristics, plant growth and behavior, and the functioning of the
irrigation system determined what treatments were applied to meet design specifications or
improve the systems. The scope of the work was to maximize the system's filtration capability by
ensuring that the systems were functioning as designed.

2
1.5 Significance
In a 2012 commercial building energy consumption survey (CEBES), conducted by the U.S.
Energy Information Administration (EIA), 34% of the energy used in commercial buildings within
the U.S. went to heating and cooling. A similar survey conducted on residential buildings
concluded that 48% of energy consumption in U.S. residences went to heating and cooling (U.S.
EIA, 2012). Efforts to minimize the energy consumption of newly developed technologies which
effect Heating Ventilation and Air Conditioning (HVAC) energy usage will decrease energy
consumption in the U.S. and around the world.
The U.S. Environmental Protection Agency (EPA) reports that on average, Americans spend 90
percent of their time indoors. Advances in HVAC systems lead to increased sealing of buildings.
This, combined with the increased use of recycled indoor air puts people at risk of exposure to
poor indoor air quality. As far back as 1999 the CBS news show "60 minutes" reported on the
negative effects of sick building syndrome (SBS), and how the recycling of contaminated air
effects worker productivity.
Botanical air filtration is a concept aimed to improve Indoor Air Quality (IAQ) using a sustainable
method while increasing design life compared to current technology. The goal of the Biowall is to
remove contaminants (VOCs) from recirculated indoor air. The energy consumption of the
Biowall is minimal, periodical filter element replacement is not necessary, and the filtration
mechanism is natural (i.e., the plants and their growth media). This forms a system that could have
a positive impact on IAQ while taking advantage of a sustainable method as its primary
mechanism. Also, it has the potential to reduce outdoor air ventilation rates for maintaining the air
quality of a building (Alraddadi, 2016). Therefore, a Biowall could contribute to reduced energy
consumption compared to that reported in the energy CEBES survey.

3
1.6 Definitions
Biowall The botanical air filter prototype scrutinized during this research.
Building Automation
System (BAS)
A BAS combines inputs and outputs of a building control system
which allows for the automation of devices and sensors to control the
indoor environment and efficiently meet user needs.
Botanical Air
Filtration
A biological filter that utilizes aspects of plants to perform a filtration
process.
Controlled
Environment
A space that utilizes automation and technology to maintain
environmental parameters.
Environmental
Chamber
An isolated room where all conditions of the environment can be
scrutinized, measured, and controlled.
Field Test A field test is a validation process available to the manufacturing
process which scrutinizes the technology under real-world
conditions.
Hot Wire Anemometer A device used to measure air movement.
Indoor Air Quality
(IAQ)
A phrase used to describe the condition of air within a building or
home.
Sustainable Meet the present needs without compromising the ability of future
generations to meet their needs. (U.N. Report, 1987).
The ReNEWW House Retrofitted Net-Zero Energy, Water, and Waste (ReNEWW) Home:
A cooperative research residential building, sponsored by Whirlpool,
located near the Purdue Campus in West Lafayette, Indiana. The
Biowall prototype is located within this research home.
Phytoremediation A biological process which uses plants or microorganisms to remove
undesired contaminants from the air, water, or soil.
WebCTRL The Biowall online BAS control interface.

4
1.7 Assumptions
The assumption made at the onset of this research is summarized as follows:
The characteristics of the Biowall at the ReNEWW house, and the properties that affect it
were consistent throughout the research data collection period.
Variations caused by occupants, weather, or other external factors were not considered.
1.8 Limitations
The limitations governing this research are as follows:
Treatments derived must coincide with the existing infrastructure and algorithm of the
Biowall.
The treatments were limited to the existing Biowall prototype.
The timeframe of experimentation limited the amount of Biowall systems reviewed.
1.9 Delimitations
The delimitations are as follows:
The actual bio-filtration mechanism (phytoremediation) and filtration quantification were
not evaluated during this study.
1.10 Hypothesis
A subsystem-level assessment of the Biowall prototype will verify system function and identify
areas in need of improvement. The treatments imposed because of this work will lead to the
prototype running at its design specification level, or better, maximizing the air filtration potential
of the prototype.
1.11 Summary
The introductory chapter defines the parameters of this research, including a problem statement
and a research question. Definitions of concepts and equipment used to complete this work are
provided. The scope, assumptions, limitations, and delimitations are listed to provide a boundary

5
for the topics of this research. Finally, a hypothesis documents the expectations prior to conducting
the study.

6
REVIEW OF LITERATURE
Literature review explores manufacturing product development methodologies, HVAC filtration
technologies, botanical air filtration, indoor air quality, controlled environment plant research, and
the existing Biowall literature. This review cites publications relevant to the study, particularly as
to the design, function, and/or practices of relevant systems of the Biowall prototype at the
ReNEWW home.
2.2 Six Sigma and New Product Development
The fundamental thought behind the research described herein was in applying a manufacturing
process on the Biowall to drive improvements and record quantifiable changes. The Biowall as it
existed at the time of this research was a single prototype installed in a target customer ‘real world’
situation. The prototype was fully implemented into a home with up to three people at a time living
in it and thus presented a unique opportunity to validate the system under full operation.
There are many methods for using manufacturing quality control to develop a new product. One
well-known method is Six Sigma. It was introduced in 1986 by Motorola to monitor failure data
of its products and derived statistics to identify quality concerns (Go Lean Six Sigma, 2012). The
appropriate implementation of the Six Sigma method aims to create 99.9996% successful attempts.
Maintaining a high success rate serves well for business manufacturing. Designing a consistent
level of quality into products is a staple of many successful companies.
The Six Sigma Handbook (Pyzdek and Keller, 2003) interprets the method for achieving a high
rate of successful products. As related to production, Pyzdek identifies five overall stages or phases
of development leading up to a successful product. They are Define-Measure-Analyze-Improve-
Control (Pyzdek and Keller, 2003). In the period between the conception of an actual customer
using a component or system, the developers will be most successful if they fulfill each of these
five stages.

7
The Biowall up to the point of this research had been defined. In line with a successful
manufacturing theory like Lean Six Sigma (Pyzdek and Keller, 2003), this work initiated a period
of Measure-Analyze-Improve onto the system.
2.3 HVAC Development and Regulation
The push to implement HVAC regulation followed a period of growth in the technology. During
the late 1990s in the U.S., development of building comfort and control systems for new or
retrofitted buildings became a major industry. This development resulted in increased energy
consumption. According to the U.S Energy Information Administration (EIA) Commercial
Buildings Energy Consumption Survey (CEBES), electrical energy consumption in commercial
buildings grew from 38% in 1979 to 61% in 2012 (U.S. EIA, 2012). That growth is largely
attributed to the increase in electrically powered HVAC systems implemented during that time.
Refrigeration and the rise in computer technology were also contributors to this increase in
commercial buildings (U.S. EIA, 2012).
The formation of the American Society of Heating, Refrigeration, and Air Conditioning Engineers
(ASHRAE) directly relates to the U.S oil crisis in the mid-1970s (ASHRAE, 2004). This was a
time that invoked a need to innovate energy usage away from fossil fuels across the board in the
United States and abroad and brought the highest energy consuming technologies into focus for
improvement. Growth in this area had become significant enough to gain attention from industry
standard organizations like ASHRAE, who rose to the forefront of creating standards and codes
aimed at maintaining safe building controls and indoor environment technologies while increasing
building energy efficiency.
ASHRAE standards take the health and wellbeing of the buildings’ occupants into consideration
and is a reference to aid in building environmental control companies and manufacturers with
system design specifications. ASHRAE Standard 90.1-Energy Standard for Buildings has been
widely adopted by countries, states, and municipalities, and is a basic requirement for earning
Leadership in Energy and Environmental Design (LEED) certifications. LEED certifications can
reward a building owner with tax rebates and a reputation for meeting baseline potential building
efficiency guidelines (ASHRAE, 2004).

8
2.4 Reduce HVAC Energy Consumption
Results of the U.S. EIA CEBES determined that 61% of all commercial building energy
consumption is a result, in large part, of expanded use of electrically driven HVAC systems in
buildings (U.S. EIA, 2009). Simply said, any innovation that leads to a reduction of energy
consumption of HVAC systems will have an impact on the overall energy consumption of
buildings.
One method the HVAC industry employs to decrease energy consumption is to recirculate indoor
air. Recirculated indoor air is near both room temperature and the desired humidity level.
Introducing recirculated indoor air into the HVAC system air supply will require less
cooling/heating/dehumidifying from the system and ultimately save energy (Alraddadi, 2016).
The alternative to recirculating air is to draw outside air into the HVAC system. This will supply
a more consistent Indoor Air Quality (IAQ) by providing fresh air when introduced into an air
supply, the outdoor air may be hot and humid during the summer months, or cold in the winter, as
compared to the desired result of indoor comfort. The HVAC system will be required to provide
additional energy to heat, cool, and dehumidify the air supply under these conditions (Alraddadi,
2016). The recirculation of indoor air increases the relevance of other processes that make up the
HVAC system like air filtration.
2.5 Residential HVAC Air Filtration Technologies
A presentation of widely used HVAC air filtration methods is described in this section. The
mechanical air filter shown in Figure 2.1 is the primary method used to clean indoor air in
residential buildings. Air filters are designed to improve the quality of air by removing particulate
contamination. Filtering is accomplished by forcing return air flow from the HVAC system
through the filter. Mechanical air filters like the one shown in Figure 2.1 are generally made of
spun fiberglass material, pleated paper, or cloth and are the main line of defense for most
homeowners for ensuring appropriate IAQ (Davis, 2015).

9
Figure 2.1 New air filter.
Air filters vary in their effectiveness in removing contaminants from the air. ASHRAE developed
the Minimum Efficiency Reporting Value (MERV) for mechanical air filters. The MERV system
establishes a metric for air filter effectiveness that is expressed as a number from 1 to 16, where a
higher number indicates a higher level of contaminant removal. The MERV rating chart from
ASHRAE Standard 52.2 is included in Appendix A of this thesis. The MERV rating chart
identifies that lower MERV rated filters are limited in filtration capability and primarily capture
larger particulate matter. Higher MERV rated mechanical air filters remove particulates, as well
as contaminants like tobacco smoke and some biologicals.
The limitation of all air filters is revealed through their design life (ASHRAE, 2017). As the filter
captures contaminants from passing air, it becomes restricted, loses effectiveness, and risks
supplying poor IAQ over time. Figure 2.2 shows a dirty air filter with a relatively low MERV
rating that should be replaced. The filter is over 6 months old and physically looks dirty compared
to Figure 2.1. Forgotten air filters are common, and a leading source of HVAC malfunction is due
to the high restriction of airflow caused by a dirty filter (Davis and Heating, 2015). Dirty or
forgotten air filters are a large contributor to poor IAQ to a building. ASHRAE Standard 62.1
(2016) Ventilation for Acceptable Indoor Air Quality recommends that a filter be checked once a
month and changed quarterly at a minimum.

10
Figure 2.2 Dirty air filter to be replaced.
Other residential air filtration methods can target specific contaminants and supplement
mechanical air filters. Table 2.1 summarizes techniques that are effective in targeting specific
contaminations, but all the technologies have limitations. The EPA (2008) highlights air filtration
technologies and their limitations in Table 2.1. For example, UVGI filtration can only target some
biologicals; Gas Phase filters target gasses and odors but have shorter design life; PCO cleaners
use UV lights and introduce a substance to react with the light to destroy gaseous pollutants but is
not completely effective; Ozone generators use UV light with electrical discharge although this is
still experimental (EPA, 2008).
Table 2.1. Air cleaning technologies and limitations (EPA, 2008).
Air Cleaning Technologies Pollutants
Addressed
Limitations
Filtration Air Filters Particles Ineffective in removing larger particles because most settle from the
air quickly and never reach filters.
Gas-Phase
Filters
Gases Used much less frequently in homes than particle filters. The lifetime
for removing pollutants may be short.
Other Air Cleaners UVGI Biologicals Bacterial and mold spores tend to be resistant to UV radiation and
require more light or longer time of exposure, or both, to be killed
PCO Gases Application for homes is limited because currently available catalysts
are ineffective in destroying gaseous pollutants from indoor air.
Ozone
generators
Particulates, gases,
biologicals
Solid as air cleaners, they are not always safe and effective in removing
pollutants. By design, they produce ozone, a lung irritant.

11
The importance of the information presented in Table 2.1 (EPA, 2008) and the information within
this section shows that HVAC air filtration has limitations. Delayed upkeep of mechanical air
filters and the components of supplemental air filtering technologies put at risk the supply of
contaminated air to a building or possibly HVAC system failure. The removal of all contamination
from an air supply is a difficult task.
2.6 Indoor Air Quality (IAQ)
In a paper called “On the history of indoor air quality and health,” the author J. Sundell calculates
that more than half of the body’s air intake during a lifetime is inhaled in the home (Sundell, 2004).
Sundell concludes that as a result, most illnesses caused by environmental exposure stem from
indoor air. An enclosed space like a building or a home prevents free air movement. The result of
that creates a concentration in the air of both the pollutants that accompany human processes and
contaminants embedded in building materials and creates a poor IAQ (Sundell, 2004).
Several factors and practices contribute to the IAQ of a modern building. The HVAC industry is
in pursuit of energy efficiency, sparked by the 1970s-oil crisis in the U.S. resources were focused
on the issue of venting HVAC treated air out to the environment. Using energy to heat, cool, or
dehumidify and then venting it out the window was a waste of energy. This developed the practice
of sealing buildings against leaks to the outside (ASHRAE, 2004).
Recirculated indoor air makes up a portion of the air supply introduced into a residential building.
HVAC systems use recirculated indoor air as a way of saving energy. Mechanical air filters are
effective in filtering out particulates but have limitations; gaseous and/or biological contaminations
are not targeted by this technology (ASHRAE, 2017). Mechanical air filters are the primary air
filtration method for residential buildings.
The importance of IAQ on a building occupant contributed to the creation of ASHRAE standard
90.1, which indicates that an indoor air supply must be filtered (ASHRAE, 2004). HVAC system
designers are required to provide a system which supplies IAQ free of contaminants, hazardous
particulates, gaseous byproducts, and VOCs per this standard (ASHRAE, 2004). Conforming to

12
ASHRAE 90.1 and implementing a regular maintenance schedule is the industry standard for
supplying a healthy IAQ to a building.
2.7 Sick Building Syndrome (SBS)
A breakdown in HVAC air filtration processes creates vulnerabilities and raises the possibility of
providing to provide poor quality of indoor air. Poor IAQ is known to be a source of acute
respiratory illness, allergies, asthma, prolonged coughs, headaches, and tiredness just to name a
few. The cause of these symptoms had largely been overlooked in the past, dismissed as common
illnesses. The correlation with time spent indoors linked poor IAQ to these symptoms and led to
the official recognition of SBS (Fisk, 2000).
Frisk (2000) discusses SBS and explains that a loss in worker productivity leads to lost revenues
for businesses. Building occupants may experience SBS when exposed to poor IAQ. Poor indoor
air supply can significantly affect worker productivity in commercial/business settings; as workers
breathe in contaminated air, they experience SBS symptoms. Addressing SBS brings estimated
potential savings of $40-$200 billion a year nationally by reducing worker illnesses caused by poor
IAQ (Fisk, 2000).
One outlying point observed by researchers of IAQ filtration (Alraddadi, 2016; Leuner, 2016;
Newkirk, 2012; and Rajkhowa, 2016) is the need to address air filtration to ensure a safe supply
of recirculated indoor air to a building’s occupants. Successful innovation in recirculated indoor
air filtration will provide a safe level of IAQ, reduce the overall energy consumption of a building’s
HVAC system, and decrease SBS related illnesses.
2.8 Botanical Air Filtration
In the late 1960’s environmental scientist, Bill Wolverton and his team, working for the U.S.
military, discovered that plant roots could be used to filter agent orange from Florida waterways
(NASA, 2007). Following this work, the National Aeronautics and Space Administration
(NASA) funded the Wolverton team to explore phytoremediation, the process of using the

13
rhizosphere of plants to filter contaminants from an air supply for deep space exploration
(Wolverton, 1997). This work quantified the air filtration capability of various plant species.
Based on 27 years of research, “The NASA Guide to Air-Filtering Houseplants” was derived.
The plants identified in this study are known for the following: their ability to remove carbon
based and VOC contaminants from the air, non-toxicity to human plant owners, ease of growth,
and expected lifespan (Rokas, 2017).
Research into botanical air filtration led to the development of a residential application called the
Biowall (Leuner, 2015). The Biowall targets VOCs through phytoremediation (Alraddadi, 2016),
and some particulates through the selected growth medium (Wang and Zhang, 2011).
2.8.1 The Biowall
The current study builds on research related to Biowalls that has been underway at Purdue
University since 2010. Purdue’s first Biowall was incorporated into a research home that was built
for the 2011 U.S. Department of Energy Solar Decathlon. Subsequent Biowall research was
conducted in the Applied Energy Laboratory at Purdue University to increase understanding of
plant health and indoor air quality characteristics. Guided by the new information, a second
Biowall prototype was developed and evaluated in a laboratory setting before deployment into a
research home in spring 2016.
A detailed description of the Biowall systems as they existed at the onset of this research was best
described by Hannes Leuner (2016): Design and Evaluation of a Full-Scale Botanical Air Filter to
Improve Indoor Air Quality in Energy Efficient Buildings. Topics, systems, and procedures from
the literature which are important to this research are discussed in the following subsections.
2.8.2 The ReNEWW Home
The botanical air filter prototype (the Biowall) is installed in the Retrofitted Net-Zero Energy,
Water and Waste (ReNEWW) Home in West Lafayette, IN. Figure 2.3 shows that it is a typical
bungalow style home. The home was built 80 years ago and was fully renovated as part of the
ongoing research within it. The ReNEWW home utilizes local resources to supplement demand
and meet an annual net-zero energy goal.

14
Figure 2.3 The ReNEWW home in West Lafayette, Indiana.
The ReNEWW house in Figure 2.3 has a goal higher than net zero energy. It aims to match annual
living consumption in energy and water with local resources and renewable systems output. The
ReNEWW Home employs photovoltaic (PV) electricity, geothermal heating/cooling, rainwater
catchment, and filtration, solar thermal water heating, high-efficiency appliances, smart building
automation, and botanical air filtration to meet the net-zero energy goal (Whirlpool, 2017).
2.8.3 The Biowall Prototype
The Biowall is the prototype botanical air filter reviewed during this research. It uses plants and
phytoremediation to filter VOCs from the indoor air supply of the ReNEWW home. The Biowall
prototype was designed and built prior to this research and orients four plant trays in a vertical
configuration to have air pulled through them (Rajkhowa, 2016).
The Biowall prototype is an integral part of the ReNEWW home HVAC system and is positioned
at the living room intake air duct. While the HVAC system is meeting heating or cooling demands
of the home, the air is pulled through the root environment of the four plant trays, initiating the
bio-air filtration process to occur. This system utilizes a Building Automated System (BAS)
manufactured by Automated Logic to operate the different functions, sensors, and systems that
make up the Biowall. The BAS allows for automation of the growth systems, records data, and
makes that data available online through a website that can be monitored and facilitates remote
operation (Leuner, 2016).

15
Figure 2.4 is a block diagram that breaks down the design and operation of the Biowall as defined
by Rajkhowa (2016). The diagram in Fig. 2.4 illustrates that the system combines plant growth,
technology, engineering design, automation, and research into a concept that seeks to improve the
IAQ of residential buildings (Rajkhowa, 2016). The Biowall provides a controlled environment to
facilitate plant growth which in turn completes air filtration.
Figure 2.4 Block diagram breaking down the Biowall design and operation (Rajkhowa, 2016).
2.8.4 Air Flow Through the Biowall
The design of the biowall requires air to flow through the plant trays when the ReNEWW home
HVAC system is turned on. Facilitating the phytoremediation process allows microbiology within
plants roots to filter out VOCs from the passing air as per Wolverton (1997). Air is pulled through
one of the four plant trays and converges into a single duct which feeds the HVAC supply. A side
view schematic with arrows representing the intended air flow path from Leuner (2016) is
referenced in the Appendix.
2.8.5 Plant Irrigation
Figure 2.5 shows the Biowall irrigation plumbing schematic. The figure illustrates that the
irrigation system of the Biowall uses the home water supply. Water is supplied to the plants

16
through a 3/8-inch soaker hose located at the bottom of each plant tray. The BAS runs a computer
script which executes the daily watering interval. When the solenoid valve is activated, water is
delivered to the bottom of each plant tray (Leuner, 2016).
Figure 2.5 Biowall irrigation plumbing schematic (rear view).
The ReNEWW home utilizes a rainwater catchment and filtering system as the primary water
supply (~38 PSI). When the rainwater supply is depleted, the water source switches to West
Lafayette City water supply (~55 PSI).
The Biowall irrigation system supplies moisture to the plant trays through a 3’ length of 3/8" soaker
hose arranged in a spiral and positioned at the bottom of each plant tray under the growth media.

17
Figure 2.6 is a picture of the soaker hose configuration from Leuner (2016). The figure shows that
the 3/8” soaker hose is positioned above a thin layer of growth medium and tied in a spiral to the
bottom of the plant tray. The hose is then covered with growth medium and plants. A quick connect
fitting is positioned at the inlet of the hose to connect to the Biowall plumbing and is capped at the
end.
Figure 2.6 Biowall plant tray and soaker hose orientation.
Specifications of the Biowall irrigation system are summarized as follows (Leuner, 2016):
Solenoid valve operated.
Activated by the BAS based off a daily irrigation schedule.
Irrigation cycle: 15 sec/day.
A soaker hose is located at the bottom of the plant trays, in a spiral orientation.
The average flow rate of 2.39 L/min per tray.
Functioning pressure regulated at 25 PSI.
Quick disconnect of soaker hose positioned at each tray for easy removal.
2.8.6 Biowall Lighting
The lighting system of the Biowall is operated by the BAS to turn the lights on and off based on a
daily schedule. Figure 2.7 shows one plant shelf of the Biowall and the light emitting diodes
(LEDs) positioned above. The system utilizes three 12” strips of broad-spectrum plant growth
LEDs in series per tray (Fig. 2.7). The LEDs are held in position with heat resistant double-sided
adhesive (Leuner, 2016).

18
Figure 2.7 A single Biowall plant tray shelf with broad-spectrum plant growth LEDs.
Leuner (2016) explains the constraints in the Biowall lighting design. In most cases, an indoor
Biowall will not have enough natural lighting to support plant growth. Plant growth LEDs were
used to supply the plant trays with adequate photoperiod and light intensity. Specific lighting
frequencies are beneficial to plant growth and flowering primarily within the red and blue portions
of the visible spectrum. However, the combination of these two colors alone provides a light that
is not comfortable for human use.
To accommodate human comfort while meeting the lighting demands of the air filtering house
plants, the LED brand Tsujiko Co. Ltd.’s model EL-NO1-LT104F-DQM-D2420 are used in the
Biowall for plant growth light and an eye-pleasing look. The light appears as soft white.
The specifications of the lighting system are summarized below (Leuner, 2016):
LED Brand: Tsujiko Co. Ltd.’s EL-NO1-LT104F-DQM-D2420
Quantity: Three 12" strips per tray (in series)
Voltage: 24VDC
Photosynthetic Available Radiation (PAR): 77.5 μmol/𝑚2𝑠
Frequency Wavelength: Approx. 430 nm

19
Lighting Interval: 9.5 h/day
LED distance from tray: 12"
2.8.7 Biowall Plant Trays and Fertilization
The Biowall utilizes a porous growth medium to pull air through the plant’s roots. The growth
medium consists of 40% coconut fiber, 40% Growstone, 20% activated carbon pellets. The growth
medium mixture does not have nutrients to offer plants (Rajkhowa, 2016).
The tray and Biowall are made of food grade stainless steel. The dimensions of one tray are 18” x
22” x 4.” To promote uniform air flow throughout the Biowall, various sized perforated holes
(large up front, small in back) are cut out from the bottom of the tray. The plant tray is filled with
the growth medium mixture and the plants are established in the growth medium to allow the roots
to grow.
To enable survival during the exposure of air passing by the roots, the plants required a period of
acclimation to the plant trays. The acclimation period was 3-6 months within a plant nursery
environment. Leuner (2016) proposed that to promote efficient botanical air filtration, the plant
and its roots need to be healthy.
Rajkhowa (2016) explains that fertilization is the key to maintaining a healthy plant. While the
plants are acclimating to the Biowall plant trays, nutrients are delivered bi-weekly to the plants
through an aqueous solution. The fertilizer (FloaDuo) is a water-soluble plant fertilizer formulated
in A and B solutions. The recommendation is to use the ‘strong grow’ blend (3-parts A: 1-part B)
(Rajkhowa, 2016). The strong grow blend encourages root growth during early shoot development.
While the Biowall plant trays of the prototype are filtering air, Osmocote smart release plant
fertilizer pellets (outdoor/indoor) are to be added every six months at half the recommended
amount (Rajkhowa, 2016). The use of fertilizers must take into account exposure to the residents
of the home and must not affect human health.

20
2.9 Air Filtering Plants
The NASA Clean Air Study (1989) was conducted by NASA and the Associated Contractors of
America (ACOA). It identified indoor house plants as capable of removing toxins from the air.
The goal was maintaining clean air within space capsules. The study identified that volatile organic
compounds (VOC) such as benzene, formaldehyde, and trichloroethylene are removed from the
air by having plants growing within an indoor space (Wolverton et al, 1989).
In Plants and Soil Microorganisms: Removal of Formaldehyde, Xylene, and Ammonia from the
Indoor Environment (Wolverton, 1993), research into a series of air filtration experiments using
house plants was presented. Plant species VOC removal rates were presented dependent upon
temperature and pot size. House plants were used for their long life as well as ease of growth and
access.
Several sources summarized the results of The NASA Clean Air Study (Wolverton et al, 1989) to
provide a list of the top air filtering plants. For example, the article; NASA Reveals a List of the
Best Air-Cleaning Plants for Your Home (Rokas, 2017) discusses the NASA Clean Air Study and
recommends plants to be used for air filtration purposes. The plant growth experiment completed
within this research followed the NASA Clean Air Study for species section and practices.
2.10 Plant Experimentation in Controlled Environments
The North Central Extension & Research Activity-101 (NCERA-101) is a committee of industry
professionals organized by the United States Department of Agriculture (USDA) to provide
information to plant scientists regarding controlled environment experiments. NCERA-101 has
published a set of guidelines that can be used to measure and report on plant growth experiments
conducted in a controlled environment (controlledenviroments.org). The establishment of an
international standard for recording data from and reporting on plant experimentation within a
controlled environment simplifies experiment replication and verification. The Minimal
Guidelines for Measuring and Reporting Environmental Parameters for Experiments on Plants in
Growth Rooms or Chambers is published on the NCERA-101 website (controlledenvroments.org)
and is referenced in the appendix of this paper. The Biowall provides a controlled environment for

21
plant growth and thus Biowall studies environment parameters reported in this thesis follow the
NCERA-101 guidelines.
2.11 ASHRAE Handbook Fundamentals: Measuring Air Flow Through a Duct
The ASHRAE fundamentals handbook (2017) defines recommendations for measurement and
analysis of parameters related to HVAC systems.
The handbook illustrates the pattern of air velocity measurement points in rectangular or circular
ducts (Figure 2.8). To determine the air flow through a duct, the ASHRAE fundamentals handbook
(2017) recommends using a hot wire anemometer to record multiple air velocity measurements.
Understanding that the air flow through a duct will not be uniform throughout, the recommendation
calls for taking multiple air velocity measurements at strategic points as shown in Figure 2.8 and
calculating the average of the total measurements to estimate the air flow rate.
Measurement points of a rectangular duct are determined through a given fraction multiplied by
the width or height (Fig. 2.8). A circle multiplies the diameter by the given fraction and repeats
the measurements every 60 degrees from the x-axis. An average of the measurements will
represent a velocity in feet per minute (ft/min). To determine the air flow in cubic feet per minute
(CFM), multiply the velocity (ft/min) by the area (𝑓𝑡2). In general, air velocity is minimal at the
walls of the duct and greatest at the center.

22
Figure 2.8 ASHRAE Handbook-Fundamentals air flow through duct measurement point
locations in rectangular and circular ducts.
ASHRAE reports the result to be deflated by 3% to 4% and is a good approximation to determining
the volumetric flow rate at that location (ASHRAE, 2017).
2.11.1 Hot Wire Anemometer and Air Velocity Measurement
The hot wire anemometer used for this research is the TSI VELOCICALC Plus 8386 (Figure 2.9).
It was set to record air velocity in feet per min (ft/min). The device has a telescoping wand that
makes point measurements of air velocity. A grid of measurements can be recorded and used to
estimate air flow rates.

23
Figure 2.9 Hot wire anemometer TSI VELOCICALC Plus 8386.
2.12 Summary
The literature review presented in this chapter explored past works which have importance to the
design and operation of the Biowall at the ReNEWW home. This information provided insight
into understanding the Biowall and informed the researcher of system specifications. Based on
this review and presented in the following chapters, the establishment of practices and
identification of resources needed to complete the evaluation were made.

24
RESEARCH METHODOLOGY
The Biowall prototype at the onset of this research presented a unique opportunity to test the
systems within its target environment. Following a method of product development like the one
discussed in The Six Sigma Handbook (Pyzdek and Keller, 2003), this work took advantage of the
real-world situation of the Biowall to “Measure-Analyze-Improve” the systems already in place
before proceeding with full-scale production and commercialization.
The physical testing of the Biowall prototype identified anomalies to various systems. This
research took an experimental approach to apply treatments to those anomalies. This chapter
explains the experimental design and documents the initial state of the systems under review.
Completed summer 2017 through spring 2018, three anomalies were targeted: the air flow
behavior through the Biowall plant trays, plant growth experimentation, and plant irrigation
optimization.
3.1 Experimental Design
The experiment applied the Six Sigma Handbook method of product development to produce
identifiable instances of system changes on the Biowall prototype. The overall structure of the
experiment recorded initial data, applied a treatment, recorded final data, and analyzed for changes.
This method was applied to three specific aspects of the Biowall. Airflow analysis and irrigation
optimization items followed the Field Experiment, One Group Pre-Test/Post-Test design. This
method isolates the subsystem observed in a field environment, performs intent-based
measurements and documentation, and applies an experimental treatment.
The plant growth experiments were best fulfilled by using the Minimum Guidelines for Measuring
and Reporting Environmental Parameters for Experiments on Plants in Growth Rooms or
Chambers (NCERA-101). The study evaluated environmental conditions, plant species growth,
and treatments applied to the plant trays. The outcome documented plant tray set up and plant
growth within the Biowall. This work improved the function of the Biowall and aesthetics as well
as expanded the number of demonstrated plant species grown within the Biowall environment.

25
Data and observations recorded as part of these experiments resulted from weekly Biowall visits,
and BAS trend data. The regular schedule fulfilled the pre-test/post-test data requirement and the
implementation of treatments.
3.2 Initial Assessment and Methodology
Beginning in January 2017, an assessment of the Biowall prototype under full operational
conditions was conducted. Trends in physical measurements and other observations were used to
assess the Biowalls nominal characteristics. Through this assessment, areas for subsystem
improvement, better management, and upgrades were identified.
The method imposed a validation to the subsystems that make up the prototype. The result
included a list of anomalies for Measure-Analyze-Improve. To accommodate the timeframe of this
research, measuring and modifying the subsystems were prioritized. This process was instigated
by the researcher and validated by the Principal Investigator (PI) to weigh the impact that added
improvements could have on the overall effectiveness of the Biowall.
From the initial assessment of the Biowall function, three aspects were the focus during the scope
of this research and were topics evaluated under the experimental design. The topics are
summarized below:
1. Air Flow Analysis-Determining the air flow path through the Biowall plant trays provided
a representation of the bio-air filtration process and quantified the amount of passing air
fulfilling the design path.
2. Biowall Plant Growth- Demonstrated plant growth and increased understanding of plant
behavior within the Biowall environment is essential to the viability of the concept. Just as
important is aesthetic value; a product of superior functionality is not as commercially
viable without aesthetic appeal. This study is a vehicle to address issues related to plant
growth and plant tray set up within the Biowall.
3. Irrigation Optimization-The plant irrigation system of the Biowall is vital to maintaining
healthy plant trays and thus bio-filtration capability. The work to optimize this system

26
assessed the initial configuration and worked within the established framework to derive a
treatment which will improve moisture delivery to all four plant trays.
The following sections document the methodology used to complete the described work.
3.3 Air Flow Analysis
The Biowall design pulls air through the plant trays to complete the filtration process before
sending it to the HVAC system for heating or cooling. Air flow through the plant's roots is essential
for the phytoremediation process to be completed. During the initial validation assessment,
evidence indicated that air was bypassing the plant trays.
The audible sound of bypassing air was noticed during a regular visit and initiated the process to
investigate air flow through the Biowall. The finding was an indication that not all the air was
following the intended path. With an understanding that air not exposed to the plant’s roots will
not complete the filtration process, an air flow analysis was prioritized.
3.3.1 Initial Air Flow Assessment
Following the indication that air was flowing outside of the plant growth trays, an investigation
into the air flowing through the Biowall, and the conditions within the subsystem which may affect
it, was initiated. The investigation observed the physical condition of the air seals, the consistency
of plant growth medium, the change in pressure from inlet to the outlet (delta pressure, dP), the
BAS trend data, and documented air velocity at strategic points within the Biowall.
3.3.2 Plant Tray Air Seals (Initial)
Figure 3.1 shows tray 3 during the initial phase of this experiment. An initial inspection of the
spaces between the Biowall and Biowall housing revealed the presence of growth medium rocks
and debris jammed between them. This finding is indicated with arrows in Figure 3.1. Wedged
debris between the Biowall housing and plant trays compromised the air seal.

27
Figure 3.1 Initial air seal assessment revealed Growstone rocks between the plant trays and
Biowall housing.
To inspect the air seals, the Biowall plant trays were removed from the housing to get a clear view
of the conditions under the trays and between the housing. Figure 3.2 shows the Biowall frame
following this step. Note: The plant tray shelves are numbered from the bottom (tray 1) to the top
(tray 4).

28
Figure 3.2 The Biowall housing with plant trays removed. Tray 1 (Bottom). Tray 4 (Top).
The rocks and growth medium found outside of the plant trays as seen in Figures 3.1 and 3.2 are
an indication that the trays were overfilled. A visual inspection of the Biowall indicated that the
plant tray appeared to have inconsistent depths of growing medium with overflow. A measurement
of the growth medium within the plant tray confirmed the observation.
Figure 3.3 shows plant tray 4 in its initial condition. The minimum and maximum depth
measurement points are indicated with numbers and arrows. The physical measurements (top to
bottom) of the growth medium depth in this tray are 1). 87.4 mm (the growth medium is below the
tray rim); and 2). 117.6 mm (the growth medium is higher towards the center). The difference in
depth between these two measurements is 30.2 mm. The three other trays show a similar result.

29
Figure 3.3 Tray 4 at an initial condition shows varying growth medium depths. (1) minimum, (2)
maximum growth medium depth.
The condition of the plant trays observed during the initial air seal assessment indicates that
varying growth medium depths and overflow negatively affect the Biowall airflow design. The
actions taken to address these initial findings related to the plant growth medium are presented in
the following sections.
3.3.3 Initial Air Flow Analysis Experimental Markers
A close look into the Biowall housing, plant tray seals, growth medium depth, and trend data
defined the initial conditions of the airflow analysis. Four observations are identified below as a
result of the initial assessment. These issues directed the air flow path to the outside of the plant
trays instead of through them.
1. Growstone from the plant growth medium is an obstruction between the plant trays and
Biowall air seals. Debris between the air seal and tray can compromise the seal (Figure 3.4,
# 1).
2. White marks on the side of the Biowall housing indicates that growstone rocks have been
wedged between the plant trays and the housing wall. This issue is also apparent in Figure
1
2

30
3.1. Wedged rocks will deform the metal over time and can cause permanent structural
damage to the plant tray air seal design (Figure 3.4, # 2).
3. The tray seals on the rear corners of all four plant tray shelves are torn. A torn air seal opens
a pathway for air to bypass the plant trays (Figure 3.4, # 3).
4. Inconsistent growth medium depth shown in Figure 3.3 creates a higher restriction in the
areas with more growth medium. This forces inconsistent air flow through the trays. The
inconsistency in growth medium depth and overflow is the source of growstones and debris
found during the initial assessment. This issue will be addressed as part of the plant growth
experiment.
Note: Figure 3.4 is a picture of the top tray shelf (tray 4) with the plant tray removed from the
Biowall at the time of initial inspection.
Figure 3.4 Biowall shelf 4 with tray removed: 1). Growstone obstructing air seal. 2). Signs of
Growstone wedged against the housing. 3). Damaged/torn air seals.
3
2 1

31
The observations of the initial assessment as exhibited in Figures 3.1 to 3.4 supported the initial
conclusion that air was bypassing the plant trays. At this point, a pause in action was taken to
quantify the air path through the Biowall prior to applying treatments to address the issues which
are a fulfillment of the initial data requirement of the experimental design.
3.3.4 Air Flow Profile
The air flow profile of the Biowall was completed with direction from The ASHRAE Handbook-
Fundamentals; Measuring Air Flow Through a Duct (2017) as referenced in section 2.11. An initial
air velocity profile that recorded measurement through and around the plant trays was completed.
The plant trays were treated as a rectangular shaped duct. Hot wire anemometer model
VELOCICALC PLUS MULTI-PARAMETER VENTILATION METER 8386 was used to record
air velocity (ft/min) within the Biowall (Fig. 3.5).
Figure 3.5 Hot Wire Anemometer (TSI VELOCICALC Plus 8386) used to record air velocity
readings through the Biowall.

32
The anemometer (Fig. 3.5) probe was extended to the desired measurement location. The
conditions during data collection were completed with the HVAC system off, and the Biowall
supplemental fan on high. This setting was selected for its controllability; the supplemental fan is
activated easily with the BAS.
Using the hot wire anemometer, a series of measurements was completed to create an air velocity
model of the Biowall at the time of measurement. The data can be seen in Appendix K. Data were
collected at 44 key positions within and around the Biowall plant trays (11 data points per tray).
These measurements, entered into a CAD model, provide an initial and post-treatment air velocity
profile. The sum of air velocity measurements within the trays compared to outside the trays
quantifies a percentage of the air measured.
Figure 3.6 shows the measurement points for one plant tray shelf. The X’s in Figure 3.6 indicates
the measurement locations used to record air velocity within the shelf. The red X’s represent
measurement points recorded within the plant tray. The blue X’s represent measurements taken
outside of the plant trays (between the cracks). This process was repeated within each of the four
plant tray shelves to create an air velocity profile.

33
Figure 3.6 Initial air measurement positions per tray indicated with an X. Red). Measurement
within the tray. Blue). Measurement outside the tray.
3.3.5 Air Flow Treatment Methodology
Following documentation of the initial air flow condition through the Biowall plant trays, three
treatments were imposed to restore the system to its designed air flow state:
Treatment 1: The first action removed all debris found during the initial inspection from the air
seals of the Biowall (Figure 3.7). Figure 3.7 is a picture of one tray shelf with the plant tray
removed following the cleaning. The tools used to clean the shelves were a shop vacuum, spray
bottle with water, and a clean cloth. The aim was to remove all obstacles from the air seal insulation
areas.

34
Figure 3.7 Biowall plant shelf with tray removed following Treatment 1. The arrows point to
tearing in tray air seals.
As indicated with arrows in Figure 3.7, the cleaning of the debris revealed tears in the air seal
insulation. A pattern of torn seals in the rear corners of each plant tray was revealed. This is
represented through the picture of tray 2 in Figure 3.7. Damage to the air seal can create pathways
for air to bypass the plant trays.
Treatment 2: Repair the torn areas of air seal throughout each Biowall shelf. The repair of tray 2
can be seen in Figure 3.8. All torn insulation was removed and replaced with similar insulation
material.
Figure 3.8 Tray 2 following Treatment 2 showing replacement of torn air seal insulation.
Tears in Air Seals

35
Treatment 3: Establish plant trays to meet design specifications. The makeup of the plant trays
determines air flow through them. Critical issues identified during the initial air flow assessment
of the trays: mixing a growth medium that is consistent throughout all the plant trays; establishing
an even growth medium depth within each plant tray; and the relocation/optimization of the
irrigation hoses.
Treatment 3 was a result of the two experiments developed in detail in the following sections. The
post-treatment results are presented within an air velocity profile shown in Chapter 4.
3.4 Plant Growth Experiment
Issues found during the initial assessment of the Biowall systems related to the plant trays are
reported in the air flow methodology of the previous section. Fulfillment of Treatment 3 of the air
flow experimental methodology will require the establishment and deployment of new plant trays
to the Biowall in place of the initial set. The need to implement improved growth medium
conditions initiated a review of Biowall plant growth in general. The plant growth experiment was
the method used to meet those needs.
The Biowall plant growth experiment was conducted to:
1. Identify initial design critical conditions within the Biowall plant trays.
2. Follow literature (Rajkhowa, 2016) and refer to initial findings to implement plant trays
which meet the Biowall design requirements.
3. Practice a vital component of the Biowall concept (plant growth).
4. Provide replicable data for future Biowall plant tray growth and aesthetic considerations.
3.4.1 Initial Plant Tray Analysis
Building on an evaluation of the conditions recorded during the initial air flow assessment, the
plant tray assessment documents the initial conditions of the Biowall plant trays. The Minimum
Guidelines for Measuring and Reporting Environmental Parameters for experiments on Plants in
Growth Rooms or Chambers document (NCERA-101) aided this assessment by indicating
functions that are vital to plant growth. The parameters reviewed as part of the initial assessment
are plant tray contents, growth medium depth, growth medium consistency, Photosynthetically

36
Available Radiation (PAR) intensity, and distribution, photoperiod, air flow, temperature;
humidity, pH and nutrients, water delivery, and plant measurements. The parameters found to be
out of design specification during the initial assessment are presented below:
Revealed during the initial air flow assessment, the growth medium within the plant trays
was at varying depths. This inconsistency was the source of debris which compromised the
air seal design. Figure 3.9 shows tray 4 during the initial plant tray assessment. As reported
in section 3.3.2, the physical measurements of the growth medium depth in this tray are 1).
87.4 mm (the growth medium is below the tray rim); and 2). 117.6 mm (the growth medium
is higher towards the center). The difference in depth between these two measurements is
30.2 mm. The three other trays show a similar result.
Figure 3.9 Tray 4 during the initial assessment shows that the growth medium within the plant
tray has inconsistent depths.
Observed during the initial assessment, tray 3 of the Biowall showed light shading in some
areas. Figure 3.10 is a picture of tray 3 during the initial assessment. In this image it can be
seen that: 1). The spider plant (Chlorophytm comosum) was the dominant plant in this tray;
2). Plant leaves were blocking the LED lighting from the lower canopy; 3). The shading at
the bottom right corner and crowding of the spider plant eliminated ground crawling plants.
1
2

37
Figure 3.10 The Biowall Tray 3 during the initial assessment shows the spider plant
(Chlorophytm comosum) as the dominant plant.
As part of the initial assessment, a test plant tray was deployed in the Biowall for
observation. Figure 3.11 shows a picture of the test tray installed in the Biowall. In it were
a pair of 5-year-old Golden Gate Ficus bonsai trees. The trees became desiccated and died
over a short period of filtration.
Figure 3.11 A test plant tray with two dead 5-year-old ficus trees.

38
3.4.2 Plant Growth Experiment Guidelines
A list of goals and considerations for the plant experiment developed following the observations
made during the initial plant tray assessment. Addressing the items as part of the plant growth
experiment will help meet design specifications. These are listed below:
1. The growth medium within the trays should have an equal constancy and depth to promote
equal air flow and avoid overflow to the plant tray air seals.
2. Plant orientation within the tray should consider the species growth characteristics to avoid
LED shading observed during the initial plant tray assessment (Fig. 3.10), i.e. tall plants in
the back; smaller or ground crawling plants up front.
3. A period of acclimation of the plants to the plant trays and growth medium prior to
implementation in the Biowall will allow for roots to establish and increase plant
survivability.
4. Documentation of the Biowall environmental parameters during the experiment was
intended to meet the Minimum Guidelines for Measuring and Reporting Environmental
Parameters for Experiments on Plants in Growth Rooms or Chambers. These data will
enable replication of the experiment and the conditions encountered during this study.
5. A demonstration of growing various air filtering plant species within the Biowall plant tray
environment will increase the aesthetic potential of the plant trays.
3.4.3 Plant Experiment Methodology
The procedure for implementing the Biowall plant growth experiment referenced the literature
(Rajkhowa, 2016) for growth medium consistency, fertilization, and designed parameter settings.
Completion of the experimental design required a second and third set of new Biowall trays to be
prepared. The third set of trays replaced the second set following removal from the Biowall for
review and post-experiment measurements. Based on the initial validation assessment, the issues
related to the plant trays were addressed within the new sets of trays. The resources used and
method employed during the experiment are explained in the following sections.

39
3.4.4 Biowall Environmental Measurements
The environmental conditions during the plant growth experiment were recorded to best fulfill the
Minimum Guidelines for Measuring and Reporting Environmental Parameters for Experiments on
Plants in Growth Rooms or Chambers document (NCERA-101) from the literature review. These
data can be found in the appendix.
3.4.5 Plant Selection
The NASA Clean Air Study (Wolverton et al, 1989) led to the identification of air filtering plants.
These plants have been experimentally shown to filter contaminants (VOCs) from the air through
microbes that survive within the plant roots. The plants were chosen for their documented ability
to grow in low light, have low fertilization requirements, be easy to care for and have aesthetic
value. A selection of plants was made from the NASA Clean Air Study to perform the plant growth
study within the Biowall environment. The common and scientific names of the plants used in this
study are listed in Table 3.1.
Table 3.1 List of plants selected for the Biowall plant growth experiment.
Common Name Scientific Name
English Ivy Hedera Helix
Ficus Ficus Benjamina
Golden Pathos Epipremnum Aureum
Heartleaf Philondendron Philodendron Cordatum
Marginata Dracaena Marginata
Oyster Plant Tradescantia Spathacea
Spider Plant Chlorophytm Comosum
Wandering Jew Trascenda Zebrina
3.4.6 Growth Medium Mixing
To ensure a consistent growth medium mixture throughout all four plant trays, a single large batch
was mixed in a cement mixer. The recipe followed Rajkhowa (2016). The growth medium for this
study was made up of 40% Botanicare Cocogro Coir fiber, 40% Growstone; 20% activated carbon
pellets (by volume).

40
3.4.7 Plant Tray Orientation
Establishing new plant trays addressed the findings observed during the initial assessment. The
plants used were propagated from existing plants or bought from a nursery in 3-inch pots. Over
the summer of 2017, a plant nursery was created to foster new plant trays. Four new plant trays
were established and given time to acclimate to the growth medium.
To collect final data from the second set of plant trays at the end of the experiment, the third set of
trays was established in the nursery. The third set of plant trays allowed the removal of the second
set from the Biowall to collect final measurement data.
Figure 3.12 shows one of the trays during its acclimation period in the nursery. The nursery
conditions seen in Figure 3.12 followed Rajkhowa (2016) growth recommendations and allowed
for root spread to occur throughout the trays. The method to address the issue of shading seen
during the initial assessment is shown in the figure; the big plant (dracaena marginata) was planted
in the center and towards the back of the plant tray. The smaller plants (epipremnum aureum and
philodendron cordatum) were planted around the large plant and towards the front. This format
was followed throughout all the plant trays and encouraged similar PAR to all plants within the
tray.
Figure 3.12 A new plant tray acclimating in the plant nursery.

41
To address growth medium overflow into the air seals and inconsistent growth medium depth, the
growth medium was maintained at 90 mm in depth throughout the entire tray (13 mm below the
tray rim). This is best seen in Figure 3.12 by referencing the top of the growth medium to the rim
of the plant tray.
3.4.8 Plant Experiment Implementation
In October 2017, the new plant trays were deployed to the Biowall and the initial set of plant trays
were returned to the plant nursery. The initial set of trays were dissembled to gain dimensional
measurements of the plants and roots. During the six-month final validation period, the new plant
trays in the Biowall were observed and environment parameter data recorded. During this time,
the third set of plant trays was established to begin the acclimation process in the nursery.
After six months of active filtration within the Biowall, the second (after) set of plant trays were
returned to the nursery for final plant measurement and documentation. These measurements are
reported in Appendix K.
3.5 Biowall Irrigation Optimization
The initial validation assessment of the irrigation system indicated that the optimization of the
water delivery location and total volume delivered to the tray could be improved. Added work into
the irrigation system had significant effectiveness throughout the Biowall plant growth systems
and was prioritized into this research. The optimization worked within the existing Biowall
plumbing to develop a plant soaker hose configuration which restricts water flow to a low level,
delivers a more consistent plant tray saturation and provides conditions for more consistent air
flow. The following sections discuss the conditions found during the initial assessment and defines
the methodology used in the design.

42
3.5.1 Initial Irrigation Assessment
The initial assessment of the irrigation system revealed inconsistencies from design specifications.
The findings are highlighted as follows:
As part of the initial assessment, the growth medium was removed from the initial set of
plant trays to observe the irrigation hose condition. Figure 3.13 shows a picture of tray 3
with the growth medium removed. The inspection showed that the soaker hose position did
not have a layer of growth medium beneath it. Also, the soaker hose was not oriented in a
consistent spiral (Figure 3.13). Referenced from the literature review in Figure 2.6, the
soaker hose should be positioned on top of a layer of growth medium and tied in equal
spacing to the bottom of the plant tray. This is a variation from the Biowall design.
Figure 3.13 Tray 3 with growth medium removed after initial assessment reveals the irrigation
soaker hose condition.
Observing the soaker hose position in Figure 3.13, the hose is obstructing some of the holes
at the bottom of the plant tray. The initial air flow analysis discussed in section 3.3
identified that air flow through the plant trays was limited. The soaker hose is serving as
an obstruction in Figure 3.13 and is a further restriction to the air flowing through the
Biowall as designed.

43
Figure 3.14 is a picture of plant tray 2 from the initial set of plant trays. A look into the
growth medium in the picture revealed that Osmocote fertilizer pellets intended to feed the
plants were not dissolved (highlighted with red circles). An added search into the remaining
growth medium from the initial set of plant trays identified many undissolved fertilizer
pellets. This an indication that moisture saturation was not consistent throughout the tray
and the plants were being deprived of nutrients.
Figure 3.14 Initial plant tray 3; fertilizer pellets not dissolved.
A pipe knock issue was reported by the ReNEWW home residents when the Biowall
irrigation was triggered on. The knocking noise was reported to be intermittent; it did not
always knock. An investigation confirmed the pipe knock and identified that the noise only
occurred when the ReNEWW home filtered rainwater supply was in use. This symptom is
noted as part of the initial assessment of the irrigation system.
3.5.2 Irrigation Optimization Goals
Initial observation of the irrigation system within the Biowall indicated that the positioning of the
initial soaker hoses limits its ability to saturate the entire plant tray. This indication derived from
the condition of the fertilizer pellets found in the growth medium. Equal moisture spread through

44
the trays would have dissolved the pellets. Also, the position of the hose obstructs airflow holes
(essential for air filtration) at the bottom of the plant trays (Fig. 3.13). This further contributes to
the lack of air flow through the plant trays found during the initial air flow assessment. The pipe
knock experienced only when the rainwater catchment system was in use indicates a large water
demand by the irrigation system when triggered. The low pressure of the ReNEWW home
rainwater catchment system (38 PSI) was insufficient to meet the water volume demand of the
Biowall irrigation, causing the pipes to knock. This did not happen when the city water was in use
at ~55 PSI.
These findings led to the development of a plant tray irrigation hose configuration that addresses
these issues. A list of goals for this optimization was formulated and are explained in the following
bullet points:
An optimized irrigation hose configuration must:
utilize the existing Biowall irrigation plumbing, valve, and control system.
reduce water delivery volume per tray.
relocate the irrigation apparatus to the top of the tray.
provide equal moisture spread throughout the plant trays.
provide water volume per tray within 10 percent of each other (close to equal).
operate at low pressure and provide extended irrigation periods designed not to
oversaturate the trays (cause increased restriction).
3.5.3 Irrigation Optimization Methodology
The new plant tray hose configuration had to work within the constraints of the existing plumbing
and controls of the Biowall. Common ¼” drip irrigation components provided the format used in
the design. A drawing showing the optimized plant tray hose design from the top and side views
of a single plant tray is presented in Figure 3.15.

45
Figure 3.15 Drawing of optimized Biowall plant tray irrigation hose configuration (top and side
view).
The drawing in Figure 3.15 illustrates a ¼” soaker hose configured in a parallel loop strung across
the top of the plant tray growth medium area. Relocation of the hose to the top of the plant tray
aims to provide moisture throughout the growth medium. The hoses were held in position using
stakes. A 5/8” to ¼” threaded reducer at the inlet of the hose configuration allows for easy
installation to the Biowall plumbing. This configuration was designed to fully saturate the plant
tray (from top to bottom), remove the airflow obstruction created by the larger diameter bottom
positioned hose configuration, and minimize water draw from the source to addresses the pressure
issue (pipe knock) identified during the initial assessment.
The varying height of the Biowall plant tray shelves and low operating pressure of the irrigation
system posed a challenge to delivering equal moisture delivery to each tray. Water will follow the
path of least resistance. Without components designed to confront fluid behavior, the bottom tray
did receive more water than the top. To meet the goal of delivering water volume to each tray
within 10% of each other, orifices of different size were implemented at the inlet of each hose (Fig.
3.15).

46
In determining the actual size of each orifice per tray, the orifice equation which takes
known/desired parameters from each tray to solve for a diameter relative to the plant tray shelf
position and the overall head was employed. The orifice equation is presented below:
𝑄 = 𝐶𝑑𝐴√2𝑔ℎ
Where:
Q=Flow (cubic cm per second).
Cd=coefficient of discharge.
A=area of the orifice (cm square).
g=acceleration from gravity (9.81 m/s^2).
h=head acting on the centerline (cm).
The diameter of the orifice was solved for given the desired flow rate, coefficient of discharge of
water, acceleration from gravity, and distance of head above the lowest point in the plumbing. The
resulting area allowed to solve for the diameter drilled into a purchased drip irrigation emitter and
was implemented onto the irrigation hoses of each tray (Fig. 3.15). The bottom tray has the smallest
orifice diameter at 0.254 m high to limit water flow. The top tray has the largest orifice size at
1.778 mm high to encourage increased flow to that tray.
3.5.4 Irrigation Optimization Implementation
Paired with treatments imposed during the Biowall plant growth experiment, the old irrigation
hoses were removed and replaced with the new irrigation hose configuration illustrated in Figure
3.15. The improved plant tray set up, in conjunction with implantation of the new irrigation hoses
combined to meet Treatment 3 of the airflow methodology. The result of this treatment is presented
as the “after” column in section 4.1.1 showing the profile of air velocity measurements after the
changes. A period of applied testing worked to establish an irrigation interval and duration.
The Orifice Equation

47
RESULTS
4.1 Air Flow Analysis Results
The results of the treatments described in Chapter 3 are presented in this chapter. The following
sections present the initial and final results of significance for each treatment imposed.
4.1.1 Air Velocity Profile
The series of air velocity measurements taken throughout the Biowall as described in Chapter 3
are reconciled into a Solidworks model to illustrate the air profile through the Biowall during its
initial and post-treatment states.
Table 4.1 provides representations of the air flow analysis results measured prior to and after the
treatments described in Chapter 3. In the table, a picture of the Biowall is represented with the
number of the trays (Left): the bottom tray is 1; the top is tray is 4. Each row in Table 4.1
corresponds to the Biowall picture and shelf position. The “Before” column in the figure represents
the corresponding Solidworks air profile from the initial air velocity measurements. The “Middle”
column represents the air profile following Treatment 1. The “After” column represents the air
profile following Treatment 2. All measurements were recorded with a hot wire anemometer in
ft/min. A color gradient is used to represent air velocity shown in the right column of Table 4.1;
blue indicates no flow and red indicates the most flow (~40 (ft/min)). The raw data that made up
Table 4.1 is shown in Appendix K.

48
Table 4. 1Biowall air velocity profile Before, Post-Treatment 1 (Middle), and Post Treatment 2
(After).
The ‘Before’ column (Table 4.1) uses a color gradient to illustrate the initial air measurements in
a Solidworks model. This data point shows air flowing through the left and right cracks, outside
of the plant trays only. This finding was consistent throughout all four trays. The ‘Before’ column
of Table 4.1 illustrates the data from the initial assessment and shows that most of the air flow
through the Biowall inlet is bypassing the plant trays.
The ‘Middle’ Column (Table 4.1) follows the application of Treatment 1 described in Chapter 3
and shows air flow through the outside of the plant trays is decreased. Air flowing through the
plant trays is increased. The color gradient seen in the Middle column represents this change of air
movement compared to the ‘Before’ data set through the Biowall.
The ‘After’ Column (Table 4.1) shows a final air velocity profile recorded after Treatment 2
described in Chapter 3. The color gradient indicates that most of the air flow is directed through
the plant trays; a result of the treatments applied. A small amount of air is still bypassing plant
trays 2 and 4.

49
Note: The post-treatment air velocity profile measurements presented in Chapter 4 were increased
to 60 measurements per profile for higher resolution (15 measurement points per tray).
4.1.2 Air Velocity Quantification
To quantify the air velocity measurements into a percentage, a summation of the air velocity
readings recorded going through the tray is compared to the sum of readings recorded at the right
and left outside cracks. The two are calculated into a percentage of air flow through and outside
the plant trays. Based on the initial air velocity measurements, a percentage of air going through
the plant trays compared to outside the plant trays is shown in Figure 4.1. The data used to calculate
this is presented in Appendix K.
Figure 4.1 Pie chart signifying the percent of all air velocity measurements through vs. outside
the trays (initial).
As indicated in Figure 4.1, based off the initial profile of air going into the Biowall, 86 percent of
the air velocity measured is moving through the left and right outside cracks; 4 percent of the air
is going through the plant trays.
Through Tray's14%
Outside Tray's86%
Before Treatment Air Velocity Quantification
Through Tray's Outside Tray's

50
Figure 4.2 Pie chart signifying the percent of air velocity measurements through vs.
outside the plant trays (After).
Figure 4.2 represents the percentage of air going through the Biowall plant trays vs. outside of the
trays following the application of the treatments. The result shows that 96.7 percent of the air
measured is going through the plant trays; 3.3% is going through the right and left cracks.
4.1.3 Differential Pressure (dP) Trend Data
This section discusses the differential pressure (dP) trend data recorded during the airflow analysis.
This data is an indication of the level of restriction between the inlet and outlet of the Biowall.
Figure 4.3 is a direct screenshot of the differential pressure trend data from before and after
Treatment 2 of the airflow analysis. This is viewed through the BAS online networking interface
for the Biowall.
Figure 4.3 shows trend data measured in inches-of-H2O (Y-axis) over time (X-axis). Region 1
(red) in the figure represents the differential pressure before Treatment 2. A continuation of the
data identified during the initial assessment shows the maximum dP is ~0.063 in-H2O; minimum
~0.058 in-H2O and does not show a significant change in dP over time mirroring HVAC cycles.
Region 2 (green) represents dP following Treatment 2: replacement of plant trays and relocation
of irrigation hoses. A spike in dP followed by a slow decline mirrors the irrigation interval. In
Through Tray's83%
Outside Tray's17%
After Treatment Air Velocity Measurments
Through Tray's Outside Tray's

51
Region 2 the dP increases to ~0.123 in-H2O (an indication that the plant tray is saturated and air
flow is restricted) and decreases to ~0.085 in-H2O over time (a representation of the tray saturation
declining over time). Region 3 (Blue) shows what the dP looks like when the bypass door is opened
and is a flat line hovering a little over 0.02 inches-H2O.
Figure 4.3 Differential Pressure trend data representing before (1) and after (2) airflow
treatments, as well as an open bypass door (3).
Figure 4.3 shows what the dP trend data looks like before the treatments (Region 1), after
Treatment 2 (Region 2), and with the bypass door open (Region 3). Through this data, three states
of the Biowall air flow can be seen. The open bypass door served as a reference to what non-
restricted air movement appeared to be.
4.2 Biowall Plant Growth Experiment
The results from the plant growth experiment conducted in the Biowall are shown in this section.
The results shown are from data collected during the experiment. The raw data can be found in
1 2 3

52
Appendix K. To allow replication of the plant growth experiments within the Biowall, the
parameter reporting format typically follows the International Committee for Controlled
Environment Guidelines (controlledenvironments.org).
4.2.1 The Biowall Before and After
Figure 4.4 shows a side by side view of the Biowall as it looked at the onset of this research (left)
and following the implementation of the second set of plant trays described in the methodology
(right). The following were implemented as part of the treatments: the growth medium was mixed
in a single large batch to pursue consistency; the growth medium was maintained at an even level
at 19 mm from the top of the rim; the plants were oriented to provide the greatest PAR possible to
each plant; the plants were arranged to increase the Biowall aesthetic value; and the plants were
acclimated in a plant nursery environment prior to implementing for air filtration to allow for root
spread and increase survivability of the filtration process.
Figure 4.4 The Biowall before (left) and after (right) implementing new plant trays.

53
4.2.2 Biowall Environmental Parameter Results
The Biowall parameter measurements recorded during the experiment are presented in Appendix
E. The experiment was conducted in 55.8 cm x 45.72 cm plant trays for a total growth area of 1.02
m2. The Biowall was equipped with Tsujiko Co. Ltd LEDs mounted 30.5 cm above the plant trays.
A downward air flow distribution pulls indoor air through the plant trays and supplies the plants
with a renewed air flow. The CO2 conditions inside the room are assumed to be nominal
atmospheric. The average room air temperature was 22.4 degrees C (s.d. +- 4.8 degrees C) during
the light period. The photosynthetically available radiation (PAR) at the top of the plant tray was
77 umol/m2-s during the 8.5-hour photoperiod. The average relative humidity in the room was
45.7% (s.d. +13.7 %). The plants were grown in 0.026 m3 of growth medium per plant tray. The
medium content was 40% coconut fiber, 40% growstone, 20% activated carbon pellets. The plants
were irrigated by the Biowall irrigation system 2 times daily for 30 seconds. The plant trays were
not fertilized during this experiment, having only received the home water supply. A nutrient test
of the growth medium showed a deficiency for nitrogen, sufficient phosphorous, and adequate
potassium. The pH of the growth medium was 7.5.
4.2.3 Plant Dimension Measurement Reconciliation
The plant dimension measurements recorded during the experiment are presented in Appendix K.
Plant measurements included root diameter, plant height, and plant spread diameter following the
return of the initial and second set of plant trays to the nursery. Root spread is the most important
measurement to botanical air filtration. A list of the plants with the highest to lowest root spread
from this experiment are listed below.
1. Ficus
2. Marginata
3. Spider Plant
4. Wandering Jew
5. Golden Pathos
6. Oyster Plant
7. English Ivy
8. Heartleaf Philondendron

54
4.3 Irrigation Optimization Results
The Biowall irrigation hoses were reconfigured to meet the optimization goals determined in
section 3.6.2. The treatment implemented the design shown in Figure 4.5. The bottom residing
3/8” soaker hose was removed and was replaced with a ¼” soaker hose positioned at the top of the
tray. The final specifications of the new irrigation hose configuration are defined in Table 4.2.
Table 4.2 Biowall irrigation specifications before and after.
Specifications Before After
Irrigation Interval (Daily) 15 secs 30-90 sec
Flow Rate* (L/min) 2.39 0.78
Working Pressure (PSI) 20 35
Soaker hose location in the tray Bottom Top
* The amount of water delivered per tray.
Table 4.2 documents irrigation system specifications before and after the treatments were applied.
As a result of the treatments, the irrigation interval increased from 15 seconds to 60 seconds. The
flow rate decreased from 2.39 L/min (per tray) to 0.78 L/min (per tray). The working pressure of
the system increased from 20 PSI to 35 PSI and the soaker hose location was moved from the
bottom of the plant tray to the top of the tray. Figure 4.5 shows a single tray installed in the Biowall
with the new irrigation hose configuration installed in it.

55
Figure 4.5 Biowall plant tray with optimized irrigation hose configuration.
Final Biowall irrigation specifications:
Solenoid valve operated.
Activated by the BAS according to a daily irrigation schedule.
Irrigation cycle 30-90 sec/ day.
¼” soaker hose configuration positioned on top of the plant tray.
Orifice sized to provide equal flow to each tray (larger on top).
The average flow rate of 0.79 L/min.
Operating pressure regulated at 35 PSI.
Quick disconnect of soaker hose positioned at each tray for easy removal.

56
SUMMARY, CONCLUSIONS, AND
RECOMMENDATIONS
The research presented in this paper applied a manufacturing validation method in an experimental
format to the Biowall subsystems. To answer the research question, an analysis of the initial
conditions identified subsystems to focus on. The three phases of the method “Measure-Analyze-
Improve” were applied. Documentation of initial and final conditions resulted in a comparison to
derive the conclusions made in this chapter.
5.1 Air Flow Analysis Conclusions
The air flow analysis results in present two forms of observing air flow through the Biowall: the
air velocity profile (Table 4.1) and differential pressure (dP) trend data (Figure 4.3). These outputs
provided quantifiable results of the air flow path through the Biowall before and after the
treatments were applied. The initial column in the air velocity profile in Table 4.1 indicates that
most of the air measurements recorded were not going through the plant trays (87%). Following
the treatments applied to address this finding, a majority of the air velocity readings (97%) were
measured through the trays. The treatments reversed the trend of air flow bypassing the trays.
Differential pressure (dP) trend data corresponds to the previous finding following Treatment 2
(Fig. 4.3). After the experimental treatments were applied, the HVAC cycle and an increase in dP
following the irrigation interval with a gradual decrease over time can be seen in the trends. The
indication is that saturated plant trays create more resistance to air flow and is seen as high dP in
the trend data. The dP declines as the plant tray water evaporates over time, seen as the downward
slope in Fig. 4.3. This type of pattern can only be seen if the air flow is going through the plant
trays and corresponds with the ‘after-treatment’ air velocity profile (Table 4.1). The conclusion is
that as a result of this research, most of the air is flowing through the plant trays as designed. The
filtration potential of the Biowall prototype is increased.
Moving forward: after the application of treatments during the period of work, a percentage of the
air measured continues to bypass the plant trays. Future iterations of the Biowall should consider

57
these results into the development of improved air seals and consider a different configuration,
materials, and/or the use of fasteners.
5.2 Biowall Plant Growth Experiment Conclusions
This technology is wholly designed to facilitate the phytoremediation of indoor air. By definition,
a healthy plant root zone is essential for the filtration process to occur. Plant growth is the single
most important aspect of the Biowall function. This research implemented plant growth within the
Biowall to provide increased documentation on this aspect.
The plants and the makeup of plant trays are a big factor in Biowall performance. Initial findings
exemplified the importance of maintaining a consistent equal depth of growth media and orienting
the plants within the tray. The documentation of environmental parameters is presented in
Appendix E. This documentation provides future researchers and Biowall owners with the
information to replicate this work as the use of Biowall’s continues.
The Biowall holds the potential to be an aesthetically pleasing contribution to a home. A result of
this work expanded known air filtering plant species grown within this environment. The
demonstrated knowledge gained during the variety of plant growth studies within the Biowall
provides plant tray designers with an array of possibilities to create trays which bring an eye-
pleasing functioning component to a home. For example, the most successful plant root growth
seen in this study was the ficus tree. This opens the potential for a Bonzi tree themed Biowall. It
is important to note that not all plants are safe for use. Certain plants produce chemicals that are
harmful to humans or animals, and pollen from flowers can irritate due to allergies. Any plant
species used within the Biowall should have a considerable amount of research behind it before
use. For a list of well-researched air filtering plants, consult the literature review of this paper.
5.3 Irrigation Optimization Conclusions
Irrigation is the primary plant life support system of the Biowall prototype. The delivery of
moisture to the plant trays not only keeps the plants alive, but the method and location of delivery
can encourage root growth throughout the media. Water consumption is especially relevant in the

58
ReNEWW home as the treated rainwater supply of the home is limited. As seen during the initial
validation phase, the hose location and configuration can affect air flow. These factors, along with
reports of pipe knocking when irrigation was initiated, motivated the consideration of irrigation
within the scope of this research.
The final irrigation hose configuration worked within the existing Biowall plumbing to optimize
moisture delivery by relocating the irrigation hose to the top of the tray, decreasing the diameter
of the hose to more accurately control the amount of water delivered, and configuring the hose in
a way that disperses moisture throughout the entire tray. The size and position of the hose minimize
the obstruction of airflow, and the smaller hose reduced water flow from the supply, thus
eliminating the pipe knocking.
Determining an irrigation interval accompanied the new hose configuration. The dP trend data
seen through the BAS served well to observe when the trays were saturated (high dP) and when
the trays were dry (low dP). It was apparent through the trend data that an optimized irrigation
interval can vary with environmental conditions like a change of season and weather. Further work
can utilize technology and automation to activate an irrigation cycle when the dP, or the signal
from a moisture sensor reaches a certain minimum.
5.4 Conclusion
The activity of “Measure-Analyze-Improve” on a prototype product is an effective method to
improving systems and components prior to full-scale production. At the same time, making
improvements can be an endless task which can be draining of resources and lead to the end of a
concept before it has had the opportunity to reach the market. Engine manufacturers create
deadlines by releasing annual models. The work that is left undone or in need of “Measure-
Analyze-Improve” is prioritized for the following year. The Biowall is nearing a point where it
can stop being research and become a product itself with its first model year being an iteration of
this prototype, and future versions can follow.
In conclusion, and with the work completed in this research in mind, future development of the
Biowall concept should consider implementing the plant growth method developed during this and
59
previous research as part of the routine. Regular maintenance of the Biowall subsystems such as
the seating of the air seals and performing irrigation hose checks will ensure consistent function.
The substituting of the control system from a BAS to something more affordable will make the
Biowall accessible to a wider range of customers. And a thorough filtration quantification which
evaluates known contaminants within indoor air and the Biowalls’ ability to remove them will
place this concept in a good position to be commercialized.

60
REFERENCES
Alraddadi, O. (2016). Investigating the toluene removal of a botanical air-filter with a loose-
packed growth medium for potential energy savings. West Lafayette: Purdue University.
ASHRAE (2017). Fundamentals Handbook: Measurement and Instruments. Atlanta, GA.
www.ashrae.com
ASHRAE (2016). Standard, 62.1, Ventilation for Acceptable Indoor Air Quality. Atlanta, GA.
www.ashrae.org.
ASHRAE (2004). Standard, ANSI/ASHRAE/IESNA standard 90.1, Energy standard for buildings
except low-rise residential buildings. Atlanta, GA. www.ashrae.org.
ANSI/ASHRAE. (2017). Standard 52.2 Method of Testing General Ventilation Air-Cleaning
Devices for Removal Efficiency of Particle Size. Atlanta, GA. www.ashrae.org. ISSN
1041-2336
Brundtland G. H. (1987). Report of the World Commission on environment and development: our
common future.” United Nations. New York, NY.
Davis A.C. & Heating (Feb 4, 2015). Air Filters: Understanding Their Function and How to
Choose the Right One. Stafford, TX. Retrieved From: https://davisac.com/article/air-
filters-understanding-function-choose-right-one
EIA. (2012). Residential energy consumption survey. 2009. online. Retrieve From:
https://www.eia.gov/consumption/commercial/. Retrieve Date: April 23, 2018.
EPA. (2019). The Inside Story: A Guide to Indoor Air Quality. U.S. EPA. Retrieve From:
https://www.epa.gov/indoor-air-quality-iaq/inside-story-guide-indoor-air-quality Retrieve
Date: January 19, 2019 web snapshot.
EPA. (2008). Guide to Air Cleaners in the Home. U.S. EPA. 402-F-08-004. Retrieve From:
https://www.epa.gov/indoor-air-quality-iaq/guide-air-cleaners-home#pco. Retrieve Date:
4/3/18.
Fisk W. J. (2000). Health and productivity gains from better indoor environments and their
relationship with building energy efficiency.” Annual Review of Energy and the
Environment, vol. 25, no. 1, pp. 537–566.
Go Lean Six Sigma (2012). DMAIC: The 5 Phases of Lean Six Sigma.
www.GoLeanSixSigma.com Retrieved From: https://goleansixsigma.com/wp-
content/uploads/2012/02/DMAIC-The-5-Phases-of-Lean-Six-Sigma-
www.GoLeanSixSigma.com_.pdf

61
Leuner, H. (2016). Design and evaluation of a full-scale botanical air filter to improve indoor air
quality in energy-efficient buildings. (Diploma’s Thesis). Dresden University of
Technology, Dresden, Germany.
NASA. (2007). Plants Clean Air and Water for Indoor Environments. NASA Spinoff. Retrieved
From: https://spinoff.nasa.gov/Spinoff2007/ps_3.html
Newkirk, D. (2012). Improving indoor air quality through botanical air filtration in energy efficient
residences. West Lafayette: Purdue University
Pyzdek, T., & Keller, P. A. (2003). The Six Sigma Handbook: A Complete Guide for Green Belts,
Black Belts, and Managers at All Level. New York, NY: McGraw-Hill.
Rajkhowa, B. (2016). Establishing and Improving Control Strategies That Sustain Plant Health in
a Botanical Biofilter. West Lafayette: Purdue University.
Rokas, L. (2017). NASA Reveals A List of The Best Air-Cleaning Plants for Your Home.
Retrieved From: https://www.boredpanda.com/best-air-filtering-houseplants-nasa/
Sundell, J. (2004). On the History of Indoor Air Quality and Health. Indoor Air 2004; (supplement
7):pg. 51-58. Blackwell Publishing. Denmark.
Wang, Z., & Zhang, J. S. (2011). Characterization and performance evaluation of a full-scale
activated carbon-based dynamic botanical air filtration system for improving indoor air
quality. Building and Environment, 46, 758-68.
Whirlpool. (2017). The ReNEWW Home Website. Retrieved From:
http://www.whirlpoolcorp.com/reneww-house/
Wolverton, B. C. (1997). How to grow fresh air. Penguin books.
Wolverton, B. C. (1993). Plants and Soil Microorganisms: Removal of Formaldehyde, Xylene,
and Ammonia from the Indoor Environment. Wolverton Environmental Sciences.
Picayune, Mississippi.
Wolverton, B. C. Wolverton, B.C.; Douglas, W.L.; K. Bounds (September 1989). Interior
landscape plants for indoor air pollution abatement (Report). NASA. NASA-TM-10.

62
APPENDIX A. THE MERV CHART
Chapter Section 2.5 references the MERV rating system of mechanical air filters. The MERV
rating chart for mechanical air filters is shown in the chart below.
Table A.1 MERV rating chart

63
APPENDIX B. AIR FLOW PATH THROUGH THE BIOWALL
Figure B.1 below shows a side view schematic of the Biowall and illustrates the design air path
through the plant trays. As illustrated in the figure, the air is pulled through the trays when the
HVAC system is turned on and/or the supplemental fan is engaged. The air flow path (illustrated
by blue arrows) starts at the left side of the schematic (the home living room) and the air is pulled
through one of four plant trays. After filtration, the air is directed to the HVAC supply. The figure
also represents the temperature, humidity, pressure, and relative humidity sensor locations (#’s 1,
2, 3, 4, 5, 10), the irrigation schematic (#’s 8, 9), and the supplemental fan and controls (#’s 6, 7,
11).
Figure B.1 Biowall schematic (side view).

64
The air path analysis presented in this study in the form of an Air Velocity model shown in Table
4.1 is made using the raw data recorded during regular visits to the prototype. The data used to
make the air velocity profile is shown in the following pages. The tables represent each data
measurement taken using a hot wire anemometer in the Biowall at different stages of treatment
application.
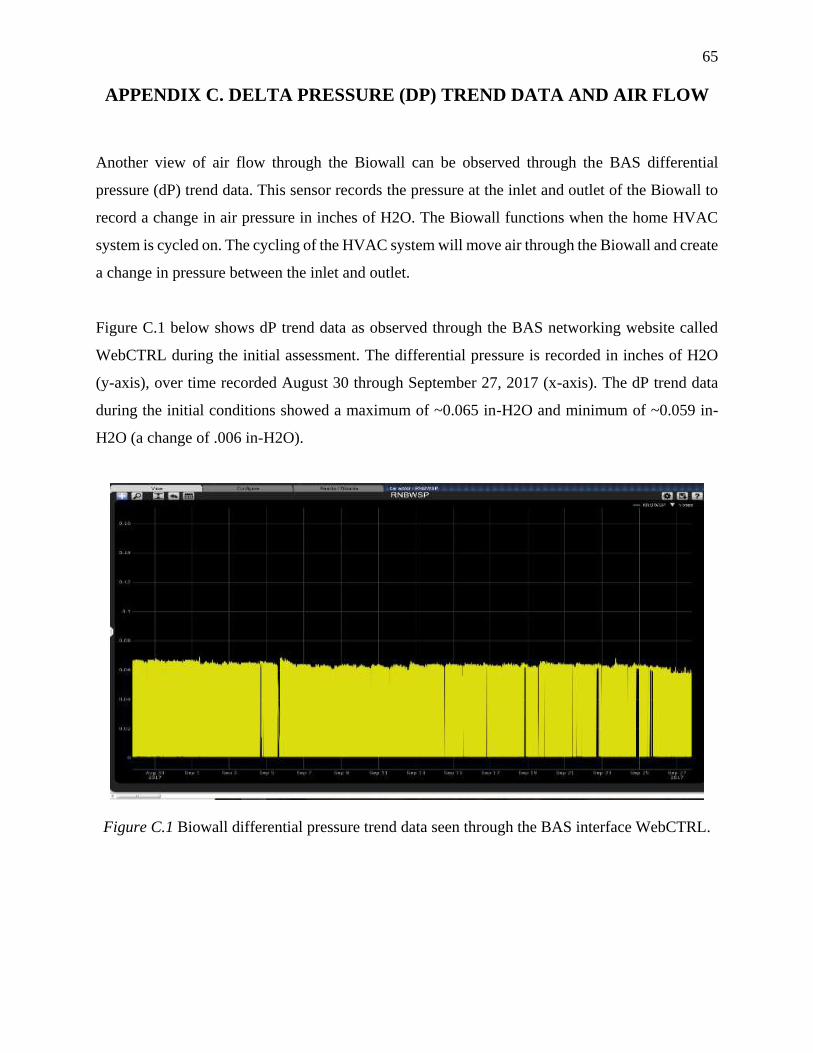
65
APPENDIX C. DELTA PRESSURE (DP) TREND DATA AND AIR FLOW
Another view of air flow through the Biowall can be observed through the BAS differential
pressure (dP) trend data. This sensor records the pressure at the inlet and outlet of the Biowall to
record a change in air pressure in inches of H2O. The Biowall functions when the home HVAC
system is cycled on. The cycling of the HVAC system will move air through the Biowall and create
a change in pressure between the inlet and outlet.
Figure C.1 below shows dP trend data as observed through the BAS networking website called
WebCTRL during the initial assessment. The differential pressure is recorded in inches of H2O
(y-axis), over time recorded August 30 through September 27, 2017 (x-axis). The dP trend data
during the initial conditions showed a maximum of ~0.065 in-H2O and minimum of ~0.059 in-
H2O (a change of .006 in-H2O).
Figure C.1 Biowall differential pressure trend data seen through the BAS interface WebCTRL.

66
The significance of the dP data shown in Figure C.1 is to document dP during the initial
assessment. As the HVAC pulls air through the growth media, a restriction is imposed on air flow.
Also, the moisture content of the plant trays adds to the restriction. The restriction is seen through
a change in pressure between the inlet and outlet. When dP was observed during the initial
assessment of the Biowall, some spikes in dP can be seen. The maximum change in dP is ~0.006
in-H2O and does not show the HVAC system cycling on and off. This is quantifiable evidence
that the air flow through the Biowall is bypassing the plant trays.

67
APPENDIX D. NCERA-101 MINIMUM GUIDLINES FOR MEASURING
AND REPORTING ENVIRONMENTAL PARAMETERS FOR
EXPERIMENTS ON PLANTS IN GROWTH ROOMS AND CHAMBERS
NCERA-101 Environmental parameter measurement recommendations for experiments on plants
in growth rooms and chambers was chosen as it best fits the condition of the Biowall placement
situation within the ReNEWW research home. The table from www.controlledenvrionments.org
is shown below.
Table D.1 NCERA-101 Minimum Guidlines for Measuring and Reporting Environmental
Parameters for Experiments on Plants in Growth Rooms and Chambers

68
APPENDIX E. PLANT EXPERIMENT ENVIRONMENTAL CONDITIONS
Shown below are the Biowall nominal environmental conditions recorded during the plant growth
experiment. This data aspired to fulfill NCERA-101 recommendations.
Table E.1 Biowall environmental conditions
Parameter to measure Average Value Standard Deviation/Description
Radiation Photosynthetically Active Radiation (RAR)
77.5 umol/m^2-s^2 Automated
Photoperiod 8.5 h/day Automated
Temperature Input Air 22.4 C 4.8 C
Atmospheric moisture Relative Humidity (zone)
45.7% 13.7 %
Carbon Dioxide
umol-mol-1
Air Velocity Average total input 1.62 m/s 0.232 m/s
Watering Per tray (0.75 L/min) 0.375 L 2 times daily
pH Growth Medium 7.5 n/a
*Tray Nutrient Content Nitrogen N1- Deficient n/a
Phosphorous P3- Sufficient n/a
Potassium K2- Adequate n/a
Substrate Per Tray 0.026 m^3 Cococoir 40%; Growstone 40%; Activated Carbon 20%
**Nutrition Liquid Culture Flora Duo A & B (Strong Grow Blend)
Once a week during tray acclimation.
Room or chamber properties (Biowall)
Plant Tray Area 1.022 m^2 0.26 m^2 Per Tray
Barrier beneath lamps 30.5 cm
Air Flow down Pulled through tray
Biowall plant growth study parameter measurements.
* Tray nutrient content recorded with Luster Leaf Products Inc. Soil Test Kit. Nitrogen, Phosphorous, and
Potassium were recorded with individual chemical tests from this kit. The individual sample results
provide a color which is comparted to a given 0-4 scale (0 depleted; 4 surpluses) to indicate the elements
level within the sample.
** Nutrition is delivered in an aqueous solution during plant to tray acclimation period in the lab only.
During the period of this research, the plant trays were not fertilized while on the Biowall. Tap water only
is delivered through the irrigation system. Fertilization delivered to plant trays while filtration is in the
process will have to meet Instructional Review Board safety standards for human experimental exposure
(a fertilizer that won’t hurt the home residents will need to be researched).

69
APPENDIX F. PLANT DIMENSIONS
The table below reports the plant measurements recorded during the plant growth experiment.
Presented are the average and standard deviation dimensions of each species in (cm).
Table F.1 Plant dimensions
Plant
Root Diameter (cm)
Plant Height (cm)
Spread Diameter (cm)
English Ivy Average 10.16 12.07 33.02
Std. Dev 1.27 0.64 12.70
Ficus Average 39.69 28.70 n/a
Std. Dev 0.95 0.76 n/a
Golden Pathos Average 17.96 18.22 35.56
Std. Dev 4.26 8.21 10.78
Heartleaf Philondendron Average 8.89 10.16 21.59
Std. Dev 3.81 2.54 3.81
Marginata Average 32.13 35.88 44.45
Std. Dev 9.27 2.22 11.43
Oyster Plant Average 12.70 22.86 n/a
Std. Dev 0.00 0.00 n/a
Spider Plant Average 30.36 31.99 50.80
Std. Dev 14.03 11.80 17.55
Wandering Jew Average 26.03 25.82 40.59
Std. Dev 8.26 13.97 0.00

70
APPENDIX G. INDIVIDUAL EXPERIMENT VARIABLES
This thesis consists of three experiments. There are a separate set of variables that affect each. The
dependent, independent, and confounding variables for each experiment are listed in the following
sections and subsections.
G.1 Dependent Variables
The variables that are dependent on conditions for each experiment are listed in the following
subsections:
Dependent Variables (Air Flow Analysis)
Bio-air filtration effectiveness is dependent on the air flowing through the plant trays.
Total air flow through the Biowall is dependent on HVAC and/or supplemental fan status.
Dependent Variables (Plant Growth Study)
Plant health and root spread are dependent on the function of the biowall plant life support
systems.
The aesthetic value of the plant trays is dependent on variety and organization of plants.
Dependent Variables (Irrigation Optimization)
Total water consumption of Biowall per watering cycle is dependent on irrigation duration
and irrigation apparatus size and configuration.
G.2 Independent Variables
The variables that are independent of the research reported in this thesis, for each experiment, are
listed below:
The installation of the Biowall was done within the constraints of the ReNEWW house and
completed prior to the beginning of this research. The Biowall prototype design,
fabrication, and positioning are independent of this research.

71
The ReNEWW House, its residents, the activities taking place, and weather changes
experienced during this research is independent of this research.
G.3 Confounding Variables
There are several variables that can be affected by multiple variables within the Biowall. The
confounding variables for each of the three experiments are discussed below.
Confounding Variables (Air Flow Analysis)
Air flow through the Biowall plant trays can be affected by: tray air seals, growth medium
depth, growth medium consistency, plant tray moisture content, and plant root density.
The discharge humidity and temperature can be affected by the zone temperature and
humidity, tray saturation, and the time of year.
Confounding Variables (Plant Growth Study)
Plant Health within the Biowall environment are affected by; the irrigation system; airflow
through plant trays; lighting; growth medium consistency; and growth medium nutrient
content.
Plant lighting resources per plant are dependent on plant orientation within the tray and/or
plant growth within the tray.
The growth medium can vary in constancy from nonuniform batch mixture or from
extended filtration periods in the Biowall.
Confounding Variables (Irrigation Optimization)
Water delivery volume per tray can be affected by the physical height of the tray and
operational condition of irrigation hoses.
Irrigation spread per plant tray can be affected by irrigation hose orientation and/or growth
medium consistency.

72
APPENDIX H. BIOWALL LED WIRING UPGRADE
Discussed in the initial field-testing period of the lighting system are areas where improvements
can be made. Identified were; heat being added to air passing through the trays by the LEDs, hand
soldered points creating hazards to the system, shading of the lighting by certain plants, and the
acknowledgment that LED technology could have advanced since the implementation of the initial
system.
Considering these results, a lighting upgrade added to the safety of the system and increased
available lighting for the plants.
The work completed removed the existing LED strips and sent them out to Inspired LED Phoenix
Arizona to be professionally soldered. This action removed the potential hazard of soldered wires
becoming loose, causing a short, or creating a hazard.

73
APPENDIX I. PLANTS AND EXCESSIVE AIR FLOW
Figure I.1 is a picture of the initial plant tray 3 after the Biowall fan was locked on for 14 days.
The plants in the figure show yellowing and stress; the effect of extended air flow through the
roots.
Figure I.1 A plant tray following 14 days of continuous air through the roots shows plants
deprived of moisture.

APPENDIX J. STATEMENT OF WORK
Prior to completing the research presented in this paper, the researcher created a high-level flow chart which served to guide the work through the various aspects of work.
Figure J. 1 Statement of work flowchart
74

APPENDIX K. RAW DATA
K 1Initial Air Velocity and Environment Measurements
75

K 2 Middle Air Velocity and Environment Measurements
76

K 3 Final Air Velocity Environment Measurements
77

78
5.5.2 K.4 Plant Measurements
Table K.1 Plant measurements (before).

79
Table K.2 Plant measurements (after).

80
Table K.3 Plant measurements (test trays).

81
Table K.4 Plant measurements reconciled.

82
K.5 The Average and Standard Deviation of all Plant Measurements
Table K.5 The average and standard deviation of all plant measurements.

83
K.6 Plant Tray Nutrient Measurements
Table K.6 Biowall plant tray nutrients.
Tray nutrient content recorded with Luster Leaf Products Inc. Soil Test Kit. Nitrogen,
Phosphorous, and Potassium were recorded with individual chemical tests from this kit. The
individual sample results provide a color which is comparted to a given 0-4 scale (0 depleted; 4
surplus) to indicate the elements level within the sample.

84
PUBLICATIONS

85

86

87

88

89

90

91

92

93