Embed Size (px)
Citation preview

The Biological Condition Gradient:
Advances in Science and A li tiApplicationin Region 1g
NWQMCDenver April 27, 2010
Susan P DaviesSusan P. Davies

What is “The” BCG?
There are many BCGsThere are many BCGs– Generalized conceptual model BCGs
Waterbody type specific BCGs– Waterbody-type specific BCGs– Assemblage-specific BCGs
Data calibration BCGs– Data-calibration BCGs– Stressor-Response curve BCGs
R h l BCG– Reach scale BCGs– Whole estuary BCGs


Overview of 10 AttributesOverview of 10 AttributesOverview of 10 AttributesOverview of 10 Attributes•• Taxonomic composition and toleranceTaxonomic composition and tolerance
•• Attributes IAttributes I VV•• Attributes IAttributes I--VV•• SensitiveSensitive--EndemicEndemic through through TolerantTolerant
•• NonNon--native taxanative taxa•• NonNon native taxanative taxa•• Attribute VIAttribute VI
•• Organism conditionOrganism condition•• Organism conditionOrganism condition•• Attribute VIIAttribute VII
•• Ecosystem functionEcosystem functionEcosystem functionEcosystem function•• Attribute VIIIAttribute VIII
•• PhysicalPhysical--biotic interactionsbiotic interactionsyy•• Attributes IXAttributes IX--XX

Biological Condition Gradient
11 dien
t Maine Algae BCG
2
1 Natural structural, functional, and taxonomic integrity is preserved.
Structure and function similar to natural community with some additional taxa & biomass; no or incidental anomalies; sensitive non-native taxa may be present; ecosystem level functions are fully maintained
1
Wetland BCG ition
Gra
d
pons
e
3
be present; ecosystem level functions are fully maintained
Evident changes in structure due to loss of some rare native taxa; shifts in relative abundance; ecosystem level functions fully maintained through redundant attributes of the system.G
radi
ent Wetland BCG
Bio
Con
di
cal R
esp
4 Moderate changes in structure due to replacement of sensitive ubiquitous taxa by more tolerant taxa; overall balanced distribution of all expected taxa; ecosystem functions largely maintained.C
ondi
tion
Stressor Gradient
dien
t OH Lrg river fish BCG
Bio
logi
c
5Sensitive taxa markedly diminished; conspicuously unbalanced distribution of major groups from that expected; organism
y g y
condition shows signs of physiological stress; ecosystem function shows reduced complexity and redundancy; increased build up or export of unused materials
Bio
C
ditio
n G
rad
B
Extreme changes in structure; wholesale changes in taxonomic composition; extreme alterations from normal densities; organism condition is often poor;
6
major groups from that expected; organism build up or export of unused materials.
anomalies may be frequent; ecosystem functions are extremely altered.
Stressor Gradient
Bio
Con
dLevel of StressorsLOW HIGHStressor Gradient

BCGs to Organize Complexity
• Generalized Conceptual Models– Northeastern temperate forested streams– Arid west streams– Wetland BCG– Large River BCGg– Whole Estuary and sub-habitat BCGs
• Account for all major assemblagesAccount for all major assemblages • Describe gradient at different scales
I l d t d di t• Includes stressor and response gradients

Data-driven BCGs for a LocaleF i th Y A i lFocus is on the Y-Axis only
and commonly only on Attributes II thru V• Purpose - fit real data to pre-established BCG
conceptual model– Examples:
Maine (4); NEWS (2); CT (1); PA (1?); NJ (1?); MN(1?); NAWQA EUSE data (Bayes Net model)NAWQA-EUSE data (Bayes-Net model)
– Usually operates at the reach or “sampling” scale– A specific model for a specific place, calibrated using
empirical data, expert judgment, and modeling– Assemblage-specific (macroinvertebrate; fish; algae)– Assemblage-specific (macroinvertebrate; fish; algae)– Waterbody-type specific (stream, river, wetland, estuary)

Examples from Region IExamples from Region I-States, EPA, and USGS
Advances in Science andManagement ApplicationsManagement Applications

New England Wadeable Streams d WSAand WSA
• EPA, 4 states,TetraTech, NEIWPCC , , ,• Calibrated a Regional Scale and State scale BCG
from probability-design data• Developed a BCG-based decision model• Analyzed X and Y axis data for evidence of Tier 1
itsites• Conducted a 6-way methods comparison study
(4 states+NEWS+WSA methods)(4 states+NEWS+WSA methods)• BCG-based site assessment results reported in
federal 305b reportsp
SUB-SESSION 9-2

New England Wadeable Streams and WSA Attribute assignments-empirical information and expert opinion
CT NMS
Stress
g p p p
Psephenus
2
LeastCandidateSlightModerateMetalsHeavy
Axi
s 2 Heavy
Severe
Axis 10.0 0.1 0.2 0.3 Stress LowHigh Axis 1
0.2
0.3Psephenus
Axis 1r = .401 tau = .421
Axis 2328 t 299
Stress LowHigh
0.0
0.1
r = -.328 tau = -.299
Gerritsen et al

New England Wadable Streams Methods Comparison
25
30
a
CTMENH
20
ibut
e 2&
3 Ta
x NHVTWSANEWSAVG
10
15
G_N
EWS
Attr
i
5# of
BC
G
00 5 10 15 20 25 30 35 40 45
Site
J Stamp, TetraTech
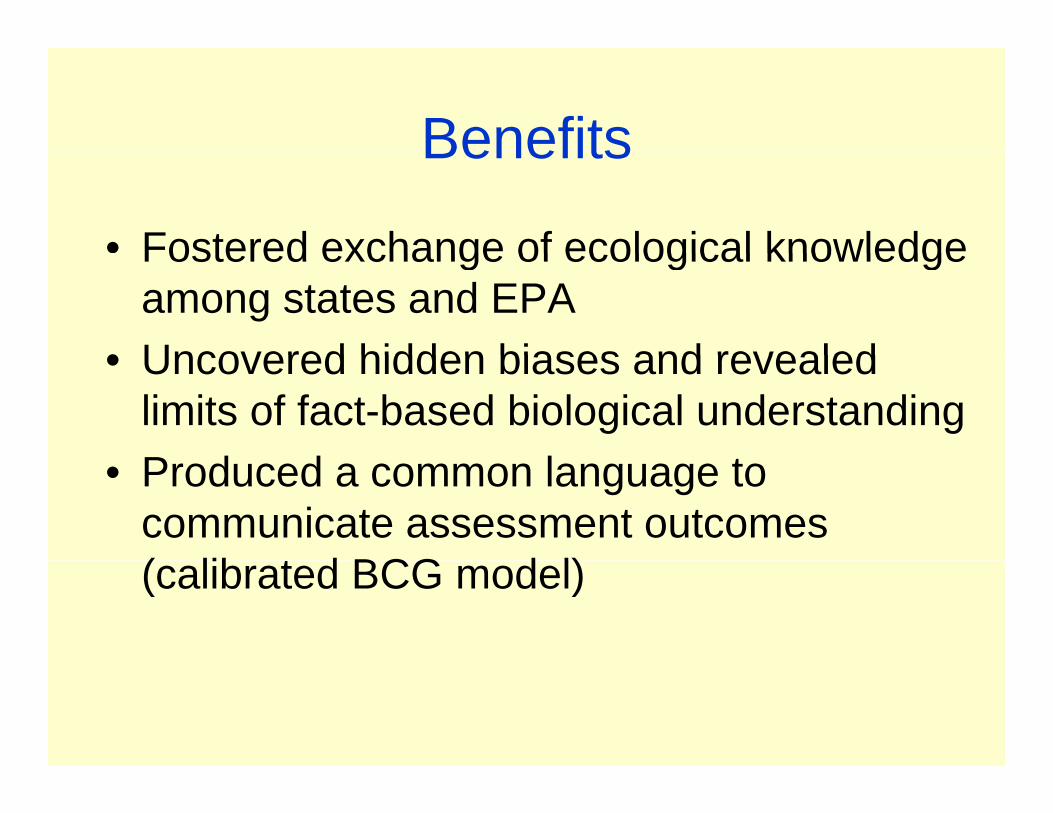
BenefitsBenefits
• Fostered exchange of ecological knowledgeFostered exchange of ecological knowledge among states and EPA
• Uncovered hidden biases and revealed• Uncovered hidden biases and revealed limits of fact-based biological understandingP d d l t• Produced a common language to communicate assessment outcomes ( lib t d BCG d l)(calibrated BCG model)

Estuary BCG:Region 1Region 1
At. Ecol. Div. and Off. Ecosyst. Protect. plus several national and state estuary programsplus several national and state estuary programs
P t li i d lib ti• Progress conceptualizing and calibrating a BCG for estuaries
“E-BCG”E-BCG
SUB-SESSION 9-2

What scale?
What biological indicators?
Consider Consider single habitat?habitat mosaic?
How to put it all together?
Scale and Potential Metrics Attribute and Description
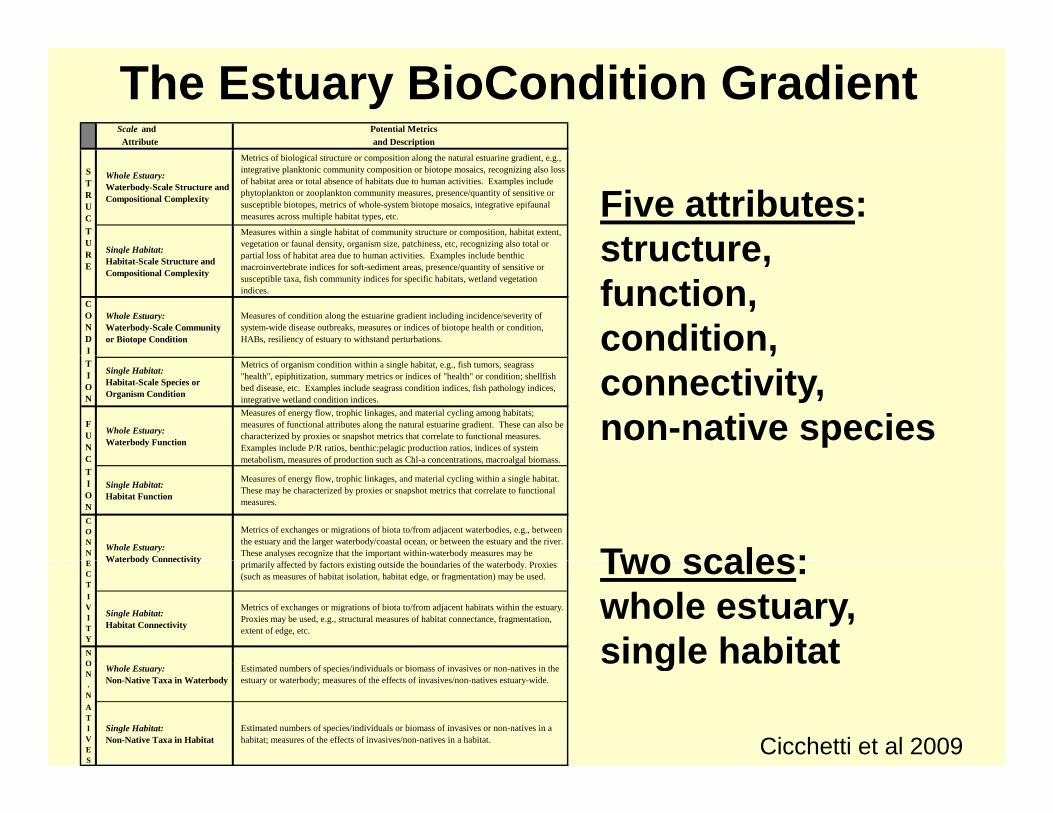
The Estuary BioCondition GradientS T R U C
Whole Estuary: Waterbody-Scale Structure and Compositional Complexity
Metrics of biological structure or composition along the natural estuarine gradient, e.g., integrative planktonic community composition or biotope mosaics, recognizing also loss of habitat area or total absence of habitats due to human activities. Examples include phytoplankton or zooplankton community measures, presence/quantity of sensitive or susceptible biotopes, metrics of whole-system biotope mosaics, integrative epifaunal measures across multiple habitat types, etc.
T U R Single Habitat:
Measures within a single habitat of community structure or composition, habitat extent, vegetation or faunal density, organism size, patchiness, etc, recognizing also total or
ti l l f h bit t d t h ti iti E l i l d b thi
Five attributes: structureR
E
gHabitat-Scale Structure and Compositional Complexity
partial loss of habitat area due to human activities. Examples include benthic macroinvertebrate indices for soft-sediment areas, presence/quantity of sensitive or susceptible taxa, fish community indices for specific habitats, wetland vegetation indices.
C O N D I
Whole Estuary: Waterbody-Scale Community or Biotope Condition
Measures of condition along the estuarine gradient including incidence/severity of system-wide disease outbreaks, measures or indices of biotope health or condition, HABs, resiliency of estuary to withstand perturbations.
structure, function, condition,
T I O N
Single Habitat: Habitat-Scale Species or Organism Condition
Metrics of organism condition within a single habitat, e.g., fish tumors, seagrass "health", epiphitization, summary metrics or indices of "health" or condition; shellfish bed disease, etc. Examples include seagrass condition indices, fish pathology indices, integrative wetland condition indices.
F U N C
Whole Estuary: Waterbody Function
Measures of energy flow, trophic linkages, and material cycling among habitats; measures of functional attributes along the natural estuarine gradient. These can also be characterized by proxies or snapshot metrics that correlate to functional measures. Examples include P/R ratios, benthic:pelagic production ratios, indices of system
t b li f d ti h Chl t ti l l bi
,connectivity, non-native species
C metabolism, measures of production such as Chl-a concentrations, macroalgal biomass.T I O N
Single Habitat: Habitat Function
Measures of energy flow, trophic linkages, and material cycling within a single habitat. These may be characterized by proxies or snapshot metrics that correlate to functional measures.
C O N N Whole Estuary:
Waterbody Connectivity
Metrics of exchanges or migrations of biota to/from adjacent waterbodies, e.g., between the estuary and the larger waterbody/coastal ocean, or between the estuary and the river. These analyses recognize that the important within-waterbody measures may be Two scales:E
C T
Waterbody Connectivity primarily affected by factors existing outside the boundaries of the waterbody. Proxies (such as measures of habitat isolation, habitat edge, or fragmentation) may be used.
I V I T Y
Single Habitat: Habitat Connectivity
Metrics of exchanges or migrations of biota to/from adjacent habitats within the estuary. Proxies may be used, e.g., structural measures of habitat connectance, fragmentation, extent of edge, etc.
N O
Two scales: whole estuary, single habitatO
N . N
Whole Estuary: Non-Native Taxa in Waterbody
Estimated numbers of species/individuals or biomass of invasives or non-natives in the estuary or waterbody; measures of the effects of invasives/non-natives estuary-wide.
A T I V E S
Single Habitat: Non-Native Taxa in Habitat
Estimated numbers of species/individuals or biomass of invasives or non-natives in a habitat; measures of the effects of invasives/non-natives in a habitat.
single habitat
Cicchetti et al 2009

BenefitsBenefits
• Advancing the ability to address issues of observational and management scale
• Addressing higher scale, “cross-cutting” BCG Attributes VIII (Function), IX (Scale) and X (Connectance)
• Explicitly incorporating habitat factors andExplicitly incorporating habitat factors and habitat-forming biota.

USGS-NAWQA and Duke University plus State and NGO partners p p
Effects of Urbanization on Stream Ecosystems (EUSE)
Bayesian Network BCG Model
SUB-SESSION 9-4

Bayes-Net Diagnostic probabilities
Kashuba

BenefitsBenefits
• Model can assist in diagnosis of causes of biological impairment
• Model can provide insight into the likely biological results of various BMP options
• Model ground-truths (and/or corrects) biologists’ expert opinionsbiologists expert opinions

Some State Examples

DanielsonDanielson--Maine Algae Monitoring Maine Algae Monitoring and and
DanielsonDanielson--Maine Algae Monitoring Maine Algae Monitoring and and
Nutrient Criteria GoalsNutrient Criteria GoalsNutrient Criteria GoalsNutrient Criteria Goals• Determine ecologically meaningful• Determine ecologically meaningful
tiered algal biocriteriaD t i l i ll i f l• Determine ecologically meaningful tiered nutrient criteria
• Develop a tiered decision framework that incorporates:– nutrient concentration limits– and ecological response variables
(aesthetics DO diurnal change etc)(aesthetics, DO- diurnal change, etc)
SUB-SESSION 9-3

BCG Integrates Multiple Assemblages BCG Integrates Multiple Assemblages and Waterbody Typesand Waterbody Types
BCG Integrates Multiple Assemblages BCG Integrates Multiple Assemblages and Waterbody Typesand Waterbody Typesy ypy ypy ypy yp
Wetland Bugs: Tier 2Wetland Bugs: Tier 2/3
Stream Bugs: Class B / Tier 3
Stream Algae: Tier 2/3Stream Algae: Tier 3
Stream Algae: Tier 4 Stream Bugs: Class B / Tier 3Stream Algae: Tier 3/4
Stream Bugs: Class B / Tier 3
Stream Bugs: Class B / Tier 3
Stream Bugs: Class B / Tier 3
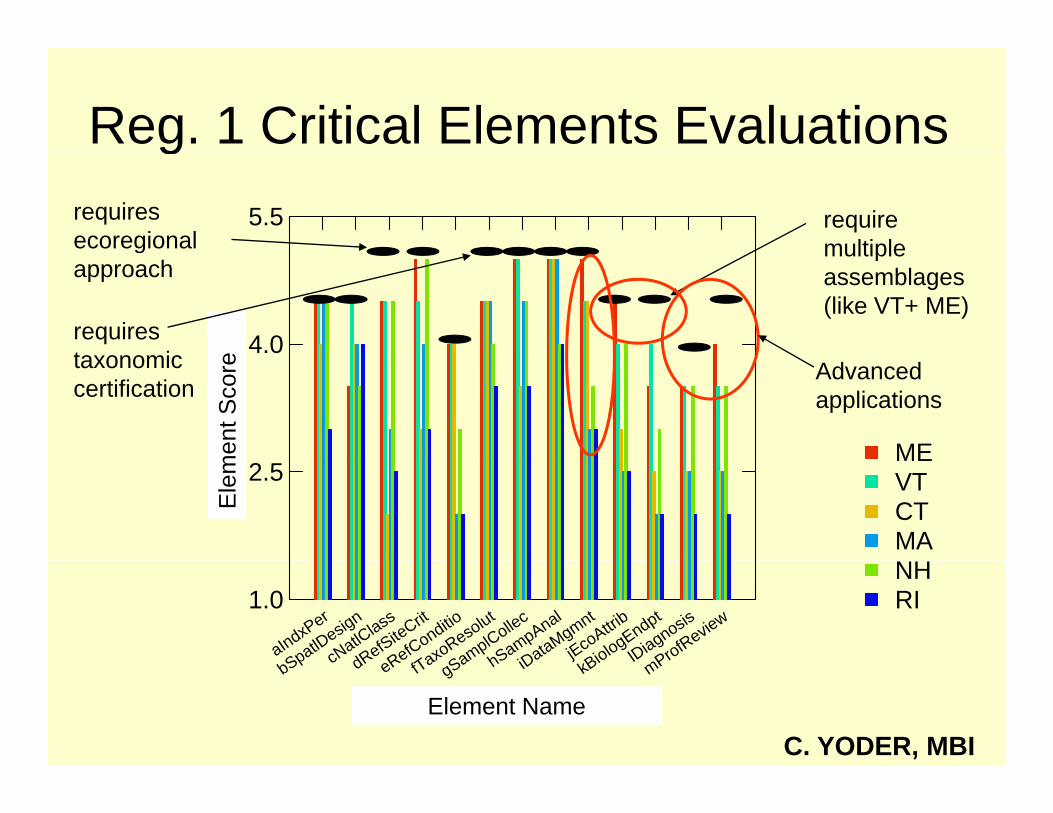
Reg. 1 Critical Elements Evaluations5.5
grequires ecoregional
require multiple
4.0eg
approach
requires ta onomic
multiple assemblages (like VT+ ME)
Val
ue
MEmen
t Sco
retaxonomic certification
Advanced applications
2.5
MACTVTME
Ele
m
aIndxPer
bSpatlDesig
n
cNatlC
lass
dRefSiteCrit
eRefConditio
fTaxoResolut
SamplCollec
hSampAnal
iDataMgmnt
jEcoAttrib
kBiologEndpt
lDiagnosis
mProfReview
1.0 RINH
bSp c dR eR fTagSa h iD kB mP
ELMNTNAMEElement Name
C. YODER, MBI

Defining Biocriteria Thresholds-Defining Biocriteria Thresholdspartnership of science and policy
a public policy taskRequires weighing socio-economic and environmental costs and benefitsRequires transparencyRequires public participation
a technical taskRequires knowledge of the strengths and limitations of the scienceRequires local knowledge of biological potential and reference
di iconditions
credible bioassessment programs make it possible

The Northeast Water Program M ’ TALU PilManagers’ TALU Pilot
• Program managers from sixProgram managers from six Region 1States, plus New York
• Sponsored by NE Interstate CommissionSponsored by NE Interstate Commission (NEIWPCC); supported by EPA
• A “learning pilot”A learning pilot • Engage water program managers in
benefits of incorporating biologicalbenefits of incorporating biological information in WQS, planning, and management g
SUB-SESSION 9-1

The Science behind Water Quality GoalsThe Science behind Water Quality GoalsSCIENCE GOALS
Class A/AA Class A/AA ““as naturally occurs”as naturally occurs”Biological Condition
Gradient
SCIENCE GOALS
Class B Class B “support all indigenous “support all indigenous
BCG Tier 1-2
ient
Gradient
species; no species; no detrimental change”detrimental change”
BCG Tier 2-3tion
Gra
di
Class CClass C “support indigenous “support indigenous fish (salmonids); maintain fish (salmonids); maintain
structure and function”structure and function”Bio
Con
di
structure and functionstructure and function
Water Quality Standards
BCG Tier 3-4
Stressor Gradient
B
Water Quality Standards Framework (ex: Maine)A Scientific Model


![Research Journal of Pharmaceutical, Biological and ...rjpbcs.com/pdf/2017_8(3)/[116].pdf · Research Journal of Pharmaceutical, Biological and Chemical ... production condition which](https://img.dokumen.tips/doc/110x75/5a7333487f8b9a9d538e6565/research-journal-of-pharmaceutical-biological-and-3116pdfaa-research.jpg)