Embed Size (px)
Citation preview

The Biochemical Changes in Patients with
Chronic Renal Failure
Khalidah S. Merzah University of Wasit/College of Medicine, Wasit, Iraq
Email: [email protected]
Suhad Falih Hasson Ministry of Health/Al-Zahraa Hospital, Wasit, Iraq
Email: [email protected]
Abstract—This study was conducted in AL-Zahraa general
hospital in Al-kut city/ Iraq. To assess serum urea,
creatinine, lipid profile (cholesterol, TG, DHL and LDL)
and thyroid hormones (FT3, FT4 and TSH) in chronic renal
failure (CRF) patients it included 50 patients, 29 were males
and 21 were females and their age range from 20 to 60 years.
The control groups were 30; who were free from signs and
symptoms of renal disease, lipid disorders, and thyroid
hormones disorders, 20 were males and 10 were females,
and their ages range from22 to 66 years. The study shows
that the Serum urea and creatinine concentrations in CRF
patients were found to be significantly high compared with
control group (P<0.001), Serum triglycerides concentrations
in CRF patients were found to be normal or no significantly
increase compared with control group (P> 0.05), Serum
cholesterol, HDL and LDL concentrations in CRF patients
were found to be no significantly lower compared with
control group, Serum FT3, FT4 and TSH concentrations in
CRF patients were found to be no significantly lower
compared with control group and No significant
relationship between lipid profiles concentrations changes
and thyroid hormones concentrations changes were found.
Index Terms—renal failure, lipid profiles, thyroid hormones
I. INTRODUCTION
Renal failure refers to a condition where the kidneys
lose their normal functionality, which may be due to
various factors including infections, auto immune
diseases, diabetes and other endocrine disorders, cancer,
and toxic chemicals. It is characterized by the reduction
in the excretory and regulatory functions of the kidney; it
is the ninth leading cause of death in United States as
well as most industrialized nation throughout the world
[1], [2].
Abnormalities in lipid metabolism and dyslipidemia
are known to contribute to glomerulo-sclerosis and are
common in renal disease [3]. In addition, post-transplant
dyslipidemias have been associated with an increased
risk of ischemic heart disease and have been shown to
increase risk of chronic rejection, altered graft function
and mortality [4].
Manuscript received January 20, 2015; revised March 25, 2015.
The impact of lipid abnormalities on renal function has
been evaluated in various studies [5]. In these studies,
unfavorable lipoprotein profiles interacted as risk factors
for progressive renal decline. Abnormal lipid profiles
start to appear soon after renal function begins to
deteriorate [6].
Thyroid hormones (TH) are necessary for growth and
development of the kidney and for the maintenance of
water and electrolyte homeostasis. On the other hand,
kidney is involved in the metabolism and elimination of
TH. From a clinical practice viewpoint, it should be
mentioned that both hypothyroidism and hyperthyroidism
are accompanied by remarkable alterations in the
metabolism of water and electrolyte, as well as in
cardiovascular function. All these effects generate
changes in water and electrolyte kidney management [7].
Moreover, the decline of kidney function is accompanied
by changes in the synthesis, secretion, metabolism, and
elimination of TH. Thyroid dysfunction acquires special
characteristics in those patients with advanced kidney
disease [8]. On the other hand, the different treatments
used in the management of patients with kidney and
thyroid diseases may be accompanied by changes or
adverse events that affect thyroid and kidney function
respectively.
TH plays an important role in growth, development,
and physiology of the kidney [9], [10]. It is known that
hypothyroidism reduces and hyperthyroidism increases
the kidney-to-body weight ratio by a not fully understood
mechanism [11]. On the other hand, children with
congenital hypothyroidism have an increased prevalence
of congenital renal anomalies. These findings support an
important role of TH during early embryogenesis [12].
Thyroid function also influences water and electrolyte
balance on different compartments of the body [13]. The
kidney also plays a role on the regulation of metabolism
and elimination of TH and is an important target organ
for TH actions [14]. The decrease in the activity of TH is
accompanied by an inability to excrete an oral water
overload [15]. This effect is not due to an incomplete
suppression of vasopressin production, or a decrease in
the reabsorptive ability in the dilutor segment of the
kidney tubule, but rather to a reduction in the glomerular
filtration rate (GFR) [16].
International Journal of Pharma Medicine and Biological Sciences Vol. 4, No. 1, January 2015
©2015 Int. J. Pharm. Med. Biol. Sci. 75

Thyroid dysfunction causes significant changes in
kidney function. Both hypothyroidism and
hyperthyroidism affect renal blood flow, GFR, tubular
function, electrolytes homeostasis, electrolyte pump
functions, and kidney structure [17].
Chronic renal failure is often associated with
dyslipoproteinemia, high levels of cholesterol and
triglycerides, as well as a decrease in the polyunsaturated
fatty acids. Each of these abnormalities has been
identified as an independent risk factor for
atherosclerosis [18]. Some of them persisting and
becoming worse during dialysis treatment [19]. On the
other hand, an increment of plasma homocysteine
concentration is highly prevalent among patients under
hemodialysis [20], [21], and it is considered an
independent risk factor for atherosclerotic complications
of end-stage renal disease [22].
The objective of this study is to find out the
biochemical changes (urea, creatinine, lipid profile,
thyroid hormones) in patients with chronic renal failure
and compare the obtained results with the results of
healthy individuals as control groups.
II. MATERIALS AND METHODS
The control groups consisted of 30 non-hospitalized
adults with no history of systemic disease (matched for
age and sex).
A total of 50 diagnosed adult chronic kidney failure
patients. The patient was diagnosed as renal failure for
both sexes based on the history, clinical examination and
taking renal function test. Subject was fasting 12-14 hr. at
the time of blood withdrawal. Their age range between
18-60 years where included in this study.
The chemicals and kits that were used in this study
were of the highest purity.
The determination of serum creatinine, urea, total
cholesterol, triglyceride, high density lipoprotein (HDL),
low density lipoprotein (LDL), free Triiodothyronine
(FT3), free Thyroxine (FT4) and serum Thyroid
stimulating hormone (TSH) concentration were
performed by approved methods.
A. Creatinine Assay
Creatinine is generated from creatine by nonenzymatic
dehydration. Creatinine is produced at a constant rate and
is excreted from the body through kidney glomerular
filtration. Decreased kidney function can affect the rate at
which creatinine is filtered by the kidneys and can be
used as a measure of kidney function. Decreased kidney
function can result in increased serum creatinine levels
due to the inability to clear creatinine through urine
excretion. Creatinine levels can be affected by changes in
muscle mass, pregnancy, or the use of angiotensin
inhibitors or angiotensin receptor antagonists.
In this assay, Creatinine concentration is determined by a
coupled enzyme reaction, which results in a colorimetric
(570 nm)/fluorometric (λex = 535/λem = 587 nm)
product, proportional to the creatinine present.
B. Urea Assay
Urea is the major end product of nitrogen metabolism
in most animals and is produced in a series of reactions in
the liver called the urea cycle. In the urea cycle, ammonia
is converted to urea, which is carried by blood to the
kidneys for elimination from the body. High levels of
urea in the blood may indicate renal failure. Urea levels
may also be elevated in response to treatment with
certain drugs such as corticosteroids or in response to
decreased kidney filtration due to dehydration or
congestive heart failure. Decreased blood urea levels can
occur in response to liver disease or malnutrition.
In this assay, Urea concentration is determined by a
coupled enzyme reaction, which results in a colorimetric
(570 nm) product, proportional to the Urea present.
C. Cholesterol Assay
Cholesterol is an important component of mammalian
cell membranes where it functions in intracellular
transport, cell signaling, and maintaining membrane
fluidity. Within the blood, cholesterol circulates as both
the free acid and as cholesterol esters. Controlling serum
cholesterol has an important therapeutic role as elevated
cholesterol levels are associated with the development of
atherosclerosis and cardiovascular pathologies. Recent
evidence suggests a disturbance of cholesterol
homeostasis contributes to the development of a chronic
inflammatory state.
Total cholesterol concentration is determined by a
coupled enzyme assay, which results in a colorimetric
(570 nm)/fluorometric (λex = 535/λem = 587 nm) product,
proportional to the cholesterol present. This kit is suitable
for use with cell and tissue culture samples, urine, plasma,
serum, and other biological samples.
D. Triglyceride Assay
The Serum Triglyceride Determination Kit can be used
for the measurement of glycerol, true triglycerides, or
total triglycerides in serum or plasma. The procedure
involves enzymatic hydrolysis by lipase of the
triglycerides to glycerol and free fatty acids. The glycerol
produced is then measured by coupled enzyme reactions.
Many of the triglyceride reagents which are
commercially available do not differentiate between
endogenous glycerol and glycerol derived by hydrolytic
action of lipase on glycerides.
E. HDL and LDL Assay
In the assay, cholesterol oxidase specifically
recognizes free cholesterol and produces products which
react with probe to generate color (570 nm) and
fluorescence (Ex/Em = 538/587 nm). Cholesterol esterase
hydrolizes cholesteryl ester into free cholesterol,
therefore, cholesterol ester and free cholesterol can be
detected separately in the presence and absence of
cholesterol esterase in the reactions.
F. FT3 Assay
The fT3 test is a solid phase competitive enzyme
immunoassay. Patient serum samples, standards, and T3-
Enzyme Conjugate Working Reagent are added to wells
coated with monoclonal T3 antibody. fT3 in the patient
International Journal of Pharma Medicine and Biological Sciences Vol. 4, No. 1, January 2015
©2015 Int. J. Pharm. Med. Biol. Sci. 76
specimen and the T3 labeled conjugate compete for
available binding sites on the antibody. After 60 minutes
incubation at room temperature, the wells are washed
with water to remove unbound T3 conjugate. A solution
of H2O2/TMB is then added and incubated for 20 minutes,
resulting in the development of blue color. The color
development is stopped with the addition of 3N HCl, and
the absorbance is measured spectrophotometrically at 450
nm. The intensity of the color formed is proportional to
the amount of enzyme present and is inversely related to
the amount of unlabeled fT3 in the sample.
G. FT4 Assay
The fT4 test is a solid phase competitive enzyme
immunoassay. Serum samples, standards, and Thyroxine-
Enzyme Conjugate Working Reagent are added to wells
coated with monoclonal T4 antibody. fT4 in the
specimen and the T4 labeled conjugate compete for
available binding sites on the antibody. After a 60
minutes incubation at room temperature, the wells are
washed with water to remove unbound T4 conjugate. A
solution of H2O2/TMB is then added and incubated for 20
minutes, resulting in the development of blue color. The
color development is stopped with the addition of 3N
HCl, and the absorbance is measured
spectrophotometrically at 450 nm. The intensity of the
color formed is proportional to the amount of enzyme
present and is inversely related to the amount of
unlabeled fT4 in the sample.
H. TSH Assay
TSH ELISA Test is based on the principle of a solid
phase enzyme-linked immunosorbent assay. The assay
system utilizes a unique monoclonal antibody directed
against a distinct antigenic determinant on the intact TSH
molecule. Mouse monoclonal anti-TSH antibody is used
for solid phase (microtiter wells) immobilization, and
goat anti-TSH antibody is used in the antibody-enzyme
(horseradish peroxidase) conjugate solution. The test
sample is allowed to react simultaneously with the
antibodies, resulting in the TSH molecule being
sandwiched between the solid phase and enzyme-linked
antibodies. After a 2 hour incubation at room temperature
with shaking, the solid phase is washed with distilled
water to remove unbound labeled antibodies. A solution
of tetramethylbenzidine (TMB) is added and incubated
for 20 minutes, resulting in the development of a blue
color. The color development is stopped with the addition
of 1N HCl, and the resulting yellow color is measured
spectrophotometrically at 450 nm. The concentration of
TSH is directly proportional to the color intensity of the
test sample.
III. RESULTS AND DISCUSSION
The levels of urea, creatinine, triglyceride (TG), total
cholesterol (TC), high density lipoprotein – cholesterol
(HDL-C), low density lipoprotein- cholesterol (LDL-C)
and very low density lipoprotein –cholesterol (VLDL-L)
were estimated using enzymatic methods.
The level of FT3, FT4 and TSH were estimated by
using ELISA method.
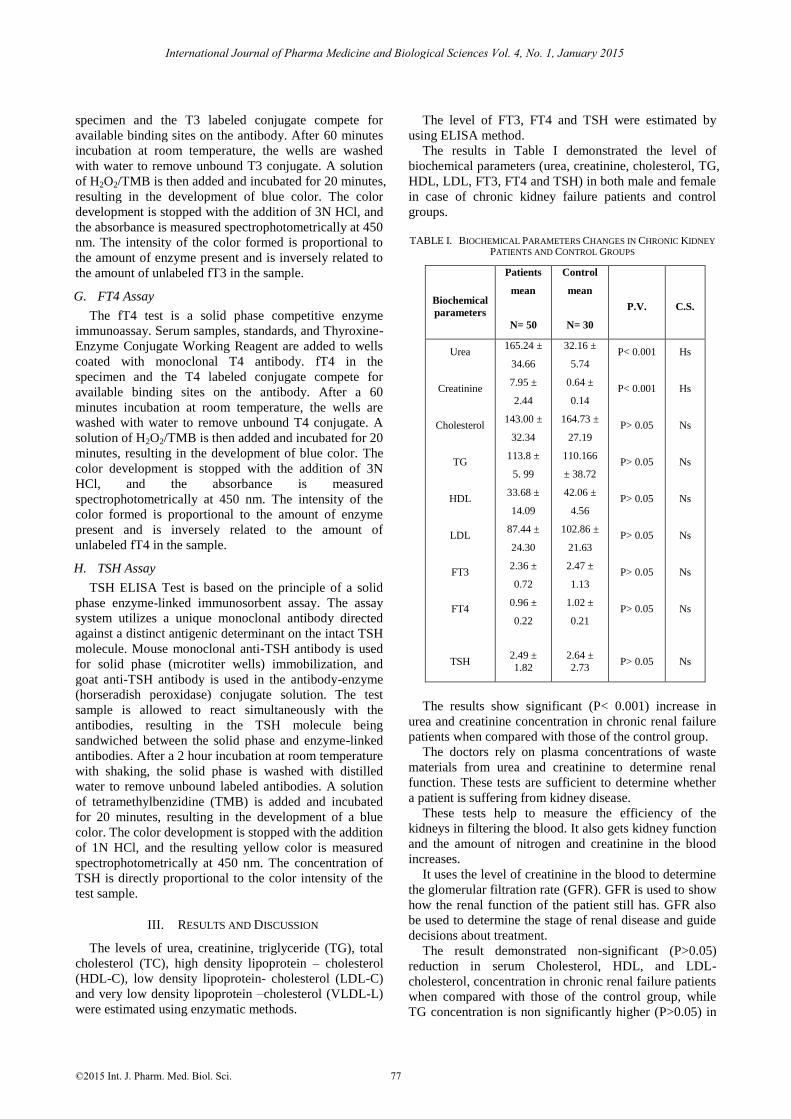
The results in Table I demonstrated the level of
biochemical parameters (urea, creatinine, cholesterol, TG,
HDL, LDL, FT3, FT4 and TSH) in both male and female
in case of chronic kidney failure patients and control
groups.
TABLE I. BIOCHEMICAL PARAMETERS CHANGES IN CHRONIC KIDNEY
PATIENTS AND CONTROL GROUPS
Biochemical
parameters
Patients
mean
N= 50
Control
mean
N= 30
P.V. C.S.
Urea
Creatinine
Cholesterol
TG
HDL
LDL
FT3
FT4
TSH
165.24 ±
34.66
7.95 ±
2.44
143.00 ±
32.34
113.8 ±
5. 99
33.68 ±
14.09
87.44 ±
24.30
2.36 ±
0.72
0.96 ±
0.22
2.49 ±
1.82
32.16 ±
5.74
0.64 ±
0.14
164.73 ±
27.19
110.166
± 38.72
42.06 ±
4.56
102.86 ±
21.63
2.47 ±
1.13
1.02 ±
0.21
2.64 ±
2.73
P< 0.001
P< 0.001
P> 0.05
P> 0.05
P> 0.05
P> 0.05
P> 0.05
P> 0.05
P> 0.05
Hs
Hs
Ns
Ns
Ns
Ns
Ns
Ns
Ns
The results show significant (P< 0.001) increase in
urea and creatinine concentration in chronic renal failure
patients when compared with those of the control group.
The doctors rely on plasma concentrations of waste
materials from urea and creatinine to determine renal
function. These tests are sufficient to determine whether
a patient is suffering from kidney disease.
These tests help to measure the efficiency of the
kidneys in filtering the blood. It also gets kidney function
and the amount of nitrogen and creatinine in the blood
increases.
It uses the level of creatinine in the blood to determine
the glomerular filtration rate (GFR). GFR is used to show
how the renal function of the patient still has. GFR also
be used to determine the stage of renal disease and guide
decisions about treatment.
The result demonstrated non-significant (P>0.05)
reduction in serum Cholesterol, HDL, and LDL-
cholesterol, concentration in chronic renal failure patients
when compared with those of the control group, while
TG concentration is non significantly higher (P>0.05) in
International Journal of Pharma Medicine and Biological Sciences Vol. 4, No. 1, January 2015
©2015 Int. J. Pharm. Med. Biol. Sci. 77

chronic renal failure patients when compared with those
of the control group.
On using correlation analysis we found that there is no
significant (P>0.05) relationship between the
concentrations of lipid profiles and the concentrations of
thyroid hormones.
Among the various parameters tested triglyceride was
not significantly higher in CRF patients as compared to
controls (p>0.05). HDL levels were no significantly
lower in CRF patients as compared to control (p>0.05).
There was no significant change (p>0.05) observed in
total cholesterol and LDL levels in between healthy
controls and CRF patients. This study demonstrated that
CRF patients with and without hemodialysis are at
greater risk of development of dyslipidemias,
characterized by hypertriglyceridemia, elevated levels
and decreased HDL levels. Total cholesterol and LDL
cholesterol levels remain normal or decreased in these
patients. Both male and female patients of CRF with and
without hemodialysis have dyslipidemias without any
discrimination of sex and it is not attenuated by the
hemodialysis process.
Serum TSH concentrations are usually normal or
elevated in chronic kidney disease (CKD), but its
response to its releasing hormone (TRH) is generally low.
These findings suggest the presence of intrathyroidal and
pituitary disturbances associated with uremia [23]. Also,
both TSH circadian rhythms as TSH glycosylation are
altered in CKD. The latter may compromise TSH
bioactivity.
Free and total T3 and T4 concentrations are usually
normal or low in patients with CKD [24]. The reduction
in T3 levels (low T3 syndrome) is the most frequently
thyroid alteration observed in these patients [25]. This
reduction in T3 concentrations has been linked to a
decrease in the peripheral synthesis of T3 from T4.
Chronic metabolic acidosis associated with the CKD may
contribute in this effect. Although free and total T4
concentrations may be normal or slightly reduced,
sometimes free T4 may be high due to the effect of
heparin used in anticoagulation during hemodialysis
(HD), which inhibits T4 binding to its binding proteins
[26].
A relationship between T3 levels and mortality has
been proven in uraemic patients; however, the
relationship between TSH and survival, well established
in other population groups, has not been reported in
patients with different degrees of kidney insufficiency.
Further investigation in this field will provide new
insights in our understanding of the biological
significance of thyroid hormone changes in patients with
kidney disease.
REFERENCES
[1] T. W. Meyer and T. Hostetter, “Uremia. N Eng l,” J. Med., vol. 357, no. 13, pp. 1316, 2007.
[2] E. Arias, R. Anderson, H. Kung, S. L. Murphy, and K. D.
Kochanek, “Final data for 2001,” Natl. Vital Stat. Rep, vol. 52, no. 3, pp. 1-115, 2003.
[3] C. Wanner and T. Quaschning, “Dyslipideamia and renal disease, pathogenesis and clinical consequences,” Curr. Opin. Nephrol.
Hyprtens, vol. 10, pp. 195-201, 2001.
[4] C. Wanner, T. Quaschning, and K. Weingarnter, “Impact of dyslipideamia in renal transplant recipients,” Curr. Opin. Urol.,
vol. 10, pp. 77-80, 2000.
[5] E. S. Schaeffner, T. Kurth, G. C. Curhan, et al., “Cholesterol and the risk of renal dysfunction in apparently healthy men,” J. Am.
Soc. Nephrol., vol. 14, pp. 2084-2091, 2003.
[6] D. S. Freedman, J. D. Otvos, E. J. Jeyarajah, J. J. Barboriak, A. J. Anderson, and J. A. Walker, “Relation of lipoprotein subclasses as
measured by proton nuclear magnetic resonance spectroscopy to
coronary artery disease,” Thromb. Vasc. Biol., vol. 18, pp. 1046-1053, 1998.
[7] D. S. Katz, A. I. Emmanouel, and M. D. Lindheimer, “Thyroid
hormone and the kidney,” Nephron, vol. 15, pp. 223-249, 1975. [8] J. Gattineni, D. Sas, Dagan, and M. G. Baum, “Effect of thyroid
hormone on the postnatal renal expression of NHE8,” American
Journal of Physiology, Renal Physiology, vol. 294, pp. 198-204,
2008.
[9] N. Li Bok, F. Fekete and L. Harsing, “Renal structural and
functional changes and sodium balance in hypothyroid rats,” Acta Medica Academiae Scientiarum Hungaricae, vol. 39, pp. 219-225,
1982.
[10] S. Katyare, H. Modi, S. P. Patel, and M. A. Patel, “Thyroid hormoneinduced alterations in membrane structure-function
relationships, studies on kinetic properties of rat kidney
microsomal Na(C), K (C)-ATPase and lipid/phospholipid profiles,” Journal of Membrane Biology, vol. 219, pp. 71-81, 2007.
[11] F. Vargas, J. Moreno, I. Rodrı´guez-Gomez, and J. Garcı´a-Estan,
“Vascular and renal function in experimental thyroid disorders,” European Journal of Endocrinology, vol. 154, pp. 197-212, 2006.
[12] J. Kumar, R. Gordillo, and R. Woroniecki, “Increased prevalence
of renal and urinary tract anomalies in children with congenital hypothyroidism,” Journal of Pediatrics, vol. 154, pp. 263-266,
2009.
[13] G. Capasso, G. De Tommaso, A. Pica, and N. G. De Santo, “Effects of thyroid hormones on heart and kidney functions,”
Mineral and Electrolyte Metabolism, vol. 25, pp. 56-64, 1999.
[14] J. G. Den Hollander, R. W. Wulkan, M. J. Mantel, and A.
Berghout, “Correlation between severity of thyroid dysfunction
and renal function,” Clinical Endocrinology, vol. 62, pp. 423-427, 2005.
[15] X. M. Liu, Y. Bai, and Z. S. Guo, “Study on urinary function and
metabolism of water and electrolytes in primary hypothyroidism,” Zhonghua Nei Ke Za Zhi, vol. 29, pp. 299-302, 1990.
[16] D. S. Emmanouel, M. D. Lindheimer, and A. L. Katz,
“Mechanism of impaired water excretion in the hypothyroid rat,” Journal of Clinical Investigation, vol. 54, pp. 926-934, 1974.
[17] T. Roberto, R. Alessandro, and L. Giuseppe, “Lipids and Renal
Disease,” Journal of the American Society of Nephrology, 2011. [18] J. E. Hokanson and M. A. Austin, “Plasma triglyceride level is a
risk factor for cardiovascular disease independent of high-density
lipoprotein cholesterol level: A meta-analysis of populationbased prospective studies,” J. Cardiovascular Risk, vol. 3, pp. 213-219,
1996.
[19] I. N. Gomez Dumm, A. M. Giammona, L. A. Touceda, and C. Raimondi, “Lipid abnormalities in chronic renal failure patients
undergoing hemodialysis,” Medicina, vol. 61, pp. 1, pp. 42-146,
2001. [20] A. G. Bostom, D. Shemin, P. Verhoef, M. R. Nadeau, P. F.
Jacques, and I. H. Rosenberg, “Elevated fasting total plasma
homocysteine levels and cardiovascular disease outcomes in maintenance dialysis patients. A prospective study,” Arterioescler.
Throm. Vasc. Biol., vol. 11, pp. 2554-2558, 1997.
[21] G. J. Hankey and J. W. Eikelboom, “Homocysteine and vascular disease,” Lancet, vol. 354, pp. 407-413, 1994.
[22] K. Robinson, A. Gupta, V. Dennis, K. Arheart, D. Chaudhary, R.
Green, et al., “Hyperhomocysteinemia confers an independent increased risk of atherosclerosis in end-stage renal disease and is
closely linked to plasma folate and pyridoxine concentration,”
Circulation, vol. 94, pp. 2742-2748, 1996. [23] E. M. Kaptein, “Thyroid hormone metabolism and thyroid
diseases in chronic renal failure,” Endocrine Reviews, vol. 17, pp.
45-63, 1996.
International Journal of Pharma Medicine and Biological Sciences Vol. 4, No. 1, January 2015
©2015 Int. J. Pharm. Med. Biol. Sci. 78

[24] A. P. Weetman, D. R. Weightman, and M. F. Scanlon, “Impaired dopaminergic control of thyroid stimulating hormone secretion in
chronic renal failure,” Clinical Endocrinology (Oxford), vol. 15,
pp. 451-456, 1981. [25] O. Witzke, J. Wiemann, D. Patschan, T. Philipp, B. Saller, et al.,
“Differential T4 degradation pathways in young patients with
preterminal and terminal renal failure,” Horm Metab Res, vol. 39, no. 5, pp. 355-358, 2007.
[26] D. S. Silverberg, R. A. Ulan, D. M. Fawcett, J. B. Dossetor, M.
Grace, and K. Bettcher, “Effects of chronic hemodialysis on thyroid function in chronic renal failure,” Canadian Medical
Association Journal, vol. 109, pp. 282-286, 1973.
Khalidah S. Merzah was born in Baghdad,
Iraq in 1962. She got B.Sc. (chemistry) in College of Science, University of Baghdad
(1984); M.Sc. (Biochemistry) / University of
Technology (2003); Ph.D. (clinical
biochemistry) / Collage of Science for
Women, University of Baghdad (2009). In
1985-2003, she worked in Iraqi Atomic Energy Commission/ Radiopharmaceutical
Department. In 2003-2010, she worked in
Ministry of Science and Technology / Pharmaceutical Department. From 2010 till
now, she is working in Ministry of higher education and scientific research, University of Wassit, College of Medicine.
She is a Member of International Society for Applied Life Sciences
(ISALS), member of Asia-Pacific Chemical, Biological& Environmental Engineering Society APCBEES, Member of Royal
Society of Chemistry 2014, member of the Organization for Women in
Science for the Developing World. She was a fellow for the 2014 Iraq Science Fellowship Program (ISFP IV)/Georgia state university/USA.
Suhad F. Hasson was born in Wasit, Iraq
in 1968. She got her B.Sc. from the College
of Science, University of Baghdad (1990); M.Sc. Clin. Biochem. from College of
Science, University of Baghdad(2000),
Ph.D. Clin. Biochem. from University of Baghdad, College of Science, (2007). In
1992-2015, she worked in Ministry of
Health/Directorate Wasit Health / Clin. Lab.
Department. She is responsible for clinical
biochemistry & hormone unit in Al-Zahraa
Teaching Hospital. She is a director for Clinical Laboratory Department in Alzahraa Teaching Hospital. She is
responsible for quality control in clinical biochemistry in Directorate
Wasit Health and is a consulting committee in Ministry of Health.
International Journal of Pharma Medicine and Biological Sciences Vol. 4, No. 1, January 2015
©2015 Int. J. Pharm. Med. Biol. Sci. 79