Embed Size (px)
DESCRIPTION
GILLIAN GRUEN, CHRISTOPH A. HEINRICH AND KIM SCHROEDERCopper, gold, and molybdenum in the Bingham Canyon deposit (Utah, United States) show a systematic distributionin grade and metal ratios. Most Cu-Au mineralization follows, both spatially and temporally, theemplacement of the quartz monzonite porphyry (QMP), a southwest-northeast−elongated thick dike intrudingalong the contact between the premineralization equigranular monzonite stock and surrounding sedimentaryrocks. Copper ore grades define the shape of an inverted cup, which is centered on the QMP but has a muchbroader, near-circular footprint. Several deep root zones surround a barren core occupied by the same lithologicunits and intense potassic alteration but insignificant metal tenor. Throughout the deposit, gold to copperratio is systematically zoned. The distribution of molybdenum resembles that of copper and partly overlapswith it, but the molybdenum ore shell is generally displaced inward and downward from the copper ore shell.Economic Geology, v. 105, pp. 69–90 2010
Citation preview

0361-0128/10/3865/69-22 69
IntroductionPORPHYRY-STYLE and epithermal Cu-Mo-Au-Ag ore deposits arecontrolled by tectonic processes operating at variable scales,from the convergence of lithospheric plates to the formation ofindividual ore veins (Sawkins, 1990; Sillitoe, 2010). Ore-form-ing hydrothermal processes operate in the upper 10 km ofcrust, at the interface between the shallow ground-water envi-ronment and a hydrous magma regime extending to mantledepths (Sillitoe, 1972; Beane and Titley, 1981; Richards, 2003;Seedorff et al., 2005; Williams-Jones and Heinrich, 2005).
The deep magmatic regime acts as a source of heat, magmaticvolatiles, and ore-forming components. Exposed lower- to mid-crustal magma chambers in arc settings are horizontally layeredand have sill-like shapes (e.g., Jagoutz et al., 2007). Horizontal
compression of the lithosphere facilitates magma storage andhigh-pressure differentiation toward volatile-rich magmas(Tosdal and Richards, 2001; Annen and Sparks, 2002; Richards,2003; Rohrlach et al., 2003; Rohrlach and Loucks, 2005). Acompressive regime in the upper crust prevents magma cham-bers from erupting through volcanoes. Instead, it favors fo-cused loss of volatiles through hydraulically fractured porphyrystocks in the roof of the intrusions (Burnham, 1979; Dilles,1987; Richards, 2003; Rohrlach and Loucks, 2005; Sillitoe andPerello, 2005). Fluids exsolve from magma chambers under near-lithostatic pressure (Burnham and Ohmoto, 1980; Fournier,1999), as required to openflat veins in deep mag-matic-hydrothermal de-posits like Panas queira(Kelly and Rye, 1979).
The Bingham Canyon Porphyry Cu-Mo-Au Deposit. II. Vein Geometry and Ore Shell Formation by Pressure-Driven Rock Extension
GILLIAN GRUEN,1,† CHRISTOPH A. HEINRICH,2 AND KIM SCHROEDER3
1 Department of Earth Sciences, ETH Zurich, 8092 Zurich, Switzerland2 Department of Earth Sciences, ETH Zurich, 8092 Zurich, Switzerland, and
Faculty of Mathematics and Natural Sciences, University of Zurich3 Kennecott Utah Copper, Rio Tinto, Magna, Utah 84044
AbstractCopper, gold, and molybdenum in the Bingham Canyon deposit (Utah, United States) show a systematic dis-
tribution in grade and metal ratios. Most Cu-Au mineralization follows, both spatially and temporally, the emplacement of the quartz monzonite porphyry (QMP), a southwest-northeast−elongated thick dike intrudingalong the contact between the premineralization equigranular monzonite stock and surrounding sedimentaryrocks. Copper ore grades define the shape of an inverted cup, which is centered on the QMP but has a muchbroader, near-circular footprint. Several deep root zones surround a barren core occupied by the same litho-logic units and intense potassic alteration but insignificant metal tenor. Throughout the deposit, gold to copperratio is systematically zoned. The distribution of molybdenum resembles that of copper and partly overlapswith it, but the molybdenum ore shell is generally displaced inward and downward from the copper ore shell.
Systematic measurement of the abundance and orientation of three major vein types obtained at the pit sur-face were complemented with unoriented vein density data from drill core logging. Quartz stockwork veins,the earliest and most abundant of the mapped vein types, are related to potassic alteration and major Cu-Aumineralization. Their greatest vein density follows the intrusion of the QMP but extends far beyond, into sed-imentary rocks and especially into adjacent parts of the pre-ore equigranular monzonite. Their orientation ispredominantly steep, with a variable strike. Quartz-molybdenite veins postdate all intrusions and are less abun-dant than quartz stockwork veins. They show variable orientation of strikes and a weaker tendency to steepdips. Quartz-pyrite veins with sericitic alteration halos crosscut all intrusions and earlier veins. They are rarewithin the central high-grade part of the deposit and predominantly occur near and outside the northeasternand southwestern ends of the QMP. They have a strongly preferred orientation parallel to the porphyry dikes,with steep dips and strike directions fanning out radially from the center of the deposit.
Repeated cycles of dike intrusions with distinct southwest-northeast orientation, followed by steep stockworkveins with variable strikes distributed over the broad ore shell and a final return to oriented postore veins areinterpreted to result from alternation between two stress regimes. A regional, probably weakly transtensionalregime controls the emplacement of dikes and postore veins. Ore vein formation and mineralization is con-trolled by active rock extension (increase in differential stress) in the roof area above a broad region of highfluid pressure in a subjacent magma chamber, rather than by local hydrofracturing caused by fluid exsolutionfrom the porphyries (decrease in effective rock pressure and positive volume change upon magma crystalliza-tion). Shallow vein mineralization well above the lithostatic-to-hydrostatic transition is consistent with low (hydrostatic or even vapor-static) pressures of ore deposition indicated by a companion study of fluid inclusions.The process of pressure-driven roof extension favors the accumulation of metals in high-grade ore shells, com-pared to temperature-driven concepts according to which the porphyry mineralization is spread out verticallyby following downward-retracting isotherms in a cooling magmatic-hydrothermal system.
† Corresponding author: e-mail, [email protected]
©2010 Society of Economic Geologists, Inc.Economic Geology, v. 105, pp. 69–90
Submitted: May 13, 2009Accepted: December 21, 2009
Acronyms Used in this Paper
LP = latite porphyryQLP = quartz latite porphyryQMP = quartz monzonite porphyry

By contrast, structures in the depositional regime of por-phyry-style and epithermal ore deposits are typically steep,with subvertical intrusive contacts of porphyry stocks anddikes (e.g., Seedorff et al., 2005; Sillitoe, 2010), radial or con-centric veins in porphyry copper deposits (Heidrick and Titley, 1982), and large subvertical veins in epithermal ore de-posits and active geothermal systems (Berger and Bethke,1985; Simmons et al., 2005). Porphyries with mineralizedvein stockworks are commonly emplaced at sites wheretranstensional deformation produces vertical extensional vol-umes such as fault jogs channeling the ascent of magma andfluids (Titley, 1982; Fournier, 1999; Tosdal and Richards,2001; Cannell et al., 2005; Sillitoe and Perello, 2005).
The transition from predominantly flat to predominantlysteep structures reflects a vertical transition in the state of dif-ferential rock stress and fluid pressure (Fournier, 1999; Cox,in press). Several structural studies of porphyry vein networkshave documented and discussed the nature of this transition(Beane and Titley, 1981; Heidrick and Titley, 1982; Titley,2001). Recent geodetic data provide additional insights intothe mechanisms of magma emplacement and fluid expulsioninto upper-crustal hydrothermal systems, emphasizing verti-cal uplift and radial extension (Bonafede, 1991; Todesco et al.,2004; Hurwitz et al., 2007; Bodnar et al., 2007; Dzurisin et al.,2009; Hutnak et al., 2009; Lima et al., 2009).
Bingham Canyon near Salt Lake City (Utah, United States)is a giant porphyry Cu-Mo-Au deposit exhibiting clear geo-metric relationships between intrusions, different vein gener-ations, and a regular distribution of Cu, Au, and Mo in azoned ore shell, which is exposed over 2.3 km of vertical ex-tent thanks to 100 years of open-pit mining and deep dia-mond drilling. Building on the detailed geologic relationshipsshown in the preceding article (Redmond and Einaudi,2010), this paper presents the three-dimensional distributionof ore metals in relationship to fracture density and orienta-tions of the evolving vein network. Our analysis aims at un-derstanding the physical evolution of vein opening and fo-cused fluid flow, in an attempt to relate the emplacement ofintrusions and veins to the interplay between far-field crustalstress of the region and the more localized stress and fluidpressure distribution caused by the underlying magmatic in-trusion. These observations will be combined with a fluid in-clusion study in the third companion paper, to explain the ori-gin of the zoned Bingham ore shell as the product of anupward-expanding vapor plume above the lithostatic-to-hy-drostatic transition (companion paper by Landtwing et al.,2010).
Tectonic Evolution, Deposit-Scale Geology, and Structures
The Bingham Canyon mining district (~112°09'W/40° 30'N)near Salt Lake City, Utah, is located at the eastern edge of theBasin and Range province, far inland from the former sub-duction zone during the Eocene (Fig. 1A). The magmatic- hydrothermal complex is located near the southern cratonicmargin of the Wyoming province (Karlstrom et al., 2005) andextends along the east-west−oriented Uinta Axis, a basementuplift that probably coincides with a former intracontinentalrift basin filled with Precambrian sedimentary rocks (Sears etal., 1982). The giant porphyry Cu-Mo-Au orebody, surrounded
by a district of smaller Cu-Au skarns and polymetallic veinand replacement deposits, is controlled by structural ele-ments dating back to the Precambrian (Sears et al., 1982;Bryant, 1988; Bryant and Nichols, 1988; Presnell, 1998).
Precambrian to Mesozoic tectonism
Sedimentary rocks in the mine area consist of quartzite andlesser limestone, calcareous siltstone, and sandstone of thePennsylvanian Oquirrh Group (Tooker et al., 1970; Swensen,1975). Carbonate rocks of the Bingham Mine Formation hostCu-Au skarns and a halo of Pb-Zn-Ag fissure and replacementdeposits such as the Lark mine east of the Bingham Canyonintrusions (Fig. 1B). About 8 km north of the BinghamCanyon mine, beyond the Pb-Zn halo but still within the outerAu-As limit, dolomitic and calcareous units host the Carlin-type gold deposits at Barneys Canyon and Melco (Cunning-ham et al., 2004; Fig. 1B). Prior to Eocene magmatism, themid Jurassic Elko orogeny and the Late Cretaceous Sevierorogeny have affected the region (Presnell, 1992; Babcock etal., 1995; Presnell and Parry, 1995). These compressional pe-riods formed two major fold sets including the Copperton an-ticline (Fig. 1B) and the northwest-trending, overturnedApex and Rood folds (Fig. 2). These folds are separated bythe southwest-dipping Midas thrust, which resulted fromeastward compression during the Sevier orogeny (Fig. 1B).
Eocene magmatism
Igneous activity along the Uinta axis (Fig. 1A) started at atime when tectonic activity in western North America wasgenerally shifting eastward due to low-angle subduction(English and Johnston, 2004). Minor Eocene extension wasfollowed by an intense period of Eocene intrusive and vol-canic activity (Presnell, 1992, 1998), forming the west-trend-ing Wasatch igneous belt extending from the Park City min-eral district (John, 1998) through the more deeply exposedAlta stock (Cook and Bowman, 2000), across the laterWasatch fault into the Oquirrh Mountains (Fig. 1A). A posi-tive aeromagnetic anomaly indicates a large west-trendingbatholith underlying the entire Uinta axis, including the Bing-ham Canyon magmatic complex (Waite et al., 1998).
The Bingham Canyon magmatic complex comprises at leastfive phases of petrographically distinct intrusions (Redmondand Einaudi, 2010; Fig. 2). The equigranular monzonite pre-dates all hydrothermal mineralization and include the largeLast Chance stock (unaltered and occurring immediatelysouth of the Bingham Canyon mine) and the Bingham Stock(occupying most of the open pit; Babcock et al., 1995). De-spite its geometric complexity, the equigranular monzonite isapproximately equidimensional in outcrop area and has steepwalls, based on drilling and unpublished geophysical dataprocessing (I. Steinberger, pers. commun.). The quartz mon-zonite porphyry (QMP) forms a northeast-striking, approxi-mately 60° northwest-dipping, up to 500-m-thick dikelikebody that intruded along the northwestern contact betweenthe Bingham stock and sedimentary country rocks (Redmondand Einaudi, 2010, fig. 1). This porphyry is spatially and tem-porally related to most of the quartz stockwork veins, potassicalteration, and Cu-Au mineralization (John, 1978; Lanier etal., 1978; Warnaars et al., 1978; Redmond et al., 2002, 2004).Early studies (e.g., Boutwell et al., 1905) indicate that
70 GRUEN ET AL.
0361-0128/98/000/000-00 $6.00 70

equigranular monzonite and QMP both cropped out at thepremine surface, but there are no data to indicate whetherthe QMP extended to the paleosurface or closed just abovethe known Cu-Au orebody (K. Krahulec, pers. commun.,2006). Successively thinner dikes of latite porphyry (LP, up to30 m thick), quartz latite porphyry (QLP) and minor diketypes (Redmond and Einaudi, 2010) generally have steeplydipping (60°−75°) contacts. They strike northeast through thecenter of the Bingham stock with a lateral extent over 8 km.
Some of the magmas vented to the surface, forming a com-posite volcano which is partly preserved on the eastern flankof the Oquirrh Mountains (Waite et al., 1998; Maughan et al.,2002; Fig. 1A). Latite lavas and volcanoclastic rocks here dipeastward under Late Tertiary and Quaternary cover of theSalt Lake basin. The volcanic sequence is at least 1 km thickand dominantly composed of porphyritic flow-layered an-desite and dacite lavas, minor ash-flow tuffs and mud-flowbreccias (Waite et al., 1998). Structural reconstructions indi-cate that the pre-mine surface of Bingham Canyon may havebeen overlain by ~2 km of volcanic and intrusive rocks (Fig.1C, redrawn from Waite et al., 1998).
Faulting and folding
A set of north-northeast− to northeast-striking faults andfractures is developed throughout the Bingham Canyon district(Fig. 1B). These structures crosscut the equigranular mon-zonite and appear to have controlled the emplacement of thenortheast-striking QMP and similarly striking later porphyrydikes (Atkinson and Einaudi, 1978; Presnell, 1998). They arealso important controls for later Pb-Zn mineralization, in-cluding the historic Lark (eastern), U.S. Mine (southern), andCarr Fork (western) mining areas located within about 2.5 kmfrom the QMP (Fig. 1B). Northwest-trending faults includingthe Copper Center fault and the Giant Chief fault seem tocontrol jogs in the Latite Porphyry in the region of high-gradeCu-Au mineralization in the QMP (Fig. 2). The Bingham syn-cline is a northwest-striking broad open fold and is thought tobe the result of folding caused by the intrusions (J. Grocottand A. Kloppenburg, pers. commun.). Other northwest-strik-ing normal faults postdate mineralization and, along with re-activation on some northeast structures, reflect the onset ofMiocene to recent Basin and Range extension (Presnell,
THE BINGHAM CANYON PORPHYRY Cu-Mo-Au DEPOSIT: VEIN GEOMETRY & ORE SHELL FORMATION 71
0361-0128/98/000/000-00 $6.00 71
Domes, Flows,and Dikes
ButterfieldCanyon
Pit outline
QuartzMonzonitePorphyry
BinghamStock
Last ChanceStock
DikesOlder Volcanic Unit
(Debris Flows)
YoungerVolcanic
Unit
Elevation(meters)
1000
2000
3000
4000
NW SE
1 mile0
0 1 kilometer
Allu-vium
Pfp
Pcp
Pcp
Pcp
Pbm
Pbm Pbm
Pbm
Pbm
Pbp
Pkdc
PpcUpper Plate
North Oquirrh Thrust
BARNEYS CANYON
WATER TUNNEL
MELCOBCS
OUTER LIMITAu-As
Pb-ZnHALO
PYRITE
MidasThrust
Bear Fault
Cop
perton
Coppe
rton
An
ticline
Overt
urn
Anticlin
eTiew
aukee
0 E
CONCEN-TRATOR
COPPER-TON
50
70
35
U.S. MINE
LARK
CARRFORK
GreatSaltLake
UtahLake
KeetleyVolcanics
UINTA
MOUNTAINS
OQ
UIR
RH
MO
UN
TAIN
S
TRANSVERSEMOUNTAINS
LAKEMOUNTAINS
WA
SATC
H
MO
UN
TAIN
S
Uinta Axis
Salt Lake City Park
City
Alta
Provo
DC CN
CN
Wasatch Fault
Wasatch Fault
41°
40°
112° 111°
BINGHAMCANYON
WY
UT
20 miles0
0 30 kilometers
N
UintaAxis
UTAH
Area of map
Ppc
Pkdc
Pfp
Pcp
Pbm
Pbp
Volcanic rocks
Intrusive rocks
Park City Fm.
Kirkman-Diamond Creek Fm.
Freeman Creek Fm.
Curry Peak Fm.
Bingham Mine Fm.
Butterfield Peaks Fm.
Fault
Thrust Fault
Fold axis
Gold deposit
Bingham Canyon Cu orebody
Pb-Zn halo (Mine: )
Outer limit of Au-Asgeochemical anomalies
10’000 feet0
0 3‘000 meters
N
LEGENDA B
C
FIG. 1. Overview on the Bingham Canyon porphyry copper deposit. A. Index map of the central Wasatch Mountains andsurrounding region in north-central Utah, showing the location of the Bingham Canyon mine, major folds, faults, and thedistribution of Tertiary igneous rocks (modified from John, 1989, 1998); CN = Charleston-Nebo thrust, DC = Deer Creekfault. B. Geologic map of the Bingham district, showing ore deposits, metal zonation, and some major lithologic units andstructures (modified from Babcock et al., 1995). C. Northwest-southeast−oriented cross section, showing the hypotheticalvolcanic edifice above the Bingham Canyon deposit (modified from Deino and Keith, 1998; Waite et al., 1998).

72 GRUEN ET AL.
0361-0128/98/000/000-00 $6.00 72
FIG. 2. Geologic map of the Bingham Canyon mine including lithologic units, major structures, and the area of >0.35 wtpercent Cu grade outline as a contour to the pit surface (data from KUC, mapping of 2006 updated locally). Mine grid (ft)indicated with ticks.
14
53
47
45
79
88
32
44
53
503049
24
39
40
4253
32
16
23
70
26
32
75
36
16
82
28
82
24
32
35
45 2417
16
33
74
54
22
24
28
33
17
20
36
34
67
6672
52
72
70
-4000 N
2000 N
0 N
-2000 N
-2000 N
0 N
2000 N
4000 N 4000 E2000 E
0 E
-2000 E
-4000 E
-6000 E
-8000 E
ANDYDIKE
ANDY DIK
E
FORTUNA SILL
STARLESS DIKE
MAI
N H
ILL
DIK
E
MAIN
HIL
L DIK
E
BINGHAMSTOCK
LASTCHANCESTOCK
OHIOCOPPER
DIKE
PHOENIX DIKE
PARNELL BEDS
PARNELL BEDS
COMMERCIAL
LIMESTONE
COMMERCIAL LIMESTONE
JORDAN LIMEST.
JORDANLIMESTONE
JORDAN L
IMES
TONE
KILKENNYBRECCIA PIPE
SYNC
LINE
BINGHAM
APEXFO
LD
FOLD
RO
OD
AN
DY
FA
ULT
EA
ST
FAU
LT
FAULT
CENTER
COPPER
ROLLFAULT
GIANT CHIEF
FAULT
Mine map center (0N / 0E)
Inclined bedding (with dip)
Overturned bedding (with dip)
Fault
Fold axis (with plunge)
0.35 wt % Cu grade
Endoskarn
Igneous breccia
36
66
Calcareous sandstone
Quartzite and calcareous quartzite
Limestone and skarn
SEDIMENTARY ROCK TYPES (Pennsylvanian) OQUIRRH GROUP
Quartz Latite Porphyry
Latite Porphyry
Quartz Monzonite Porphyry
Hybrid Quartz Monzonite
Porphyritic Quartz Monzonite
Equigranular Monzonite
IGNEOUS ROCK TYPES (Eocene)
Mag
netic
N
True
N
Mine N
31°5
9’
14°1
3’
0 1000 2000 feet
0 300 600 meters
Magneticdeclination:
BinghamCanyon
UTAH

1992, 1998). The modern Basin and Range topography is re-lated to extension along broadly north-trending faults(Zoback, 1983; Constenius, 1996). The Wasatch fault is theeasternmost bounding fault of the Basin and Range. It startedmoving at 18 to 17 Ma (Parry et al., 1988), opening the SaltLake Valley by downfaulting the Oquirrh Mountains blockwith a 15° to 30° eastside down rotation (Smith, 1961; John,1989; Melker and Geissman, 1998). This preserved the sub-volcanic ore deposits, while erosion of the upfaulted WasatchMountains exposed deep Eocene plutons that had been em-placed into Precambrian and Paleozoic rocks along the Uintaaxis (Fig. 1).
Veins, Alteration, and Metal ZonationSuccessive porphyry intrusions produced multiple genera-
tions of quartz veins associated with characteristic ore miner-alization and wall-rock alteration. Zoned ore metal distribu-tion closely relates to the type and intensity of veins andhydrothermal alteration of igneous rocks (Rose, 1970; Atkin-son and Einaudi, 1978; John, 1978; Babcock et al., 1995;Phillips et al., 1998; Redmond et al., 2001; Redmond, 2002;Redmond and Einaudi, 2010). Continued updating of geol-ogy and ore-grade distribution by Rio Tinto’s division Ken-necott Utah Copper formed the basis of the construction ofFigure 3. Despite a locally complex distribution of ore gradesand alteration intensity, controlled by host lithologic units andfault structures (Redmond and Einaudi, 2010), the BinghamCanyon orebody shows an overall simple and systematic oremetal zonation, centered on the southeastern contact of theQMP (Fig. 2).
Quartz stockwork veins, potassic alteration, and Cu-Au distribution
Following several stages of volumetrically minor vein types(Redmond and Einaudi, 2010), several pulses of quartz stock-work veining, potassic alteration, and Cu-Au mineralizationdetermined the large-scale distribution of copper and gold inthe Bingham Canyon orebody.
Copper distribution: The distribution of copper best de-fines the overall shape of the Bingham Canyon orebody, asdepicted by grade-envelope surfaces shown in Figure 3. Therock volume containing >0.35 wt percent Cu has the shape ofa thick-walled inverted cup, as shown in the three-dimen-sional projection in Figure 3A (red body). The shape has alsobeen compared to a molar tooth, to emphasize the thickcrown and the irregular base of the peripheral zones of theCu orebody, which has several deep roots extending belowand beyond the margins of the already exploited orebody.Three peripheral root zones constitute the most important re-maining Cu reserve of the mine. They are best developedoutside the two ends of the thick QMP dike (the two dark redroots in the foreground of Fig. 3A) and below the southeast-ern periphery of the orebody in the equigranular monzonite(the fainter red lobe in background of Fig. 3A, located ap-proximately beneath the outer 0.35 wt percent Cu contourshown in Fig. 2). Lower grade regions in the ring of deep pe-ripheral ore zones tend to be in areas where quartzites pre-dominate over the apparently more reactive equigranularmonzonite. Although dikes of LP and later intrusions havesuccessively lower Cu grades with locally sharp gradients at
intrusion contacts, the large-scale Cu distribution in the latitedikes follows the same pattern, with relatively highest gradesin the region where they intrude the QMP and the immedi-ately adjacent equigranular monzonite.
Gold distribution: Gold distribution shows a distinctly dif-ferent shape than that of copper, giving rise to a systematic,deposit-scale zonation of the Au/Cu metal ratio (ppm Au perwt % Cu; Redmond et al., 2004). In the central zone of high-est Cu grades in and surrounding the QMP, high Au gradecorrelates very closely with high Cu grade and both concen-trations decrease parallel with each other in successive intru-sion stages of latite dikes. On the scale of the entire deposithowever (Fig. 3B, D), Au is concentrated in the region im-mediately in and around the QMP. Au and Cu concentrationsshow sharp and closely coinciding gradients at the base of thiscentral Au-Cu orebody, irrespective of steeply dipping dikecontacts. The central high-grade Au-Cu orebody contains anaverage of 0.8 wt percent Cu and 0.6 ppm Au. This results ina bulk Au/Cu ratio of 0.000075, which is significantly higherthan the bulk Au/Cu ratio of the entire deposit (0.000042).High Au concentrations correlate systematically with thepresence of bornite and digenite as the dominant Cu miner-als. Towards the periphery, Au decreases more rapidly thanCu, i.e., the Au/Cu ratio decreases outward in a systematicmanner. The peripheral deep roots of the orebody are Cu rich(>0.35 wt % over large volumes), but contain only 0.09 ppmAu in average, i.e. the Au/Cu ratio in the deep peripheral orezones is lower than 0.000026. Consistently, Cu in the periph-eral zones is predominantly present as chalcopyrite, whereasbornite or digenite are clearly subordinate.
Quartz stockwork veins (Fig. 4A): Quartz stockwork veinsare closely related to Cu and Au grade and represent thechannelways for fluids causing alteration of former mafic ig-neous minerals to biotite and of plagioclase to potassiumfeldspar in areas of most intense veining and potassic alter-ation. They include barren quartz veins and thin quartz sul-fide veins, comparable to “A veins” and part of the “B veins”defined by Gustafson and Hunt (1975). Many samples showmultiple generations of successively opened and quartz-filledfractures of changing and apparently random orientation(Fig. 4B), but some generations are represented by sheetedarrays of multiple parallel veins (Redmond and Einaudi,2010). Quartz stockwork veins are typically 2 to 10 mm wideand can be followed for tens of centimeters, but wider andmore extensive veins occur sporadically. At any one site, theearliest veins tend to be shorter, more diffuse, and with irreg-ular walls indicating minor plastic deformation, whereas laterveins are increasingly straight with granular to columnarquartz infill. Straight parallel-walled veins may have a center-line between quartz crystals grown perpendicularly from thevein walls, but the veins are generally completely filled. Lat-eral offsets of earlier veins by later ones indicate a componentof shear displacement during vein opening (Fig. 4A). Evi-dence for shearing during quartz infill (e.g., sigmoidal quartzgrowth) is conspicuously absent. However, microbrecciationon the grain boundaries of earlier formed quartz crystals isubiquitous (as seen by SEM-CL imaging; Redmond et al.,2004; Landtwing et al., 2005). Brecciation was associated withthe precipitation of composite bornite-digenite grains, chal-copyrite and gold in secondary pore space formed by quartz
THE BINGHAM CANYON PORPHYRY Cu-Mo-Au DEPOSIT: VEIN GEOMETRY & ORE SHELL FORMATION 73
0361-0128/98/000/000-00 $6.00 73

74 GRUEN ET AL.
0361-0128/98/000/000-00 $6.00 74
Sedimentaryhost rock
QMP
EM
1800 m
600 m
1200 m
0 m
-4000 E -2000 E 0 E 2000 E-6000 E
6000 ft
2000 ft
4000 ft
0 ft
YXE
sectionA-B??
?
Sedimentaryhost rock
QMP
EM
2000 m
1800 m
600 m
1200 m
0 m
6000 ft
4000 ft
2000 ft
0 ft
-4000 N-2000 N0 N2000 N
BA
Csection
X-Y ?? ?
Sedimentaryhost rock
QMP
EM
1800 m
600 m
1200 m
-4000 E -2000 E 0 E 2000 E-6000 E
6000 ft
2000 ft
4000 ft
YXD
sectionA-B??
?
Sedimentaryhost rock
QMP
EM
2000 m
1800 m
600 m
1200 m
6000 ft
4000 ft
2000 ft
-4000 N-2000 N0 N2000 N
BA
Bsection
X-Y ?? ?
0 1000 2000 feet
0 300 600 meters
>0.15 wt % Cu>0.35 wt % Cu>0.70 wt % Cu
0.02 wt % MoS20.08 wt % MoS20.25 wt % MoS2
~0.15 ppm Au~0.30 ppm Au~1.00 ppm Au
Ore grades:
0 ft
7500 ft
5000 ft
2500 ftZ-Axis(elevation)
Y-Axis(Mine N)
X-Axis(Mine E)
25°
Y
X
B
A
A
FIG. 3. Mine-scale distribution of Cu, Au, and Mo in the Bingham Canyon deposit, based on three-dimensional model-ing data from KUC. Grid in mine coordinates (ft), orientations in text referred to True North, elevation above sea level. A.Three-dimensional view on the Bingham Canyon deposit, looking southeast. Shown are the 2006 topography (gray surface)and the envelope surface of >0.35 wt percent Cu (red body; already mined out above the open-pit surface). Orientations ofcross sections are indicated; see Figure 7 for traces at surface map. B. and C. Vertical northwest-southeast cross section (A-B; azimuth relative to True North: 148°, dip: 90°), showing Cu grades (decreasing shades of brown) together with contoursof Au (yellow to green in B) and MoS2 (blue in C) concentrations, respectively. Traces of cross section X-Y are indicated. D.and E. Inclined southwest-northeast cross section following the QMP (X-Y; azimuth relative to True North: 58°, dip: 65° to-ward NW), showing the Cu, Au (D), and MoS2 (E) distribution in the same colors as in B and C, respectively. Traces of crosssection A-B are indicated.

redissolution, both within the quartz veins and in the potassi-cally altered wall rocks. Potassium feldspar and biotite canoccur in vein selvages (Redmond et al., 2001; Landtwing,2004). Quartz stockwork veins are most intensely developedin the QMP, but vein truncations at intrusive contacts of laterporphyries show that a similar sequence of vein formation wasrepeated with decreasing intensity after the emplacement ofeach porphyry intrusion (Redmond, 2002). Quartz stockworkveins postdating the late QLP are sparse, straight walled, andonly weakly Cu mineralized; they commonly have restrictedhalos of biotite alteration.
Quartz-molybdenite veins and molybdenum distribution
Quartz-molybdenite veins (Fig. 4C): Quartz-molybdeniteveins form a distinct later vein generation that consistentlycrosscuts all quartz stockwork veins and even the latest por-phyry dikes (i.e., the QLP; Redmond and Einaudi, 2010).They commonly occur as single, laterally extensive (1−10 m)veins with straight walls that are at least 1 cm wide (some-times up to 10 cm wide). In contrast to the quartz stockworkveins, the quartz-molybdenite veins are commonly symmetri-cal with free-standing euhedral quartz crystals in the center.Molybdenite occurs as a selvage mineral predating mostquartz, as bands within the quartz, or as euhedral plateletsovergrowing the quartz. Minor chalcopyrite in these veinspredominantly occurs as late vug-filling crystals, bornite is ab-sent. Quartz-molybdenite veins crosscut even the rare quartzstockwork veins in late QLP dikes. They are typically associ-ated with biotite-stable alteration extending at least tens ofcentimeters away but lack potassium feldspar selvages.
Molybdenum distribution: The distribution of molybde-num is systematically zoned relative to copper distribution, as
indicated first by Atkinson and Einaudi (1978). Detailedreevaluation of molybdenum distribution including a recentdrilling program by Kennecott Utah Copper (G. Austin, G.Ballantyne, pers. commun.) showed that the molybdenumore shell (e.g. 0.08 wt % MoS2 contours, Fig. 3C, E) overlapswith the Cu ore shell (0.35 wt % Cu contour) at its inner andlower rim but extends to greater depths. The initial MoS2
content of the Cu ± Au ore mineralized only by quartz stock-work veins is not precisely known but was probably ratherlow. High-grade MoS2 regions that also contain QLP dikeswere found to contain abundant quartz-molybdenite veinscrosscutting the late porphyry dikes. This observation indi-cates that MoS2 is dominantly (estimated 60−90%) hosted bythe distinctly late quartz-molybdenite veins. The similar dis-tribution of Cu and MoS2 grades is therefore surprising, giventhat quartz-molybdenite veins formed late in the cyclic his-tory of porphyry intrusion and quartz vein formation, whereasmost of the Cu deposition immediately follows the QMP andpredates the later latite dikes.
Quartz-pyrite veins, feldspar-destructive alteration, and late Au mineralization
Feldspar-destructive alteration: A late-stage phyllic to argillicoverprint postdates potassic and propylitic alteration and isbest developed at the northeastern and southwestern ends ofthe deposit, overprinting all dike types as well as sedimentaryrocks (Lanier et al., 1978; Babcock et al., 1995; Parry et al.,2002; Redmond, 2002). Zones of this late hydrous alterationalong the northwestern side of the Cu deposit coincide withand extend northeast and southwest from the QMP (Bab-cock et al., 1995). Its intensity increases upward above thecentral Au-Cu orebody (Redmond et al., 2001; Landtwing,
THE BINGHAM CANYON PORPHYRY Cu-Mo-Au DEPOSIT: VEIN GEOMETRY & ORE SHELL FORMATION 75
0361-0128/98/000/000-00 $6.00 75
D
CB
1
1
2
2
3
3
4
5
6
A
~2 cm
FIG. 4. Rock slabs showing the three major types of hydrothermal veins, with some timing relationships. A. Multiplequartz stockwork veins in QMP. B. Sketch of crosscutting timing relationships in (A), with numbers indicating changes invein orientations between crosscutting veins. C. Quartz-molybdenite vein in highly potassically altered LP. D. Quartz-pyritevein with sericitic selvage cutting a thin quartz stockwork vein in previously altered equigranular monzonite.

2004). Sericite is the most prominent mineral in the south-western part of the equigranular monzonite and QMP, whereit occurs in selvages around quartz-pyrite veinlets which oc-casionally coalesce into pervasive alteration. Illite, smectiteand kaolinite replace plagioclase phenocrysts even in areas ofdominant earlier biotite (Landtwing, 2004). More intenseclay alteration with minor sericite occurs in and around theLP dikes along the northwestern part of the deposit, where itmay overprint slightly earlier sericitic alteration.
Quartz-pyrite veins with sericitic selvages: Quartz-pyriteveins with sericitic selvages are generally thin (0.5−5 mm) andcontrol the feldspar-destructive alteration (Fig. 4D). Theyoccur in swarms and anastomosing fracture sets of mostlysubvertical orientation (as described in more detail below).Quartz-pyrite veins with sericitic selvages contain pyrite astheir dominant vein mineral, variably accompanied by quartz,calcite, and locally some chalcopyrite or late bornite, and cor-respond to “D veins” of Gustafson and Hunt (1975).
Vein Geometry and DistributionThe aim of this study was to obtain a quantitative measure
of vein frequency (number of veins per linear interval, as afunction of space in three dimensions), vein density (mea-sured as vein volume percentage in rock), and vein orienta-tion (dip and dip direction) for three main stages of veining(Fig. 4): (1) barren or mineralized quartz stockwork veins as-sociated with potassic alteration in the inner zones or propy-litic alteration in the periphery; (2) quartz-molybdenite veins;and (3) quartz-pyrite ± carbonate veins with bleached halos offeldspar-destructive alteration (herein referred to as quartz-pyrite veins). Quartz-filled “early dark micaceous” veins(EDM, Redmond and Einaudi, 2010) were included with thequartz stockwork veins but never contributed appreciably tovein density. Some ambiguity arose where a quartz stockworkvein was reopened at the quartz-pyrite veins veining stage, asevident from bleached feldspar-destructive alteration sur-rounding otherwise massive quartz-dominated veins; clearcases were counted as quartz stockwork veins.
Data acquisition
In total 51 intervals, including drill core and mine benchfaces, were measured and documented in detail by Gruen(2007). Vein orientations could only be recorded for surfaceintervals, for lack of oriented drill cores. See Appendix for de-tails of data transformation, graphical representation, and sta-tistical analysis.
Subsurface measurements were carried out on 15 drill coreintervals of 5- to 14-m length (rarely 3−5 m in cores with high
vein density). For each vein, the apparent thickness betweenvein walls was measured in the direction of the core axis (Fig.5), in order to obtain a measure of the volume fraction of veinmaterial in the rock, irrespective of variable vein orientation.By summing up all apparent vein thicknesses of each of thethree vein types and dividing the sums by the total length ofa core interval, we obtained an estimate of the volumetricportion of each vein type in percent, which we here call veindensity. In addition, vein frequency was measured by count-ing the number of veins of each type, divided by the intervallength.
Mine bench exposures were mapped at 36 locations, sys-tematically following a horizontal line (“scanline”) defined byextending a string along a segment of the pit wall. Dependingon the accessibility of the bench walls, mapped segmentlengths ranged from 2 to 6 m (rarely 1−2 m in areas of highvein density). Care was taken to select an interval that is rep-resentative for at least 10 to 20 m of surrounding pit wall. Ap-parent vein thicknesses were measured by projection onto thescanline to get a volume estimate, comparable to that in drillcore. In addition to measurements of vein density and fre-quency, the orientation of each vein was measured andrecorded with supplementary information about rock types andmineralogy using a simplified “Anaconda” mapping method(Einaudi, 1997, 2000). Vein orientations were recorded as dipdirection and dip of vein planes relative to True North (localmagnetic declination at time of data acquisition (2006) was~12.5° E).
Vein orientation
Orientation measurements of veins and their abundance atthe pit surface are summarized in stereograms of Figure 6.Quartz stockwork veins are the most abundant vein type.Their poles (red dots, Fig. 6A) predominantly lie along a greatcircle which dips ~30° to the southeast. Quartz-molybdeniteveins are less frequent than the other vein types. Their orien-tations (blue triangles, Fig. 6A) are more scattered, and it istherefore difficult to identify a preferred direction. Quartz-pyrite veins with sericitic selvages are dominantly steep (greencrosses, Fig. 6A, see also Fig. 6C) and show a preferred strikedirection, which is seen more clearly in the rose diagrams ofFigure 7. Here, the quartz-pyrite veins from adjacent mappingareas were grouped into five peripheral sectors to gain betterstatistical significance. As already observed in Figure 6A,quartz-pyrite veins were observed mainly in sedimentary rocksoutside the southwestern and northeastern terminations of theQMP. Their strikes tend to point radially, in a fanlike manner,toward the center of the pit (see also Fig. 7).
76 GRUEN ET AL.
0361-0128/98/000/000-00 $6.00 76
FIG. 5. Photograph of a QMP drill core to explain the principle of measuring apparent vein thicknesses to obtain volu-metric vein density estimates for a chosen profile interval.

THE BINGHAM CANYON PORPHYRY Cu-Mo-Au DEPOSIT: VEIN GEOMETRY & ORE SHELL FORMATION 77
0361-0128/98/000/000-00 $6.00 77
-4000 N
-2000 N
0 N
2000 N
-2000 N
0 N
2000 N
4000 N
0 E
-2000 E
-4000 E
-6000 E
-8000 E
1010 10
?
?
4
4
44
42
2
2
2
2
2
2
0 1000 2000 feet
0 300 600 meters
NCenter of stock
Quartz Latite Porphyry
Latite Porphyry
Quartz Monzonite Porphyry
Equigranular Monzonite
Igneous breccia
Calcareous sandstone
Quartzite
Limestone and skarn
4 Total vein density(vol.-% in rock)
Quartz-stockwork veins
Quartz-molybdenite veins
QSP veins
0
5
10
15
20
25
0 200 400 600 800 1000 1200 1400 1600 1800 2000Distance from center of the stock (m)
Vei
n d
ensi
ty (v
ol.-
% in
roc
k)V
ein
freq
uenc
y (c
ount
per
m)
QSP veins
Quartz-stockwork veinsQuartz-molybdenite veins
Total
Vein density(vol.-% in rock)
Vein frequency(count per m)
0
5
10
15
20
25
30
35
10 20 30 40 50 60 70 80 90Dip (°)
Frac
tion
of e
ach
vein
typ
e (%
)
Quartz-stockwork veinsQuartz-molybdenite veinsQSP veins
A
B C
FIG. 6. Summary of surface measurements. Orientations are relative to True North. A. Simplified geologic map showingequal area Schmidt nets of the lower hemisphere for poles to veins measured along mine benches, together with manuallydrawn vein density contours (orange lines; in vol % total veins). Fill patterns of stereonets correspond to host lithologic units;a few adjacent locations were grouped. Vein types are distinguished by circles, crosses, and triangles. Orientations of scan-lines are indicated with thin dashed lines. B. Separate and integrated surface vein densities (vol %) and frequencies (countper 1 m of interval) for the three vein types as a function of distance from the center of the QMP stock (−220N/−2220E minecoordinates). C. Dip histogram of the same three vein types. QSP veins = quartz-pyrite veins with sericitic alteration halos.

A bias in orientation measurements along a scanline couldresult from the tendency to overlook veins with strikes paral-lel to the scanline (i.e., parallel to the mine bench). To ac-count for such a potential bias, the orientation of the scanlinefor each bench mapping location is indicated as a dashed linein the stereoplots of Figure 6A. Most of the stereoplots showveins striking both parallel and at variable angles to the scan-line (i.e., vein poles do not cluster around tips of the dashedlines). This indicates that the bias in orientation data is notsubstantial.
The stereonets in Figure 8 plot the orientations of allthree vein types without respect to their location within thepit but contoured for directional frequency. Each of thethree stereoplots on the left-hand side shows vein poles
relative to True North and present-day vertical coordinate system, as measured in the field. For the plots on the right-hand side of Figure 8, the entire dataset was rotated 25°westward around a horizontal axis pointing to N 58° E. Thisrotation axis is oriented parallel to the largest horizontal ex-tent of the QMP in map view (Fig. 2). The inclined south-west-northeast cross section (X-Y) introduced in Figure 8Dand E represents the plane defined by this rotation axis andthe direction of longest dimension of the QMP (based onthree-dimensional geometric modeling of Kennecott UtahCopper data). Our rotation therefore reorients the recordeddata, together with the cross section X-Y, into an inclined co-ordinate system defined by the principal axes of the QMP.This coordinate system may not have been precisely vertical
78 GRUEN ET AL.
0361-0128/98/000/000-00 $6.00 78
X
YA
B
30%
20%
10%
QSP veinsN = 94
30%
20%
10%
QSP veinsN = 66
30%
20%
10%
QSP veinsN = 120
30%
20%
10%
QSP veinsN = 64
30%
20%
10%
QSP veinsN = 63
0 1000 2000 feet
0 300 600 meters
N
Igneous breccia
Calcareous sandstone
Quartzite
Limestone and skarn
Quartz Latite Porphyry
Latite Porphyry
Quartz Monzonite Porphyry
Equigranular Monzonite
FIG. 7. Simplified geologic map with rose diagrams showing strikes of the quartz-pyrite veins with sericitic alteration halos(QSP veins), roughly grouped by location around the center of the pit. Thick black lines indicate surface traces of the twocross sections A-B and X-Y (Figs. 3, 10).

THE BINGHAM CANYON PORPHYRY Cu-Mo-Au DEPOSIT: VEIN GEOMETRY & ORE SHELL FORMATION 79
0361-0128/98/000/000-00 $6.00 79
N
3
2
1
N
3
2
1
QSP veinsN = 410
N
3
2
1
N
3
2
1
Quartz-molybdenite veinsN = 132
N
3
2
1
N
3
2
1
Quartz-stockwork veinsN = 514
+2S
+4S
+6S
+8S
+2S
+4S
+6S
+2S
+4S
+6S
A
B
C
FIG. 8. Vein orientations plotted as poles in equal area Schmidt nets of the lower hemisphere, separated by vein type. A.Quartz stockwork veins. B. Quartz-molybdenite veins. C. Quartz-pyrite veins with sericitic selvages (QSP veins). Plots on leftare data as measured in the field, plots on right are rotated 25° westward around a horizontal axis pointing to N 58° E. Out-lined numbers indicate the minimal [1], intermediate [2], and maximal [3] principal directions, representing the least, inter-mediate, and highest accumulation of data points, respectively. Contour levels are in multiples of the standard deviation Sabove the expected count (refer to Appendix for a more detailed description of statistical analysis).

at the time of emplacement and vein formation, but structuralreconstruction based on volcanic stratigraphy indicates thatthe porphyry body was emplaced with a distinctly steeperplunge prior to extension-related block tilting.
The following observations refer to the rotated data onthe right-hand side of Figure 8 as our best estimate of trueorientations at the time of vein formation. Directional sta-tistics (see App.) yields point-density contours and threeprincipal pole directions [1], [2], and [3], representing theleast, intermediate, and highest accumulation of datapoints, respectively.
The poles of the quartz stockwork veins (Fig. 8A) lie in agreat circle with shallow dip (~15° NE), which corresponds tosteeply oriented veins with variable strike direction. Whilethe maximal [3] and intermediate [2] principal pole directionscould be interchanging or rotating within a subhorizontalplane, the minimal principal pole direction [1] has a distinct,nearly vertical plunge. The quartz-molybdenite vein poles(Fig. 8B) form clusters along a rather weakly developed greatcircle with moderate dip (~30° NE). A preferred orientationof veins is therefore not identifiable. The poles of quartz-pyrite veins (Fig. 8C) show a distinct cluster, elongated alonga moderately developed great circle with subhorizontal dipand indicating the presence of steep veins striking preferablynortheast to east.
Volumetric vein distribution
While Figure 6A shows contours of total vein density involume percent (vol %) per rock, in Figure 9, vein densitiesof the three different vein types are plotted separately, incorrelation with ore grades. Within an area of about 1 × 2km² centered in the QMP intrusion, total vein density ex-ceeds 4 vol percent, locally rising to >10 vol percent in thecenter (Fig. 6A). Throughout this region, vein density isdominated by quartz stockwork veins (>50% of total vein vol-ume; Fig. 6B). Quartz stockwork veins represent the path-ways for Cu and Au mineralization, and their distributionoutside the barren core zone correlates well with the zonesof high Cu ore grade (Fig. 9A). Quartz-molybdenite veinscontribute to less than 30 percent of total vein volume (Fig.6B). Similar to quartz stockwork veins, quartz-molybdeniteveins also show highest values within the QMP. Their overalldistribution correlates even more closely with the MoS2
grade (Fig. 9B). In the periphery of the deposit, total veindensity rapidly drops off to 2 vol percent or less (Fig. 6A),and quartz-pyrite veins become the most frequent vein type(Fig. 6B). They show a different distribution pattern and donot correlate with any of the high-grade ore zones but ratherform two areas of high density outside the two ends of thethick QMP dike (Fig. 9C).
Volumetric vein density measurements at the pit surfacewere combined with drill core data to extend the contoursinto the more recently mined Au-Cu−rich orebody in thelower part of the open pit. Vein density values measuredalong mine benches generally turned out to be somewhathigher than the ones from core logging in adjacent areas. Thisapparent systematic overestimation along mine benches mayresult from different rock conditions—in drill holes, the rockmaterial is well preserved and cleancut, whereas in mine
benches it is fractured and has an irregular surface. Similar toobservations at the pit surface, total vein density along thesubsurface part of the two cross sections is dominated byquartz stockwork veins.
Total vein densities were analyzed along the two profiles A-B and X-Y (Fig. 10). The vertical section at −1400E (mine co-ordinates) cuts at right angle across the QMP intrusion (Fig.10A). Figure 10B is oriented through the center of the openpit along a plane dipping 65° toward N 32° W, following theassumed emplacement direction of the QMP. Both sectionsshow similar distribution patterns, though in the long sectionX-Y they appear broader. The highest total vein density (>8vol %) occurs in the center and along the footwall of theQMP. High densities of >4 vol percent quartz stockwork veining occupy a broad area, extending into the adjacentequigranular monzonite and below the entire cup-shaped Cuorebody. This observation is consistent with results from acompanion study at a more detailed scale (5−10 vol % veinswithin QMP and equigranular monzonite; Redmond and Ein-audi, 2010). Even higher vein densities (>20 vol %) were lo-cally recorded at the surface of the pit. It is noticeable thateven with depth, despite a rapid drop-off of Cu ore grade, rel-atively high vein densities continue within the QMP, as shownby both sections (Redmond and Einaudi, 2010). South of theQMP, within the equigranular monzonite, the intervals be-tween neighboring contour lines are wider, compared to thenorthern side where the QMP is in contact with sedimentaryhost rocks and vein densities show a sharp gradient. Typicalvein densities in sedimentary rock, even if well mineralized,are generally smaller than 2 vol percent; in comparison tomeasurements within the equigranular monzonite, which liebetween 4 and 6 vol percent over a broad zone. Density con-tours are shown to close in the upper part of the orebody,based on a small number of observations of old (~1960) coreintersections above the present pit outline. While an upwarddecrease of quartz vein density is obvious from these inter-sections, the contours have to be treated as rough interpola-tions only.
Discussion and InterpretationThe mine-scale distribution of vein abundance, density,
and orientation in successive geologic stages of the Bing-ham Canyon deposit can be interpreted in terms of chang-ing fluid pressure and differential stress1 in an evolvingmagmatic-hydrothermal system (Nakamura, 1977; Delaneyet al., 1986; Jolly and Sanderson, 1997; André et al., 2001;Tosdal and Richards, 2001; Stephens et al., 2004). Our in-terpretation attempts to explain more generally the pre-ponderance of steep structures, including magmatic con-tacts as well as hydrothermal veins, which is typical for thedepositional environment of many porphyry-style ore sys-tems (e.g., Heidrick and Titley, 1982; Carten et al., 1988;Tosdal and Richards, 2001; Stephens et al., 2004), in con-trast to the prevailing flat structures in deep plutons and re-lated veins. The discussion first addresses the rock me-chanics significance of preferred vein orientations. We then
80 GRUEN ET AL.
0361-0128/98/000/000-00 $6.00 80
1 In this study, σ1 is the maximum compressive principal stress, whereas σ3
is the minimum compressive principal stress. σ2 is the intermediate principalstress; therefore σ1 > σ2 > σ3.

THE BINGHAM CANYON PORPHYRY Cu-Mo-Au DEPOSIT: VEIN GEOMETRY & ORE SHELL FORMATION 81
0361-0128/98/000/000-00 $6.00 81
2
10.5
3
21
66
42
3
1
32
0.5 12
3
0.5 ?
C
0.5
0.5
1
11
2
3
3
5
7
B
0.5
0.5
0.5
11
2
3
4
1
2
3
4
12
3
4
5
6
81010
A
Bench mapping location
Core logging location
0 1000 2000 feet
0 300 600 meters
N
Quartz-stockwork veins
>0.35 wt % Cu
Quartz-molybdenite veins
>0.08 wt % MoS2
QSP veins
>0.30 ppm Au
4
2
6
Ore grades and vein densities (vol % in rock):
Quartz Latite Porphyry
Latite Porphyry
Quartz Monzonite Porphyry
Equigranular Monzonite
Igneous breccia
Calcareous sandstone
Quartzite
Limestone and skarn
Rock types:
FIG. 9. Simplified geologic maps showing vein density contours in vol percent for the three major vein types, togetherwith ore-grade contours and stations of surface mapping (circles) and core logging (squares) locations. A. Quartz stockworkvein density contours highly overlap with the >0.35 wt percent Cu ore grade and show highest values (>7 vol %) within theQMP. B. Quartz-molybdenite vein densities, similar to quartz stockwork veins, show highest values (>4 vol %) within theQMP and correlate well with the >0.08 wt percent MoS2 ore grade. C. Quartz-pyrite veins with sericitic alteration halos (QSPveins) are less abundant in the center of the pit but occur dominantly at the northeastern and southwestern edges of the de-posit. They show no correlation to any of the ore grades.

propose a sequence of events of magma-fluid-rock interac-tion, inspired by recent geodetic data of active volcanoes.Finally we conclude with a tentative interpretation of per-meability evolution within the vein stockwork during Cu-Au and Mo mineralization.
Vein orientation, fluid pressure, and differential stressThe minimum compressive principal stress σ3 determines
the opening direction of a vein in a previously unfracturedrock, such as a hydrous magma that just cooled below itssolidus. In a rock mass already containing numerous fractures
82 GRUEN ET AL.
0361-0128/98/000/000-00 $6.00 82
QuartzMonzonitePorphyry
EquigranularMonzonite
Sedimentaryhost rock
Sedimentaryhost rock
Pit outline 2006
Pre-mining
6
4
4
2
88
2
6
1010
?
?
?
-400
0 E
-200
0 E
0 E
2000
E
-600
0 E
1800 m
600 m
1200 m
2400 m
6000 ft
2000 ft
4000 ft
EquigranularMonzonite
QuartzMonzonitePorphyry
Sedimentaryhost rock
Sedimentaryhost rock
Pit outline 2006
Pre-min
ing topography
ranularzonite
2
2
4
4
6
68
8
10
10
?
?
1800 m
1200 m
600 m
6000 ft
4000 ft
2000 ft
-200
0 N
-400
0 N
0 N
2000
N
4000
N
Vol % total veins
>0.30 ppm Au>0.35 wt % Cu
Ore grades:
Surface mappingCore logging
0 1000 2000 feet
0 300 600 meters
A B
X Y
A
B
FIG. 10. Two geologic profiles showing vein density contours relative to lithologic units as well as ore grades of Cu andAu, indicating also projected surface mapping (circles) and core logging (triangles) locations. A. Northwest-southeast crosssection (A-B). B. Southwest-northeast cross section, dipping 25° to the north-northwest (X-Y). Grid in mine coordinates (ft).

of variable orientation, a pure extension vein will open wherethe minimum compressive principal stress σ3 is oriented per-pendicular to a fracture. However, vein formation occursmore easily by shear failure, because fluid pressure reducesthe frictional resistance to slip on any existing fracture surface(Townend and Zoback, 2000; Cox et al., 2001). In this case,individual vein walls can be oblique to σ3, but, on averageamong many veins, the favored direction of opening still cor-responds to the direction of σ3. The two larger principal stressdirections σ1 and σ2 will be in the plane of a pure extensionvein and parallel to the majority of veins in a large array ofopening fractures. Predominantly steep veins with variablestrikes (poles on a great circle) therefore indicate a commonsubvertical σ1 orientation (Fig. 8). However, the statisticallydetermined principal directions of highest [3] and intermedi-ate [2] concentration of data points do not necessarily corre-spond to a static differential stress of subhorizontal σ3 and σ2
directions. Instead, the variation of strike directions with apredominantly subvertical dip indicates that σ3 and σ2 wereeither subequal or rotated in a subhorizontal plane. The lat-ter is consistent with mutual crosscutting relationships (Fig.4B) and the observation in other porphyry deposits of inter-secting concentric and radial vein arrays (Carten et al., 1988;Tosdal and Richards, 2001; Cannell et al., 2005).
Alternating stages of magma intrusion and vein formation
Recent geodetic data from areas of active magmatism pro-vide new insights into the mechanisms of subsurface magmaemplacement and fluid expulsion from hydrous intrusions intoupper-crustal hydrothermal systems. Intrusion of volatile-richmagmas leads to cycles of uplift and domal extension, alter-nating with depression and contraction of caldera roofs(Bonafede, 1991; Todesco et al., 2004; Hurwitz et al., 2007;Hutnak et al., 2009). Numerical modeling of geometry andtimescale of these ground-surface displacements indicates
transient injection of overpressured, presumably magmaticfluids to shallow depths of <3 km below surface, well abovethe depth of the actual intrusion roof (Todesco et al., 2004;Bodnar et al., 2007; Hurwitz et al., 2007). Fluid expansionacross the transition from lithostatic to hydrostatic pressurescan lead to phase separation, which further enhances updom-ing and local extension, before the deep fluids eventuallydrain into the ground-water regime over periods of months toyears (Cappa et al., 2009; Hutnak et al., 2009; Lima et al.,2009). The steep gradients in temperature, fluid pressure,and fluid phase state implied by such rapid variations in activesystems are consistent with large pressure fluctuationsrecorded by fluid inclusions in exposed porphyry-style ore de-posits and with rapid and voluminous fluid flow as requiredfor ore formation. Recorded pressure fluctuations betweendistinct inclusion assemblages, even in a single vein, can ap-proach or exceed the difference between lithostatic and hy-drostatic pressure (e.g., Audétat et al., 1998; Ulrich et al.,2001; Redmond et al., 2004).
A physical interpretation of alternating intrusion and veiningstages at Bingham Canyon must explain the observed predom-inance of steep veins and intrusive dikes, as well as the subor-dinate but common occurrence of otherwise identical vein anddike segments with some flat or gently dipping orientations inall stages. It must also explain the preferred southwest-north-east orientation of structural elements in some stages, alternat-ing with variable strike directions of subvertical vein structuresin other stages. These observations may be explained by acyclic interplay between two regimes of fluid pressure and dif-ferential stress in the roof of an inferred magma chamber,which drives the subvolcanic magmatic-hydrothermal systemfrom greater depth (Fig. 11; cf. Cannell et al., 2005):
A. An asymmetric transtensional regime of overall small dif-ferential stresses, in which northeast-striking steep fractures
THE BINGHAM CANYON PORPHYRY Cu-Mo-Au DEPOSIT: VEIN GEOMETRY & ORE SHELL FORMATION 83
0361-0128/98/000/000-00 $6.00 83
σ1
σ3 σ3
σ1 > σ2 > σ3 (σ2 = σvertical)
lithostaticfluid pressure
hydrostaticfluid pressure
vein opening
mineralization
σ2
σ3 σ3
σ1 > σ2 ~ σ3 (σ1 = σvertical)
A B
FIG. 11. Block diagrams illustrating the two end-member stress states of the magmatic-hydrothermal system. A. Asym-metric transtensional regime where opening of jogs and emplacement of intrusions take place. B. Symmetric extensionalregime with subvertical σ1 and subhorizontal σ2~σ3 caused by roof bulging and radial extension due to underlying fluid over-pressure. The resulting extensional vein stockwork, forming well above the magmatic front and the lithostatic to hydrostatictransition, is likely to be a key to metal accumulation in high-grade porphyry ore shells.

are opened dominantly by shear failure. It has a stable compo-nent of horizontal stress differences, with σ1 directed approxi-mately southwest-northeast and σ2 in near-vertical orientation.
B. A radial extension regime with subvertical σ1 and signif-icantly smaller but similar σ2 ~ σ3, forming multiply intersect-ing steep stockwork veins as a result of σ2 and σ3 fluctuating insubhorizontal directions. Radial extension is proposed to re-sult from upward bulging of the ore shell region by the un-derlying region of magmatic fluid overpressure and the roofof the magma chamber itself. In this environment, vein for-mation not only occurs by hydraulic fracturing (i.e., driven byreduction of effective stress) but primarily by rock extensionwell above a deep and broad high-pressure region (i.e., by anincrease of differential stress).
Alternating stress states between these two end-memberregimes can explain the observed sequence of stages duringthe formation of the Bingham Canyon deposit (Fig. 12):
Stage 1—emplacement of the equigranular monzonite,comprising several dikes and stocks with variable contact ori-entations, which may follow regional structures (Einaudi,1992). The equidimensional outcrop area and steep walls ofthe equigranular monzonite (Fig. 2) indicate that its em-placement is controlled by lateral extension in varying direc-tions (as reconstructed by J. Grocott and A. Kloppenburg,pers. commun.; Fig. 12-1) and an unknown fraction of verti-cal mass displacement, including stoping of large exposedsediment rafts and roof lifting above the present erosion sur-face. We infer that this stage was mechanically dominated bythe magma supply to a much larger, deeper seated magmachamber. This caused roof extension and established regimeB for the first time, still without large-volume fluid saturation.This stage probably included the build-up of the overlyingvolcanic edifice, as roof doming would favor the opening offeeder dikes above the equigranular monzonite stock.
Stage 2—emplacement of the thick QMP dike—was local-ized by the far-field stress activating preexisting faults in thesedimentary rocks (asymmetric stress regime A; Fig. 11A).The vertically elongated box shape of the QMP (Figs. 2, 3)necessitates a component of shear displacement along steepfaults, i.e., with a σ3 oriented roughly northwest-southeast andσ1 approximately southwest-northeast (Fig. 12-2). The bound-ing shears have not been mapped but could belong to theprominent family of north-northwest−trending faults in thecentral part of the pit that cut the equigranular monzonite andalso cause jogs in the later porphyry dikes (Fig. 2). Intrusion ofthe QMP along the northeast-oriented northern contact of themassive equigranular monzonite may have occurred at a timewhen this stock and the outer carapace of the subjacentmagma chamber were already solidified and therefore able totransmit the far-field transtensional stress. The QMP magmamay have originated from the interior part of the crystallizingmagma chamber, in a geometric relationship resembling thedeeply exposed Yerington batholith (Dilles, 1987).
Stage 3—main Cu-Au stockwork vein formation. Quartz-stockwork vein formation immediately followed the emplace-ment of the QMP, after the intrusion had released the differ-ential regional stress field and high fluid pressure from belowsubjected the composite stock to symmetric tensional up-doming (stress regime B, Figs. 11B and 12-3). Hydraulic
84 GRUEN ET AL.
0361-0128/98/000/000-00 $6.00 84
σ1
σ1
σ3
σ3
σ1 > σ3
Stage 6:Formation ofQSP veins(green)
σ2
σ2
σ3
σ3
σ2 ~ σ3
Stage 5:Formation ofquartz-molybdenite veins (blue)
σ1
σ1
σ3
σ3
σ1 > σ3
Stage 4:Emplacement of latitic dikes(black)
σ2
σ2
σ3
σ3
σ2 ~ σ3
Stage 3:Formation of quartz-stockwork veins (red)
σ1
σ1
σ3
σ3
σ1 > σ3
Stage 2: Emplacement of Quartz MonzonitePorphyry (dark gray)
σ2
σ2
σ3
σ3
σ2 ~ σ3
Stage 1: Emplacement of EquigranularMonzonite (light gray)
FIG. 12. Plan view sketches illustrating the time sequence of intrusion em-placement and vein formation at the Bingham Canyon deposit. Indicated areschematic geometry of intrusions, distribution and orientation of veins, andidealized local stress regimes when horizontal stresses were nearly subequal(σ2~σ3; stages 1, 3, and 5) and a significant differential horizontal stress ex-isted (σ1>σ3; stages 2, 4, and 6).

fracturing is most intense in the QMP itself but extends in aroughly circular area into the equigranular monzonite (Fig.9A). As detailed below (Fig. 13), the vein opening occurred inmultiple cycles, starting with extensional failure at near-litho-static fluid pressure and then evolving toward shear reactiva-tion while veins are being filled with quartz and texturallylater ore minerals.
Stage 4—emplacement of the latitic dikes, followed by re-newed stockwork veins—encompassed at least two events ofreturn to dominantly northeast-oriented dike emplacement instress state A after the deep fluid overpressure was temporar-ily released by fluid drainage through the vein network re-lated to the QMP, and after mineral precipitation had healedthe rocks to allow transfer of far-field stress (Fig. 12-4). Eachdike event was followed by repeated vein formation, drivenby fluid overpressure that had built up in the magma cham-ber at depth (stress state B; Fig. 11B).
Stage 5—quartz-molybdenite veins reflect the last returnto symmetrically extensional conditions of stress state B(Figs. 11B, 12-5), characterized by a sparser set of largerveins with dominantly steep but commonly also flat orienta-tions. Vertically extensive MoS2-rich zones at depth (Fig. 3E)
may reflect vein emplacement into an already quite cool andbrittle, thoroughly prefractured rock mass, by a last event ofdeep fluid-pressure buildup without related magmas reach-ing the present level of exposure.
Stage 6—quartz-pyrite veins with preferred southwest-northeast orientation reflect the return to the prevailing re-gional stress state A during the waning of the hydrothermalsystem (Fig. 12-6). As magmatic fluid pressure dissipated andhydrothermal heat advection decreased, the crust returned toits normal state of high crustal strength close to shear failureand moderately high permeability at near-hydrostatic condi-tions (Townend and Zoback, 2000). The concentration ofsteep quartz-pyrite veins along the northeastern and south-western extensions of the QMP probably relates to local stressconcentrations around a relatively competent body.
Permeability evolution, vein mineralization, and the origin of porphyry ore shells
The formation of a porphyry vein stockwork involves frac-ture formation as well as hydrothermal minerals infilling. Thisprocess can be understood by considering the structural andmineral zoning data in conjunction with textural observationsand fluid inclusion data (Redmond et al., 2004; Landtwing etal., 2010). A new way of depicting the relationships of relativefluid pressure and rock stress was introduced by Cox (inpress), as illustrated in Figure 13. The diagram plots fluidpressure normalized to vertical rock pressure on the verticalaxis, i.e., attaining a value of 1 at lithostatic fluid pressure con-ditions where fluid pressure Pf equals the pressure deter-mined by the weight of the overlying rock column. The hori-zontal axis shows the differential stress σ1-σ3 irrespective oftheir orientation. The limits of rock failure are shown by afailure envelope with two segments: a segment at high fluidpressure and low differential stress where failure occurs bypure extension (red); and a segment at lower pore pressurebut higher differential stress where failure occurs by sheardisplacement (blue). The position of the failure envelope ex-pressed in these two variables depends strongly on depthbelow surface. The curve in Figure 13 is calculated for 2 km(the estimated depth of the center of the orebody), for typicalproperties of crystalline rocks and assumptions detailed inCox (in press).
Based on the preceding discussion, we interpret that thenormal state of the crust at Bingham Canyon was dominatedby a small, regionally imposed difference between horizontalσ1 and σ3, i.e., a transtensional situation with overall low dif-ferential stress consistent with point (1) in Figure 13. A cycleof dike emplacement and subsequent veining starts withmagma pressure overcoming the regional stress field above adeep magma chamber, thereby opening a vertical extensionjog in the direction of easiest major space creation (Fig. 11A).The dike is emplaced in the forefront of a deep and muchbroader zone of massive fluid pressure buildup in the roof ofthe subjacent magma chamber. Upward transmission of thisfluid pressure is shown by the arrow (2) in Figure 13 andleads to extensional hydraulic fracturing in the roof of themagma chamber (Fig. 11B), including the preexisting equi -granular monzonite in the deep core of the ore system, atpoint (3A). The porphyry magma itself exsolves a smallamount of fluid upon crystallization, causing particularly
THE BINGHAM CANYON PORPHYRY Cu-Mo-Au DEPOSIT: VEIN GEOMETRY & ORE SHELL FORMATION 85
0361-0128/98/000/000-00 $6.00 85
vapor-static Pf
hydrostatic Pf
lithostatic Pf
extension failure
shear failure
2 km
Pf / σvertical
σ1 - σ3 (bar)
~5000
1
0.4
0
Vein opening
Quartz infill
Reactivation, quartz dissolution, copper deposition
Recovery
Stableregionalstate
1
2
3A3B
4
5
6
7
FIG. 13. Failure mode diagram for an extensional tectonic regime atcrustal depth of 2 km, based on calculations from Cox (in press), indicating apossible stress and fluid pressure evolution path of the Bingham Canyon de-posit. 1= regional transtensional stress state; 2 = buildup of fluid pressure byfluids exsolving from a magma chamber; 3 = hydraulic fracturing of preexist-ing porphyry (A) and cooling pluton (B); 4 = simultaneous increase in fluidpressure and differential stress due to rock uplift and extension; 5 = veinopening by extension failure; 6 = transition toward shear failure; 7 = vein re-activation at vapor-static conditions.

intense local hydrofracturing at lithostatic condition and verysmall differential stress, because the fresh magma has justcrossed its solidus, resulting in local fluid phase exsolutionand an associated net volume expansion (Burnham, 1979;point (3B), Fig. 13). The pressure front from the large un-derlying fluid reservoir causes active rock uplift and radial ex-tension (Fig. 11B) over a much wider zone than the QMP, onthe scale of the 3-km broad ore shell or even beyond. Such ra-dial roof extension causes an increase in differential stress,because it decreases both horizontal stresses σ2 and σ3 to acommon low value, while σ1 remains constant due to theweight of the overlying rock. Almost at the same time, thefluid pressure front advances into the region of the futureorebody, leading to paths such as (4) in Figure 13. Observa-tions of vein shapes described in this paper (Fig. 4A) andother porphyry copper literature indicate that most quartzstockwork veins form by extensional failure, implying that ini-tial vein opening occurred at high (but depending on depthnot necessarily lithostatic) fluid pressure, e.g., at points near(5) in the red failure segment of Figure 13. Once a fractureforms, parting of the crack walls will cause a fluid pressure re-duction as the fluid expands into the open space. On the scaleof the entire ore shell, however, the deep fluid overpressureis maintained, allowing continued extension and repeatedcracking and vein formation. Despite overall falling fluidpressures, as the fluid drains upward, differential stress cantherefore increase due to continued lateral extension of therock column.
Upward draining of a dense fluid from the higher pressureregion below causes every fluid aliquot to expand and cooladiabatically, leading to quartz precipitation and infill of openvein space. With continued pressure decrease, a region of theore shell will evolve toward lower fluid pressure where open-ing becomes easier by shear failure (steeper, blue part of thefailure curve in Fig. 13). This evolution toward point (6) ex-plains some key features of the ore veins, documented in thecompanion paper of Landtwing et al. (2010). Cathodolumi-nescence petrography of stockwork veins at Bingham Canyonand other porphyry deposits (Rusk and Reed, 2002; Red-mond et al., 2004; Klemm et al., 2007) shows widespread ev-idence for microfracture reactivation within previously filledstockwork quartz veins associated with redissolution of exist-ing quartz. Based on fluid inclusion data, this occurs at lowfluid pressure (<250 bars) where quartz solubility is retro-grade (Fournier, 1983). The process helps to maintain highpermeability for the precipitation of texturally late ore miner-als into this new pore space. The proposed vein evolutionpath from (3) through (5) and (6) to (7) is consistent with fluidinclusion evidence showing large variations in fluid pressureduring quartz vein evolution, even exceeding the differencebetween lithostatic and cold hydrostatic pressure. Vapor-sta-tic pressures as low as 150 bars (indicated by point (7); Fig.13) imply that the upper part of the ore system evolved to-ward a vapor plume, in which fluid pressure was determinedby the integrated weight of hot fluid with low density(Landtwing et al., 2010). Within one mineralization event, theevolution of fluid pressure and differential stress up and downalong paths (5)-(6)-(7) can be locally repeated many times,leading to the multiply crosscutting veins (Fig. 4B) that char-acterize porphyry copper deposits, whereby each vein may
form the characteristic internal reactivation texture shown bycathodoluminescence. On the mine scale, the region of oredeposition will be stabilized by a balance between the roof ex-tension driven from below and the outflow of adiabaticallycooling fluids at essentially hydrostatic pressure. The cup-shaped ore shell at Bingham Canyon (Fig. 10) is probably lo-calized by a limited window of pressure and temperature con-ditions, in which metal precipitation is maximized (seeLandtwing et al., 2005, 2010).
Once the deep pressure front is dissipated by fluiddrainage, the system recovers by collapse and limited con-traction as far as the added volume of vein mineral permits.The rock mass thereby relaxes toward the near-neutral stressstate (1), in which the small far-field predominance of hori-zontal σ1 over σ3 prevails. At the same time, remaining porespace is filled by cooling aqueous fluid if the dynamic vaporplume had temporally created vapor-static conditions. Thepreferentially northeast-trending quartz-pyrite veins associ-ated with feldspar-destructive alteration (Fig. 12-6) are inter-preted to result from shear failure as a result of a last, waningstage of magmatic fluid pressure buildup, as the fluid sourcebecame exhausted and the solidus region of the magmachamber had retracted to greater depth.
ConclusionsStructural observations on the evolving dike and vein
geometry of the Bingham Canyon Cu-Mo-Au system indicatethat the typical concentrically zoned “ore shell” of porphyry-type ore deposits is a result of rock extension ahead of a broadfluid pressure front driven by a deep hydrous magma cham-ber. Key evidence is the broad vein network extending wellbeyond the apparently coeval porphyry stocks and dikes andthe highly variable strike directions of predominantly steepmineralizing stockwork veins.
Our concept of pressure-driven wall-rock extension differsfrom the classical concept of Burnham (1979), according towhich porphyry ore shells are generated primarily by hy-draulic fracturing of the carapace of a stock or cupola in theroof of an intrusion, triggered by the positive volume changeupon crystallization of hydrous melt to rock + fluid (Burn-ham and Ohmoto, 1980). Our concept also modifies themodel of Fournier (1999), in which the fracturing front isprimarily controlled by the brittle to ductile transition as afunction of rock temperature. The latter does not match ob-servations at Bingham Canyon, where the majority of multi-ple vein sets formed by brittle extensional fracturing. Themodel of fluid pressure-driven rock extension matches ob-servations from areas of active magmatic-hydrothermal uplift(Bodnar et al., 2007) and geologic features of other big por-phyry copper systems. For example, it may resolve the ap-parently conflicting views published on the giant copper de-posits of central Chile. As the biggest of them all, ElTeniente has every characteristic of a giant porphyry Cu-Modeposit (Cannell et al., 2005; Klemm et al., 2007) but alsoshows clear evidence that exceptionally intense fracturing,potassic alteration, and high-grade Cu-Mo mineralization ex-tended far beyond the likely zone of influence of compara-tively small porphyry dikes and stocks (Skewes et al., 2002).This observation does not call for a special type of depositbut can be readily explained by extension above a broad fluid
86 GRUEN ET AL.
0361-0128/98/000/000-00 $6.00 86

pressure front, sourced in a large deep-seated intrusion assuggested by both Skewes et al. (2002) and Cannell et al.(2005). The model is also consistent with the very fast rate ofporphyry mineralization estimated from alteration kineticsby Cathles and Shannon (2007).
The difference between pressure-driven wall-rock exten-sion and previous concepts has economic significance forhigh-grade metal enrichment. The concepts of Burnham(1979) and Fournier (1999) predicted that the zone of ore de-position migrates downward as a result of overall cooling of aporphyry stock or a cupola in the roof of a magma chamber.This implies that an amount of ore metals contributed by agiven amount of fluid would be “smeared out” over a consid-erable vertical distance, which reduces the final ore grade inthe rock. By contrast, the site of vein formation and mineral-ization according to our concept can be stabilized in an almoststationary ore shell, by a dynamic balance between deep fluidpressure, the resulting domal or tube-shaped wall-rock exten-sion, and drainage of the magmatic fluid upward and outwardinto the hydrostatic fluid domain.
AcknowledgmentsThis paper is the second in a series of papers, as part of an
ongoing study of ore-forming magmatic-hydrothermal processesin the giant Bingham Canyon deposit. It would not have beenpossible without the collaboration with Kennecott Utah Cop-per (KUC), a subsidiary of Rio Tinto. Geoff Ballantyne, GerryAustin, and the late Ricardo Presnell contributed actively inproviding present mining data. Discussions with ThomasDriesner, Marco Einaudi, Stephen Cox, Larry Cathles, JohnDilles, and Dick Tosdal gave important new insights. Specialthanks to the Bingham Canyon geology staff and Bob Moorefor kindly hosting, teaching, and guiding us at the mine. Com-ments by David Cooke, John Proffett, Stephen Cox, and ananonymous reviewer greatly helped to improve the paper.Continued financial support by ETH Zurich and the SwissNational Science Foundation (Proect 200020-116693) isgratefully acknowledged.
REFERENCESAndré, A.S., Sausse, J., and Lespinasse, M., 2001, New approach for the
quantification of paleostress magnitudes: Application to the Soultz vein sys-tem (Rhine graben, France): Tectonophysics, v. 336, p. 215−231.
Annen, C., and Sparks, R.S.J., 2002, Effects of repetitive emplacement ofbasaltic intrusions on thermal evolution and melt generation in the crust:Earth and Planetary Science Letters, v. 203, p. 937−955.
Atkinson, W.W., and Einaudi, M.T., 1978, Skarn formation and mineraliza-tion in contact aureole at Carr Fork, Bingham, Utah: ECONOMIC GEOLOGY,v. 73, p. 1326−1365.
Audétat, A., Günther, D., and Heinrich, C.A., 1998, Formation of a mag-matic-hydrothermal ore deposit: Insights with LA-ICP-MS analysis of fluidinclusions: Science, v. 279, p. 2091−2094.
Babcock, R.C., Ballantyne, G.H., and Phillips, C.H., 1995, Summary of thegeology of the Bingham District, Utah: Arizona Geological Society Digest,v. 20, p. 316−335.
Beane, R.E., and Titley, S.R., 1981, Porphyry copper deposits. Part II. Hy-drothermal alteration and mineralization: ECONOMIC GEOLOGY 75TH AN-NIVERSARY VOLUME, p. 235−269.
Berger, B.R., and Bethke, P.M., 1985, Geology and geochemistry of epi-thermal systems: Society of Economic Geologists, Reviews in EconomicGeology, v. 2, 298 p.
Bodnar, R.J., Cannatelli, C., de Vivo, B., Lima, A., Belkin, H.E., and Milia,A., 2007, Quantitative model for magma degassing and ground deformation(bradyseism) at Campi Flegrei, Italy: Implications for future eruptions: Ge-ology, v. 35, p. 791−794.
Bonafede, M., 1991, Hot fluid migration—an efficient source of ground de-formation—application to the 1982−1985 crisis at Campi Flegrei-Italy:Journal of Volcanology and Geothermal Research, v. 48, p. 187−198.
Boutwell, J.M., Keith, A., and Emmons, S.F., 1905, Economic geology of theBingham mining district, Utah, with a section on areal geology, and an in-troduction on general geology: U.S. Geological Survey Professional Paper38, 413 p.
Bryant, B., 1988, Geology of the Farmington Canyon complex, WasatchMountains, Utah: U.S. Geological Survey Professional Paper 1476, 54 p.
Bryant, B., and Nichols, D.J., 1988, Late Mesozoic and early Tertiary reacti-vation of an ancient crustal boundary along the Uinta trend and its interac-tion with the Sevier orogenic belt: Geological Society of America Memoir171, p. 411−429.
Burnham, C.W., 1979, Magmas and hydrothermal fluids, in Barnes, H.L.,ed., Geochemistry of hydrothermal ore deposits, v. 2: New York, JohnWiley and Sons, p. 71−136.
Burnham, C.W., and Ohmoto, H., 1980, Late-stage processes of felsic mag-matism: Mining Geology Special Issue, no. 8, p. 1−11.
Cannell, J., Cooke, D.R., Walshe, J.L., and Stein, H., 2005, Geology, miner-alization, alteration, and structural evolution of the El Teniente porphyryCu-Mo deposit: ECONOMIC GEOLOGY, v. 100, p. 979−1003.
Cappa, F., Rutqvist, J., and Yamamoto, K., 2009, Modeling crustal deforma-tion and rupture processes related to upwelling of deep CO2−rich fluidsduring the 1965−1967 Matsushiro earthquake swarm in Japan: Journal ofGeophysical Research-Solid Earth, v. 114, article no. B10304.
Carten, R.B., Geraghty, E.P., Walker, B.M., and Shannon, J.R., 1988, Cyclicdevelopment of igneous features and their relationship to high-tempera-ture hydrothermal features in the Henderson porphyry molybdenum de-posit, Colorado: ECONOMIC GEOLOGY, v. 83, p. 266−296.
Cathles, L.M., and Shannon, R., 2007, How potassium silicate alteration sug-gests the formation of porphyry ore deposits begins with the nearly explo-sive but barren expulsion of large volumes of magmatic water: Earth andPlanetary Science Letters, v. 262, p. 92−108.
Constenius, K.N., 1996, Late Paleogene extensional collapse of theCordilleran foreland fold and thrust belt: Geological Society of AmericaBulletin, v. 108, p. 20−39.
Cook, S.J., and Bowman, J.R., 2000, Mineralogical evidence for fluid-rock in-teraction accompanying prograde contact metamorphism of siliceousdolomites: Alta stock aureole, Utah, USA: Journal of Petrology, v. 41, p.739−757.
Cox, S., in press, The application of failure mode diagrams for exploring theroles of fluid pressure and stress states in controlling styles of fracture-con-trolled permeability enhancement in faults and shear zones: Geofluids.
Cox, S.F., Knackstedt, M.A., and Braun, J., 2001, Principles of structural con-trol on permeability and fluid flow in hydrothermal systems: Reviews inEconomic Geology, v. 14, p. 1−24.
Cunningham, C.G., Austin, G.W., Naeser, C.W., Rye, R.O., Ballantyne, G.H.,Stamm, R.G., and Barker, C.E., 2004, Formation of a paleothermal anom-aly and disseminated gold deposits associated with the Bingham Canyonporphyry Cu-Au-Mo system, Utah: ECONOMIC GEOLOGY, v. 99, p. 789−806.
Deino, A., and Keith, J.D., 1998, Ages of volcanic and intrusive rocks in theBingham mining district, Utah: Society of Economic Geologists GuidebookSeries, v. 29, p. 91−100.
Delaney, P.T., Pollard, D.D., Ziony, J.I., and McKee, E.H., 1986, Field rela-tions between dikes and joints—emplacement processes and paleostressanalysis: Journal of Geophysical Research-Solid Earth and Planets, v. 91, p.4920−4938.
Dilles, H.J., 1987, Petrology of the Yerington batholith, Nevada: Evidence forevolution of porphyry copper ore fluids: ECONOMIC GEOLOGY, v. 82, p.1750−1789.
Dzurisin, D., Lisowski, M., and Wicks, C.W., 2009, Continuing inflation atThree Sisters volcanic center, central Oregon Cascade Range, USA, fromGPS, leveling, and InSAR observations: Bulletin of Volcanology, v. 71, p.1091−1110.
Einaudi, M.T., 1992, Ore deposits in the Oquirrh and Wasatch Mountains,Utah—examples of large-scale water-rock interaction: Water-Rock Interac-tion, v. 1 and 2, p. 879−883.
——1997, Mapping altered and mineralized rocks: An introduction to theAnaconda method: Stanford, CA, Stanford University.
——2000, Skarns of the Yerington district, Nevada: A trip log and commen-tary: Society of Economic Geologists Guidebook Series, v. 32, p. 101−126.
English, J.M., and Johnston, S.T., 2004, The Laramide orogeny: What werethe driving forces?: International Geology Review, v. 46, p. 833−838.
THE BINGHAM CANYON PORPHYRY Cu-Mo-Au DEPOSIT: VEIN GEOMETRY & ORE SHELL FORMATION 87
0361-0128/98/000/000-00 $6.00 87

Fournier, R.O., 1983, A method of calculating quartz solubilities in aqueoussodium-chloride solutions: Geochimica et Cosmochimica Acta, v. 47, p.579−586.
——1999, Hydrothermal processes related to movement of fluid from plas-tic into brittle rock in the magmatic-epithermal environment: ECONOMICGEOLOGY, v. 94, p. 1193−1211.
Gruen, G., 2007, Distribution and orientation of veins in the BinghamCanyon porphyry Cu-Mo-Au deposit, Utah: Unpublished M.Sc. thesis,Switzerland, ETH Zurich, 123 p.
Gustafson, L.B., and Hunt, J.P., 1975, The porphyry copper deposit at El-Sal-vador, Chile: ECONOMIC GEOLOGY, v. 70, p. 857−912.
Heidrick, T.L., and Titley, S.R., 1982, Fracture and dike patterns in Laramideplutons and their structural and tectonic implications: American southwest, inTitley, S.R., ed.Advances in geology of the porphyry copper deposits, south-western North America: Tucson, AZ, University of Arizona Press, p. 73−91.
Hurwitz, S., Christiansen, L.B., and Hsieh, P.A., 2007, Hydrothermal fluidflow and deformation in large calderas: Inferences from numerical simula-tions: Journal of Geophysical Research-Solid Earth, v. 112, article no.B02206.
Hutnak, M., Hurwitz, S., Ingebritsen, S.E., and Hsieh, P.A., 2009, Numeri-cal models of caldera deformation: Effects of multiphase and multicompo-nent hydrothermal fluid flow: Journal of Geophysical Research-SolidEarth, v. 114, article no. B04411.
Jagoutz, O., Muntener, O., Ulmer, P., Pettke, T., Burg, J.P., Dawood, H., andHussain, S., 2007, Petrology and mineral chemistry of lower crustal intru-sions: the Chilas Complex, Kohistan (NW Pakistan): Journal of Petrology, v.48, p. 1895−1953.
John, D.A., 1989, Geologic setting, depths of emplacement, and regional dis-tribution of fluid inclusions in intrusions of the Central Wasatch Moun-tains, Utah: ECONOMIC GEOLOGY, v. 84, p. 386−409.
——1998, Geologic setting and characteristics of mineral deposits in the cen-tral Wasatch Mountains, Utah: Society of Economic Geologists GuidebookSeries, v. 29, p. 11−33.
John, E.C., 1978, Mineral zones in the Utah copper orebody: ECONOMIC GE-OLOGY, v. 73, p. 1250−1259.
Jolly, R.J.H., and Sanderson, D.J., 1997, A Mohr circle construction for theopening of a pre-existing fracture: Journal of Structural Geology, v. 19, p.887−892.
Karlstrom, K.E., Whitmeyer, S.J., Dueker, K., Williams, M.L., Levander, A.,Humphreys, G., Keller, G.R., and Group, C.-R.W., 2005, 4−D image of thelithosphere beneath the Rocky Mountains and implications for under-standing the evolution of continental lithosphere: Geophysical Monograph,v. 154, 482 p.
Kelly, W.C., and Rye, R.O., 1979, Geologic, fluid Inclusion, and stable iso-tope studies of the tin-tungsten deposits of Panasqueira, Portugal: ECO-NOMIC GEOLOGY, v. 74, p. 1721−1822.
Klemm, L.M., Pettke, T., Heinrich, C.A., and Campos, E., 2007, Hydrother-mal evolution of the El Teniente deposit, Chile: Porphyry Cu-Mo ore de-position from low-salinity magmatic fluids: ECONOMIC GEOLOGY, v. 102, p.1021−1045.
Landtwing, M.R., 2004, Fluid evolution and ore mineral precipitation at theBingham porphyry Cu-Au-Mo deposit, Utah, deduced from cathodolumi-nescence imaging and LA-ICPMS microanalysis of fluid inclusions: Un-published Ph.D. thesis, Switzerland, ETH Zurich, 260 p.
Landtwing, M.R., Pettke, T., Halter, W.E., Heinrich, C.A., Redmond, P. B.,Einaudi, M.T., and Kunze, K., 2005, Copper deposition during quartz dis-solution by cooling magmatic-hydrothermal fluids: The Bingham porphyry:Earth and Planetary Science Letters, v. 235, p. 229−243.
Landtwing, M.R., Furrer, C., Pettke, T., Guillong, M., and Heinrich, C.A.,2010, The Bingham Canyon porphyry Cu-Mo-Au deposit: III. Zoned cop-per-gold ore deposition by magmatic vapor expansion: ECONOMIC GEOL-OGY, v. 105, p. 91–118.
Lanier, G., John, E.C., Swensen, A.J., Reid, J., Bard, C.E., Caddey, S.W., andWilson, J.C., 1978, General geology of the Bingham mine, BinghamCanyon, Utah: ECONOMIC GEOLOGY, v. 73, p. 1228−1241.
Lima, A., de Vivo, B., Spera, F.J., Bodnar, R.J., Milia, A., Concettina, N.,Belkin, H.E., and Cannatelli, C., 2009, Thermodynamic model for uplift anddeflation episodes (bradyseism) associated with magmatic-hydrothermal ac-tivity at the Campi Flegrei (Italy): Earth-Science Reviews, v. 97, p. 44−58.
Mardia, K.V., 1975, Statistics of directional data: Journal of the Royal Statis-tical Society, Series B: Methodological, v. 37, p. 349−393.
Maughan, D.T., Keith, J.D., Christiansen, E.H., Pulsipher, T., Hattori, K.,and Evans, N.J., 2002, Contributions from mafic alkaline magmas to the
Bingham porphyry Cu-Au-Mo deposit, Utah, USA: Mineralium Deposita,v. 37, p. 14–37.
Melker, M.D., and Geissman, J.W., 1998, Paleomagnetism of the OquirrhMountains and implications for the Cenozoic structural history of the east-ernmost Great Basin: Society of Economic Geologists Guidebook Series, v.29, p. 101−112.
Nakamura, K., 1977, Volcanos as possible indicators of tectonic stress orien-tation—principle and proposal: Journal of Volcanology and GeothermalResearch, v. 2, p. 1−16.
Parry, W.T., Wilson, P. N., and Bruhn, R.L., 1988, Pore-fluid chemistry andchemical-reactions on the Wasatch normal-fault, Utah: Geochimica et Cos-mochimica Acta, v. 52, p. 2053−2063.
Parry, W.T., Jasumback, M., and Wilson, P. N., 2002, Clay mineralogy of phyl-lic and intermediate argillic alteration at Bingham, Utah: ECONOMIC GE-OLOGY, v. 97, p. 221−239.
Phillips, C.H., Smith, T.W., and Harrison, E.D., 1998, Alteration, metal zon-ing, and ore controls in the Bingham Canyon porphyry copper deposits,Utah: Society of Economic Geologists Guidebook Series, v. 29, p. 133−145.
Presnell, R.D., 1992, Geology and geochemistry of the Barneys Canyon golddeposit, Salt Lake County, Utah: Unpublished Ph.D. thesis, Salt Lake City,UT, University of Utah, 363 p.
——1998, Structural controls on the plutonism and metallogeny in theWasatch and Oquirrh Mountains, Utah: Society of Economic GeologistsGuidebook Series, v. 29, p. 1−9.
Presnell, R.D., and Parry, W.T., 1995, Evidence of Jurassic tectonism in theOquirrh Mountains from the Barneys Canyon gold deposit: Geological So-ciety of America Special Paper 299, p. 313−326.
Redmond, P.B., 2002, Magmatic-hydrothermal fluids and copper-gold oreformation at Bingham Canyon, Utah: Unpublished Ph.D. thesis, Stanford,CA, Stanford University, 228 p.
Redmond, P.B., and Einaudi, M.T., 2010, The Bingham Canyon porphyryCu-Mo-Au deposit: I. Sequence of intrusion, vein formation, and sulfidedeposition: ECONOMIC GEOLOGY, v. 105, p. 43–68.
Redmond, P.B., Landtwing, M.R., and Einaudi, M.T., 2001, Cycles of por-phyry dike emplacement, veining, alteration and mineralization in theBingham porphyry Cu-Au-Mo deposit, Utah: Mineral Deposits at the Be-ginning of the 21st Century, Joint Biennial SGA-SEG Meeting, 6th, Krakow,Poland, August, 2001, Proceedings, p. 473−476.
Redmond, P. B., Einaudi, M.T., and Landtwing, M.R., 2002, Cyclical P-T-Xevolution of magmatic-hydrothermal fluids in the Bingham porphyry Cu-Au-Mo deposit, Utah: Geological Society of America paper 82-12.
Redmond, P.B., Einaudi, M.T., Inan, E.E., Landtwing, M.R., and Heinrich,C.A., 2004, Copper deposition by fluid cooling in intrusion-centered sys-tems: New insights from the Bingham porphyry ore deposit, Utah: Geology,v. 32, p. 217−220.
Richards, J.P., 2003, Tectono-magmatic precursors for porphyry Cu-(Mo-Au)deposit formation: ECONOMIC GEOLOGY, v. 98, p. 1515−1533.
Robin, P.Y.F., and Jowett, E.C., 1986, Computerized density contouring andstatistical evaluation of orientation data using counting circles and continu-ous weighting functions: Tectonophysics, v. 121, p. 207−223.
Rohrlach, B.D., and Loucks, R.R., 2005, Multi-million-year cyclic ramp-upof volatiles in a lower crustal magma reservoir trapped below the Tampakancopper-gold deposit by Mio-Pliocene crustal compression in the southernPhilippines, in Porter, T.M., ed., Super porphyry copper and gold deposits:A global perspective, v. 2: Adelaide, PGC Publishing, 43 p.
Rohrlach, B.D., Loucks, R.R., and Palin, J.M., 2003, Isochoric ascent oflithostatically-pressured, dense magmatic vapor during gold-enargite oreformation: Geochimica et Cosmochimica Acta, v. 67, p. A401.
Rose, A.W., 1970, Zonal relations of wallrock alteration and sulfide distribu-tion at porphyry copper deposits: ECONOMIC GEOLOGY, v. 65, p. 920−936.
Rusk, B.G., and Reed, M.H., 2002, Scanning electron microscope-cathodo-luminescence analysis of quartz reveals complex growth histories in veinsfrom the Butte porphyry copper deposit, Montana: Geology, v. 30, p.727−730.
Sawkins, F.J., 1990, Metal deposits in relation to plate tectonics: Berlin,Springer-Verlag, 461 p.
Sears, J.W., Graff, P.J., and Holden, G.S., 1982, Tectonic evolution of LowerProterozoic rocks, Uinta Mountains, Utah and Colorado: Geological Soci-ety of America Bulletin, v. 93, p. 990−997.
Seedorff, E., Dilles, J.H., Proffett, J.M., Jr., Einaudi, M.T., Zurcher, L.,Stavast, W.J.A., Johnson, D.A., and Barton, M.D., 2005, Porphyry deposits:Characteristics and origin of hypogene features: ECONOMIC GEOLOGY 100TH
ANNIVERSARY VOLUME, p. 251−298.
88 GRUEN ET AL.
0361-0128/98/000/000-00 $6.00 88

Sillitoe, R.H., 1972, Relation of metal provinces in Western America to sub-duction of oceanic lithosphere: Geological Society of America Bulletin, v.83, p. 813−817.
Sillitoe, R.H., 2010, Porphyry copper systems: ECONOMIC GEOLOGY, v. 105,p. 3–41.
Sillitoe, R.H., and Perello, J., 2005, Andean copper province: Tectonomag-matic settings, deposit types, metallogeny, exploration, and discovery: ECO-NOMIC GEOLOGY 100TH ANNIVERSARY VOLUME, p. 845−890.
Simmons, S.F., White, N.C., and John, D.A., 2005, Geological characteristicsof epithermal precious and base metal deposits: ECONOMIC GEOLOGY 100TH
ANNIVERSARY VOLUME, p. 485−522.Skewes, M.A., Arévalo, A., Floody, R., Zuñiga, P. H., and Stern, C.R., 2002,
The giant El Teniente breccia deposit: Hypogene copper distribution andemplacement: Society of Economic Geologists Special Publication 9, p.299−332.
Smith, W.H., 1961, The volcanics of the eastern slopes of the Bingham Dis-trict, Utah: Utah Geological Society Guidebook, p. 101−119.
Stephens, J.R., Mair, J.L., Oliver, N.H.S., Hart, C.J.R., and Baker, T., 2004,Structural and mechanical controls on intrusion-related deposits of theTombstone gold belt, Yukon, Canada, with comparisons to other vein-hostedore-deposit types: Journal of Structural Geology, v. 26, p. 1025−1041.
Swensen, A.J., 1975, Sedimentary and igneous rock of the Bingham district,in Bray, R.E., and Wilson, J.C., eds., Guide Book to the Bingham miningdistrict: Bingham Canyon, UT, United States, Society of Economic Geolo-gists, Kennecott Copper Corp., p. 21−39.
Titley, S.R., 1982, Advances in Geology of the Porphyry Copper Deposits,Southwestern North America: Tucson, AZ, United States, University of Ari-zona Press, 560 p.
Titley, S.R., 2001, Crustal affinities of metallogenesis in the American South-west: ECONOMIC GEOLOGY, v. 96, p. 1323−1342.
Todesco, M., Rutqvist, J., Chiodini, G., Pruess, K., and Oldenburg, C.I.M.,2004, Modeling of recent volcanic episodes at Phlegrean Fields (Italy):Geochemical variations and ground deformation: Geothermics, v. 33, p.531−547.
Tooker, E.W., Roberts, R.J., Gordon, M.J., and Duncan, H.M., 1970, UpperPaleozoic rocks in the Oquirrh Mountains and Bingham mining district,Utah, with a section on biostratigraphy and correlation, U.S. GeologicalSurvey Professional Paper 629−A, p. A1−A76.
Tosdal, R.M., and Richards, J.P. , 2001, Magmatic and structural controls onthe development of porphyry Cu ± Mo ± Au deposits: Reviews in Eco-nomic Geology, v. 14, p. 157−181.
Townend, J., and Zoback, M.D., 2000, How faulting keeps the crust strong:Geology, v. 28, p. 399−402.
Ulrich, T., Günther, D., and Heinrich, C.A., 2001, The evolution of a por-phyry Cu-Au deposit, based on LA-ICP-MS analysis of fluid inclusions:Bajo de la Alumbrera, Argentina: ECONOMIC GEOLOGY, v. 96, p.1743−1774.
Waite, K.A., Keith, J.D., Christiansen, E.H., Whitney, J.A., Hattori, K.,Tingey, D.G., and Hook, C.J., 1998, Petrogenesis of the volcanic and intru-sive rocks associated with the Bingham Canyon porphyry Cu-Au-Mo de-posit, Utah: Society of Economic Geologists Guidebook Series, v. 29, p.69−90.
Warnaars, F.W., Smith, W.H., Bray, R.E., Lanier, G., and Shafiqullah, M.,1978, Geochronology of igneous intrusions and porphyry copper mineral-ization at Bingham, Utah: ECONOMIC GEOLOGY, v. 73, p. 1242−1249.
Williams-Jones, A.E., and Heinrich, C.A., 2005, Vapor transport of metalsand the formation of magmatic-hydrothermal ore deposits: ECONOMIC GE-OLOGY, v. 100, p. 1287−1312.
Zoback, M.L., 1983, Structure and Cenozoic tectonism along the Wasatchfault zone, Utah: Geological Society of America Memoirs 157, p. 3−27.
THE BINGHAM CANYON PORPHYRY Cu-Mo-Au DEPOSIT: VEIN GEOMETRY & ORE SHELL FORMATION 89
0361-0128/98/000/000-00 $6.00 89
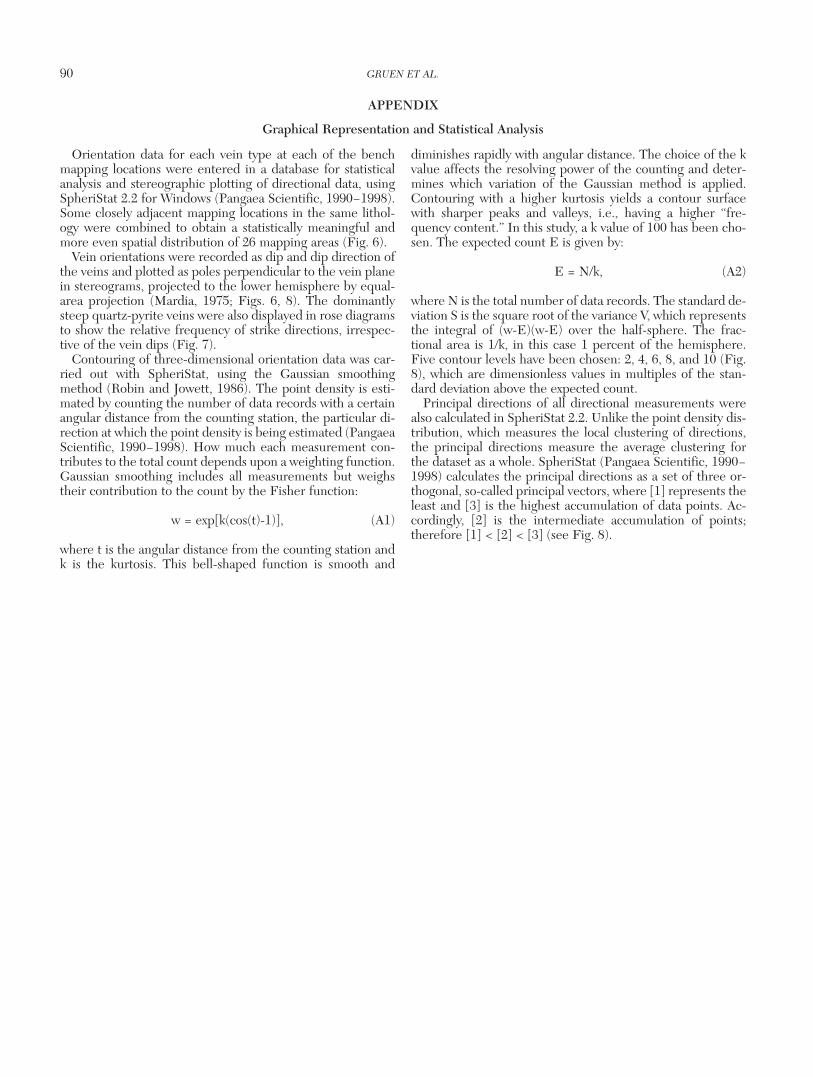
Orientation data for each vein type at each of the benchmapping locations were entered in a database for statisticalanalysis and stereographic plotting of directional data, usingSpheriStat 2.2 for Windows (Pangaea Scientific, 1990−1998).Some closely adjacent mapping locations in the same lithol-ogy were combined to obtain a statistically meaningful andmore even spatial distribution of 26 mapping areas (Fig. 6).
Vein orientations were recorded as dip and dip direction ofthe veins and plotted as poles perpendicular to the vein planein stereograms, projected to the lower hemisphere by equal-area projection (Mardia, 1975; Figs. 6, 8). The dominantlysteep quartz-pyrite veins were also displayed in rose diagramsto show the relative frequency of strike directions, irrespec-tive of the vein dips (Fig. 7).
Contouring of three-dimensional orientation data was car-ried out with SpheriStat, using the Gaussian smoothingmethod (Robin and Jowett, 1986). The point density is esti-mated by counting the number of data records with a certainangular distance from the counting station, the particular di-rection at which the point density is being estimated (PangaeaScientific, 1990−1998). How much each measurement con-tributes to the total count depends upon a weighting function.Gaussian smoothing includes all measurements but weighstheir contribution to the count by the Fisher function:
w = exp[k(cos(t)-1)], (A1)
where t is the angular distance from the counting station andk is the kurtosis. This bell-shaped function is smooth and
diminishes rapidly with angular distance. The choice of the kvalue affects the resolving power of the counting and deter-mines which variation of the Gaussian method is applied.Contouring with a higher kurtosis yields a contour surfacewith sharper peaks and valleys, i.e., having a higher “fre-quency content.” In this study, a k value of 100 has been cho-sen. The expected count E is given by:
E = N/k, (A2)
where N is the total number of data records. The standard de-viation S is the square root of the variance V, which representsthe integral of (w-E)(w-E) over the half-sphere. The frac-tional area is 1/k, in this case 1 percent of the hemisphere.Five contour levels have been chosen: 2, 4, 6, 8, and 10 (Fig.8), which are dimensionless values in multiples of the stan-dard deviation above the expected count.
Principal directions of all directional measurements werealso calculated in SpheriStat 2.2. Unlike the point density dis-tribution, which measures the local clustering of directions,the principal directions measure the average clustering forthe dataset as a whole. SpheriStat (Pangaea Scientific, 1990−1998) calculates the principal directions as a set of three or-thogonal, so-called principal vectors, where [1] represents theleast and [3] is the highest accumulation of data points. Ac-cordingly, [2] is the intermediate accumulation of points;therefore [1] < [2] < [3] (see Fig. 8).
90 GRUEN ET AL.
0361-0128/98/000/000-00 $6.00 90
APPENDIX
Graphical Representation and Statistical Analysis