Embed Size (px)
Citation preview

THE BHP AIRBORNE TEM AND MAGNETIC SURVEY (1996)over the GALMOY AREA

Department of the Marine and Natural Resources
THE BHP AIRBORNE TEM AND MAGNETIC SURVEY (1996)over the GALMOY AREA
Compiled byOrla Dardis
EXPLORATION AND MINING DIVISIONMINERALS PUBLICATION MP 11/01
AUGUST 2001
Exploration and Mining Division 2001Published by authority of the Minister for the Marine
and Natural Resources

TABLE OF CONTENTS
INTRODUCTION________________________________________________________ 1
Figure 1. Location of the survey area on a simplified geology map of Ireland. ___ 2
Figure 2. Galmoy survey area on a 1:250,000 Ordnance Survey base. _________ 3
SURVEY EQUIPMENT AND SPECIFICATIONS______________________________ 4
PROCESSING OVERVIEW AND MAP GENERATION ________________________ 5
Magnetics Processing Sequence ___________________________________________ 5
Electromagnetics Processing Sequence______________________________________ 5
Grid and Map Generation ________________________________________________ 5
DATA LISTING _________________________________________________________ 6
Parameter table files ____________________________________________________ 6
Geosoft polygon file of survey boundary ____________________________________ 6
Databases_____________________________________________________________ 6
Processed GEOTEM and Magnetic Data (Geosoft GDB)____________________ 6
Raw GEOTEM Data (ASCII XYZ) _____________________________________ 7
Grids ________________________________________________________________ 7
Maps ________________________________________________________________ 7
Supplied by BHP ___________________________________________________ 7
Supplied by EMD on Ordnance Survey base______________________________ 7
Company reports _______________________________________________________ 8
ASCII RAW TEM DATABASE CHANNEL LISTING __________________________ 9
GEOSOFT DATABASE CHANNEL LISTING _______________________________ 10

1
INTRODUCTION
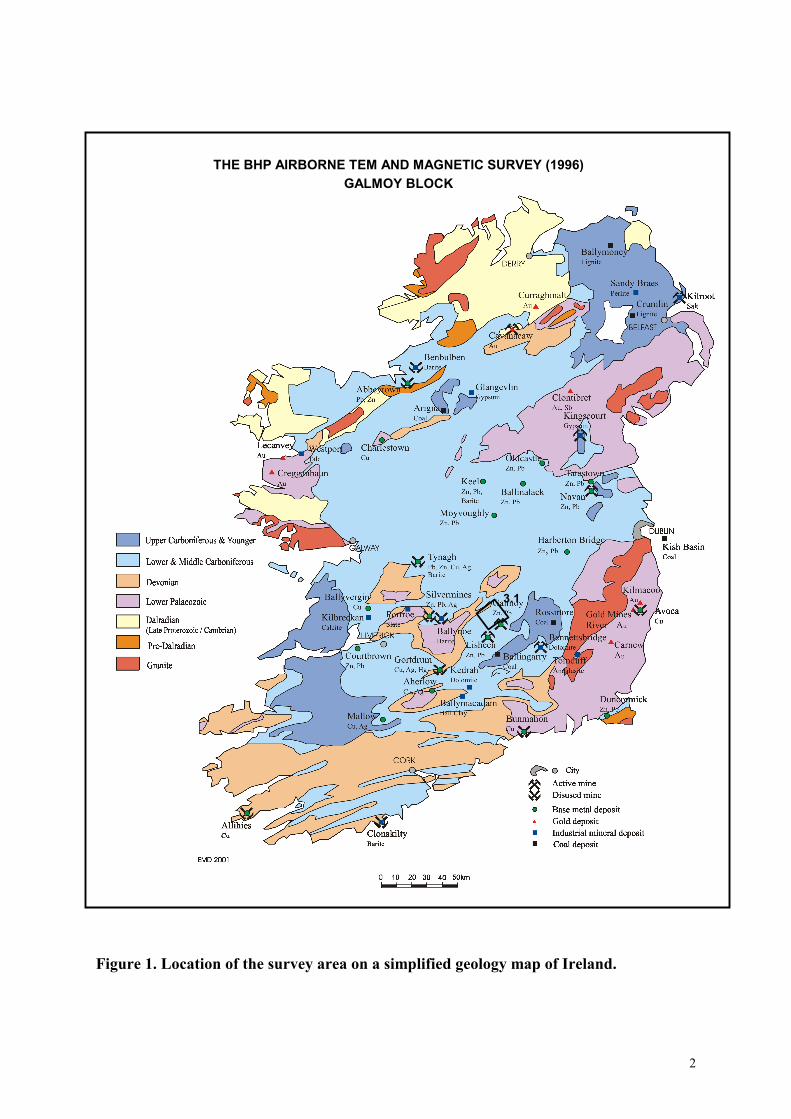
In July 1996 BHP Minerals International Inc. flew a 903 line km magnetic and electromagneticsurvey over a 210 km2 area to the north of Galmoy village which encompases the towns ofRathdowney and Borris-in-Ossory (Figures 1 and 2). This survey is the third in a series of surveys,acquired over four years ago, which are due for public release in fulfilment of the ‘Open Skies’policy of the Exploration and Mining Division (EMD). The Division acknowledges the cooperationof BHP and the assistance of PGW Europe Ltd.
At this time EMD is primarily concerned with prompt data release and no attempt was made toreprocess or correct survey data. Data is released as submitted and no liability is accepted on the partof the EMD for data quality or accuracy. However, to facilitate ease of use, several grids are providedwith an Ordnance Survey base map for ease of geographical reference.
Geoterrex conducted the survey using a towed bird magnetometer and the GEOTEM dual-coilelectromagnetic system. This consists of 2 receiver coils, the x-coil axis along flight direction and avertical z-coil axis.
Time domain electromagnetic (TDEM), magnetic, radar altimeter and navigation data was acquiredduring the survey. All processing was carried out by Geoterrex, which is now part of Fugro AirborneSurveys.
No logistics and processing report was submitted with the data, but the survey specifications, anddata acquisition and processing procedures used, appear the same as those used for the BHP 1995survey over the Lisheen/Galmoy, Clonmel and Tullamore areas (see publication entitled “The BHPAirborne TEM and Magnetic Survey (1995) over the Lisheen/Galmoy, Clonmel and TullamoreCentre Areas”. MP 10/01).
A listing of all digital and hardcopy data (databases, grids, maps and company reports) lodged withthe Exploration and Mining Division is included in this publication and outlined below in the datalistings section.
2
Figure 1. Location of the survey area on a simplified geology map of Ireland.
3.1
THE BHP AIRBORNE TEM AND MAGNETIC SURVEY (1996)GALMOY BLOCK

3
Figure 2. Galmoy survey area on a 1:250,000 Ordnance Survey base.

4
SURVEY EQUIPMENT AND SPECIFICATIONS
Flight Line Spacing 250 mFlight Line Direction 146°Tie Line Spacing 2500 mMean Terrain Clearance 120 mNominal Survey Speed 120 knots ( 62 m/s )Total Survey Area 210 km2
Total Line Km 903 line km
Magnetometer Cesium VapourSensitivity 0.00l nTSample Rate 10 samples /secMounting Towed BirdSensor Height above ground 73 m
TEM Receiver Horizontal &TEM Transmitter Vertical axis loopCycle rate 75 HzPulse width 2.082 msecPulse Delay 0.104 msecOff-Time 4.480 msecSample Rate 4 samples/secMounting Towed BirdSensor Height above ground 64 m
Below are the window mean delay times (in milliseconds), from the end of the transmitter pulse, for a75 Hz base frequency as listed in the Geoterrex readme file. The channel numeration was changedfrom previous BHP surveys so that the channel numbers and mean delay times increasecorrespondingly.
em1 -1.953 em11 1.146em2 -1.562 em12 1.407em3 -0.989 em13 1.693em4 -0.416 em14 2.005em5 0.163 em15 2.344em6 0.235 em16 2.709em7 0.365 em17 3.073em8 0.521 em18 3.464em9 0.703 em19 3.88em10 0.912 em20 4.297
BHP/Geoterrex provided no logistics and processing report for this survey. However, it is assumedfrom the Geoterrex readme file that the survey is broadly similar to the BHP 1995 survey (publicationMP 10/01) as the specifications are the same, apart from a change in the EM gate numerationsequence. Also, a grid provided with this survey of the total magnetic field is a merged grid of theLisheen/Galmoy block flown in 1995 and this survey flown in 1996.

5
PROCESSING OVERVIEW AND MAP GENERATION
The information provided in this section was taken from the Geoterrex readme file for the survey(included on CD) and from examination of the data.
Magnetics Processing Sequence
A system lag correction of 3.7 seconds was applied followed by noise editing (de-spiking) andfiltering. The long wavelength component (greater than 26 or 40 seconds) of the diurnal field wassubtracted from the data. The data was then microleveled; probably using proprietary software. Theregional magnetic field (IGRF) was removed from the data and an IGRF channel is present in thedatabase. The data was not decultured as is evident from the survey results when superimposed on anOrdnance Survey base map.
Electromagnetics Processing Sequence
A system lag correction of 4.5 secs was applied followed by drift corrections to the off-time channels5 to 20 and on-time channel 1. Each EM transient decay curve was de-spiked, the data was noisefiltered, smoothed and then resampled to 5 samples per second. No corrections for flight directionasymmetry (de-herringboning) were applied.
EM Decay Constant Calculation
The EM early to middle time decay constant was calculated from the z-coil data by fitting channels 9to 17 (approx. 0.703 – 3.073 msec) to a single exponential function; the middle to late decay constantwas calculated from the x-coil channels 13 to 20 (approx. 1.693 – 4.297 msec). A slow rate of decaygives a high decay constant which indicates a better conductor. The errors in fitting the exponentialfunction to the decay curve are included as channels in the database.
EM Anomaly Selection
No hardcopy anomaly maps or anomaly listings in digital form were provided. However, the BHPIreland Zinc Program Geophysics report for the survey contains a listing and description of somepossible bedrock anomalies and associated ground follow-up data.
Grid and Map Generation
Grids were supplied in Geosoft GRD format. As gridding algorithms have improved significantlysince 1995, the TMI grid was re-gridded by the EMD. The grid was produced from the PRO_MAGchannel in the database using a minimum curvature routine and is identified by an ‘emd’ in thefilename. For all grids, a grid cell size of 20% of the survey line spacing (50m) was used.
The original BHP grids were used to generate the decay constant maps on an Ordnance Survey base.However, the TMI map was compiled using the TMI grid generated in the EMD from the final
6
processed magnetics database channel. Maps submitted by BHP with the title ‘TMI Drape’ are thesun illuminated / colour shaded total magnetic field images.
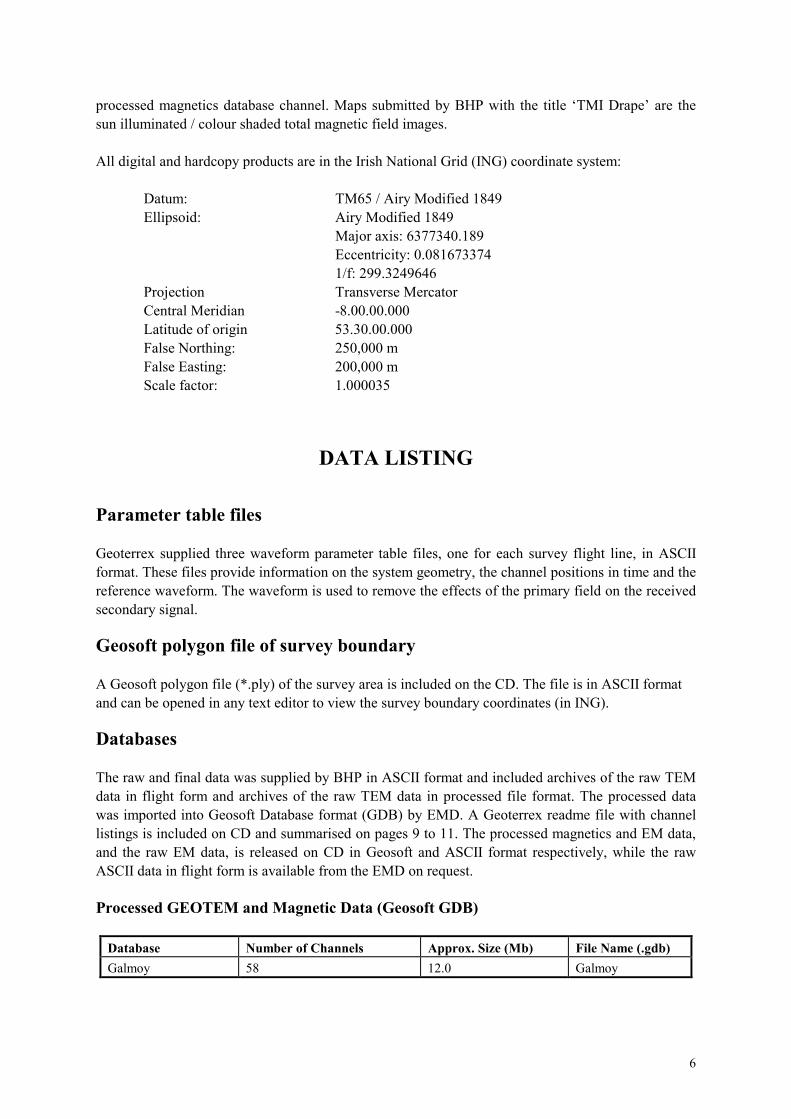
All digital and hardcopy products are in the Irish National Grid (ING) coordinate system:
Datum: TM65 / Airy Modified 1849Ellipsoid: Airy Modified 1849
Major axis: 6377340.189Eccentricity: 0.0816733741/f: 299.3249646
Projection Transverse MercatorCentral Meridian -8.00.00.000Latitude of origin 53.30.00.000False Northing: 250,000 mFalse Easting: 200,000 mScale factor: 1.000035
DATA LISTING
Parameter table files
Geoterrex supplied three waveform parameter table files, one for each survey flight line, in ASCIIformat. These files provide information on the system geometry, the channel positions in time and thereference waveform. The waveform is used to remove the effects of the primary field on the receivedsecondary signal.
Geosoft polygon file of survey boundary
A Geosoft polygon file (*.ply) of the survey area is included on the CD. The file is in ASCII formatand can be opened in any text editor to view the survey boundary coordinates (in ING).
Databases
The raw and final data was supplied by BHP in ASCII format and included archives of the raw TEMdata in flight form and archives of the raw TEM data in processed file format. The processed datawas imported into Geosoft Database format (GDB) by EMD. A Geoterrex readme file with channellistings is included on CD and summarised on pages 9 to 11. The processed magnetics and EM data,and the raw EM data, is released on CD in Geosoft and ASCII format respectively, while the rawASCII data in flight form is available from the EMD on request.
Processed GEOTEM and Magnetic Data (Geosoft GDB)
Database Number of Channels Approx. Size (Mb) File Name (.gdb)Galmoy 58 12.0 Galmoy
7
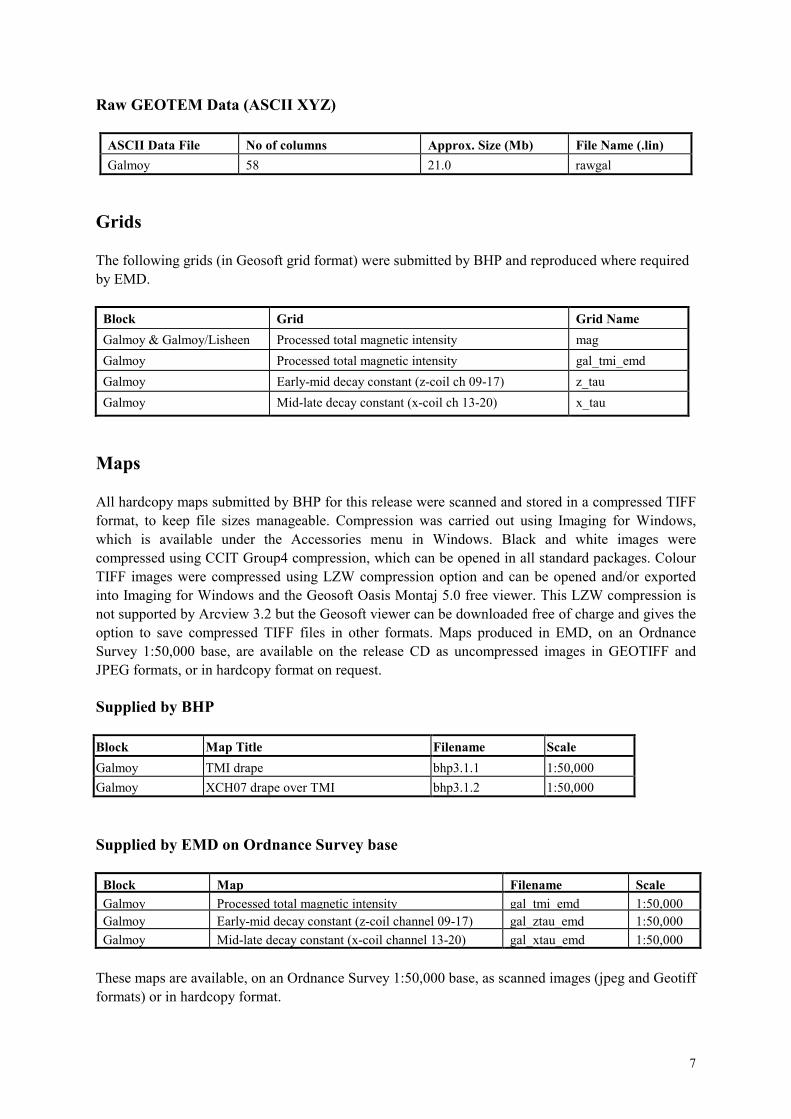
Raw GEOTEM Data (ASCII XYZ)
ASCII Data File No of columns Approx. Size (Mb) File Name (.lin)Galmoy 58 21.0 rawgal
Grids
The following grids (in Geosoft grid format) were submitted by BHP and reproduced where requiredby EMD.
Block Grid Grid NameGalmoy & Galmoy/Lisheen Processed total magnetic intensity magGalmoy Processed total magnetic intensity gal_tmi_emdGalmoy Early-mid decay constant (z-coil ch 09-17) z_tauGalmoy Mid-late decay constant (x-coil ch 13-20) x_tau
Maps
All hardcopy maps submitted by BHP for this release were scanned and stored in a compressed TIFFformat, to keep file sizes manageable. Compression was carried out using Imaging for Windows,which is available under the Accessories menu in Windows. Black and white images werecompressed using CCIT Group4 compression, which can be opened in all standard packages. ColourTIFF images were compressed using LZW compression option and can be opened and/or exportedinto Imaging for Windows and the Geosoft Oasis Montaj 5.0 free viewer. This LZW compression isnot supported by Arcview 3.2 but the Geosoft viewer can be downloaded free of charge and gives theoption to save compressed TIFF files in other formats. Maps produced in EMD, on an OrdnanceSurvey 1:50,000 base, are available on the release CD as uncompressed images in GEOTIFF andJPEG formats, or in hardcopy format on request.
Supplied by BHP
Block Map Title Filename ScaleGalmoy TMI drape bhp3.1.1 1:50,000Galmoy XCH07 drape over TMI bhp3.1.2 1:50,000
Supplied by EMD on Ordnance Survey base
Block Map Filename ScaleGalmoy Processed total magnetic intensity gal tmi emd 1:50,000Galmoy Early-mid decay constant (z-coil channel 09-17) gal_ztau_emd 1:50,000Galmoy Mid-late decay constant (x-coil channel 13-20) gal_xtau_emd 1:50,000
These maps are available, on an Ordnance Survey 1:50,000 base, as scanned images (jpeg and Geotiffformats) or in hardcopy format.

8
Company reports
As mentioned previously, no logistics and processing report was submitted with the survey and thereis no interpretation report that deals solely with the Galmoy block area. However, the Galmoy blockresults are discussed in an ‘Ireland Zinc Program Geophysics Report’ along with other areas surveyedby BHP in the following year, 1997. The 1997 report is included in this release although digital datapertaining to the 1997 survey areas, listed below in the report title, will not be available from EMDuntil Sept 2001.
Report Title Filename (.pdf) No. of pages
Ireland Zinc Program Geophysics Report. Geotem surveys over Galmoy,Carrickmacross, Newbridge, Summerhill, Tullamore East and Tullamore West.
bhpr3_1 129

9
ASCII RAW TEM DATABASE CHANNEL LISTING
Galmoy
COLUMN DESCRIPTION UNITS1-8 Line identifier line x 100 + part9-16 Flight number17-24 Fiducial seconds x 1025-32 Easting metres33-40 Northing metres41-48 Em channel X1 ppm49-56 Em channel X2 ppm57-64 Em channel X3 ppm65-72 Em channel X4 ppm73-80 Em channel X5 ppm81-88 Em channel X6 ppm89-96 Em channel X7 ppm97-104 Em channel X8 ppm105-112 Em channel X9 ppm113-120 Em channel X10 ppm121-128 Em channel X11 ppm129-136 Em channel X12 ppm137-144 Em channel X13 ppm145-152 Em channel X14 ppm153-160 Em channel X15 ppm161-168 Em channel X16 ppm169-176 Em channel X17 ppm177-184 Em channel X18 ppm185-192 Em channel X19 ppm193-200 Em channel X20 ppm201-208 Em channel Z1 ppm209-216 Em channel Z2 ppm217-224 Em channel Z3 ppm225-232 Em channel Z4 ppm233-240 Em channel Z5 ppm241-248 Em channel Z6 ppm249-256 Em channel Z7 ppm257-264 Em channel Z8 ppm265-272 Em channel Z9 ppm273-280 Em channel Z10 ppm281-288 Em channel Z11 ppm289-296 Em channel Z12 ppm297-304 Em channel Z13 ppm305-312 Em channel Z14 ppm313-320 Em channel Z15 ppm321-328 Em channel Z16 ppm
10
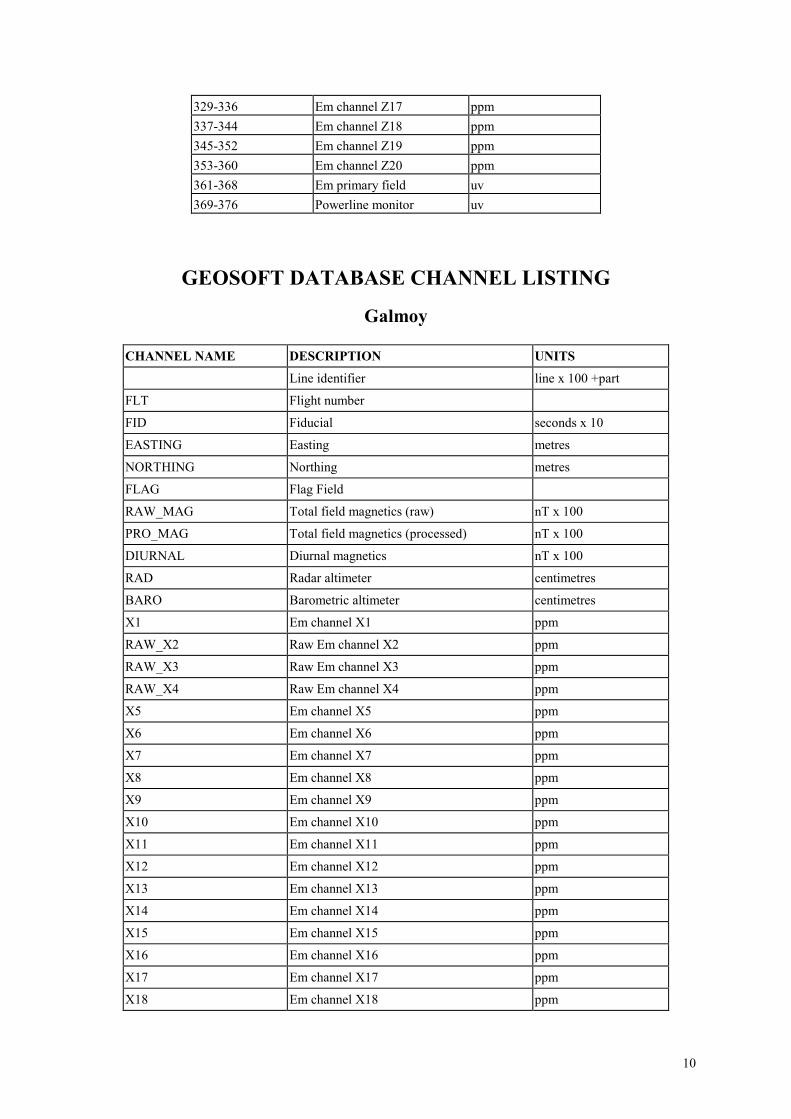
329-336 Em channel Z17 ppm337-344 Em channel Z18 ppm345-352 Em channel Z19 ppm353-360 Em channel Z20 ppm361-368 Em primary field uv369-376 Powerline monitor uv
GEOSOFT DATABASE CHANNEL LISTING
Galmoy
CHANNEL NAME DESCRIPTION UNITS
Line identifier line x 100 +part
FLT Flight number
FID Fiducial seconds x 10
EASTING Easting metres
NORTHING Northing metres
FLAG Flag Field
RAW_MAG Total field magnetics (raw) nT x 100
PRO_MAG Total field magnetics (processed) nT x 100
DIURNAL Diurnal magnetics nT x 100
RAD Radar altimeter centimetres
BARO Barometric altimeter centimetres
X1 Em channel X1 ppm
RAW_X2 Raw Em channel X2 ppm
RAW_X3 Raw Em channel X3 ppm
RAW_X4 Raw Em channel X4 ppm
X5 Em channel X5 ppm
X6 Em channel X6 ppm
X7 Em channel X7 ppm
X8 Em channel X8 ppm
X9 Em channel X9 ppm
X10 Em channel X10 ppm
X11 Em channel X11 ppm
X12 Em channel X12 ppm
X13 Em channel X13 ppm
X14 Em channel X14 ppm
X15 Em channel X15 ppm
X16 Em channel X16 ppm
X17 Em channel X17 ppm
X18 Em channel X18 ppm

11
RAW_X19 Raw Em channel X19 ppm
X20 Em channel X20 ppm
Z1 Em channel Z1 ppm
RAW_Z2 Raw Em channel Z2 ppm
RAW_Z3 Raw Em channel Z3 ppm
RAW_Z4 Raw Em channel Z4 ppm
Z5 Em channel Z5 ppm
Z6 Em channel Z6 ppm
Z7 Em channel Z7 ppm
Z8 Em channel Z8 ppm
Z9 Em channel Z9 ppm
Z10 Em channel Z10 ppm
Z11 Em channel Z11 ppm
Z12 Em channel Z12 ppm
Z13 Em channel Z13 ppm
Z14 Em channel Z14 ppm
Z15 Em channel Z15 ppm
Z16 Em channel Z16 ppm
Z17 Em channel Z17 ppm
Z18 Em channel Z18 ppm
Z19 Em channel Z19 ppm
Z20 Em channel Z20 ppm
XTDC13_20 Em decay constant from X (13-20) usec
ZTDC9_17 Em decay constant from Z (09-17) usec
PRIMARY_FIELD Em primary field uv
POWERLINE_MONITOR Powerline monitor uv
DECAY_RMS_X Decay fitting RMS error from X ppm
DECAY_RMS_Z Decay fitting RMS error from Z ppm
IGRF IGRF correction nT x 100
MAG_COR_APPLIED Mag correction applied nT x 100


![Airborne Gravity Gradiometry in the Search for Mineral Deposits … · Airborne Gravity Gradiometry in the Search for Mineral Deposits Dransfield, M. [1] _____ 1. BHP Billiton ABSTRACT](https://img.dokumen.tips/doc/110x75/5c7950e809d3f2c9458c185e/airborne-gravity-gradiometry-in-the-search-for-mineral-deposits-airborne-gravity.jpg)


![Airborne Gravity Gradiometry in the Search for Mineral Deposits · 2015-12-14 · Airborne Gravity Gradiometry in the Search for Mineral Deposits Dransfield, M. [1] 1. BHP Billiton](https://img.dokumen.tips/doc/110x75/5e9ffa54bed7367cd454cf0a/airborne-gravity-gradiometry-in-the-search-for-mineral-deposits-2015-12-14-airborne.jpg)