Embed Size (px)
Citation preview

www.bespokepremium.com
The Bespoke ReportEquity Market Pros and Cons
September 14, 2018
An independent research firm that uses big data to present timely investment ideas in an easy to understand format.
www.bespokepremium.com
www.bespokepremium.com
US Equities
Pros Cons1. The Trend (Is Still) Your Friend2. Strong US Index Technicals3. Strong Breadth4. Industrials, Health Care Join The Rally5. Valuations Still Reasonable6. Earnings, Guidance Still Positive7. Robust Domestic Economic Growth8. Epic Job Market9. Retailers Making A Comeback10. Small Business Strength11. No Sign of Recession12. Inflation Still Low by Any Standard13. Signs of Improving Pricing Power14. Dollar Contained15. Stocks Unfazed by Rate Hikes16. Yield Curve Still in Bullish Zone17. End of Fed Hiking In Sight?18. Volatility Has Settled19. Investor Sentiment Not Excessive20. US Markets Leading21. Bullish Seasonality
1. Largest Tech Stocks In the Stratosphere2. FANG Rolling Over?3. Sector Weightings Out of Whack4. Semis Rolling Over5. Housing Lagging6. Discretionary/Staples Ratio7. Financials Not Participating8. High Debt Levels9. TINA → TINAA10. Inflation Second Derivative Risk11. Fed Still Hiking12. Auto Sales Soft13. Mid-Terms Looming14. Tariffs, Trade Wars15. Global Growth Slowing16. Downtrends In International Markets17. Emerging Markets Bear

www.bespokepremium.com
PROS – The Trend (Is Still) Your Friend
The S&P 500’s long-term uptrend channel is still in place.
The bull market that began in March 2009 has just been re-confirmed with new all-time highs last made at the end of August. It’s the 2nd
longest bull market on record, and bull markets don’t die of old age.
S&P 500: Since 2016
1,750
1,950
2,150
2,350
2,550
2,750
2,950
3,150
Start End Start Price End Price % Change Days
12/4/1987 3/24/2000 223.92 1527.46 582.15% 4,494
3/9/2009 8/29/2018 676.53 2914.04 330.73% 3,460
6/13/1949 8/2/1956 13.55 49.74 267.08% 2,607
10/3/1974 11/28/1980 62.28 140.52 125.63% 2,248
7/23/2002 10/9/2007 797.70 1565.15 96.21% 1,904
8/12/1982 8/25/1987 102.42 336.77 228.81% 1,839
10/22/1957 12/12/1961 38.98 72.64 86.35% 1,512
4/28/1942 5/29/1946 7.47 19.25 157.70% 1,492
6/26/1962 2/9/1966 52.32 94.06 79.78% 1,324
5/26/1970 1/11/1973 69.29 120.24 73.53% 961
S&P 500 Longest 20% Rallies (Bull Markets)

www.bespokepremium.com
PROS – Strong US Index Technicals
Other key US index ETFs have all made new highs and remain in long-term uptrends as well.
Transports, small-caps, Nasdaq 100, Wilshire 5,000, and the S&P 1500 are all trading at or near bull market highs.
Nasdaq 100: Since 2016
3,750
4,250
4,750
5,250
5,750
6,250
6,750
7,250
7,750
8,250
-17.205
440
640
840
1040
1240
1440
1640
1840
Ma…
Jul-
16 Sep
…
No
v…
Jan
-…
Mar
…
Ma…
Jul-
17 Sep
…
No
v…
Jan
-…
Mar
…
Ma…
Jul-
18
Pri
ce
Industrials
250
2,250
4,250
6,250
8,250
10,250
12,250
14,250
Sep-17 Nov-17 Jan-18 Mar-18 May-18 Jul-18 Sep-18
Pri
ce
Financials
Sep-17 Nov-17 Jan-18 Mar-18 May-18 Jul-18 Sep-18 Sep-17 Nov-17 Jan-18 Mar-18 May-18 Jul-18 Sep-18
24000
25000
26000
27000
28000
29000
30000
31000
Sep-17 Nov-17 Jan-18 Mar-18 May-18 Jul-18 Sep-18
Pri
ce
Wilshire 5,000
8,500
9,000
9,500
10,000
10,500
11,000
11,500
12,000
Sep-17 Nov-17 Jan-18 Mar-18 May-18 Jul-18 Sep-18
Pri
ce
Dow Transports
1250
1350
1450
1550
1650
1750
1850
Sep-17 Nov-17 Jan-18 Mar-18 May-18 Jul-18 Sep-18P
rice
Russell 2,000 (Small-caps)
700
800
900
1000
1100
1200
1300
1400
Sep-17 Nov-17 Jan-18 Mar-18 May-18 Jul-18 Sep-18
Pri
ce
Health Care
550
570
590
610
630
650
670
690
Sep-17 Nov-17 Jan-18 Mar-18 May-18 Jul-18 Sep-18
Pri
ce
S&P 1500
www.bespokepremium.com
PROS – Strong Breadth
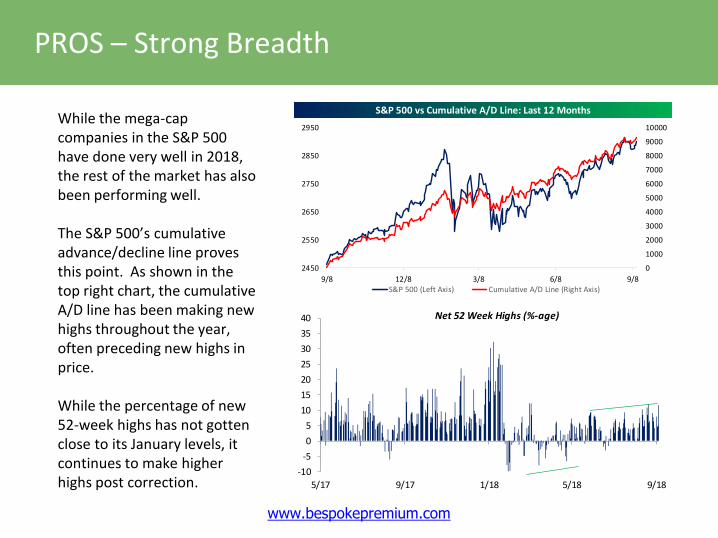
While the mega-cap companies in the S&P 500 have done very well in 2018, the rest of the market has also been performing well.
The S&P 500’s cumulative advance/decline line proves this point. As shown in the top right chart, the cumulative A/D line has been making new highs throughout the year, often preceding new highs in price.
While the percentage of new 52-week highs has not gotten close to its January levels, it continues to make higher highs post correction.
S&P 500 vs Cumulative A/D Line: Last 12 Months
0
1000
2000
3000
4000
5000
6000
7000
8000
9000
10000
2450
2550
2650
2750
2850
2950
9/8 12/8 3/8 6/8 9/8S&P 500 (Left Axis) Cumulative A/D Line (Right Axis)
Net 52 Week Highs (%-age)
-10
-5
0
5
10
15
20
25
30
35
40
5/17 9/17 1/18 5/18 9/18

www.bespokepremium.com
PROS – Industrials, Health Care Join The Rally
In our June “Pros and Cons” update, Consumer Discretionary and Technology were the only two sectors that had taken out their prior bull market highs.
At this point, Health Care is the only other sector that has taken out its highs as well, but Industrials has been performing very well lately also.
850
900
950
1000
1050
1100
1150
Sep-17 Nov-17 Jan-18 Mar-18 May-18 Jul-18 Sep-18
Pri
ce
Health Care
550
600
650
700
Sep-17 Nov-17 Jan-18 Mar-18 May-18 Jul-18 Sep-18
Pri
ce
Industrials
S&P 500 Sectors: % of Stocks Above 50-DMAs
32%40%
54%59%
67% 67%74%
78%82%
90% 90%100%
0%
10%
20%
30%
40%
50%
60%
70%
80%
90%
100%

www.bespokepremium.com
PROS – Large Cap Valuations Reasonable
P/E ratios are elevated versus the immediate post-crisis period and are off recent lows butare not in anything approaching historically excessive territory.
Very strong earnings growth justifies elevated valuations.
Valuations Are Working Back Towards Recent Highs, But Are Not Excessive Earnings Growth Is Very Strong And Justifies Elevated Valuations
10
12
14
16
18
20
22
24
26
28
30
Trailing P/E
Forward P/E (Est NTM)
-40
-30
-20
-10
0
10
20
30
40
10 12 14 16 18 20 22 24 26
Yo
Y E
st N
TM E
PS
Gro
wth
(%
)
Fwd P/E (Est NTM)

www.bespokepremium.com
PROS – Earnings, Guidance Still Positive
S&P 500 Estimated Earnings Growth (% YoY)
19.3%18.0%
7.5%8.4%
0.0%
5.0%
10.0%
15.0%
20.0%
25.0%
Q3 '18 Q4 '18 Q1 '19 Q2 '19
Spread Between % of Companies Raising vs. Lowering Guidance
-15
-10
-5
0
5
10
Q3
'01
Q3
'02
Q3
'03
Q3
'04
Q3
'05
Q3
'06
Q3
'07
Q3
'08
Q3
'09
Q3
'10
Q3
'11
Q3
'12
Q3
'13
Q3
'14
Q3
'15
Q3
'16
Q3
'17
% of Companies Beating Earnings Estimates by Quarter: 1999-Present
40%
45%
50%
55%
60%
65%
70%
75%
Q2
'99
Q2
'00
Q2
'01
Q2
'02
Q2
'03
Q2
'04
Q2
'05
Q2
'06
Q2
'07
Q2
'08
Q2
'09
Q2
'10
Q2
'11
Q2
'12
Q2
'13
Q2
'14
Q2
'15
Q2
'16
Q2
'17
Q2
'18
Earnings growth is expected to remain near 20% for the remainder of 2018, and 2019 estimates project high single-digit growth off of a high 2018 base.
Earnings beat rates have been above average for 3 consecutive quarters, and forward guidance has been bullish for 6 consecutive quarters.

www.bespokepremium.com
PROS – Robust Domestic Economic Growth
Bespoke Beige Book Index Versus US GDP
-4
-3
-2
-1
0
1
2
3
4
5
6
-0.30
-0.20
-0.10
0.00
0.10
0.20
0.30
0.40
0.50
0.60
0.70
Bespoke Beige Book Index(Advanced 2Q, Left)GDP QoQ SAAR 4Q Avg (Right)
R-squared = 0.564
Our Beige Book index of sentiment keeps track of what businesses are telling
the Fed about the economy. While slightly lower in the most recent reading, the index still indicates strong and accelerating growth.
Manufacturing Activity Still Very Strong
30
35
40
45
50
55
60
65 ISM Manufacturing PMI
ISM Manufacturing PMI - Modelled on 5 Fed
R-Squared = 0.855
Our index of regional Fed manufacturing activity is still coming in very strong, and ISM's gauge of manufacturing activity posted the highest reading in nearly two decades in its most recent release.

www.bespokepremium.com
PROS – Epic Job Market
Initial jobless claims are down to 0.00126% of the overall labor force, and less than 1.7mm workers are collecting unemployment insurance.
Initial Jobless Claims % of Labor Force: Record Lows
0.10
0.15
0.20
0.25
0.30
0.35
0.40
0.45
0.50
0.55
0.60
0.65

www.bespokepremium.com
PROS – Retailers Make A Comeback
Retail Sales Have Beat Estimates 5 Straight Months Before August Miss Retail Sales Have Beat Estimates For 6 Months Running (YTD, %)
0
1
2
3
4
5
6
Consecutive In-Line or Beats
-10
0
10
20
30
40
50
60
70S&P 500 Internet Retail
S&P 500 Department Stores
S&P 500
Retail sales beat estimates for 5 straight months through July, a sign of very strong consumer spending that has blown away expectations. Markets have noticed: the two best performing sub-industries in the S&P 500 this year are internet retail and the most brick-and-mortar group it gets: department stores.

www.bespokepremium.com
PROS – Small Business Strength
The small business sector – a huge driver of the US economy --continues to love the current economic environment.
Small business optimism hit its highest levels in the history of NFIB’s survey going back to 1975 this month, topping the prior high seen in September 1983.
Taxes and red tape, which were big concerns in the middle part of the expansion, are no longer at the top of mind.
Data at right is from the monthly NFIB Small Business survey.
NFIB Small Business Optimism: 1975 - 2018108.8
80
85
90
95
100
105
110
'75 '80 '85 '90 '95 '00 '05 '10 '15
September 1983: 108.0
Biggest Problem Facing Small Businesses (%): Taxes & Red Tape
2824
28
32
36
40
44
48
52
1/07 1/08 1/09 1/10 1/11 1/12 1/13 1/14 1/15 1/16 1/17 1/18
www.bespokepremium.com
PROS – No Sign of Recession
Leading/Coincident Indicator Ratio Not Signalling Recession
Leading-Coincident Indicator Ratio At New Highs
0.80
0.85
0.90
0.95
1.00
1.05
1.10
1.15
1.20
1.25
1.30Recession
LEI/CEI Ratio
0.80
0.85
0.90
0.95
1.00
1.05
1.10
1.15
Recession LEI/CEI Ratio
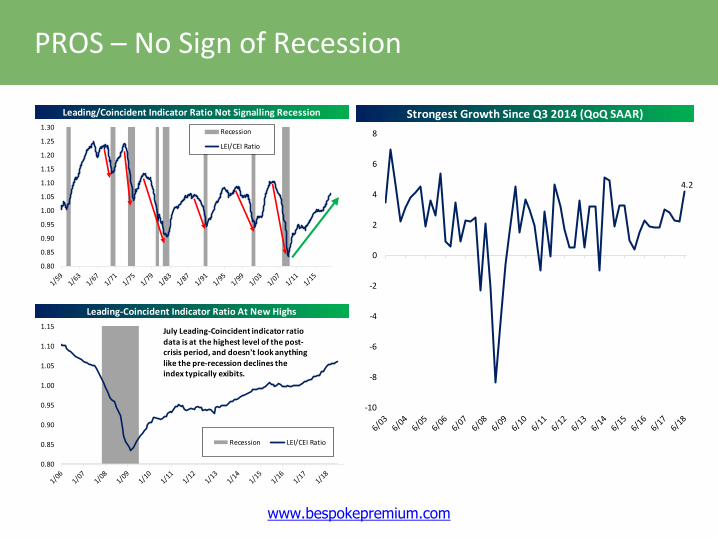
July Leading-Coincident indicator ratio
data is at the highest level of the post-crisis period, and doesn't look anything like the pre-recession declines the index typically exibits.
Strongest Growth Since Q3 2014 (QoQ SAAR)
4.2
-10
-8
-6
-4
-2
0
2
4
6
8

www.bespokepremium.com
PROS – Inflation Still Low by Any Standard
Inflation Has Risen Somewhat, But Remains Contained Vs History University of Michigan Consumer Inflation Expectations: 5-10y Ahead
0
1
2
3
4
5
6
7
8
9
10
11
Core PCE YoY
Core PCE YoY is at the highest levels since April of 2012, but isn't even at the top end of the post-1980s range. While core inflation is likely to climb further, it's not in a range that would prompt swift and aggressive Fed
action which could trigger a recession.
2
3
4
5
6
7
8
9
10
Consumer inflation expectations are well-contained and not showing signs of the rapid acceleration that might come in a truly inflationary environment.
www.bespokepremium.com
PROS – Signs of Improving Pricing Power
5 Fed Manufacturing Index Average: Prices Received Pretax Corporate Profits (with Inventory/Capital Adjustments) % of GDI
-30
-20
-10
0
10
20
30
40
50
Current, 20.7
Outlook, 27.2
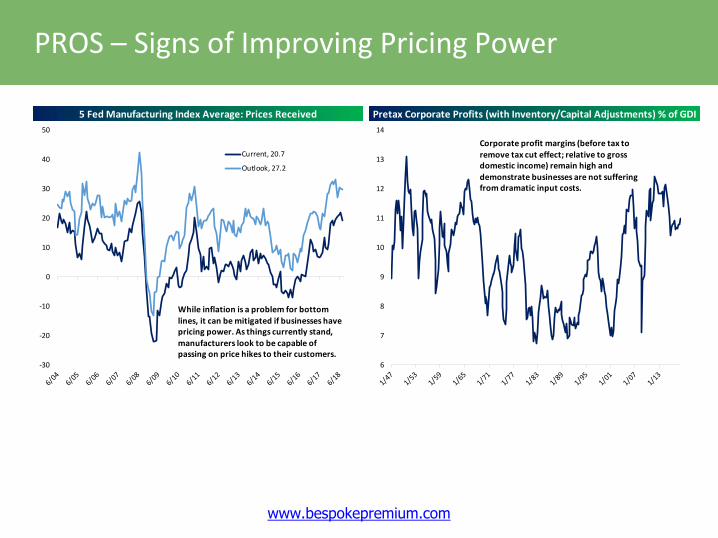
While inflation is a problem for bottom
lines, it can be mitigated if businesses have pricing power. As things currently stand, manufacturers look to be capable of passing on price hikes to their customers.
6
7
8
9
10
11
12
13
14
Corporate profit margins (before tax to remove tax cut effect; relative to gross domestic income) remain high and
demonstrate businesses are not suffering from dramatic input costs.
www.bespokepremium.com
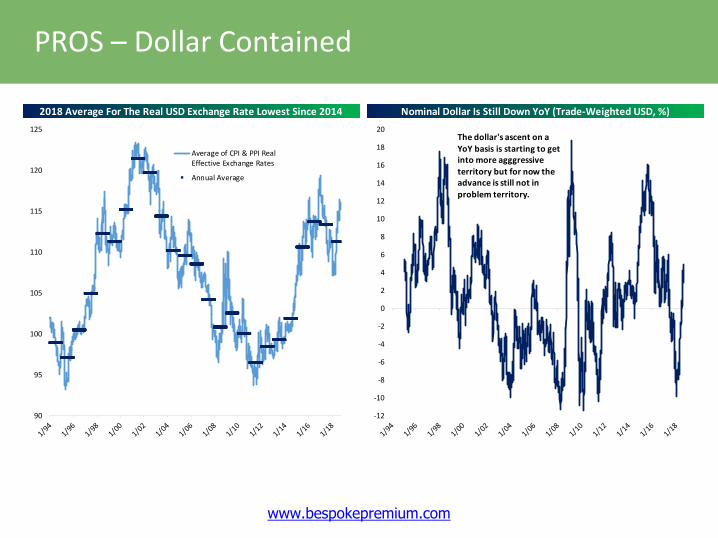
PROS – Dollar Contained
2018 Average For The Real USD Exchange Rate Lowest Since 2014 Nominal Dollar Is Still Down YoY (Trade-Weighted USD, %)
90
95
100
105
110
115
120
125
Average of CPI & PPI RealEffective Exchange Rates
Annual Average
-12
-10
-8
-6
-4
-2
0
2
4
6
8
10
12
14
16
18
20The dollar's ascent on a YoY basis is starting to get into more agggressive territory but for now the advance is still not in problem territory.

www.bespokepremium.com
PROS – Stocks Unfazed by Rate Hikes
Over The Past 25 Years, The Market Has Generally Performed Well During Hike Cycles
0
1
2
3
4
5
6
7
6.0
6.5
7.0
7.5
8.0 S&P 500 Natural Log Scale
Fed Funds Target Rate (Upper Bound Since 2009)

www.bespokepremium.com
PROS – Yield Curve Still in Bullish Zone
Slope of Curve Percentage of Occurrences S&P 500 Average One Year Change (%) Percent of Time Positive
Inverted 11.5 -1.9 44.3
Flatter 7.3 -1.0 45.9
Steeper 4.2 -3.5 41.5
Under 50 bps 13.0 3.2 58.4
Flatter 6.6 5.0 65.8
Steeper 6.3 1.3 50.6
Under 100 bps 11.2 9.7 86.3
Flatter 6.4 11.1 89.2
Steeper 4.8 7.9 82.5
Under 150 bps 12.6 14.8 84.6
Flatter 6.7 14.8 84.4
Steeper 5.9 14.9 84.7
Under 200 bps 12.9 13.4 83.9
Flatter 6.7 11.8 80.5
Steeper 6.2 15.2 87.6
Under 250 bps 13.3 6.0 70.5
Flatter 7.7 6.6 74.1
Steeper 5.7 5.2 65.6
Under 300 bps 14.5 10.3 77.3
Flatter 6.5 12.3 82.9
Steeper 8.0 8.6 72.7
Over 300 bps 10.9 9.7 86.8
Flatter 4.6 8.3 85.0
Steeper 6.2 10.6 88.1
Overall 100.0 8.2 73.9
S&P 500 Average Returns Following Various Levels of the Yield Curve: 1962 - 2018
Yes, the Treasury yield curve (10yr-3mth) is flattening, but it doesn’t predict recession until it completely inverts.
The current level of the curve (between 50 and 100 bps) has actually seen the S&P 500 gain over the next 12 months 89.2% of the time!
For now, the curve is at 84 bps. Once it dips under 50 is when forward 12-month equity market performance starts to weaken.

www.bespokepremium.com
PROS – End Of Fed Hiking In Sight?
Eurodollar Yield Curve Pricing Rate Cuts From 2020-2022 (%) Spread Between 1m OIS and 3y Forward Overnight OIS (%)
2.30
2.40
2.50
2.60
2.70
2.80
2.90
3.00
3.10
3.20
3.30
The short term interest rate markets are pricing rate cuts starting in about 18 months, with 3 month yields
peaking just above 3%. This is of course the money-weighted average of
multiple scenarios ranging from rate cuts to rates unchanged to ongoing
rate hikes. No scenario is locked in by any means!
0.00
0.50
1.00
1.50
2.00
2.50
Earlier in the cycle, markets were pricing a sharp increase in interest rates over the coming years. Now
pricing is much less aggressive, creating less risk to asset prices from
rising interest rates.

www.bespokepremium.com
PROS – Volatility Has Settled
Daily equity market volatility spiked from February through April but has since pulled back well below the bull market average. The S&P 500’s average daily move over the last 50 days is down to +/-0.40%. Things are starting to feel like 2017 again from a vol perspective!
S&P 500 Rolling 50-Day Avg. Absolute Daily % Change
0.00
0.50
1.00
1.50
2.00
2.50
Bull Market Average: +/-0.70%
Current: +/-0.40%

www.bespokepremium.com
PROS – Investor Sentiment Not Excessive
After spiking to multi-year highs fittingly right before the S&P topped out in January, bullish sentiment on the part of investors remains subdued.
Individual investor bullish sentiment has been cut in half from its highs in January, while bullish sentiment from newsletter writers (2nd chart at right) has rebounded but remains below highs made in 2017 and early 2018.
AAII Bullish Sentiment: 2009 - 2018
10
20
30
40
50
60
70
600
1200
1800
2400
3000
3600
1/09 1/10 1/11 1/12 1/13 1/14 1/15 1/16 1/17 1/18
S&P 500 (Left Axis)
Bullish Sentiment (Right Axis)
32.1
Investors Intelligence Bullish Sentiment: 2002-Present
500
1000
1500
2000
2500
3000
3500
2025303540455055606570
Bullish Sentiment S&P 500 (Right Axis)
Current: 59.6
Average: 48.2

www.bespokepremium.com
PROS – US Markets Leading
US equities have obliterated international equity markets in terms of performance in 2018. If the “trend is your friend,” the US is still the place to be until further notice. History has shown that the trend of US outperformance typically continues through year end when the disparity has been this wide entering the final quarter.
2018 YTD Performance of S&P 500 vs. MSCI All World ex US
-10
-8
-6
-4
-2
0
2
4
6
8
10
Jan-18 Feb-18 Mar-18 Apr-18 May-18 Jun-18 Jul-18 Aug-18 Sep-18
S&P 500 (+8.5%)
MSCI All World ex US (-7.4%)

www.bespokepremium.com
PROS – Bullish Seasonality
While September has historically been the weakest month of the year, the last quarter of the year has historically been the best time to be in stocks. Below is a snapshot from our Stock Seasonalitytool showing the median performance of the S&P 500 and its sectors from 9/14 through year end over the last 10 years. Gains have been plentiful during this period.

www.bespokepremium.com
CONS – Largest Tech Stocks in the Stratosphere
While underlying breadth for the stock market as a whole is indeed strong (lots of stocks are going up), the four largest stocks in the US – AAPL, AMZN, MSFT, and GOOGL –have been responsible for about HALF of the S&P 500’s 8.6% YTD gain.
Because of their strength, the weightings of these four stocks are enormous across indexes and ETFs. Any downside pressure in these mega-cap names will certainly put heavy pressure on the popular ETFs that so many investors have flooded into.
S&P 500 Price Return YTD (%)
-4
-2
0
2
4
6
8
10
S&P 500, 8.6%
Ex AAPL, AMZN, MSFT, GOOGL, 4.44%
AAPL, AMZN, MSFT, GOOGL Contribution, 4.16%
www.bespokepremium.com
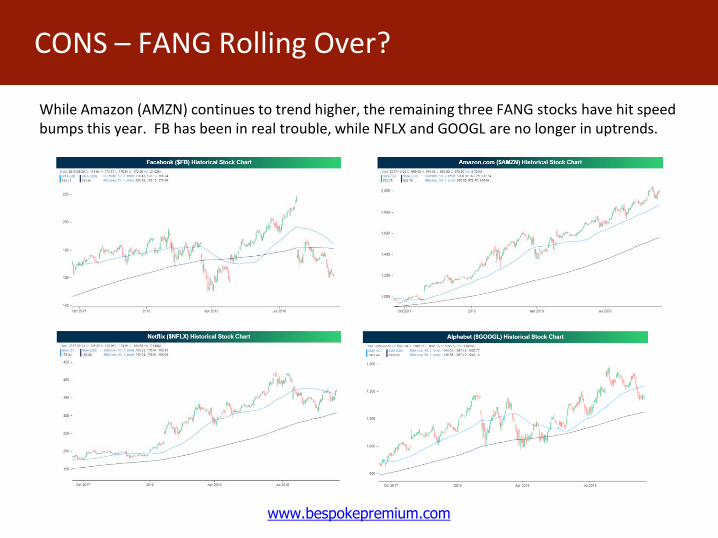
CONS – FANG Rolling Over?
While Amazon (AMZN) continues to trend higher, the remaining three FANG stocks have hit speed bumps this year. FB has been in real trouble, while NFLX and GOOGL are no longer in uptrends.

www.bespokepremium.com
CONS – Sector Weightings Out of Whack
S&P 500 Sector Weightings (%): 1990-Present
0
5
10
15
20
25
30
35
40
Feb-90
Feb-91
Feb-92
Feb-93
Feb-94
Feb-95
Feb-96
Feb-97
Feb-98
Feb-99
Feb-00
Feb-01
Feb-02
Feb-03
Feb-04
Feb-05
Feb-06
Feb-07
Feb-08
Feb-09
Feb-10
Feb-11
Feb-12
Feb-13
Feb-14
Feb-15
Feb-16
Feb-17
Feb-18
Technology Financials Health Care Cons. Staples Energy Industrials
Cons. Discret. Materials Utilities Telecom Real Estate
Sector 1995 1996 1997 1998 1999 2000 2001 2002 2003 2004 2005 2006 2007 2008 2009 2010 2011 2012 2013 2014 2015 2016 2017 2018
Technology 9.39 12.31 12.24 17.78 29.18 21.23 17.72 14.63 17.73 16.05 15.10 15.14 16.82 15.40 19.76 18.65 19.02 18.95 18.58 19.83 20.69 20.77 23.78 26.55
Health Care 10.82 10.38 11.35 12.01 9.31 14.36 14.36 14.77 13.31 12.68 13.34 12.03 12.00 14.92 12.64 10.91 11.85 12.05 13.01 14.11 15.16 13.63 13.87 14.61
Financials 13.14 15.07 16.91 15.67 13.02 17.34 17.75 20.46 20.63 20.64 21.29 22.27 17.39 12.97 14.38 16.06 13.43 15.63 16.17 16.64 16.47 14.81 14.81 13.78
Cons. Discret. 12.97 11.70 11.95 12.43 12.70 10.28 13.14 13.26 11.29 11.90 10.81 10.62 8.41 8.39 9.60 10.63 10.67 11.40 12.54 11.94 12.89 12.03 12.22 12.92
Industrials 12.63 12.75 11.65 9.97 9.91 10.57 11.29 11.50 10.96 11.79 11.35 10.84 11.52 11.06 10.30 10.95 10.69 10.13 10.93 10.45 10.05 10.27 10.23 9.60
Cons. Staples 12.80 12.62 12.36 11.28 7.17 8.10 8.19 9.48 11.00 10.48 9.45 9.25 10.27 13.06 11.36 10.63 11.54 10.64 9.79 9.87 10.06 9.37 8.16 6.69
Energy 9.14 9.18 8.51 6.41 5.55 6.57 6.34 5.99 5.79 7.16 9.31 9.82 12.94 13.14 11.51 12.03 12.27 11.04 10.24 8.45 6.50 7.56 6.07 5.86
Utilities 4.53 3.69 3.39 3.04 2.21 3.79 3.09 2.84 2.85 2.94 3.36 3.55 3.62 4.20 3.72 3.30 3.87 3.47 2.93 3.25 2.99 3.17 2.92 2.83
Real Estate 2.85 2.88 2.73
Materials 6.05 5.68 4.53 3.11 3.00 2.30 2.61 2.82 3.05 3.09 2.99 2.96 3.36 2.97 3.60 3.74 3.50 3.62 3.50 3.17 2.76 2.84 2.99 2.50
Telecom 8.53 6.62 7.12 8.29 7.94 5.46 5.50 4.25 3.38 3.27 3.01 3.51 3.66 3.88 3.15 3.11 3.17 3.07 2.31 2.29 2.43 2.66 2.07 1.94
S&P 500 Sector Weightings (%): Year End Since 1995
The Tech sector’s huge weight in the S&P 500 is a concern because any big hit to Tech will most likely bring down the S&P 500 with it.

www.bespokepremium.com
CONS – Semis Rolling Over
The Semiconductors aren’t the “growth” group they once were, but they’re still followed closely and many consider the group a market leader.
The action in the semis has been dreadful for the past few months. As shown at right, the Semiconductors and Equipment group is essentially flat for 2018, and it has severely lagged the S&P 500 since peaking mid-summer. If the action in the semis is a tell for what’s to come for the broad market, it’s going to be a painful end to 2018.
Semiconductors & Equipment: Last Twelve Months
750
800
850
900
950
1000
1050
1100
9/17 11/17 1/18 3/18 5/18 7/18 9/18
50-DMA
200-DMA
Semiconductors & Equipment: RS vs S&P 500 Last Twelve Months
-5
0
5
10
15
20
25
30
9/17 11/17 1/18 3/18 5/18 7/18 9/18

www.bespokepremium.com
CONS – Housing Lagging
Housing market economic indicators are still in growth mode, but they’ve definitely slowed down in 2018. And the action for homebuilder stocks has really gotten bad. As shown below, the S&P 1500 Homebuilders group is stuck in a nasty multi-month downtrend, and after a huge rally to end 2017, the group has given up its outperformance versus the S&P 500 over the past 3 years.
S&P 1500 Homebuilders: Past Year S&P 1500 Homebuilders vs S&P 500: Past 3 Years (%)
650
700
750
800
850
900
950
1,000
-30
-20
-10
0
10
20
30
40
50
60
70
S&P 1500 Homebuilders
S&P 500

www.bespokepremium.com
CONS – Discretionary/Staples Ratio
The spread between the Consumer Discretionary sector’s weighting in the S&P 500 and the Consumer Staples sector’s weighting recently hit multi-decade highs.
The only other period where the spread between the two weightings was higher was near the peak of the 1999/2000 bubble, and we all know how that ended. Consumer Discretionary Weight Minus Consumer Staples Weight
-8
-6
-4
-2
0
2
4
6
86.23%
Sector Weighting (%) in the S&P 500
0
2
4
6
8
10
12
14
16
18Cons. Staples Cons. Discret.
6.69%
12.92%

www.bespokepremium.com
-3
0
3
6
9
Sep-17 Dec-17 Mar-18 Jun-18 Sep-18
Financials
S&P 500 Current Sector Weightings (%)Telecom, 1.94 Materials, 2.50
Real Estate, 2.73Utilities, 2.83
Energy, 5.86
Cons. Staples, 6.69
Industrials, 9.60
Cons. Discret., 12.92
Financials, 13.78
Health Care, 14.61
Technology, 26.55
CONS – Financials Not Participating
The Financial sector is flat on the year and continues to perform terribly versus the S&P 500. With a weighting of 13.78% in the S&P, it’s important for Financials to take part in upside action.
The sector did manage to break above its early 2018 downtrend channel, but weakness in recent days has left it testing key support at its 50-day moving average.
Relative strength for the sector is in free fall.No change in rates
Rate hikes
Relative strength vs. S&P 500
375
395
415
435
455
475
495
515
Sep-17 Nov-17 Jan-18 Mar-18 May-18 Jul-18 Sep-18
Pri
ce
Financials

www.bespokepremium.com
CONS – High Debt Levels
Debt-to-GDP Ratios (%) Current Percentile of Debt-to-GDP Ratios, Since 1951
0%
20%
40%
60%
80%
100%
120%
140%
Households and nonprofit organizations, 76.4%Nonfinancial corporate business, 45.4%State and local governments, ex. retirement funds, 15.4%Federal government, 85.6%Domestic financial sectors, 80%
100 98.8
76.973.5
66.4
0
20
40
60
80
100
Federalgovernment
Nonfinancialcorporate business
Households andnonprofit
organizations
Domestic financialsectors
State and localgovernments, ex.retirement funds
High and rising Lower and fallingWhile some sectors (households, the financial sector, and state/local
governments) have deleveraged and continue to do so relative to output post-crisis, others have re-leveraged. Federal government debt-to-GDP is not a concern given low inflation, but nonfinancial corporate debt is at a record and continues to climb. High corporate leverage is a potential economic risk.

www.bespokepremium.com
There Is No Alternative -------> There Is Now An Alternative
CONS – TINA → TINAA
Vanguard Prime Money Market 7 Day Yield - Equity Yields (%) Ten Year TIPS Real Yield (%)
-10
-8
-6
-4
-2
0
2
4
6
Vanguard Prime MoneyMarket Fund - S&P 500 Index
Vanguard Prime MoneyMarket Fund - SPDR S&P 500ETF Trust
-1
0
1
2
3
4
5For close to a decade post-crisis, large cap equities yielded over 2% more in dividends alone than low-risk money market funds.
That spread is now positive again, and in one respect we've gone from TINA ("There
Is No Alternative") to TINAA ("There Is Now An Alternative"). Earnings yields tell a similar story but are still falling relative to low-risk alternatives.
While lower-risk investments are offering higher nominal yields, inflation-protected Treasuries are still not giving investors a princely yield. While TINA is giving way to TINAA, capital is still relatively plentiful and real interest rates remain quite low relative to history.

www.bespokepremium.com
CONS – Inflation 2nd Derivative Risk
Recent inflation data has weakened a bit (with core inflation rising at the slowest MoM pace since March of 2017 in the most recent report), but leading indicators still suggest a significant uptick.
If inflation did accelerate as much as leading indicators suggest that it might, the Fed could feel forced to tighten policy quickly, and a rapid rise in rates would likely induce a recession.
A Small Pullback In Core Inflation Possible, But Leading Indicators Suggest New Highs
0.5
1.0
1.5
2.0
2.5
3.0
3.5
-1.0
-0.5
0.0
0.5
1.0
1.5
2.0
2.5
3.0
3.5
4.0
NY Fed Underlying Inflation Gauge, Adv 15m
Median CPI YoY
Core PCE YoY
0.5
1.0
1.5
2.0
2.5
3.0
-4
-3
-2
-1
0
1
2
3
4
5
6
Real GDP YoY, Adv 6Q
Core CPI Q Avg, YoY
Core CPI Q Avg, YoY
R-squared = 0.607
R-squared = 0.674
R-squared = 0.227
R-squared = 0.114

www.bespokepremium.com
CONS – Fed Still Hiking
There's Still Room To Run Before Real Rates Hit Neutral Per Most Estimates (%)
-0.40
0.61
-4
-2
0
2
4
6
8
10
Laubach-Williams Neutral Real Rate Estimate
Fed Funds Effective - PCE YoY
-1.04
-8
-6
-4
-2
0
2
4
6
8
Spread
From the Fed’s perspective, the policy rate net of inflation is still well below estimates of “neutral”. That justifies more hikes, on top of any uptick in inflation.
Faster inflation or higher estimates of neutral real rates could add hikes to the pile, to say nothing of strong growth justifying further hikes above neutral.
www.bespokepremium.com
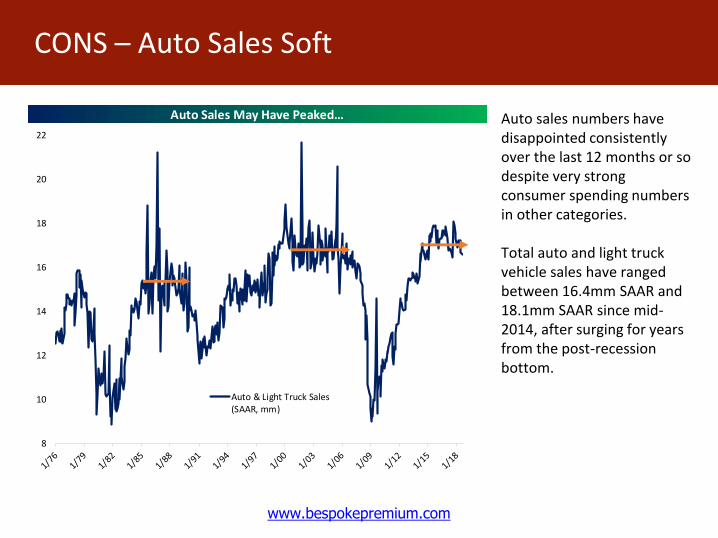
CONS – Auto Sales Soft
Auto Sales May Have Peaked…
8
10
12
14
16
18
20
22
Auto & Light Truck Sales(SAAR, mm)
Auto sales numbers have disappointed consistently over the last 12 months or so despite very strong consumer spending numbers in other categories.
Total auto and light truck vehicle sales have ranged between 16.4mm SAAR and 18.1mm SAAR since mid-2014, after surging for years from the post-recession bottom.

www.bespokepremium.com
CONS – Mid-Terms Looming
Year President Senate House Notes Mem - Labor Labor - Elect. Mem - Elect Elect - Yr End Changes
1946 Truman D-11 D-54 1st Term D -12.0 -7.9 -19.0 -0.2 Senate and House Flip Rep
1950 Truman D-5 D-28 -0.9 4.4 3.4 5.5
1954 Eisenhower R-2 R-18 1st Term R 4.5 4.2 8.9 13.2 Senate and House Flip Dem
1958 Eisenhower R-13 R-48 8.9 8.0 17.6 7.1
1962 Kennedy D+2 D-4 1st Term D 6.5 -1.3 5.1 8.1
1966 Johnson D-3 D-47 1st Term D -11.3 4.3 -7.6 -0.5
1970 Nixon R+1 R-12 1st Term R 17.9 1.7 19.9 9.4
1974 Ford R-4 R-48 1st Term R -18.5 4.1 -15.2 -8.7
1978 Carter D-3 D-15 1st Term D 7.4 -9.5 -2.8 2.4
1982 Reagan R-0 R-26 1st Term R 9.7 12.1 22.9 2.3
1986 Reagan R-8 R-5 4.8 -2.7 2.0 -1.6 Senate Flips Dem
1990 Bush I R-1 R-8 1st Term R -9.0 -3.4 -12.1 6.0
1994 Clinton D-8 D-54 1st Term D 3.0 -1.1 1.8 -1.4 Senate and House Flip Rep
1998 Clinton D-0 D+5 -12.3 14.1 0.0 10.7
2002 Bush II R+2 R+8 1st Term R -15.5 -0.1 -15.5 -3.9 Senate Flips Rep
2006 Bush II R-6 R-30 2.4 5.5 8.0 2.6 Senate and House Flip Dem
2010 Obama D-6 D-63 1st Term D 1.4 8.1 9.6 5.4 House flips Rep
2014 Obama D-9 D-13 5.4 0.4 5.9 2.3 Senate Flips Rep
2018 Trump 1st Term R
Average -0.4 2.3 1.8 3.3
Median 2.7 2.9 2.7 2.5
Percent of Time Positive 61.1 61.1 66.7 66.7
All Other Years
Average 2.3 0.5 2.7 1.9
Median 2.5 1.5 3.0 2.6
Percent of Time Positive 70.9 65.5 70.9 69.1
Changes S&P 500 Performance (%)
Post WWII Midterm Congressional Elections: S&P 500 PerformanceThe table at right highlights the performance of the S&P 500 during various periods throughout mid-term election years going back to 1946.
The S&P 500 actually performed well in the two years when the Senate and House flipped to Democrats with a Republican as President (1954 and 2006), but we’d still consider mid-terms a “con” simply because the result is an unknown for the market, and the market hates unknowns.

www.bespokepremium.com
CONS – Tariffs, Trade Wars
US Treasury Tax Receipts, 3m Avg, bn $ SAAR
15
20
25
30
35
40
45
0
50
100
150
200
250
300
350
400
450
500Corporation Income Tax
Customs Duties
Corporate taxes out, import taxes in! Keep in mind, though, the
combined total forthe two series is down 35% since the end of 2016; tariffs are not going up anywhere close to enough to make up for lower
corporate taxes.
Beige Book Word Count, October 1996 - Current
0
5
10
15
20
25
30
35
40
45
"Tariff" "Trade"
Businesses are increasingly concerned about trade and tariffs. This chart shows the frequency of those two words in the Fed's twice-quarterly Beige Book since 1996. As shown, businesses are concerned and talking about it.

www.bespokepremium.com
CONS – Global Growth Slowing
Global Activity Growth Has Peaked Global Auto Sales YoY Are Negative
-20
-15
-10
-5
0
5
10
15
20
34
36
38
40
42
44
46
48
50
52
54
56
58
60
62
64
66
Global Manufacturing PMI
Global Industrial Production YoY
Global Trade Volumes YoY
-30
-20
-10
0
10
20
30
40
Global Auto Sales YoY
3m Avg

www.bespokepremium.com
CONS – Downtrends In International Markets
MSCI World Ex US (Weekly) Stoxx 600 (USD, Weekly) MSCI Emerging Markets (Weekly)
1400
1500
1600
1700
1800
1900
2000
2100
2200
330
350
370
390
410
430
450
470
490
510
650
750
850
950
1050
1150
1250
1350
The US can significantly outperform for long periods of time, but international markets are really looking grim. As shown in the charts below, international equities are coiling to the downside and, in most cases, at 52-week lows.

www.bespokepremium.com
CONS – Emerging Markets Bear
S&P 500 Performance During Emerging Markets Bears EM Bear Market: Unusually Long, Not Unusually Deep
5.4
5.7
6.0
6.3
6.6
6.9
7.2
7.5
7.8
8.1
S&P 500 (Natural Log Scale)
MSCI EM In Bear Market
-31.9 -32.6-38.2
-46.4
-53.7
-30.0
-20.4-24.5 -22.2
-63.6
-23.0 -21.8
-31.1-37.5
-21.2
-70
-60
-50
-40
-30
-20
-10
0
EM Bear Market LossesBy Start Date (%)
Average Ex Current
168 174 187 167
589
175
35 3685
161
1655
155
505
228
0
100
200
300
400
500
600
EM Bear Market Length ByStart Date (Calendar Days)
Average Ex Current

www.bespokepremium.com
Bespoke Model Portfolio
At left is an updated snapshot of the Bespoke Model Portfolio. Our cash level remains elevated at 33.7%, but we’re still sitting on a YTD gain of 11.9% versus the S&P’s gain of 8.7%.
Have a great weekend!
Bespoke Terms and Privacy Policy.
Stock Company
Current
Price
Portfolio
Weight (%)
Entry
Price
Stop
Price Date Added % Change
Consumer Discret. 11.0
SITE SiteOne 90.87 5.5 80.90 76.40 6/6/18 12.3
ULTA Ulta Beauty 279.10 5.6 249.33 219.80 6/20/18 11.9
0.0
Energy 0.0
Financials 9.6
RJF Raymond James 92.56 5.0 89.24 73.90 7/6/18 3.7
STI SunTrust 68.59 4.5 73.93 63.90 8/24/18 -7.2
Health Care 16.2
CRL Charles River Labs 132.28 5.3 121.35 107.30 8/24/18 9.0
GWPH GW Pharma 141.18 5.7 116.42 99.89 3/21/18 21.3
RMD ResMed 114.23 5.2 106.38 95.60 6/6/18 7.4
Industrials 4.6
DE Deere 147.76 4.6 157.85 129.90 6/6/18 -6.4
Materials 0.0
Technology 24.9
ADBE Adobe 274.69 6.2 95.69 223.90 4/18/16 187.1
APTI Apptio 41.23 7.1 27.20 33.10 2/21/18 51.6
CTRL Control4 37.14 7.0 24.62 28.90 2/21/18 50.9
MB MINDBODY 39.55 4.7 39.40 33.35 5/2/18 0.4
Telecom Services 0.0
Utilities 0.0
ETFs 0.0
Cash 33.7
Performance (%):
Since Inception1 YTD = Recently Added
S&P 500 91.4 8.7 = Changed Stop Price/
Model Portfolio 166.0 11.9 Lowered Weighting
vs. S&P 500 74.6 3.3
1Bespoke's Model Portfolio began with an initial value of $100,000 on 5/29/07.
Consumer Staples
Bespoke Model Portfolio: 9/14/18

www.bespokepremium.com
Bespoke Dividend Income Model Portfolio
Ticker Name
Current
Price
Current
Yield (%)
Most
Recent
Dividend ($)
Recent/Next
Ex Date
Portfolio
Weight (%)
Entry
Price
Stop
Price
Date
Added
%
Change
Consumer Discretionary 12.8BBY Best Buy 78.39 2.30 0.45 9/17 4.2 62.00 59.97 8/28/17 26.4
GPC Genuine Parts 101.90 2.83 0.72 9/6 4.5 99.72 81.45 8/22/18 2.2
TGT Target 87.94 2.91 0.64 8/14 4.0 87.30 65.25 8/22/18 0.7
Consumer Staples 7.9ADM ADM 50.04 2.68 0.34 8/15 3.9 43.80 42.25 8/22/16 14.2
FLO Flowers Foods 20.31 3.55 0.18 8/30 4.0 20.43 15.75 8/22/18 -0.6
Energy 8.7PSX Phillips 66 113.60 2.82 0.80 8/20 4.3 117.33 89.50 8/22/18 -3.2
VLO Valero Energy 117.13 2.73 0.80 8/6 4.4 68.52 82.44 8/28/17 70.9
Financials 11.8PNC PNC 140.40 2.71 0.95 7/16 3.8 144.92 115.23 8/22/18 -3.1
TRV Travelers 130.01 2.37 0.77 9/7 4.0 123.10 107.50 8/28/17 5.6
UMPQ Umpqua Holdings 21.94 3.83 0.21 6/28 4.0 21.73 19.90 8/22/18 1.0
Health Care 10.2AMGN Amgen 200.58 2.63 1.32 8/16 5.1 171.79 155.00 8/28/17 16.8
BDX Becton, Dickinson & Co 260.63 1.15 0.75 9/6 5.1 199.67 191.50 8/28/17 30.5
Industrials 12.2DAL Delta 57.93 2.42 0.35 7/25 4.0 57.27 44.30 8/22/18 1.2
UNP Union Pacific 157.41 2.03 0.80 8/30 4.2 151.12 119.75 8/22/18 4.2
UPS United Parcel Service 120.39 3.02 0.91 8/17 3.9 122.18 99.75 8/22/18 -1.5
Materials 7.8APD Air Products 168.61 2.61 1.10 9/28 4.1 165.06 144.50 8/22/18 2.2
LYB LyondellBasell 105.31 3.80 1.00 9/4 3.7 114.95 94.55 8/22/18 -8.4
Real Estate 0.0
Technology 16.2CSCO Cisco 47.40 2.78 0.33 7/5 4.1 46.08 38.45 8/22/18 2.9
HPQ HP Inc 25.04 2.23 0.14 9/11 4.1 24.45 18.60 8/22/18 2.4
MXIM Maxim Integrated 57.91 3.18 0.46 8/29 3.8 61.69 48.75 8/22/18 -6.1
XLNX Xilinx 77.57 1.86 0.36 8/7 4.3 72.78 59.75 8/22/18 6.6
Telecom Services 6.1T AT&T 33.60 5.95 0.50 7/9 3.1 32.79 26.50 8/22/18 2.5
VZ Verizon 54.55 4.42 0.60 10/9 3.0 54.26 45.75 8/22/18 0.5
Utilities 6.0AES AES Corp 13.55 3.84 0.13 8/2 2.9 13.94 11.25 8/22/18 -2.8
NEE NextEra Energy 173.65 2.56 1.11 8/29 3.1 171.47 149.10 8/22/18 1.3
Cash 0.2
Performance1:
Since Inception1 QTD YTD
S&P 500 59.56 7.29 10.13 = Recently Added
Model Portfolio 57.34 4.08 8.20
Bespoke Dividend Income Model Portfolio: 9/14/18
1 Bespoke's Dividend Income Model Portfolio began with an
initial value of $100,000 on 7/22/14.