Embed Size (px)
Citation preview
University of Tennessee, Knoxville University of Tennessee, Knoxville
TRACE: Tennessee Research and Creative TRACE: Tennessee Research and Creative
Exchange Exchange
Doctoral Dissertations Graduate School
8-2004
The Benefits and Costs of Concentrated Ownership of Firms in The Benefits and Costs of Concentrated Ownership of Firms in
East Asia and Western European Economies: A Simultaneous East Asia and Western European Economies: A Simultaneous
Equations Approach Equations Approach
Rongrong Zhang University of Tennessee - Knoxville
Follow this and additional works at: https://trace.tennessee.edu/utk_graddiss
Part of the Business Commons
Recommended Citation Recommended Citation Zhang, Rongrong, "The Benefits and Costs of Concentrated Ownership of Firms in East Asia and Western European Economies: A Simultaneous Equations Approach. " PhD diss., University of Tennessee, 2004. https://trace.tennessee.edu/utk_graddiss/2215
This Dissertation is brought to you for free and open access by the Graduate School at TRACE: Tennessee Research and Creative Exchange. It has been accepted for inclusion in Doctoral Dissertations by an authorized administrator of TRACE: Tennessee Research and Creative Exchange. For more information, please contact [email protected].
To the Graduate Council:
I am submitting herewith a dissertation written by Rongrong Zhang entitled "The Benefits and
Costs of Concentrated Ownership of Firms in East Asia and Western European Economies: A
Simultaneous Equations Approach." I have examined the final electronic copy of this
dissertation for form and content and recommend that it be accepted in partial fulfillment of the
requirements for the degree of Doctor of Philosophy, with a major in Business Administration.
Ronald E. Shrieves, Major Professor
We have read this dissertation and recommend its acceptance:
James W. Wansley, Phillip Daves, Joseph V. Carcello
Accepted for the Council:
Carolyn R. Hodges
Vice Provost and Dean of the Graduate School
(Original signatures are on file with official student records.)
To the Graduate Council: I am submitting herewith a dissertation written by Rongrong Zhang entitled “The Benefits and Costs of Concentrated Ownership of Firms in East Asia and Western European Economies: A Simultaneous Equations Approach. ” I have examined the final electronic copy of this dissertation for form and content and recommend that it be accepted in partial fulfillment of the requirements for the degree of Doctor of Philosophy, with a major in Business Administration.
Ronald E. Shrieves Major Professor We have read this dissertation and recommend its acceptance: James W. Wansley Phillip Daves Joseph V. Carcello
Accepted for the Council:
Anne Mayhew Vice Chancellor and Dean of Graduate Studies

The Benefits and Costs of Concentrated Ownership of Firms in East Asia and
Western European Economies: A Simultaneous Equations Approach
A Dissertation
Presented for the
Doctor of Philosophy
Degree
The University of Tennessee, Knoxville
Rongrong Zhang
August 2004

ii
Copyright © 2004 by Rongrong Zhang All rights reserved

iii
Dedication
This Dissertation is dedicated to my parents, Danxing Zhang and Ruiwen Hong, for
always caring for me, supporting me to reach my goal.
iv
Acknowledgements
I am very grateful to my adviser Dr. Ronald Shrieves for his guidance throughout this research. His valuable inputs and encouragement made this work possible. I would like to thank Dr. Jim Wansley, Dr. Phillip Daves, and Dr. Joseph V. Carcello for their academic support and service on my dissertation committee. I also want to thank Dr. Tracie Woidtke for her valuable comments. I acknowledge the financial support of 2003 SARIF research grant and BONHAM dissertation award.
v
Abstract This study uses a simultaneous equations model to examine the impact of ownership structure on corporate policies and performance for listed firms in East Asia and Western Europe. The policy areas examined include dividend, diversification, leverage, and earnings management. Both accounting performance and market valuation are used as performance measures. The empirical analysis reveals that the policy choices are interrelated and have joint impact on firm performance. There exist some regional differences with respect to how ownership structure affects the largest shareholder’s policy decisions. These differences are related to the difference in capital market developments and possibly reflect the nonlinear effects of ownership structure as well. For a sample of 927 listed firms from eight East Asian economies, I find that (1) the level of cash flow rights held by the largest owner is positively related to subsequent dividend payment, diversification, leverage, operating efficiency, and firm value, and negatively related to earnings management; (2) efficiency gains and expropriation costs coexist in firms with concentrated ownership; (3) the expropriation costs increase with the control stake held by the largest owner; (4) firms located in countries with better investor protection pay higher dividends, are less engaged in earnings management, and have superior performance. For a sample of 1,757 listed firms from 13 Western European economies, I find that (1) the level of cash flow rights held by the largest owner has negative effects on leverage and firm value; (2) the excess control rights are negatively related to dividend payment, diversification, leverage, and firm value; (3) strong investor protection is beneficial to minority shareholders. Taken together, this study provides some insights regarding how controlling shareholders choose corporate policies for expropriation purposes. The extant literature largely ignore the interrelationships among firm policies and their joint impact on firm performance. In addition, the empirical results for the listed Asian firms suggest that efficiency gains and expropriation costs coexist in firms with concentrated ownership structure. Some of the expropriation costs born by minority shareholders may be viewed as a price paid for the efficiency gains, supporting the view of Grossman and Hart (1980). This study contributes to the growing body of literature on the efficiency of corporate governance mechanisms around the globe.
vi
Preface This dissertation consists of two essays. Essay 1 addresses the effects of ownership structure on firm policies and performance for a sample of firms from East Asia economies. Essay 2 explores these relationships among Western European firms. Both essays provide background information, literature reviews, model specifications, and discussions on empirical results. At the end of essay 2, a comparison of the results of these two essays is provided.
vii
Table of Contents
Page
Part I Introduction 1
Part II The Benefits and Costs of Concentrated Ownership of East Asian
Firms: A Simultaneous Equations Approach 3
1. Introduction 4
2. Ownership structure, corporate policies and performance 10
2.1. Negative entrenchment effects 10
2.2. Positive alignment effects 11
2.3. Ownership structure and corporate policies around the world 12
2.3.1. Dividend policy 12
2.3.2. Diversification 13
2.3.3. Leverage 14
2.3.4. Earnings management 14
2.4. Ownership structure and performance 15
2.4.1. Operating efficiency 15
2.4.2. Valuation 16
2.5. Summary 17
3. Methodology and sample 17
3.1. Model specification 18
3.2. Sample 19
3.3. Ownership and endogenous variables 20
3.4. Investor protection measures 24
3.5. Other firm- and country-specific control variables 26
3.6. Model and descriptive statistics 28
4. Empirical results 30
4.1. Dividends 30
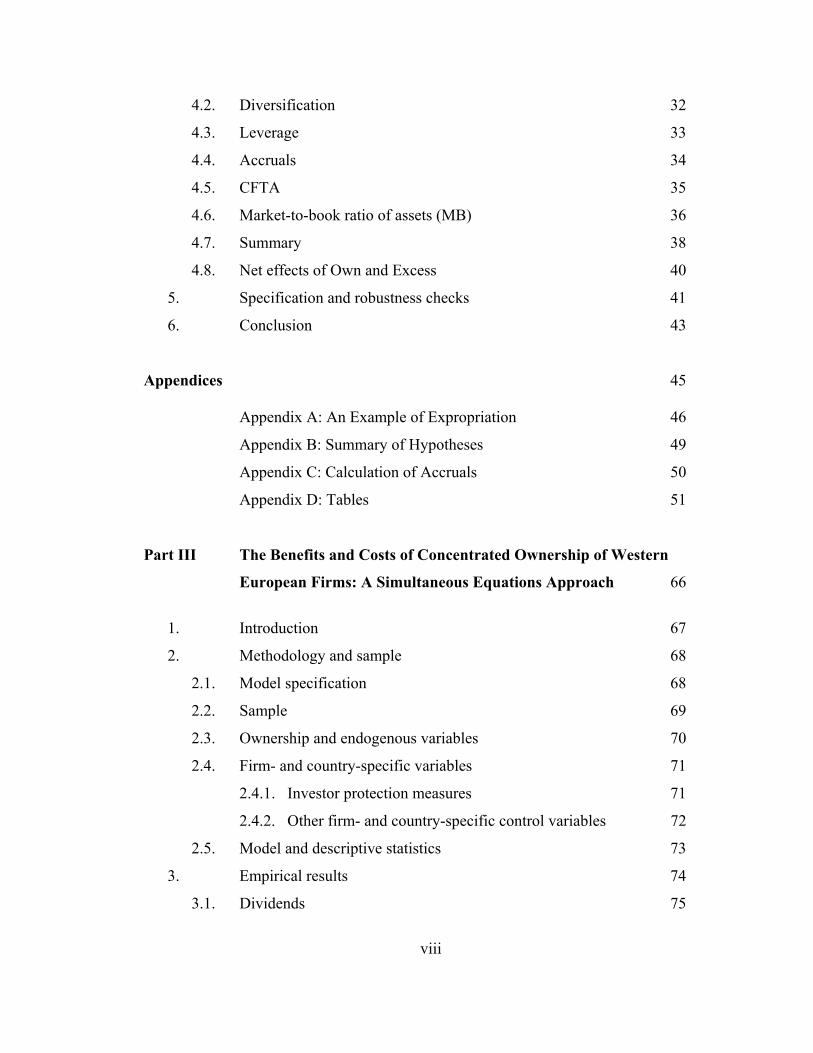
viii
4.2. Diversification 32
4.3. Leverage 33
4.4. Accruals 34
4.5. CFTA 35
4.6. Market-to-book ratio of assets (MB) 36
4.7. Summary 38
4.8. Net effects of Own and Excess 40
5. Specification and robustness checks 41
6. Conclusion 43
Appendices 45
Appendix A: An Example of Expropriation 46
Appendix B: Summary of Hypotheses 49
Appendix C: Calculation of Accruals 50
Appendix D: Tables 51
Part III The Benefits and Costs of Concentrated Ownership of Western
European Firms: A Simultaneous Equations Approach 66
1. Introduction 67
2. Methodology and sample 68
2.1. Model specification 68
2.2. Sample 69
2.3. Ownership and endogenous variables 70
2.4. Firm- and country-specific variables 71
2.4.1. Investor protection measures 71
2.4.2. Other firm- and country-specific control variables 72
2.5. Model and descriptive statistics 73
3. Empirical results 74
3.1. Dividends 75
ix
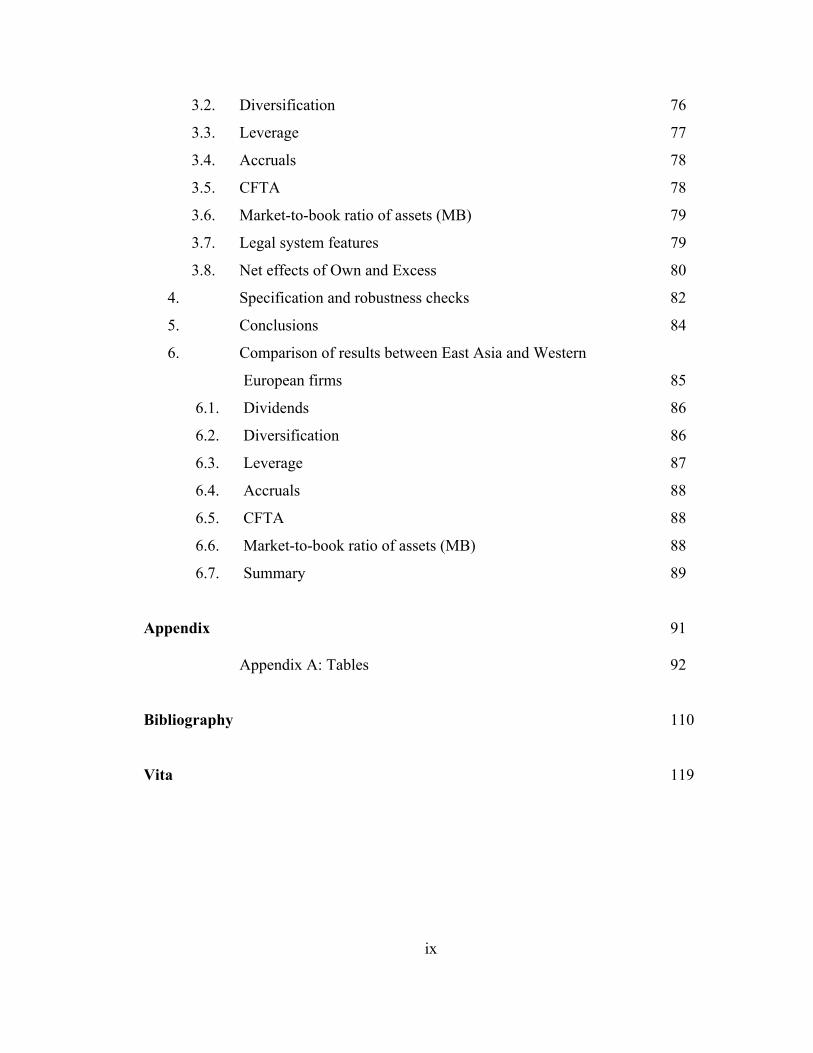
3.2. Diversification 76
3.3. Leverage 77
3.4. Accruals 78
3.5. CFTA 78
3.6. Market-to-book ratio of assets (MB) 79
3.7. Legal system features 79
3.8. Net effects of Own and Excess 80
4. Specification and robustness checks 82
5. Conclusions 84
6. Comparison of results between East Asia and Western
European firms 85
6.1. Dividends 86
6.2. Diversification 86
6.3. Leverage 87
6.4. Accruals 88
6.5. CFTA 88
6.6. Market-to-book ratio of assets (MB) 88
6.7. Summary 89
Appendix 91
Appendix A: Tables 92
Bibliography 110 Vita 119
x
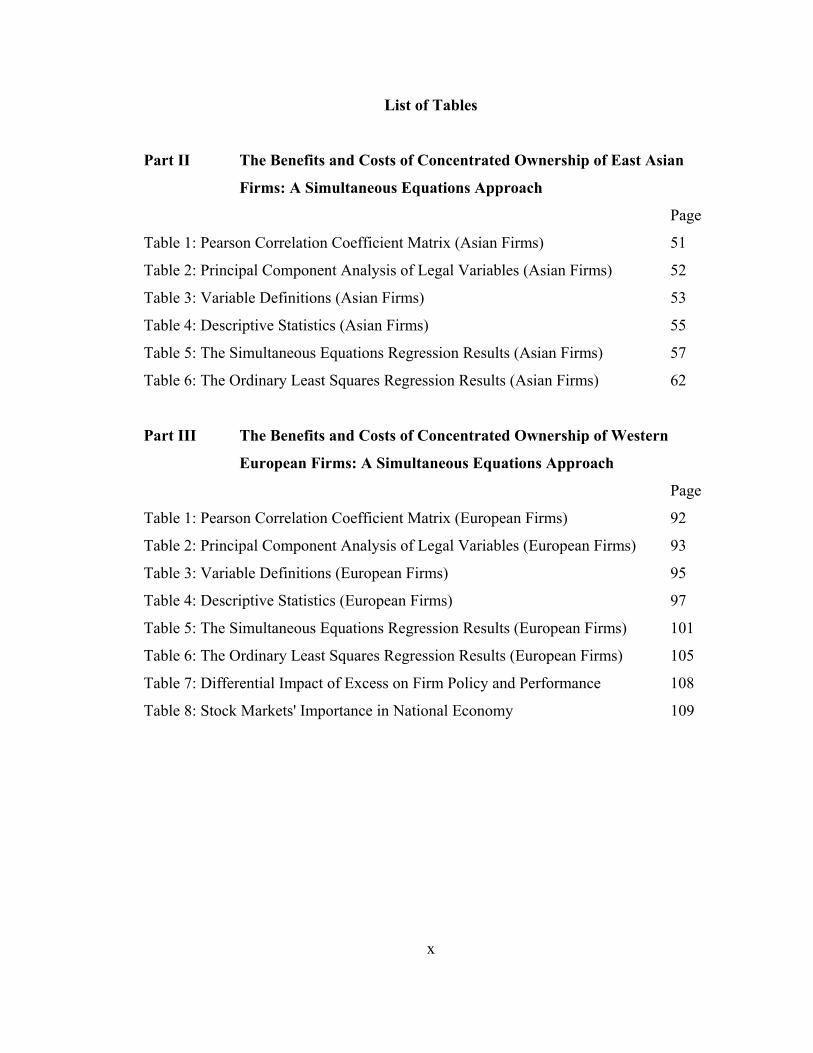
List of Tables
Part II The Benefits and Costs of Concentrated Ownership of East Asian
Firms: A Simultaneous Equations Approach
Page
Table 1: Pearson Correlation Coefficient Matrix (Asian Firms) 51
Table 2: Principal Component Analysis of Legal Variables (Asian Firms) 52
Table 3: Variable Definitions (Asian Firms) 53
Table 4: Descriptive Statistics (Asian Firms) 55
Table 5: The Simultaneous Equations Regression Results (Asian Firms) 57
Table 6: The Ordinary Least Squares Regression Results (Asian Firms) 62
Part III The Benefits and Costs of Concentrated Ownership of Western
European Firms: A Simultaneous Equations Approach
Page
Table 1: Pearson Correlation Coefficient Matrix (European Firms) 92
Table 2: Principal Component Analysis of Legal Variables (European Firms) 93
Table 3: Variable Definitions (European Firms) 95
Table 4: Descriptive Statistics (European Firms) 97
Table 5: The Simultaneous Equations Regression Results (European Firms) 101
Table 6: The Ordinary Least Squares Regression Results (European Firms) 105
Table 7: Differential Impact of Excess on Firm Policy and Performance 108
Table 8: Stock Markets' Importance in National Economy 109

1
Part I. Introduction

2
Publicly traded firms in East Asia and Western European economies have high
ownership concentration. Unlike U.S. firms with relatively dispersed ownership structure,
these Asian and Europeans firms often have a controlling shareholder exerting de facto
control [see Claessens, Djankov, and Lang (2000) and Faccio and Lang (2002)]. In
addition, the ownership structure is further complicated by the use of dual class shares,
pyramiding structure, and cross-holding which often lead to controlling shareholders
having control rights exceeding their cash flow rights, often referred to as having excess
control by large shareholders.1 High ownership concentration, coupled with relatively
poor investor protection, suggests that the primary corporate governance problem in these
firms is the conflict between the controlling shareholder and minority shareholders.
I apply a simultaneous equations approach to examine how the ownership
structure affects firm policies and performance for listed firms from these two regions in
essays 1 and 2 separately. Essay 2 also includes a comparison between the results for the
two regions.
1 The control rights are measured by the voting rights a shareholder is entitled to. The cash flow rights are equal to the equity stake a shareholder owns.

3
Part II. The Benefits and Costs of Concentrated Ownership of East Asia
Firms: A Simultaneous Equations Approach
4
1. Introduction Two effects are hypothesized to coexist in firms with high ownership
concentration: (1) an alignment effect, i.e., the high ownership stake held by large
shareholders provides them strong incentives to engage in firm value-maximization
activities; (2) an entrenchment effect, i.e., if large shareholders obtain sufficient control
rights to entrench themselves, they might expropriate firm resources for their private
benefits at the expense of minority shareholders. Extant literature hypothesizes that
corporate policies may be used for expropriation or bonding devices. In this paper, I try
to disentangle these two effects using a simultaneous equations framework based on the
assumption that the ownership structure affects corporate policy choices and firm
performance.
High ownership concentration may be beneficial to minority shareholders.
Grossman and Hart (1980) predict that outsiders who own very few shares would not take
over a firm to improve it since the incumbent shareholders will demand a share in the
value of the improvement in return for tendering their shares (free-rider problem). In this
case, the outsider who has to pay the entire takeover costs and monitoring costs while
only gaining on the shares he already owns will not pursue the take-over. As a result
there is underinvestment in the search for value improvements, and a loss of efficiency to
the firm and society. Grossman and Hart propose that shareholders have an incentive to
write a corporate charter that allows the raider to dilute the share value of the non-
tendering shareholders once he takes over the firm. This dilution is essentially a
5
permissible expropriation of minority owners’ interests. 2 In their context, the gain due to
large shareholders’ monitoring and improvement in efficiency outweighs the loss due to
expropriation and minority shareholders are better off as a result. Shleifer and Vishny
(1986) also acknowledge the monitoring role of large shareholders.
The conclusion drawn by Grossman and Hart raises an empirical question: what
mechanism will be used to allow “dilution”. The literature often identifies the perquisite
consumption enjoyed by the management or the controlling shareholder as the private
benefits of control [Jensen and Meckling (1976)].3 Controlling shareholders also have
other means to obtain the private benefits of control, such as outright theft, excessive
salaries, special dividends, self-dealing through purchase or sale of assets at prices that
deviate from their fair values [Shleifer and Vishny (1997)]. As pointed out by Dyck &
Zingales, “small deviations from the ‘fair’ transfer price might be difficult or impossible
to prove in court. If these small deviations are applied to large volume trade, however,
they can easily generate sizeable private benefits” [Dyck & Zingales (2004) page 540].
Furthermore, the corporate insider may take advantage of insider information extracted
from his privileged position for private gains that are not enjoyed by minority
shareholders. Demsetz (1986) suggests that large shareholders possess privileged
information and may engage in insider trading. The higher returns from these insiders
trading will not be shared with minority shareholders. However, “These wealth transfers,
may be viewed as part of the cost born by minority shareholders to encourage more 2 Expropriation refers to behaviors through which management or the controlling shareholder transfer assets and profits from corporation to themselves at the expense of minority shareholders. Another term used for expropriation is tunneling. Johnson, La Porta, Lopez-de-Silanes, and Shleifer (2000) and Mitton (2002) provide examples of tunneling in developed countries and in Asian emerging economies. 3 Harris and Raviv (1988) consider the value attached to being in a control position by some shareholders as the private benefits of control.
6
effective monitoring” [Demsetz (1986) p. 315]. In this case, dilution is manifested in the
form of insider trading.
As pointed out by Denis & McConnell (2002), “If large shareholders benefit only
from proportionate cash dividends and appreciation in the market value of their shares
there is no conflict between large shareholders and minority shareholders.” However,
previous studies document that private benefits of control do exist and are quite
substantial in some cases [see Dyck & Zingales (2004)].
Using ownership and financial data of firms in East Asia and Western Europe,
researchers find support for the hypotheses that corporate polices, including dividend [see
Faccio, Lang, and Young (2001a)], diversification [see Claessens, Djankov, Fan, and
Lang (2000)], leverage [see Faccio, Lang, and Young (2001b)], and earnings
management [see Fan and Wong (2002)] are used to facilitate expropriation by the
controlling shareholders. Furthermore, studies document that firms with ownership
structure prone to expropriation problems have lower Tobin’s Q and lower operating
efficiency [see Claessens, Djankov, Fan, and Lang (2002) and Joh (2003)]. These studies
typically use a single-equation OLS regression approach and examine a one-to-one
relationship between ownership and policy/performance. As an example of the problem
with the single-equation OLS methodology in this context, consider two papers by
Faccio, Lang, and Young (2001a and 2001b). Faccio, Lang, and Young (2001a) regress
leverage on ownership structure variables while Faccio, Lang, and Young (2001b)
regress dividend ratios on ownership variables. However, if leverage and dividend
policies are interdependent, each OLS analysis suffers from specification error. Another
example of a single-equation OLS approach is in the paper by Claessens, Djankov, Fan,

7
and Lang (2000) in which they regress a diversification measure on ownership structure.
However, the decision to diversify may also be related to firms’ dividend and leverage
policies [see Appendix A for an example of how the controlling owner may use a
combination of firm policies to facilitate his expropriation activities]. In summary, the
single-equation OLS approach overlooks the fact that corporate policies that may be used
for expropriation purposes are interrelated, i.e., can be substitutes or complements to one
another.
Crutchley and Hansen (1989) contend that managers choose their stock
ownership, corporate dividend and leverage policies to minimize agency costs. Therefore,
these policy decisions are interdependent. Using a reduced form equation approach, they
find that firms with lower diversification costs have higher managerial ownership, rely
less on leverage and dividends to control agency costs. Using a 3SLS simultaneous
equations approach, Jensen, Solberg, and Zorn (1992) document that insiders ownership,
corporate dividend and leverage policies are interrelated directly and indirectly through
firm-specific characteristics. They also suggest that the relationship runs from ownership
to dividend and leverage policies.
In this study, I adopt a simultaneous equations approach to empirically examine
(1) whether the controlling shareholders use a combination of corporate policies to
acquire private benefits; (2) the potential tradeoff between efficiency gain and
expropriation costs. My approach is different from Solberg, and Zorn (1992) in that they
consider the insider ownership is endogenous. Given that the East Asian firms are largely
family controlled and the founding families are unlikely to relinquish their controls, the
8
ownership structure is rather stable overtime, I consider the ownership is exogenous in
the insider’s decision making process.
For a sample of 927 listed firms from eight East Asian economies, I find that (1)
dividend, diversification, leverage policies as well as management of earnings are
simultaneously determined in the insiders’ decision-making process; (2) the cash flow
rights held by the largest owner is positively related to subsequent dividend payment,
diversification, leverage, operating efficiency, and firm value, and are negatively related
to earnings management; (3) at low levels of control, the excess control held by the
largest owner is positively related to dividend payment, diversification, leverage,
operating efficiency, and firm value, and negatively related to earnings management; The
effect of excess control diminishes as control increases. Additionally, I find that, even
after controlling for differences in ownership structure, (4) firms located in countries with
better investor protection pay higher dividends, are less engaged in earnings
management, have higher efficiency and market value.
I also test the sensitivity of the policy and performance measures for a given
change in cash flow rights and excess control held by the largest owner. The results
indicate that the increase in control either through cash flow rights or excess control
generally have positive effects on dividends, operating efficiency, and firm value,
supporting the alignment effect hypothesis. I further carry out the same tests for two
subsets of firms: high control firms (the largest owner has control rights above the sample
median) versus low control firms (the largest owner has control rights below the sample
median). The results suggest that the expropriation problem is more severe for high
control firms, supporting the entrenchment hypothesis. The controlling owners with de
9
facto control are more likely to use leverage and earnings management for expropriation
purposes. The efficiency gain attributable to the presence of large shareholders is
diminishing with the increase in control by the largest owner, implying that there are
either diminishing returns to monitoring or that expropriation costs are increasing.
Taken together, the results support the views of Grossman and Hart (1980) and
Shleifer and Vishny (1986) that the presence of larges shareholders provides efficiency
gains. The results also reveal that expropriation costs and efficiency gains coexist in firms
with concentrated ownership. Some of these expropriations born by minority
shareholders may be viewed as a price paid for the efficiency gains. In the Grossman and
Hart context, this is a form of dilution that is ex ante acceptable to minority shareholders.
This paper contributes to the literature in two ways. First, this study adds to the
growing body of literature that focuses on the corporate governance arrangements outside
the U.S. As pointed out by La Porta, Lopez-de-Silanes, Shleifer, and Vishny (2002, page
1148) (hereafter LLSV) “it is important to recognize the differences in the structure of
ownership and control among firms both within and across countries, since these
differences influence the power as well as the incentives of the controlling shareholders
to expropriate minority shareholders….” Researchers who have examined the differences
in corporate governance systems across countries disagree upon which system is the most
efficient arrangement. Bhide (1993) suggests that there exists trade-offs among different
corporate governance mechanisms. Gilson (2000) argues that competitive forces would
prompt nations to adopt a single efficient governance form that is compatible with their
existing institutional arrangements and economic development. He asserts that the de
facto convergence in corporate governance is more likely to prevail by allowing the

10
improvement in governance practice without changing the fundamental institutional and
legal rules.4
The second contribution of this study is that by adopting a simultaneous equations
approach, I account for the interrelationships among multiple corporate policies and firm
performance. Specifically, I find evidence that dividend, diversification, leverage, and
earnings management are interrelated policy choices. Furthermore, ownership structure
has direct and indirect effects (via policies) on firm performance. Previous studies that
use OLS approach do not provide insight regarding these interrelationships.
The remainder of this paper is organized as follows. Section 2 describes the
agency problem in firms with concentrated ownership. Section 3 introduces the
simultaneous equations model and sample. Section 4 presents empirical results. Section 5
discusses robustness checks of model specification. Section 6 concludes.
2. Ownership structure, corporate policies and performance
In this section, I first discuss the negative entrenchment effect and positive
alignment effect associated with concentrated ownership. Next, I review some recent
empirical findings regarding international differences in firms’ ownership structures and
corporate policies and how these policies are related to ownership structures and
performance.
2.1. Negative entrenchment effects
Maintaining concentrated ownership is accompanied by its own set of costs. The
interests of large shareholders may not be entirely consistent with firm value
4 The literature on corporate governance convergence introduces two types of convergence: De jure convergence which refers to the adoption of similar corporate governance laws across countries versus De facto convergence which refers to the convergence in governance practice.
11
maximization. With effective control, large shareholders are often insulated from the
pressure of the market for corporate control or monitoring from other shareholders, while
only subject to the restraint of the legal protection of minority shareholders and the
discipline of the capital market.5 Minority shareholders can only benefit through value
appreciation of their equity stake and cash dividends in proportion to their cash flow
rights. However, in addition to the same benefits enjoyed by minority investors, large
shareholders may use their discretion over corporate policies to derive private benefits of
control that typically are value-destroying. As pointed out by Cronqvist et al. (2003, page
1), “rational [controlling minority shareholders] face a trade-off between value-enhancing
activities and further extraction of private benefits when maximizing their total
utility….”.6 This problem is similar to the managerial entrenchment problem [see
Morck, Shleifer, and Vishny (1986)]. The entrenchment problem is further exacerbated
when the controlling owner has control rights beyond his cash flow stake since the cost
born by the controlling owner is only proportional to his cash flow stakes.
2.2. Positive alignment effects
Berle and Means (1932) and Jensen and Meckling (1976) argue that the
separation of ownership and control results in the owner-manager conflict. In a widely
held firm, the main agency conflict is between managers and owners. The atomistic
incumbent shareholders are unable and unwilling to monitor the performance of the
management. Both Grossman and Hart (1980) and Shleifer and Vishny (1986) show that
5 If a firm does not have enough internal funds for new investment and has to raise funds in the equity capital market, it will be subject to the scrutiny of the capital market and may have to compete for funds by cultivating a reputation for offering competitive returns on investments. 6 They use controlling minority shareholders (CMS) to refer to shareholders with control rights greater than their cash flow rights. Value-enhancing activities will increase the value of equity held by CMS.
12
increased monitoring of the large shareholder mitigates the agency problem between
owner and managers and enhances firm performance. Furthermore, due to his high
ownership stake, the large shareholder may have incentives to become actively engaged
in setting firm policies to maximize firm value. In a study of the impact of corporate
governance on stock performance during the Asian financial crisis, Mitton (2002) finds
that ownership concentration is positively related to stock returns of 398 firms from five
Asian economies. 7
2.3. Ownership structure and corporate policies around the world
2.3.1. Dividend policy
The managers/controlling shareholders not only benefit from cash dividends and
capital gains proportionate to their ownership stake, but also have opportunities for
private gains. Easterbrook (1984) proposes that dividend payments force firms to raise
fund from capital markets which provide monitoring of managers. Therefore, the
managerial agency problem can be mitigated through dividend policy. Jensen (1986)
views dividend policy from the perspective of free cash flow problem, that is,
managers/controlling shareholders may pay lower dividends in order to retain resources
which can be used for excessive salary, perquisite consumption, or investing in projects
that benefit themselves while decreasing overall firm value. Increasing dividends
payments mitigate free cash flow problem. Dividend policy is hypothesized as a bonding
device to signal outsiders that they will not be expropriated. For example, Faccio, Lang,
and Young (2001b) find that firms that are tightly affiliated with business groups pay
7 He finds that the stock return premium is largely attributable to firms having large shareholders that are independent of management.
13
more dividends when they are perceived to be prone to expropriation problems. They do
not address whether minority shareholders are better or worse off given the coexistence
of large dividend payment and high expropriation costs.
2.3.2. Diversification
Diversification can also be used for expropriation purposes. Claessens, Djankov,
Fan, and Lang (2000) test three hypotheses regarding the large shareholder’s incentive to
diversify the business, namely: (1) the internal capital market hypothesis, which suggests
that diversification creates an internal capital market that is more cost-effective than the
external capital market; (2) the risk-reduction hypothesis, stating that the largest owner
uses diversification to reduce the risks associated with firm-specific investments; (3) the
expropriation hypothesis, stating that the largest owner makes new investments to
generate private benefits. 8 Both (2) and (3) imply a positive relationship between
ownership/control and value-destroying diversification. However, Claessens, Djankov,
Fan, and Lang (2000) point out that when the largest owner holds a low cash flow stake
and high control stake, he bears little firm-specific risk and therefore the incentive to
diversify firm-specific risk is diminishing, the incentive to expropriate is increasing
because his share of expropriation costs is decreasing. Their results support hypothesis
(3), i.e., diversification is positively associated with the difference between control and
cash flow rights of the largest owner, particularly at high levels of control.
8 Mitton (2002) suggests that the opacity of diversified firms in the emerging Asian market give insiders more opportunity to engage in expropriation activities.
14
2.3.3. Leverage
Leverage is hypothesized to be used by insiders to enhance control and thereby
facilitate their expropriation activities. For example, Harris and Raviv (1988) argue that
controlling owners use leverage to inflate their voting power and thus reduce the
discipline of the market for corporate control. Faccio et al. (2001a) study the impact of
ownership concentration on leverage using a sample of listed firms from five European
and nine Asian countries. They document that debt facilitates expropriation by allowing
controlling shareholders to retain control without assuming liabilities directly or diluting
their control stakes.
On the other hand, insiders may use leverage as a bonding device to mitigate
agency problems. For example, Jensen and Meckling (1976) propose that debt constrains
managerial expropriation via reducing free cash flow at mangers’ discretion. In the
context of leveraged buyouts, Jensen (1986) proposes that increasing leverage can reduce
the agency costs of free cash flow. Ross (1977) suggests a signaling equilibrium in which
“high quality” firms identify themselves by adopting high debt levels. Fama and Jensen
(1983a,b) argue that debt limits managers’ ability to expropriate minority shareholders in
U.S. firms due to managers’ career concerns.
2.3.4. Earnings management
Previous literature shows that earnings management is also an important policy in
the context of agency theory. Warfield et al. (1995) find that managerial ownership is
positively related to earnings informativeness and negatively related to the magnitude of
discretionary accruals, suggesting that high ownership stake aligns management’s
interests with minority shareholders and thereby alleviates the earnings management
15
problem. Fan and Wong (2002) suggest that the entrenched controlling shareholders
manipulate earnings to hide their expropriation activities, resulting in lower earnings
informativeness. Leuz et al. (2003) find that earnings management problems are less
severe in countries with strong investor protection and dispersed ownership structure. In
addition, managers/controlling shareholders might manipulate earnings to relieve
accounting based constraints, for example, to meet debt covenant requirements. On the
other hand, if concentration ownership structure enhances efficiency, we may observe
less earnings management in firms with concentrated ownership since the increased
efficiency may mitigate the need to artificially inflate earnings.
2.4. Ownership structure and performance
Extant literature often use two performance measures when examining the effect
of ownership structure on firm performance: (1) operating efficiency, measured by return
on total assets, and (2) the market-to-book ratio of assets. The first measure is used to test
the hypothesis that concentrated ownership improves firm efficiency. The second
measure is used to examine the market assessment of firm value, given existing policy
combinations and operating efficiency.
2.4.1. Operating efficiency
Concentrated ownership affects operating efficiency in two ways: (1) the presence
of a large shareholder mitigates managerial agency problem and improves operating
efficiency [see Grossman and Hart (1980), Shleifer and Vishny (1986)]; (2) large
shareholders may behave opportunistically for their private benefits which may lead to
inefficient resource allocation such as buying or selling assets of firms under their control
at prices unfair to minority shareholders. In her study of a sample of Korean firms, Joh
16
(2003) finds that the controlling shareholders’ cash flow rights are positively related to
firm efficiency measured by return of total assets (ROA) whereas the divergence
between control and cash flow rights of the controlling owner is negatively related to
ROA.
2.4.2. Valuation
Concentrated ownership structure has offsetting effects on firm performance,
namely, a positive effect due to efficiency enhancement versus a negative effect due to
excessive expropriation. In the context of Grossman and Hart (1980), a certain degree of
dilution of non-tendering shareholders interests is ex ante acceptable to minority
shareholders. However, if minority shareholders’ share of efficiency gain is less than
expropriation costs attributable to large shareholders, they may discount firm value.
Claessens, Djankov, Fan, and Lang (2002) argue that the concentrated ownership
structure of East Asian firms is associated with severe agency conflict between the
controlling owner and minority shareholders, manifested in the form of lower valuation.
They find that high cash flow rights held by the controlling owners are positively related
to firm value (the alignment effect) and the divergence between their control and cash
flow rights is negatively related to firm value (the entrenchment effect). Morck, Shleifer,
and Vishny (1986) document a nonmonotonic relationship between board ownership and
firm value (Tobin’s Q) using a sample of 371 Fortune 500 firms. LLSV (2002) find that
17
cash flow rights held by controlling owners are positively related to firm value using a
sample 539 large firms from 27 economies. 9
2.5. Summary
Taken together, from the standpoint of minority shareholders, the presence of
large shareholder presents both benefits (efficiency gain) and costs (expropriation costs).
The studies reviewed above establish the link between ownership structure and corporate
policies as well as performance (see Appendix B for a summary of hypotheses). Clearly,
the four policies (dividend, diversification, leverage, and earning management) are
closely interrelated via a firm’s accounting and cash flow constraints.
Ownership structure has two tiers of effects on firm performance: (1) an indirect
impact through the four policies described above; and (2) a direct impact. The empirical
studies reviewed above only look at the one-to-one relationship between ownership and
another variable of interest (policy or performance measures). Their single-equation
empirical approach fails to account for the interrelationships among the variables. In
particular, it has failed to establish a linkage between financial performance and the
specific financial policy behaviors attributed to controlling shareholders.
3. Methodology and sample
In this study, I take ownership structure as predetermined and policies and
performance as endogenous and simultaneously determined. This approach, coupled with
the general observation that ownership structure is rather stable over time, considers the
ownership structure as predetermined and that it influences the subsequent policy choices
9 Claessens, Djankov, Fan, and Lang (2002) use both cash flow rights and excess control held by the largest owner in their regressions. Morck, Shleifer, and Vishny (1986) and LLSV (2002) only use cash flow rights held by insiders in their models.
18
made by the controlling shareholders. Specifically, I explore how the ownership
structure affects the controlling shareholders’ choices of dividend, diversification,
leverage and earnings management. Previous studies suggest that corporate insiders may
use some of these policies either as bonding devices or as means to facilitate
expropriation. In addition, the methodology incorporates the interrelationships between
policy choices and firm performance. 10
3.1. Model specification
The model consists of two groups of equations: the policy group and the
performance group. The policy group consists of equations (numbered parenthetically)
for the four jointly determined corporate policies: dividend (1), diversification (2),
leverage (3), and earnings management (4). Each individual policy variable is regressed
against ownership structure variables, other policy and performance variables, and
variables that capture firm-specific and country-specific characteristics. The performance
group consists of equations for firm operating efficiency, using the accounting measure
operating cash flow on total assets (CFTA) (5), and a market valuation measure, market-
to-book value of assets (MB) (6).
The six-equation model is based on the assumption that ownership structure
affects the controlling shareholders’ incentives to simultaneously use the four policies
either to engage in value-enhancing activities or to extract private benefits of control.
Ownership structure is hypothesized to have direct and indirect (through the four 10 For a sample of Fortune 500 manufacturing firms, Cho (1998) shows that investment affects firm value and firm value affects ownership structure. For a random sample from COMPUSTAT universe, Himmeberg, Hubbard, and Palia (1999) use a fixed effects model to control for unobserved firm heterogeneity and document a quadratic relation between ownership and firm performance. Given that the majority of the Asian firms included in this study are family controlled, the ownership structure is less likely to be endogenous.
19
corporate policies) effects on operating efficiency and valuation. Additionally, the model
allows for the “feedback” of operating efficiency into the policy choices.
3.2. Sample
The ownership structure data are taken from Claessens, Djankov, and Lang
(2000) which trace the ultimate owner’s cash flow and voting rights of 2,980 publicly
traded firms (financial and nonfinancial firms) from 9 East Asian economies.11
Claessens, Djankov, Fan, and Lang (2002) suggest that the valuation of financial
industries and regulated utilities are not comparable to firms in other industries. Hence, I
exclude corporations in the financial industry (SIC: 6000~6999) and regulated utilities
firms (SIC: 4900~4999). I also exclude Japanese firms because they have distinctive
institutional characteristics and their ownership structure is more dispersed compared to
that of firms from the other eight East Asian economies. 12 I collect annual financial and
business segment data for individual firms using the WorldScope database (2003). I was
able to match 1083 firms having financial and segment information obtained from
Worldscope database with firms having ownership structure data from Claessens,
Djankov, and Lang (2000) by company names.13
11 The nine East Asian economies include Hong Kong, Indonesia, South Korea, Malaysia, the Philippines, Singapore, Taiwan, Japan, and Thailand. 12 Most Japanese corporations are members of keiretsu which is a complex web of intercoporate ownership centered around large banks. As large creditors, coupled with moderate stock ownership, banks exert significant influence over the firms they control [see Morck, Nakamura, and Shivdasani (2000)]. However, the dual roles played by banks may create conflict of interests between the controlling shareholder (banks) and the minority shareholders. The unique situation of these Japanese firms is not captured by the ownership data used in this study. 13 Often times, the names are abbreviated in one source but not the other. Whenever I can not find a match for the firms from the ownership database, I search by the most unique words in the firm name in the Worldscope database. Sometimes, Worldscope indicates the name of the firm has changed and the previous name was the same as the name in the ownership data. Then I consider the firm having the new name as the same one in the ownership database.

20
The ownership data is as of December 1996 or fiscal year 1996. To construct the
policy and performance measures, I use the three-year (1998~2000) average values post
the year for which ownership data is collected. I skip year 1997 to minimize the
distortions of financial ratios due to the Asian Financial Crisis. I use the three-year mean
values to smooth out transitory factors. The final sample includes 927 firms which have
all the information required to construct the policy and other firm-specific control
variables. 14 I perform a cross-sectional analysis by pooling firms across eight East
Asian economies including Hong Kong, Indonesia, South Korea, Malaysia, the
Philippines, Singapore, Taiwan, and Thailand.
3.3. Ownership and endogenous variables
Both control rights and cash flow rights affect the controlling owner’s incentive to
either improve firm value or engage in expropriation activities for his private benefits.
Jensen and Meckling (1976) and other researchers suggest that increasing insiders’
ownership stake will align their interest with minority shareholders which may lead to
firm value maximization. Control rights potentially give the controlling shareholder the
power to use firm policies for private gains. For a given level of control rights, the
smaller the cash flow rights, the lower the cost of expropriation born by the controlling
shareholder. 15 Therefore, all else equal, the larger the divergence between the control
and cash flow rights held by the controlling shareholder, the stronger his incentive is to
14 My sample size is smaller than that of Claessens, Djankov, Fan, and Lang (2002) which also use financial data from WorldScope database and ownership data assembled by Claessens, Djankov, and Lang (2000). They have 1,301 firms in the sample. The ownership data is as of December 1996 or fiscal year 1996. My source of financial information is from 2003 Worldscope database. Over time, bankruptcy, merger and acquisition and other corporate restructuring activities causes some firms originally in the ownership data sample to drop out. 15 The expropriation is akin to the perquisite consumption in the Jensen and Meckling (1976) framework.
21
expropriate minority shareholders. To disentangle the alignment and entrenchment
effect of ownership structure, my analysis focuses on two metrics of ownership structure:
(1) the cash flow rights (Own), and (2) the divergence between control and cash flow
rights (Excess) held by the largest owner. All else equal, high Own will prompt largest
owners to take value-enhancing actions. Excess is used as a proxy for the largest owner’s
incentive to expropriate minority shareholders.
Among others, Morck et al. (1988) document nonlinear ownership effects. Hence,
I include an interaction term (Ex_c) which is the product of excess control (Excess) and a
binary variable High_c to account for this nonlinear effect. High_c is set to 1 if the
control rights held by the largest owner is above sample median control rights (0.30) and
0 otherwise. Hence, when the control rights are higher than the sample median, the total
impact of excess control will be captured by the sum of the coefficients on Excess and
Ex_c. From a modeling standpoint, I include ownership structure variables to capture the
direct effect of ownership structure that are not captured indirectly by the endogenous
policy variables in all six equations.
The dividend policy (Dividend) is measured as total dividends paid divided by
total assets. I use the number of 2-digit SIC segments within a firm as the diversification
measure. Leverage is the ratio of the sum of long-term and short-term debt over total
assets. The degree of earnings management (Accruals) is measured by mean absolute
deviation of the total accruals to assets ratio from its long-term mean [see Appendix C for
the computation of total accruals]. It is known that total accruals are mean reverting.
Accruals of a firm that engages in earnings management will have relatively large
deviations from the long-term mean. I first compute the firm’s average ratio of total

22
accruals to total assets over 1992~1996. Then for 1998 through 2000, I subtract this mean
from each firm’s individual year’s ratio to obtain the deviation. Accrual is defined as the
average of the absolute values of these deviations. I use the ratio of cash flow from
operations to total assets (CFTA) to measure a firm’s operating efficiency. Worldscope
defines cash flow from operations as the sum of net income and all non-cash charges or
credits. It is computed after interest and taxes but before changes in working capital. The
other performance measure, Market-to-Book, is computed as the ratio of the sum of total
book value of debt and preferred stock plus the market value of equity over total book
value of assets.
In each policy equation, other policy variables are also included as control
variables to explore their interrelationships. For example, in the dividend equation,
Dividend is regressed on Leverage, Diversification, and Accruals. Lang and Stulz (1994)
suggest that highly levered firms pay lower dividends because they have to pay higher
interest rate on their loans. Jensen (1986) suggests that leverage and dividends are
substitutes in controlling agency problems. The same conclusion is implicit in Ross
(1977). Dividend and Leverage are also related through the cash budget constraint. Debt
may be used to finance dividend payment. Diversification potentially creates an internal
capital market that may reduce the need for external financing. Therefore, I control for
firm diversification in both the dividend and leverage equations.
CFTA is also used in all the policy equations. All else equal, firms with better
operating performance (higher CFTA) tend to pay larger dividends and, for given growth
opportunities, rely less on outside debt (less leverage). High CFTA also allows firms to
acquire more assets (increased diversification). Firms with low CFTA may tend to have
23
high accruals because the controlling owner manipulates earnings to hide poor
performance in order to avoid outsider’s scrutiny or relieve accounting constrains
imposed by creditors, ceteris paribus.
In equations 5 (CFTA) and 6 (MB), I control for the effect of diversification on
operating efficiency and valuation. Previous studies document that diversified firms trade
at a discount relative to specialized firms [see Lang and Stulz (1994), Berger and Ofek
(1995)]. Diversification motivated by risk aversion of the controlling shareholder may
result in inefficiency (lower CFTA) and a diversification discount (lower market-to-book
ratio). More recent studies offer new interpretations of documented diversification
discount. For example, Campa and Kedia (2002) find that diversified firms trade at a
discount prior to diversification, suggesting the selection bias of studies documenting
diversification discount. Villalonga (2004) uses the Business Information Tracking Series
database to construct measures of diversification and finds a diversification premium.
Villalonga points out that the traditional measure of diversification, which is the number
of different 2-digit SIC segments a firm operates in, captures mainly the aspect of
conglomerate diversification. Therefore the documented diversification discount in
previous studies is primarily attributable to conglomerate discount. My analysis uses the
traditional diversification measure. By including diversification in equation 5, I test
whether conglomerate diversification is efficiency enhancing. The financial policy
variables (dividend, leverage, accruals) are not included in CFTA equation because firm
efficiency directly affects its choice of financial policies (a feedback effect), but financial
policies do not affect operating efficiency. However, since CFTA is computed excluding
interest charges, I expect leverage to have a negative effect on CFTA, all else equal.
24
Equation (6) reflects the impact of ownership structure on market assessment of
firm value. I include all policy choices as explanatory variables to test the indirect impact
of ownership structure (via policies) on firm value. In addition, I control for the effect of
operating efficiency on valuation by including CFTA as an independent variable. As
discussed earlier, ownership structure and diversification affects CFTA. Therefore, the
effect of CFTA in equation (6) reflects an indirect effect of ownership. To account for the
effect of ownership structure that is not already captured by those policy variables and
CFTA, I also include ownership variables as independent variables. The coefficients on
these ownership variables reflect the direct effect of ownership structure on firm
performance. To obtain the net effects of ownership variables, I will use reduced form
coefficients from the simultaneous equations model.
3.4. Investor protection measures
LLSV (1997, 1998, 2000) demonstrate that the legal protection of minority
shareholders plays an important role in corporate governance arrangements. Countries
with strong protection of minority shareholders have more developed financial markets;
their firms have easier access to external financing, and pay higher dividends. Some
important legal determinants used as explanatory variables in this study include a
country’s legal origin, reserve requirements (Reserve), Anti-director index, and creditor
rights [source: LLSV 1998]. The reserve requirement may affect firms’ dividend policy.16
All else equal, high reserve requirements result in lower dividend payment. A high anti-
16 Reserve is measured as the minimum percentage of total share capital that the host country’s corporate laws mandate for corporations to hold to prevent their dissolution. Under this restriction, corporations are required to retain a proportion of their annual earnings until the threshold is reached. This restriction prevents firms from distributing all its earnings as dividends.

25
director index implies strong shareholder protection whereas high creditor rights implies
better creditor protection.
The sample firms come from eight countries with three different legal origins:
English common law (Hong Kong, Malaysia, Singapore, and Thailand), French civil law
(Indonesia, Philippines), and German civil law (Korea and Taiwan). LLSV (1998)
suggest that the overall level of investor protection is higher among common law
countries than civil law countries. Table 1 shows that the Reserve, legal origin binary
variables (En_law, Fr_law), Anti-director index, and Creditor rights variables are highly
correlated.
Instead of using all five variables that will introduce multicollinearity into the
system of equations, I use principal component analysis to derive a smaller set of
uncorrelated variables that contains most of the legal protection information from the full
set.17 Table 2 presents the principal component analysis results. Panel A shows that the
first component (Prin1) accounts for 54.7% of the total variability and has large positive
factor loadings on English law dummy, anti-director index, and creditor rights. Prin1
seems to be a measure of overall legal protection of minority shareholders and creditors.
Table 2 panel B shows that English law countries and German law countries take on
highest and lowest values, respectively, in Prin1. The second component (Prin2) has a
large positive factor loading on the French civil law binary variable and a large negative
factor loading on reserve. The only two French civil law countries in the sample have
zero reserve requirements. Therefore, sample firms from those two countries would have 17 Caution should be taken in interpreting the principal component results. In the context of biological studies, Pearce (1965) suggests that any hypothesis developed using principal component analysis that seems plausible can only be considered subjective until confirmed by existing biological knowledge or additional studies.

26
largest Prin2 values. For countries with German or English law origins, high reserve
requirements result in low Prin2 value. Prin3 has a large positive loading on creditor
rights and a large negative loading on anti-director index. Hence, Prin3 is high in
countries where creditor rights have relatively higher priority as compared with
shareholder protection. German law countries and French law countries take on highest
and lowest values in Prin3 respectively. The first three components collectively account
for 92.8% of the total variability which indicates that these three components contains the
majority of the legal variable information. The common practice in principal component
analysis is to retain components with eigenvalues greater than 1. Although Prin3’s
eigenvalue is less than 1, it is still relatively close to 1 and it alone explains 12% of total
variation. I include the first three principal components in my final analysis.
3.5. Other firm- and country-specific control variables
In all six equations, I use the natural log of total assets (Size) to control for the
size effect. Previous studies find that firm size is an important determinant of firm
policies. Extant literature suggests that the presence of blockholders may increase
monitoring on the controlling owner or management, which in turn affects firm
performance. Hence, I use a blockholder binary variable (Block) to control for the effect
of block ownership. Block is set equal to 1 if there exists a second largest owner with at
least 10% voting rights. The presence of other large shareholders may either alleviate the
expropriation problem (if they monitor the controlling shareholder) or exacerbate it (if
they collude with the controlling shareholder to act against minority shareholders).
I use a binary variable (Group) to indicate if a firm is affiliated with a business
group. The controlling owners in Asian business groups maintain their control through
27
various control-enhancing techniques such as pyramidal structures, cross-holdings, and
multiple control chains. The use of these complex ownership arrangements leads to
owners having more control rights than their ownership stake, giving them incentives to
engage in expropriation activities. In addition, firms affiliated with business groups may
suffer more from insiders’ self-dealing activities because controlling owners can engage
in intra-group transfers which divert wealth from firms they have lower ownership stake
to those they have higher ownership stake. Joh (2003) documents that Korean firms that
are affiliated with business groups are less profitable relative to independent firms,
suggesting more expropriation among group affiliated firms. Faccio, Lang, and Young
(2001b) document that dividend payment is related to how tightly a firm is affiliated with
a group.
In the Dividend equation, I use the three-year (1998-2000) mean of the ratio of
total capital expenditure to net sales (Capex) to account for the effect of investment
opportunities on dividend payment. In the diversification equation, I control for the effect
of the level of economic development on firm’s diversification by including the per
capita GDP of an economy (GDP). Claessens, Djankov, Fan, and Lang (2000) document
that economic development may have a positive impact on diversification.
In their ownership data, Claessens, Djankov, and Lang (2000) categorize the type
of the largest owner as state, family, widely held company, and widely held financial
institutions. I conjecture that the incentive for an individual or his family to diversify
their firm-specific risk is stronger relative to other owner types, ceteris paribus.
Therefore, I include a binary variable (Family) indicating whether the largest owner is an
individual or a family.
28
In the leverage equation, I control for the effects of asset tangibility (Tangible)
and non-debt tax shield (NDT) on leverage. All else equal, the proportion of tangible
assets increases debt capacity. Non-debt tax shield substitutes for the tax benefits of debt.
Hence, I expect a negative relationship between NDT and leverage. Tangible is measured
as the natural log of the ratio of fixed assets to total assets. NDT is computed as the ratio
of depreciation and amortization expenses over total assets. In the Accruals equation, I
control for the impact of earnings volatility (Vol) on accruals. All else equal, firms with
more volatile earnings may use higher accruals to smooth their earnings. Vol is calculated
as the standard deviation of earnings for firms with at least five-years of historical data.
In the market-to-book equation, I use the 3-year (1998-2000) average growth rate in sales
(Grow) to account for the effect of growth opportunities on firm value. I expect high
growth firms to receive high valuation.
3.6. Model and descriptive statistics
The six-equation model described above is summarized as follows. In all
equations, I control for industry effects with ten-industry binary variables (Industry1-10)
using Campbell’s (1996) industry classification.18
Policy Group Equations:
Dividends = f1(Own, Excess, Ex_c, leverage, diversification, accruals,
CFTA, size, Capex, block, group, Prin1, Prin2, Prin3, Industry1-10)
(1)
18 Campbell (1996) industry classification is defined as follows: petroleum (SIC 13, 29), consumer durables (SIC 25, 30, 36, 37, 50, 55, 57), basic industry (SIC 10, 12, 14, 24, 26, 28, 33), food and tobacco ( SIC 1, 2, 9, 20, 21, 54), construction (SIC 15, 16, 17, 32, 52), capital goods (SIC 34, 35, 38), transportation (SIC 40, 41, 42, 44, 45, 47), unregulated utilities (SIC 46, 48), textiles and trade (SIC 22, 23, 31, 51, 53, 56, 59), services (SIC 72, 73, 75, 76, 80, 82, 87, 89), and leisure (SIC 27, 58, 70, 78, 79).

29
Diversification = f2(Own, Excess, Ex_c, leverage, dividends, accruals, CFTA, size,
GDP, block, group, Family, Prin1, Prin2, Prin3, Industry1-10) (2)
Leverage = f3(Own, Excess, Ex_c, dividends, diversification, accruals, CFTA,
size, Tangible, NDT, block, group, Prin1, Prin2, Prin3, Industry1-10) (3)
Accruals = f4(Own, Excess, Ex_c, dividends, leverage, diversification, CFTA, size,
vol, block, group, Prin1, Prin2, Prin3, Industry1-10) (4)
Performance Group Equations:
CFTA = f5(Own, Excess, Ex_c, diversification, size, block, group,
Prin1, Prin2, Prin3, Industry1-10) (5)
Market-to-book = f6(Own, Excess, Ex_c, dividends, diversification, leverage, accruals,
CFTA, size, grow, block, group, Prin1, Prin2, Prin3, Industry1-10)
(6)
A summary of variable names and definitions is given in Table 3.
Table 4, Panels A [B] present the overall mean [median] and mean [median] by
country of all the variables used in the model. The largest owner on average has 30% of
control rights and owns 25% equity. On average, the largest owner has 4.6% excess
control rights. There is a large variation in excess control---63% of firms in the sample
have no excess control, the maximum excess control held by the controlling owner is
35%. At this high end of divergence between control and cash flow rights, the controlling
owner has a strong incentive and enough clout to expropriate minority shareholders. In
addition, the majority of firms are family-controlled. Nearly half of the sample firms have
30
a blockholder in their ownership structure and 42% of the firms are affiliated with
business groups.
Across countries, there is substantial in-sample variation in ownership structure.
The average control rights [cash flow rights] held by the largest owner varies from
21%[18%] in Korea to 38%[36%] in Thailand. Given the highest ownership
concentration, the Thai firms have the smallest average excess control on average.
Overall, these East Asian firms exhibit high ownership concentration, coupled with
family control and/or group affiliation, suggesting that the controlling owner and
minority owner conflict might be severe.
4. Empirical results
Table 5 gives the structural form results for the three-stage least squares (3SLS)
estimation of the simultaneous equations model. Some of the industry binary variables
are statistically significant in various equations, suggesting the presence of industry
effects (the industry coefficients are not shown). Estimation results for each equation are
discussed below in the order of control variables, policy variables, and ownership
structure variables.
4.1. Dividends
The positive coefficient on Size implies that large firms tend to pay more
dividends. Large firms may be mature firms in their industry and have proportionally
fewer growth opportunities than small firms. Therefore, they are likely to retain
proportionally less cash for new investments. The coefficient on capital expenditure ratio
(Capex) is not statistically significant. The insignificant coefficient on Block suggests
that the presence of a second large shareholder has no significant effect on dividend
31
policy.19 The negative coefficient on group affiliation dummy (Group) suggests that firms
that have ties with business groups tend to pay lower dividends to outsiders. Table 2
shows that English law countries have highest Prin1 values. LLSV (1998) report that
English law countries offer the strongest overall investor protection. The positive
coefficient on Prin1 is consistent with the findings of LLSV (2000) that countries with
good investor protection tend to make higher dividends payment. Prin3 is a contrast
between creditor rights and shareholder rights. Countries with high Prin3 value favor
creditor over shareholder. Prin3 has an expected sign, suggesting that all else equal,
strong creditor protection coupled with weak shareholder protection results in lower
dividends, however it is not statistically significant.
Leverage and Accruals are strongly significant (p value <.0001) while
Diversification is close to 10% significance, suggesting that these policies are related to
firms’ dividend policy. Firms that are more diversified pay lower dividends, consistent
with the view that more resources have to be used to acquire new assets. The negative
relationship between Dividend and Leverage suggests that they might be substitutes as
bonding mechanisms. Dividend payments remove free cash flows that are at discretion of
the controlling shareholders. High leverage has a similar effect since the firm is
committed to make fixed interest payments. Dividend payment is positively related to
Accruals. One possible explanation may be that firms that are more aggressively
managing earnings also use high dividends to mitigate outsiders’ concern about being 19 The blockholder binary variable is set to 1 if there exists a second largest owner having at least 10% control rights. Claessens,Djankov, and Lang (2000) data does not have information of the cash flow rights held by the second largest owner. With missing information on the cash flow rights of the blockholder, I am unable to draw definitive conclusion with respect to the blockholder’s incentive to either collude with the largest shareholder (exacerbate expropriation) or increase monitoring on the largest shareholder (alleviate expropriation).
32
expropriated. It is also possible that the income-smoothing accruals may facilitate high
dividend payments. The positive coefficient on CFTA is consistent with the view that
firms with higher efficiency make higher dividend payments, all else equal, although it is
not statistically significant.
Own has a significant positive coefficient, consistent with the positive alignment
effect of high ownership concentration. The positive coefficient on Excess is consistent
with the view that dividend policy is used as a bonding device to mitigate outsiders’
concern for expropriation. The negative but insignificant coefficient on Ex_c provides
some weak evidence of nonlinear ownership effect, i.e., the impact of excess control
diminishes as the largest owner achieves de facto control since any increase in control
rights does not further entrench the controlling shareholder. Whether rational investors
factor in the signaling effect of high dividends payment in their valuation will be
addressed in the market-to-book equation.
4.2. Diversification
As expected, since larger firms are generally more diversified, firm size (Size) has
a positive coefficient. The economic development of a country as proxied by GDP per
capita does not have an impact on diversification. The three binary variables Block,
Group, and Family have no significant effect on diversification. The positive coefficients
on Prin1 imply that countries with good investor protection have more diversified
business operations. These countries generally have active markets for corporate control
via mergers and acquisition which may also results in more diversified business. Prin2
takes on large values for countries with French civil law origin and low reserve
requirement. LLSV (1998) document that French law countries offer the weakest investor

33
protection. Hence, the positive relationship between Prin1, Prin2 and Diversification
implies that legal protection alone may not be the important factor of firm diversification.
Leverage is negatively related to Diversification, although only marginally
significant. The negative relation between operating efficiency and Diversification will
be further addressed in the CFTA equation.
Own and Excess are positively related to Diversification, although only
significant at 10% level, consistent with both the risk reduction and expropriation
hypotheses.
4.3. Leverage
Firm size is positively related to Leverage, implying that large firms have higher
debt capacity. The asset tangibility (Tangible) and non-debt tax shield (NDT) do not
significantly impact leverage. Leverage of firms having blockholders is no different from
that of firms without blockholders. Group affiliation (Group) is negatively related to
Leverage. Prin1 and Prin2 are positively related to leverage.
Consistent with the results of equations 1 and 2, Dividends and Diversification are
negatively related to Leverage. Dividends and Leverage may act as substitute bonding
devices. Diversification creates an internal capital market which reduces the dependence
on external borrowing. Leverage is positively related to Accruals. One possibility is that
controlling shareholders may use earnings management to increase debt capacity or to
ensure compliance with debt contract provisions. The relation between operating
efficiency and leverage is insignificant.
The positive relationship between Own (Excess) and Leverage is consistent with
both the signaling and the expropriation hypotheses. The signaling hypothesis implies

34
that the controlling owner commits himself to make future cash flow payment to
creditors, mitigating agency costs of free cash flow. The expropriation hypothesis says
that controlling shareholders use high leverage to enhance control and thereby facilitate
expropriation [see Faccio, Lang, and Young (2001a)].
4.4. Accruals
The negative coefficient on Size suggests that larger firms have lower accruals.
Earnings volatility (Vol) has the predicted sign but is not statistically significant. Block
has an insignificant positive effect on Accruals. Group affiliated firms are more engaged
in earnings management consistent with the view that expropriation is more pervasive in
group affiliated firms. Prin1 is negatively related to Accruals, supporting the findings of
Leuz et al. (2003) that countries with good investor protection are less likely to
manipulate earnings.
Dividends and Leverage are positively related to Accruals. Suppose controlling
shareholders attempt to use large dividend payment to offset outsiders’ fear for
expropriation, they may simultaneously engage in other less observable self-dealing
activities for private gains and manipulate earnings to prevent the detection of these
behaviors. Highly levered firms are more subject to accounting-based constraints that
motivate controlling shareholders to aggressively manage earnings.
The negative relationship between Own and Accruals is consistent with the
alignment effect hypothesis. It seems to be counterintuitive that Excess is also negatively
related to Accruals, given that excess control implies strong incentives for expropriation.
35
4.5. CFTA
The positive sign on Size suggests that larger firms operate more efficiently.
Block and Group have no significant relationship with firm efficiency. The positive
coefficient on Prin1 suggests that firms in countries with good investor protection have
relatively high operating efficiency. The positive coefficient on Prin2 indicates that
French civil law countries and those with low reserve requirements are more
operationally efficient. This shows that poor investor protection does not necessarily
result in poor operating performance.20
The negative coefficient on Diversification implies that over-diversification
causes inefficiency, consistent with the hypothesis that diversification is used to increase
private benefits.
The positive coefficient on Own supports the alignment effect hypothesis. The
positive effect of Excess is consistent with Grossman and Hart’s (1980) contention that
there are monitoring benefits from large shareholders. Controlling shareholders may be
motivated to run firms efficiently so that they have more resources to divert to
themselves. Minority shareholders face the tradeoff between expropriation costs and
gains from monitoring.
Given that CFTA is computed excluding interest charges, leverage would have a
negative effect on operating efficiency, ceteris paribus. As a robustness check, I include
leverage as a control variable in CFTA equation and rerun the modified simultaneous
equations model. The results (not reported here) are very similar to those reported in
20 LLSV (1998) suggest that the overall level of investor protection is worst among French civil law countries and best among English common law countries.
36
Table 5. The noticeable differences are: in the dividends equation (1), CFTA has a
positive and strongly significant coefficient. The coefficient on CFTA was positive in the
original specification, but not statistically significant. Excess is only significant at 10%
level; in the diversification equation (2), excess is no longer significant; in the accruals
equation (4), CFTA has a significant negative coefficient, suggesting low performance
firms are more likely to suffer from earnings management problem; in the CFTA
equation (5), excess is only marginally significant at 10% level. As expected, leverage
has a negative effect on CFTA, that is, all else equal, high interest payments reduce
CFTA since it is computed after interest payments.
4.6. Market-to-book ratio of assets (MB)
Growth opportunity (Grow) is positively related to MB, although only marginally
significant. Larger firms receive higher value. Although some of the East Asian
economies have well developed financial markets, e.g., Hong Kong and Taiwan, the
overall level of capital market development in this region is lacking relative to the US
and developed countries in Europe. The investors may view large firms more positively
due to the advantages of an internal capital market and reputation effects. In addition,
large firms have more analysts following and have less information asymmetry relative to
small firms. Firm size may be a proxy for these factors. Block has no significant relation
with MB. Group affiliated firms receive lower valuation relative to independent firms,
implying that investors are more alert to expropriation among group affiliated firms and
discount MB accordingly. The positive coefficient on Prin1 provides additional evidence
of benefits of legal protection of investors. The negative coefficient on Prin3 shows that

37
poor shareholder protection and/or strong creditor protection lead to low MB. It appears
that the dominance of creditor interests over those of shareholders hurts firm valuation.
According to the signaling hypothesis, high dividend payments and/or high
leverage signal outsiders that they are less likely to be expropriated. Therefore, these two
policies should be positively related to MB. It is also known that mature firms tend to
have high dividends yield and high leverage ratio. If investors perceive firms with large
dividends payment and/or leverage as signs of lack of growth opportunity, then they will
assign low market value to these firms. Therefore, we expect a negative relationship
between market-to-book ratio and dividends/leverage. In the Accruals and CFTA
equations, Excess is negatively related to Accruals and positively related to CFTA.
Excess has been used as a proxy for the potential for expropriation [see Claessens,
Djankov, Fan, and Lang (2002)]. The results suggest that excess control increases
efficiency, which may reduce the need for earnings management. The positive coefficient
on Accruals in MB equation suggests that investors do not discount firm value for more
aggressive earnings management. Diversification has a negative but insignificant impact
on MB. This suggests that investors do not consider or may not be aware that
diversification is a means for expropriation. As expected, CFTA is positively related to
MB.
The positive coefficient on Own is consistent with the positive alignment effect
hypothesis. The switch of signs on Excess and Ex_c indicates the existence of nonlinear
effect of excess control. At low levels of control, Excess has a direct positive impact of
MB. However, this effect reverses when the largest owner has control rights above the

38
sample median, suggesting the expropriation problem is more severe at high levels of
control.
4.7. Summary
The regression results indicate that cash flow rights (Own) and excess control
rights (Excess) have direct effects on firms’ financial and operating policies as well as on
firm performance. Specifically, the positive effects of Own on Dividend, CFTA, and MB,
and the negative effect of Own on Accruals are consistent with positive alignment effects
of concentrated ownership. The interaction term Ex_c is used to delineate the nonlinear
effects of ownership. At low levels of control, Excess is positively related to Dividend,
consistent with the view that insiders use high dividend payment to mitigate minority
shareholders’ concern about being expropriated [see Faccio, Lang, and Young (2001b)].
The positive relation between Excess and Leverage supports both the expropriation
hypothesis, which contends that controlling owners use leverage to enhance control and
thereby facilitate their expropriation activities, as well as the bonding hypothesis, i.e.,
controlling owners can voluntarily use leverage as a bonding device to mitigate outsiders’
fear for expropriation. The positive effect of Excess on CFTA and MB implies that the
presence of large shareholders is beneficial to minority shareholders despite the potential
expropriation by controlling owners. There is some weak evidence indicating that the
controlling owners use more diversification if their cash flow and /or excess control
rights are higher, This is consistent with the risk reduction hypothesis, i.e., they are more
likely to diversify firm business when they have high ownership stake. It is also
consistent with the expropriation hypothesis which states that diversification is used for
expropriation purposes even if they have low ownership stake (large excess control).
39
The coefficient estimates on Ex_c have the opposite signs of those on Excess in
all six equations, indicating the existence of nonlinear effect of excess. The sum of
coefficients on Excess and Ex_c is the entire effect of excess control for firms with high
levels of control. Ex_c is negatively related to Dividends, Diversification, Leverage, and
MB, suggesting that, when control levels are high, with increasing excess control, (1)
insiders are less likely to pay more dividends, indicating more expropriation; (2) they are
less likely to diversify; (3) they use lower leverage; (4) the positive monitoring effect of
controlling owner is diminishing; (5) minority investors discount firm value.
The principal component analysis introduces three uncorrelated variables
containing the majority of investor protection information into the system. Prin1 is a
measure of overall level of investor protection. The positive effects of Prin1 on
Dividends, CFTA, and firm value are consistent with the view that strong investor
protection is beneficial to minority shareholders. The negative effect of Prin1 on Accrual
is consistent with the findings of Leuz et al. (2003), suggesting that insiders are less
engaged in earnings management if the country offers better investor protection. Prin2 is
mainly a contrast between French law and German law countries. The positive effects of
Prin2 on Diversification and Leverage imply that French law countries use more
diversification and leverage relative to their German peers, all else equal. Interestingly,
Prin2 also has a positive effect on CFTA. Hence, countries with poor investor protection
do not necessarily have inefficient business operations, although the insignificance of
Prin2 in the MB equation suggests that the efficiency gains are captured by controlling
shareholders.
40
4.8. Net effects of Own and Excess
The structural form estimates discussed above present both the policy effect and
the direct ownership effect for each equation. Table 5 Panel C presents the net effect of
Own and Excess on policy and performance variables. Using reduced form coefficients
estimates, I compute the change of the estimated values for each of the endogenous
variables for a 5% change in Own or Excess. For the whole sample, a 5% increase in
Own has positive effects on Dividends, CFTA, and MB, and negative effects on
Diversification, Leverage, and Accrual. These results are consistent with the alignment
effect of cash flow rights (Own), i.e., high ownership aligns insiders’ interest with those
of minority shareholders and thereby increases dividends payment, enhances efficiency,
and increases MB, while reducing inefficient diversification, decreasing leverage and
accruals.
For the whole sample, a 5% increase in Excess has similar effects as the increase
in Own except for Diversification. Excess has been hypothesized to increase controlling
shareholders’ incentive to expropriate outsiders. The positive effects of Excess on CFTA
and MB suggest that the benefits associated with concentrated ownership outweigh the
potential expropriation costs.
All else equal, I expect that the controlling shareholders have more opportunities
to expropriate minority shareholders if they have de facto control. Therefore, I divide the
sample into two subsets: (1) low control firms which have largest owners with control
rights below the sample median (30%) and (2) high control firms which have largest
owners with control rights above the sample median. A 5% change in Own has similar
effects on firm policies and performance for both the low control and high control firms.
41
Noticeably the positive effects on Dividends and CFTA are much smaller for high control
firms, a 5% increase in Own increase Dividends by 15.4% (8.9%) and CFTA by 20.6%
(11.7%) for low(high) control firms.
The effect of a 5% change in Excess has quite different impact: the positive
effects on Dividends, CFTA, and MB are much smaller for the high control firms. The
increase in Excess reduces Accruals by a larger extent for low control firms than for high
control firms. The increase in Excess increases Diversification and decreases Leverage
for low control firms but decreases Diversification and increases Leverage for high
control firms.
Taken together, the results suggest that the expropriation problem is more severe
for high control firms. The controlling owners with de facto control are more likely to use
leverage and earnings management for expropriation purposes. The efficiency gain
attributable to the presence of large shareholders is diminishing with the increase in
control by the largest owner, implying expropriation costs are increasing or the
monitoring benefits are diminishing.21
5. Specification and robustness checks
The recent Asian corporate governance studies generally adopt Ordinary Least
Squares regression (OLS) approach [see Claessens, Djankov, Fan, and Lang (2000,
2002), Faccio, Lang, and Young (2001 a, b), Fan and Wong (2002)].22 As a robustness
check, I run six equations separately using the OLS approach. Table 6 reports the
regression results. Compared with the 3sls results in table 5, the ownership variables are 21 In their Asian ownership data, Claessens, Djankov, and Lang (2000) document that there is often no separation between management and the controlling owner. 22 Claessens, Djankov, Fan, and Lang (2002) uses a random effect model. Fan and Wong (2002) run fixed effect model using panel datasets.
42
less significant in OLS models. The coefficients on some policy variables have opposite
signs depending on the estimation techniques.
I conduct the Hausman endogeneity test [see Hausman (1978)]. The test results
indicate that the policy and performance variables are endogenous to the system. The 3sls
approach accounts for the interdependencies among firm policies and their joint impact
on firm value while the OLS approach ignores them. The single OLS model approach in
previous studies may suffer from simultaneous equation bias.
Faccio et al. (2001b) report that the dividend ratio is related to Excess control and
the “tightness” of group affiliation dictates this relationship. To replicate their results, I
create a group affiliation dummy using their definition and an interaction term between
group and excess control. 23 Instead of using Own, Excess, Ex_c, I use Own, Excess,
Ex_gp (the interaction term of Excess and Group dummy) and rerun the simultaneous
equation model. 24 I also identify firms that are tightly or loosely affiliated with business
groups using their definition and rerun my model. The results (not reported here) are very
similar to those reported in Table 5.
As an additional robustness check, I use 2-stage least square estimation method to
estimate the model. The coefficient estimates almost always have the same signs as those
reported in Table 5. However, 3 stage least square estimation has more significant
estimates due to the smaller standard errors. Lastly, I run the specification in Table 5
using only the first two principal components. The signs and significance of variables are
essentially unchanged.
23 Due to data unavailability, my group definition only closely resembles their definition. 24 I also leave out the group dummy by itself.
43
6. Conclusion
Given high ownership concentration and disparity of control and cash flow rights,
the primary agency problems afflicting East Asian firms are the conflict between
controlling shareholders and minority shareholders. Using a simultaneous equations
model approach, I find that the cash flow rights held by controlling shareholders are
positively related to dividend payment, CFTA, and market-to-book, consistent with the
findings of LLSV (2000, 2002) and Joh (2003). Dividends and excess control are
positively related, consistent with the view that insiders use high dividend payment to
alleviate minority shareholders’ concern about expropriation. The positive relation
between leverage and excess control supports either the expropriation hypothesis or the
bonding hypothesis. The ownership effect on diversification is marginally significant and
supports both the risk reduction hypothesis and the expropriation hypothesis.
The reverse of signs on excess control at high control levels indicates the
existence of a nonlinear control effect. At low levels of control, excess control improves
operating performance and firm valuation, suggesting that increased monitoring from
large shareholders are beneficial to minority shareholders [see Grossman and Hart
(1980), Shleifer and Vishny (1986)]. As the level of control rights held by the largest
owner increases, the monitoring benefits seem to diminish. There is some indirect
evidence suggesting a diversification discount---diversification has a direct negative
effect on CFTA that is positively related to the market-to-book ratio although
diversification by itself only has an insignificant effect on the market-to-book ratio.25
25 Recall that, according to Villalonga (2004), the number of industry segments in a firm is not a perfect measure of diversification because it tends to reflect only conglomerate diversification.
44
Firms affiliated with business groups are more prone to expropriation problems and
thereby receive lower valuation. Results for the components reflecting legal system
features suggest that firms in countries with better shareholder protection pay higher
dividends, are less engaged in earnings management, and receive higher valuation.

45
Appendices
46
Appendix A: An Example of Expropriation
This example demonstrates how controlling shareholders use combinations of
corporate policies to expropriate minority shareholders. Suppose a family group AB
(hereafter AB) owns 20% of the stock of company B, has 20% voting rights. Further,
assuming AB has de facto control of B’s corporate policies. AB also owns 100% of firm
A.
Suppose B has 20 million dollars in cash. AB makes decisions about the use of
B’s cash [see Exhibit 1 B’s balance sheet]. Consider three cases (there are an infinite
number of combinations). In Case 1, AB let B pay out 10 million dollars cash dividends
to shareholders. This leads to higher dividend payments and an increase in leverage. AB
receives its share of dividends ($ 10 * 20% = 2 million). Assuming dividend payout is a
wealth neutral event, AB and B’s wealth are not affected. In Case 2, AB instructs B to
acquire company A which is 100% owned by AB at 30 million dollars while the fair
market value is only 25 million. To complete this acquisition, B has to forgo dividend
payments. In addition, B has to borrow 10 million dollars. This leads to an increase in B’s
leverage from original 0.3 to 0.36. Through this transaction, AB gains for its share
(100%) on the $5 million dollar premium and shares the loss of 20% for the premium
price paid by B. Therefore the net gain to AB is ($5*100%-$5*20%) = $ 4 million. B’s
minority shareholders share a loss of 4 million dollars. In case 3, B may use the cash to
reduce its debt by 10 million, decreasing B’s leverage from 0.3 to 0.13. Suppose the
original leverage was too high for B, the activity to lower leverage may have a positive
impact on B’s market value. Arbitrarily I assign a value of 3 million to the increase in
B’s market value, AB shares 20% of the increase in value, therefore the net gain to AB is
47
0.6 million dollars while B’s minority shareholders share an increase in wealth of 2.4
million dollars. Clearly, case 2 allows AB to extract all cash out of B and realize the
largest gain.
In addition, AB may have incentives to manipulate earnings of B to disguise his
expropriation activities.26 The expropriation is detrimental to B’s performance. In Case 2,
B’s diversification increases which also affect dividend and leverage policies as well as
minority shareholders’ wealth.
Suppose we change the cash flow stake of AB in B to 5%. Assuming AB still has
de facto control (20% voting rights). Now the expropriation cost to AB is smaller due to
lower ownership stake. Therefore the private benefits to AB are larger. Therefore, for a
given level of control, the larger the divergence between control and cash flow rights, the
stronger the incentive the controlling shareholder has to engage in expropriation
activities. The three cases illustrate the interdependencies among financial policies. A
simultaneous equation model accounts for these interactions and considers these policies
and firm performance as endogenous to the entire system.
26 Even if rational minority shareholders expect such appropriation and if the market has discounted the firm’s share value accordingly, controlling shareholders may desire to obscure the expropriation activity from legal or regulatory scrutiny.

48
Appendix A Exhibit 1: B's Balance Sheet in Three Cases including Original State
Assets Original
State Case 1 Case 2 Case 3 Cash 20 10 0 0 Asset 0 0 30 0 Other Assets 80 80 80 80 Total Assets 100 90 110 80 Liabilities and Equity Total Debt 30 30 40 10 Common Equity 50 50 50 50 Retained Earnings 20 10 20 20 Total Liabilities and Equity 100 90 110 80 Leverage (debt/total assets) 0.30 0.33 0.36 0.13 Dividends 2 0 0 Shared gains/losses in market value of B's equity -2 -1 0.6 Gains from expropriation 0 5 0 Wealth change in AB 0 4 0.6 Wealth change to minority 0 -4 2.4 shareholders in B

49
Appendix B: Summary of Hypotheses
Dividends Controlling shareholders retain dividends for expropriation purposes Controlling shareholders use dividends as a bonding device to signal outsiders that
no expropriation will take place Diversification Controlling shareholders use diversification to create an internal capital market
which is more cost effective than external capital markets Controlling shareholders use diversification to reduce their firm-specific risks Controlling shareholders use diversification to facilitate expropriation
Leverage Controlling shareholders use leverage to enhance control and thereby facilitate
expropriation Controlling shareholders use leverage as a bonding device to signal outsiders that no
expropriation will take place Earnings management Controlling shareholders manipulate earnings to facilitate expropriation Efficiency gains mitigate the desire to use earnings management to obscure poor
performance Operating efficiency Controlling shareholders enhance efficiency through increased monitoring and direct
participation in firm decision-making process Controlling shareholders destroy efficiency by engaging in self-dealing transactions
Firm value Firms with concentrated ownership structure receive high valuation (efficiency gain
is greater than expropriation costs) Firms with concentrated ownership structure receive low valuation (efficiency gain
is less than expropriation costs)
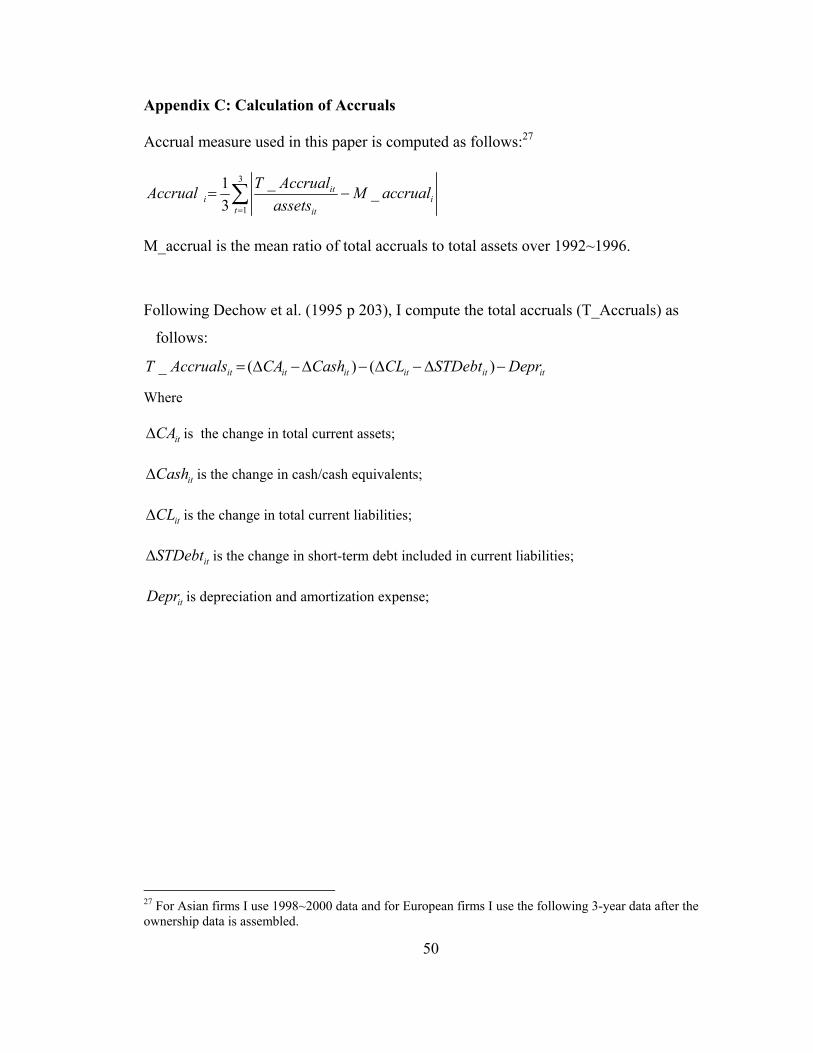
50
Appendix C: Calculation of Accruals
Accrual measure used in this paper is computed as follows:27
3
1
_1 _3
iti i
t it
T AccrualAccrual M accrualassets=
= −∑
M_accrual is the mean ratio of total accruals to total assets over 1992~1996.
Following Dechow et al. (1995 p 203), I compute the total accruals (T_Accruals) as
follows:
_ ( ) ( )it it it it it itT Accruals CA Cash CL STDebt Depr= ∆ −∆ − ∆ −∆ −
Where
itCA∆ is the change in total current assets;
itCash∆ is the change in cash/cash equivalents;
itCL∆ is the change in total current liabilities;
itSTDebt∆ is the change in short-term debt included in current liabilities;
itDepr is depreciation and amortization expense;
27 For Asian firms I use 1998~2000 data and for European firms I use the following 3-year data after the ownership data is assembled.

51
Appendix D: Tables Table 1: Pearson Correlation Coefficient Matrix (Asian Firms). This table presents the Pearson Correlation among country level legal variables for a sample of 927 listed firms from eight East Asia economies including Hong Kong, Indonesia, South Korea, Malaysia, the Philippines, Singapore, Taiwan, and Thailand. Hong Kong, Malaysia, Singapore, and Thailand have English law origin. Indonesia and Philippines have French civil law origin. Korea and Taiwan have German law origin. I include two binary variables indicating either English law (En_law) or French civil law (Fr_law) for each country. The German law country is the numeraire. The legal variables are (1) reserve requirement (2) country’s legal origin; (3) Anti-director index; (4) Creditor rights [see LLSV (1998) for detailed definition of each variable].
reserve En_law Fr_law antidirector creditor reserve 1 -0.634 -0.279 -0.418 -0.491
(<.0001) (<.0001) (<.0001) (<.0001)
En_law -0.634 1 -0.475 0.728 0.566 (<.0001) (<.0001) (<.0001) (<.0001)
Fr_law -0.279 -0.475 1 -0.349 -0.254 (<.0001) (<.0001) (<.0001) (<.0001)
antidirector -0.418 0.728 -0.349 1 0.383 (<.0001) (<.0001) (<.0001) (<.0001)
creditor -0.491 0.566 -0.254 0.383 1 (<.0001) (<.0001) (<.0001) (<.0001)
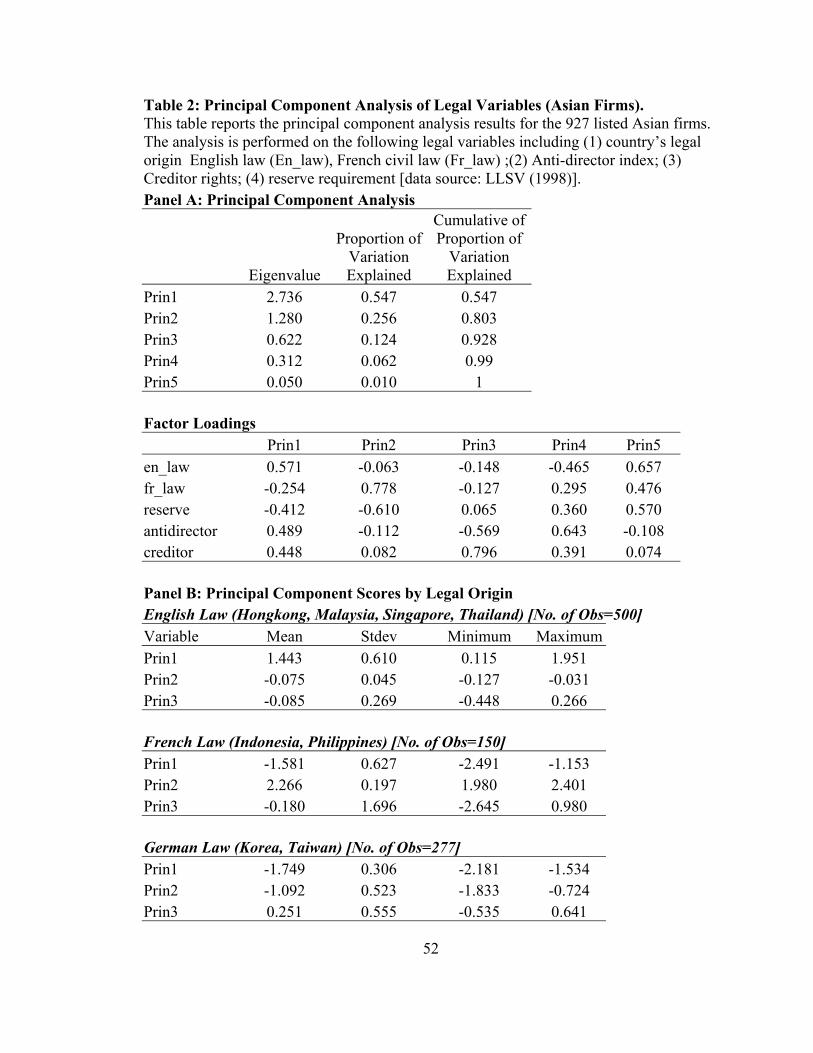
52
Table 2: Principal Component Analysis of Legal Variables (Asian Firms). This table reports the principal component analysis results for the 927 listed Asian firms. The analysis is performed on the following legal variables including (1) country’s legal origin English law (En_law), French civil law (Fr_law) ;(2) Anti-director index; (3) Creditor rights; (4) reserve requirement [data source: LLSV (1998)]. Panel A: Principal Component Analysis
Eigenvalue
Proportion of Variation Explained
Cumulative of Proportion of
Variation Explained
Prin1 2.736 0.547 0.547 Prin2 1.280 0.256 0.803 Prin3 0.622 0.124 0.928 Prin4 0.312 0.062 0.99 Prin5 0.050 0.010 1 Factor Loadings Prin1 Prin2 Prin3 Prin4 Prin5 en_law 0.571 -0.063 -0.148 -0.465 0.657 fr_law -0.254 0.778 -0.127 0.295 0.476 reserve -0.412 -0.610 0.065 0.360 0.570 antidirector 0.489 -0.112 -0.569 0.643 -0.108 creditor 0.448 0.082 0.796 0.391 0.074 Panel B: Principal Component Scores by Legal Origin English Law (Hongkong, Malaysia, Singapore, Thailand) [No. of Obs=500] Variable Mean Stdev Minimum Maximum Prin1 1.443 0.610 0.115 1.951 Prin2 -0.075 0.045 -0.127 -0.031 Prin3 -0.085 0.269 -0.448 0.266 French Law (Indonesia, Philippines) [No. of Obs=150] Prin1 -1.581 0.627 -2.491 -1.153 Prin2 2.266 0.197 1.980 2.401 Prin3 -0.180 1.696 -2.645 0.980 German Law (Korea, Taiwan) [No. of Obs=277] Prin1 -1.749 0.306 -2.181 -1.534 Prin2 -1.092 0.523 -1.833 -0.724 Prin3 0.251 0.555 -0.535 0.641
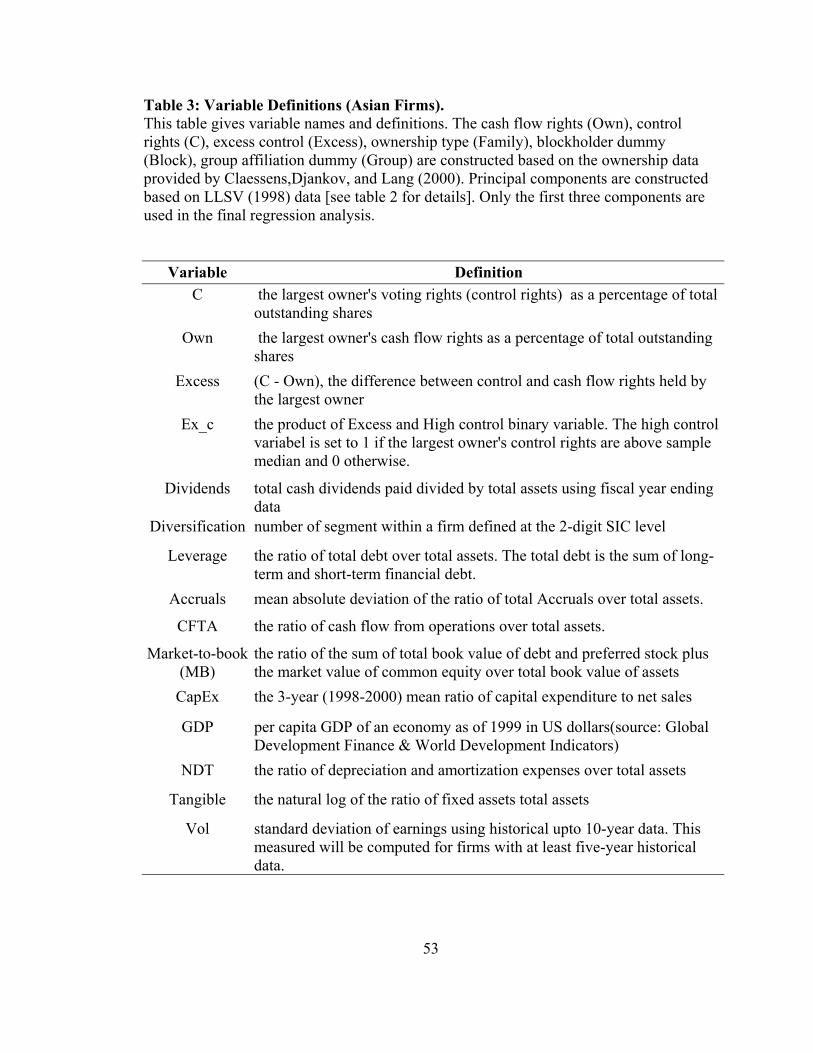
53
Table 3: Variable Definitions (Asian Firms). This table gives variable names and definitions. The cash flow rights (Own), control rights (C), excess control (Excess), ownership type (Family), blockholder dummy (Block), group affiliation dummy (Group) are constructed based on the ownership data provided by Claessens,Djankov, and Lang (2000). Principal components are constructed based on LLSV (1998) data [see table 2 for details]. Only the first three components are used in the final regression analysis.
Variable Definition C the largest owner's voting rights (control rights) as a percentage of total
outstanding shares Own the largest owner's cash flow rights as a percentage of total outstanding
shares Excess (C - Own), the difference between control and cash flow rights held by
the largest owner Ex_c the product of Excess and High control binary variable. The high control
variabel is set to 1 if the largest owner's control rights are above sample median and 0 otherwise.
Dividends total cash dividends paid divided by total assets using fiscal year ending data
Diversification number of segment within a firm defined at the 2-digit SIC level
Leverage the ratio of total debt over total assets. The total debt is the sum of long-term and short-term financial debt.
Accruals mean absolute deviation of the ratio of total Accruals over total assets.
CFTA the ratio of cash flow from operations over total assets.
Market-to-book (MB)
the ratio of the sum of total book value of debt and preferred stock plus the market value of common equity over total book value of assets
CapEx the 3-year (1998-2000) mean ratio of capital expenditure to net sales
GDP per capita GDP of an economy as of 1999 in US dollars(source: Global Development Finance & World Development Indicators)
NDT the ratio of depreciation and amortization expenses over total assets
Tangible the natural log of the ratio of fixed assets total assets
Vol standard deviation of earnings using historical upto 10-year data. This measured will be computed for firms with at least five-year historical data.
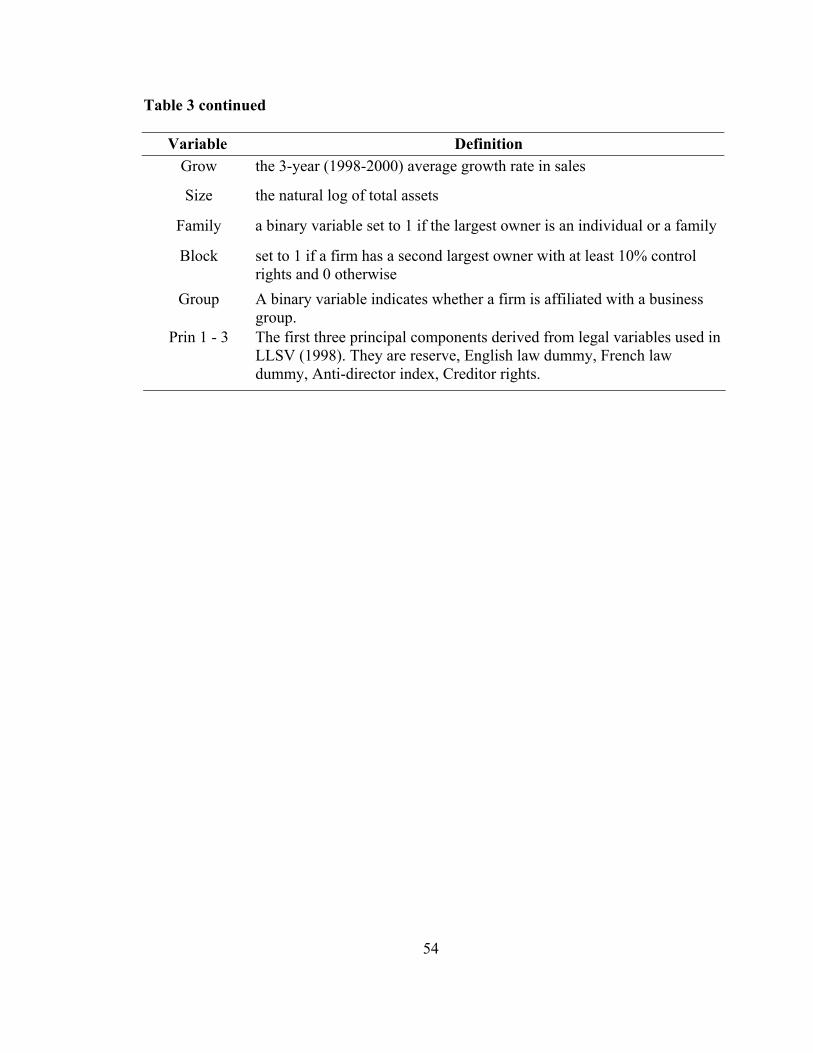
54
Table 3 continued
Variable Definition Grow the 3-year (1998-2000) average growth rate in sales
Size the natural log of total assets
Family a binary variable set to 1 if the largest owner is an individual or a family
Block set to 1 if a firm has a second largest owner with at least 10% control rights and 0 otherwise
Group A binary variable indicates whether a firm is affiliated with a business group.
Prin 1 - 3 The first three principal components derived from legal variables used in LLSV (1998). They are reserve, English law dummy, French law dummy, Anti-director index, Creditor rights.
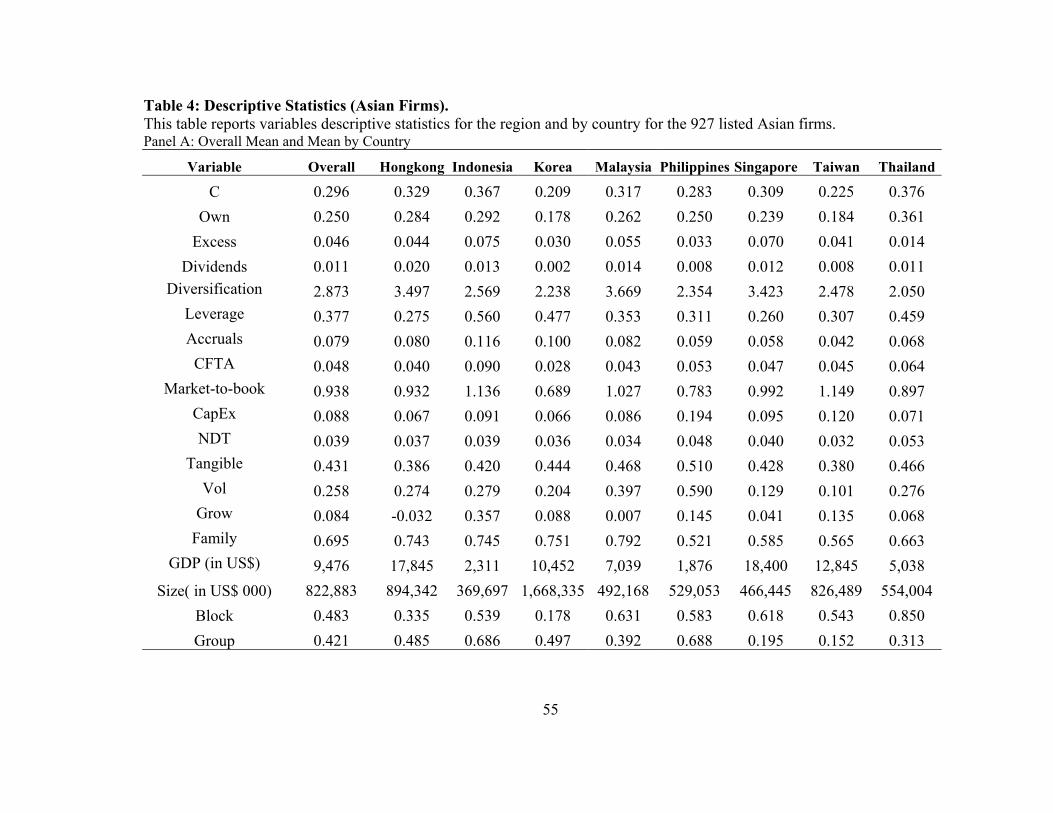
55
Table 4: Descriptive Statistics (Asian Firms). This table reports variables descriptive statistics for the region and by country for the 927 listed Asian firms. Panel A: Overall Mean and Mean by Country
Variable Overall Hongkong Indonesia Korea Malaysia Philippines Singapore Taiwan Thailand
C 0.296 0.329 0.367 0.209 0.317 0.283 0.309 0.225 0.376 Own 0.250 0.284 0.292 0.178 0.262 0.250 0.239 0.184 0.361
Excess 0.046 0.044 0.075 0.030 0.055 0.033 0.070 0.041 0.014 Dividends 0.011 0.020 0.013 0.002 0.014 0.008 0.012 0.008 0.011
Diversification 2.873 3.497 2.569 2.238 3.669 2.354 3.423 2.478 2.050 Leverage 0.377 0.275 0.560 0.477 0.353 0.311 0.260 0.307 0.459 Accruals 0.079 0.080 0.116 0.100 0.082 0.059 0.058 0.042 0.068
CFTA 0.048 0.040 0.090 0.028 0.043 0.053 0.047 0.045 0.064 Market-to-book 0.938 0.932 1.136 0.689 1.027 0.783 0.992 1.149 0.897
CapEx 0.088 0.067 0.091 0.066 0.086 0.194 0.095 0.120 0.071 NDT 0.039 0.037 0.039 0.036 0.034 0.048 0.040 0.032 0.053
Tangible 0.431 0.386 0.420 0.444 0.468 0.510 0.428 0.380 0.466 Vol 0.258 0.274 0.279 0.204 0.397 0.590 0.129 0.101 0.276
Grow 0.084 -0.032 0.357 0.088 0.007 0.145 0.041 0.135 0.068 Family 0.695 0.743 0.745 0.751 0.792 0.521 0.585 0.565 0.663
GDP (in US$) 9,476 17,845 2,311 10,452 7,039 1,876 18,400 12,845 5,038 Size( in US$ 000) 822,883 894,342 369,697 1,668,335 492,168 529,053 466,445 826,489 554,004
Block 0.483 0.335 0.539 0.178 0.631 0.583 0.618 0.543 0.850 Group 0.421 0.485 0.686 0.497 0.392 0.688 0.195 0.152 0.313

56
Table 4 continued Panel B: Overall Median and Median by Country
Variable Overall Hongkong Indonesia Korea Malaysia Philippines Singapore Taiwan Thailand
C 0.300 0.320 0.335 0.220 0.320 0.280 0.310 0.230 0.360 Own 0.240 0.260 0.260 0.160 0.240 0.235 0.220 0.160 0.355
Excess 0.000 0.000 0.040 0.000 0.000 0.000 0.070 0.000 0.000 Dividends 0.002 0.005 0.001 0.001 0.004 0.000 0.008 0.002 0.000
Diversification 3.000 4.000 2.000 2.000 4.000 2.000 4.000 2.000 2.000 Leverage 0.331 0.210 0.519 0.439 0.263 0.292 0.244 0.315 0.488 Accruals 0.055 0.057 0.090 0.063 0.056 0.048 0.046 0.032 0.053
CFTA 0.046 0.042 0.077 0.036 0.040 0.052 0.045 0.046 0.068 Market-to-book 0.752 0.594 1.009 0.599 0.781 0.623 0.791 0.926 0.836
CapEx 0.048 0.037 0.047 0.043 0.052 0.108 0.061 0.080 0.034 NDT 0.032 0.031 0.033 0.029 0.028 0.045 0.033 0.029 0.048
Tangible 0.423 0.341 0.429 0.467 0.449 0.502 0.416 0.375 0.480 Vol 0.076 0.095 0.119 0.043 0.067 0.121 0.062 0.067 0.106
Grow 0.055 -0.035 0.323 0.073 0.003 0.100 0.011 0.092 0.046 Family 1.000 1.000 1.000 1.000 1.000 1.000 1.000 1.000 1.000
GDP (in US$) 8,745 17,845 2,311 10,452 7,039 1,876 18,400 12,845 5,038 Size( in US$ 000) 221,324 187,822 110,560 622,321 147,195 182,230 163,893 445,045 138,714
Block 0.000 0.000 1.000 0.000 1.000 1.000 1.000 1.000 1.000 Group 0.000 0.000 1.000 0.000 0.000 1.000 0.000 0.000 0.000
No. of Obs 927 167 102 185 130 48 123 92 80

57
Table 5: The Simultaneous Equations Regression Results (Asian Firms). Panel A: Three Stage Least Squares Estimation Results (3sls) This table gives the three-stage least square estimation results of the six-equation model for the 927 listed Asian firms. ***, **, * represent significance at the 1%, 5%, and 10% level, respectively. System weighted R-Square is 0.34. Variables Coeff. Est. t value P value
Dividends Intercept -0.017 -1.54 0.1244 Own 0.016 2.31 0.0212 ** Excess 0.054 2.13 0.0335 ** Ex_c -0.034 -1.41 0.1592 Diversification -0.005 -1.62 0.1055 Leverage -0.049 -6.92 <.0001 *** Accruals 0.180 7.82 <.0001 *** CFTA 0.031 1.21 0.2256 Capex 0.000 -0.2 0.8427 Size 0.003 3.4 0.0007 *** Block -0.002 -1.57 0.1178 Group -0.003 -2.08 0.0375 ** Prin1 0.003 2.93 0.0035 *** Prin2 0.002 1.59 0.1113 Prin3 -0.001 -1.3 0.1936 Industry 1-10 included Diversification Intercept -0.987 -0.59 0.5538 Own 1.720 1.83 0.0682 * Excess 5.463 1.77 0.0763 * Ex_c -3.656 -1.54 0.1247 Dividends -53.287 -0.97 0.3337 Leverage -3.467 -1.73 0.0837 * Accruals 11.277 1.31 0.189 CFTA -8.394 -2.08 0.0382 ** Size 0.330 3.42 0.0007 *** Block -0.098 -0.47 0.6378
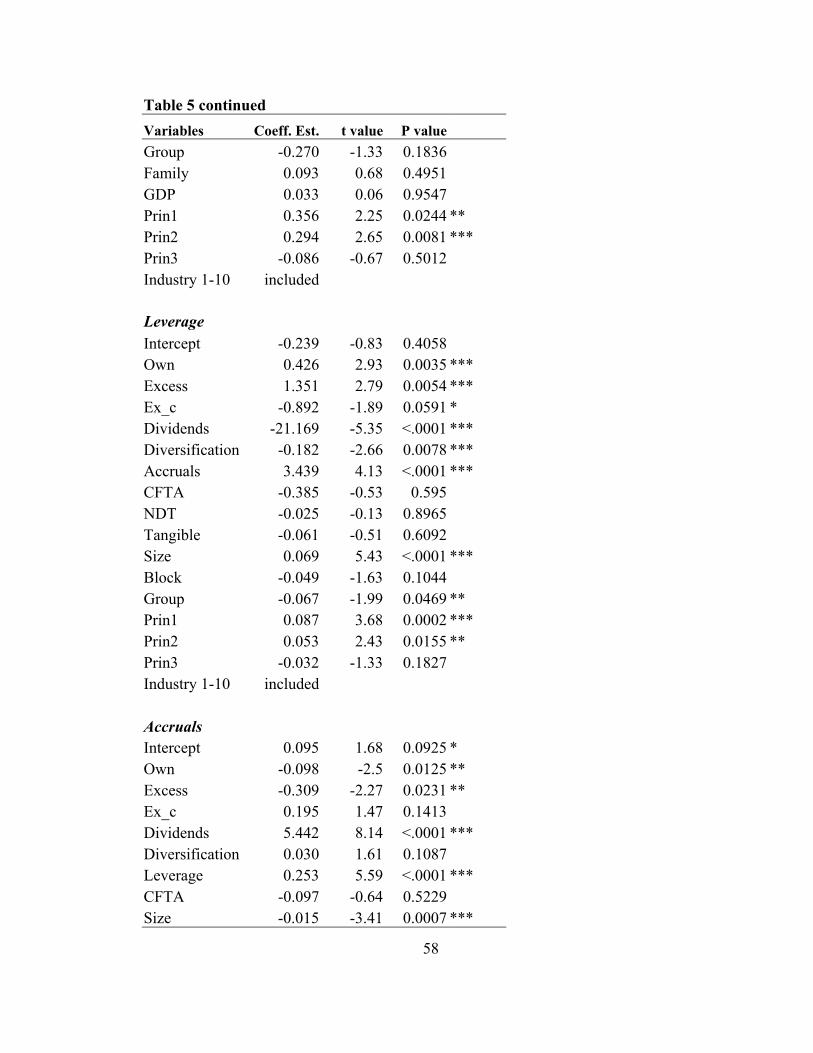
58
Table 5 continued Variables Coeff. Est. t value P value Group -0.270 -1.33 0.1836 Family 0.093 0.68 0.4951 GDP 0.033 0.06 0.9547 Prin1 0.356 2.25 0.0244 ** Prin2 0.294 2.65 0.0081 *** Prin3 -0.086 -0.67 0.5012 Industry 1-10 included Leverage Intercept -0.239 -0.83 0.4058 Own 0.426 2.93 0.0035 *** Excess 1.351 2.79 0.0054 *** Ex_c -0.892 -1.89 0.0591 * Dividends -21.169 -5.35 <.0001 *** Diversification -0.182 -2.66 0.0078 *** Accruals 3.439 4.13 <.0001 *** CFTA -0.385 -0.53 0.595 NDT -0.025 -0.13 0.8965 Tangible -0.061 -0.51 0.6092 Size 0.069 5.43 <.0001 *** Block -0.049 -1.63 0.1044 Group -0.067 -1.99 0.0469 ** Prin1 0.087 3.68 0.0002 *** Prin2 0.053 2.43 0.0155 ** Prin3 -0.032 -1.33 0.1827 Industry 1-10 included Accruals Intercept 0.095 1.68 0.0925 * Own -0.098 -2.5 0.0125 ** Excess -0.309 -2.27 0.0231 ** Ex_c 0.195 1.47 0.1413 Dividends 5.442 8.14 <.0001 *** Diversification 0.030 1.61 0.1087 Leverage 0.253 5.59 <.0001 *** CFTA -0.097 -0.64 0.5229 Size -0.015 -3.41 0.0007 ***
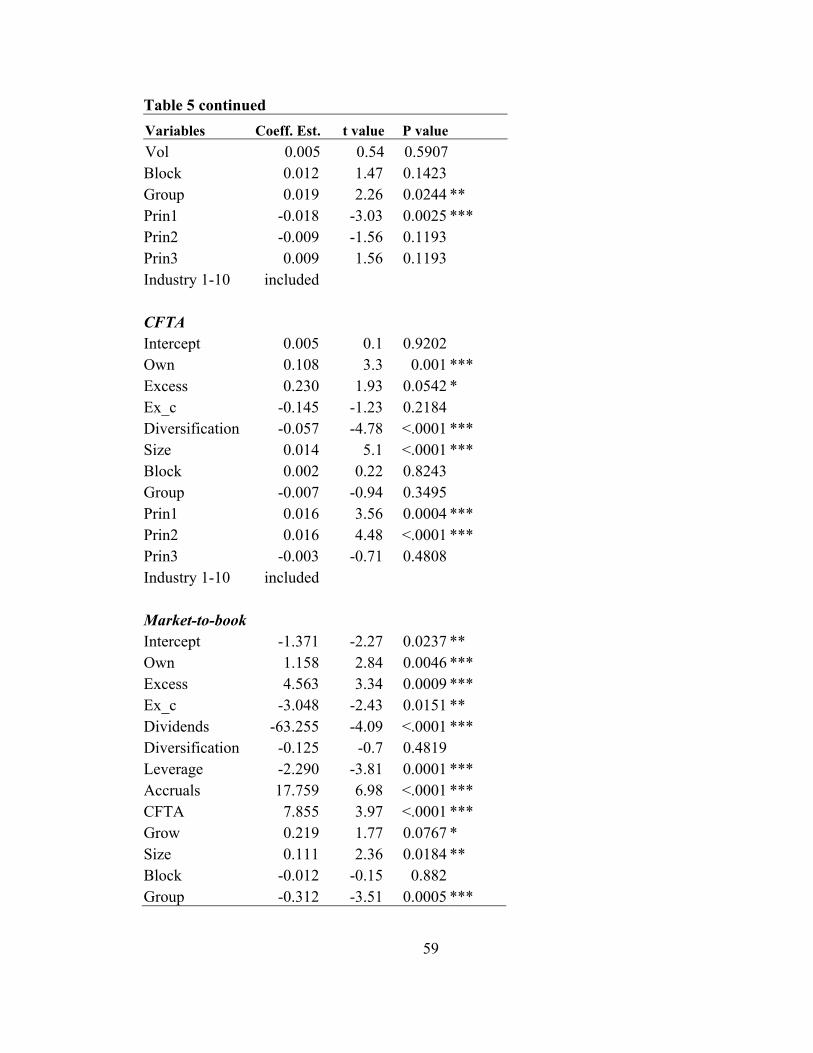
59
Table 5 continued Variables Coeff. Est. t value P value Vol 0.005 0.54 0.5907 Block 0.012 1.47 0.1423 Group 0.019 2.26 0.0244 ** Prin1 -0.018 -3.03 0.0025 *** Prin2 -0.009 -1.56 0.1193 Prin3 0.009 1.56 0.1193 Industry 1-10 included CFTA Intercept 0.005 0.1 0.9202 Own 0.108 3.3 0.001 *** Excess 0.230 1.93 0.0542 * Ex_c -0.145 -1.23 0.2184 Diversification -0.057 -4.78 <.0001 *** Size 0.014 5.1 <.0001 *** Block 0.002 0.22 0.8243 Group -0.007 -0.94 0.3495 Prin1 0.016 3.56 0.0004 *** Prin2 0.016 4.48 <.0001 *** Prin3 -0.003 -0.71 0.4808 Industry 1-10 included Market-to-book Intercept -1.371 -2.27 0.0237 ** Own 1.158 2.84 0.0046 *** Excess 4.563 3.34 0.0009 *** Ex_c -3.048 -2.43 0.0151 ** Dividends -63.255 -4.09 <.0001 *** Diversification -0.125 -0.7 0.4819 Leverage -2.290 -3.81 0.0001 *** Accruals 17.759 6.98 <.0001 *** CFTA 7.855 3.97 <.0001 *** Grow 0.219 1.77 0.0767 * Size 0.111 2.36 0.0184 ** Block -0.012 -0.15 0.882 Group -0.312 -3.51 0.0005 ***

60
Table 5 continued Variables Coeff. Est. t value P value Prin1 0.177 2.93 0.0035*** Prin2 -0.076 -1.35 0.1774 Prin3 -0.247 -3.91 <.0001*** Industry 1-10 included

61
Table 5 continued Panel B: Signs of the Coefficients Estimates on Endogenous Variables This panel reports the signs of the coefficients estimates of the main ownership variables (Own, Excess, Ex_c) in all six equations using 3sls estimation method for the 927 listed Asian firms.
Dividends Diversification Leverage Accruals CFTA MB
Own + +, 10% level + - + +
Excess + +, 10% level + - + +
Ex_c -, not sig. -, not sig. -, 10% level +, not sig. -, not sig. - Panel C: Net effects of Own and Excess This table reports the net effect of a 5% change in Own and Excess on firm policy and performance using the reduced form estimates of the simultaneous equations system for the 927 listed Asian firms. The numbers reported are scaled by the predicted values for each endogenous variable. The predicted endogenous value is computed by summing up the product of each exogenous variable’s sample mean with their reduced form coefficient estimates.
Whole sample Low control firms High control firms
5% increase in
Own 5% increase in
Excess 5% increase in
Own 5% increase in
Excess 5% increase in
Own 5% increase in
Excess
Dividends 0.113 0.162 0.154 0.220 0.089 0.073
Diversification -0.011 0.021 -0.011 0.021 -0.010 -0.025
Leverage -0.028 -0.011 -0.026 -0.011 -0.030 0.014
Accruals -0.029 -0.071 -0.028 -0.070 -0.030 -0.023
CFTA 0.149 0.168 0.206 0.232 0.117 0.139
MB 0.022 0.084 0.023 0.085 0.022 0.045
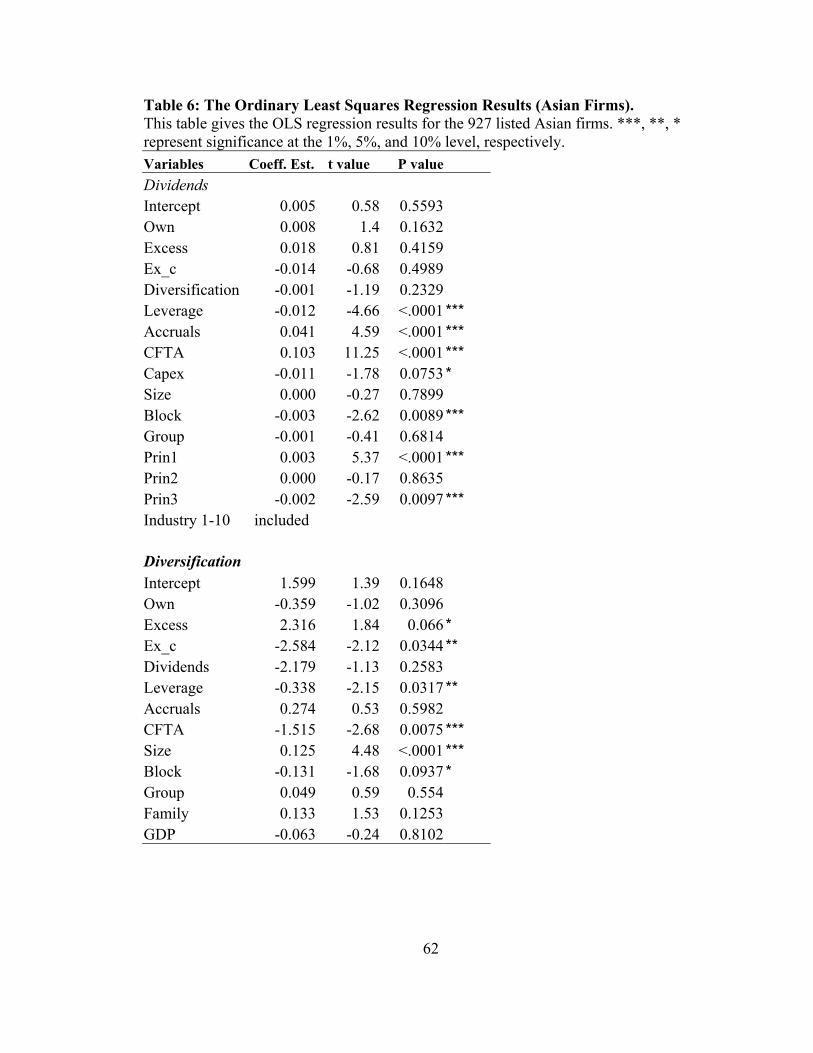
62
Table 6: The Ordinary Least Squares Regression Results (Asian Firms). This table gives the OLS regression results for the 927 listed Asian firms. ***, **, * represent significance at the 1%, 5%, and 10% level, respectively. Variables Coeff. Est. t value P value Dividends Intercept 0.005 0.58 0.5593 Own 0.008 1.4 0.1632 Excess 0.018 0.81 0.4159 Ex_c -0.014 -0.68 0.4989 Diversification -0.001 -1.19 0.2329 Leverage -0.012 -4.66 <.0001 *** Accruals 0.041 4.59 <.0001 *** CFTA 0.103 11.25 <.0001 *** Capex -0.011 -1.78 0.0753 * Size 0.000 -0.27 0.7899 Block -0.003 -2.62 0.0089 *** Group -0.001 -0.41 0.6814 Prin1 0.003 5.37 <.0001 *** Prin2 0.000 -0.17 0.8635 Prin3 -0.002 -2.59 0.0097 *** Industry 1-10 included Diversification Intercept 1.599 1.39 0.1648 Own -0.359 -1.02 0.3096 Excess 2.316 1.84 0.066 * Ex_c -2.584 -2.12 0.0344 ** Dividends -2.179 -1.13 0.2583 Leverage -0.338 -2.15 0.0317 ** Accruals 0.274 0.53 0.5982 CFTA -1.515 -2.68 0.0075 *** Size 0.125 4.48 <.0001 *** Block -0.131 -1.68 0.0937 * Group 0.049 0.59 0.554 Family 0.133 1.53 0.1253 GDP -0.063 -0.24 0.8102
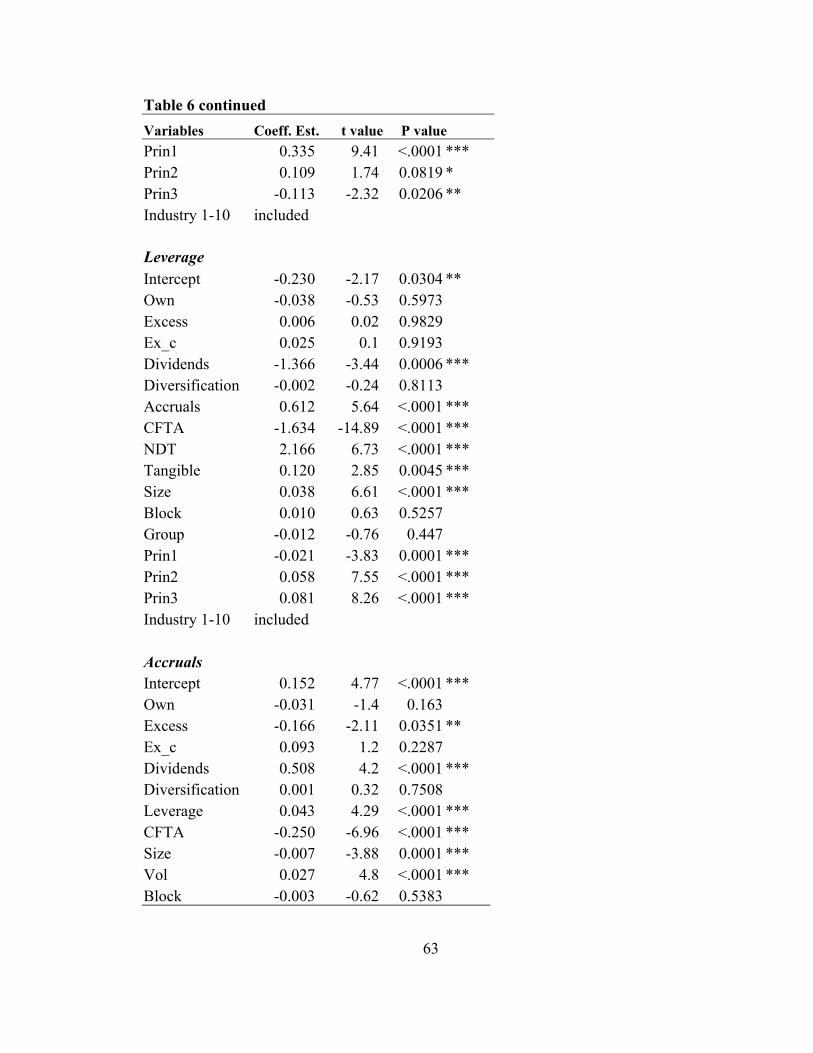
63
Table 6 continued Variables Coeff. Est. t value P value Prin1 0.335 9.41 <.0001 *** Prin2 0.109 1.74 0.0819 * Prin3 -0.113 -2.32 0.0206 ** Industry 1-10 included Leverage Intercept -0.230 -2.17 0.0304 ** Own -0.038 -0.53 0.5973 Excess 0.006 0.02 0.9829 Ex_c 0.025 0.1 0.9193 Dividends -1.366 -3.44 0.0006 *** Diversification -0.002 -0.24 0.8113 Accruals 0.612 5.64 <.0001 *** CFTA -1.634 -14.89 <.0001 *** NDT 2.166 6.73 <.0001 *** Tangible 0.120 2.85 0.0045 *** Size 0.038 6.61 <.0001 *** Block 0.010 0.63 0.5257 Group -0.012 -0.76 0.447 Prin1 -0.021 -3.83 0.0001 *** Prin2 0.058 7.55 <.0001 *** Prin3 0.081 8.26 <.0001 *** Industry 1-10 included Accruals Intercept 0.152 4.77 <.0001 *** Own -0.031 -1.4 0.163 Excess -0.166 -2.11 0.0351 ** Ex_c 0.093 1.2 0.2287 Dividends 0.508 4.2 <.0001 *** Diversification 0.001 0.32 0.7508 Leverage 0.043 4.29 <.0001 *** CFTA -0.250 -6.96 <.0001 *** Size -0.007 -3.88 0.0001 *** Vol 0.027 4.8 <.0001 *** Block -0.003 -0.62 0.5383
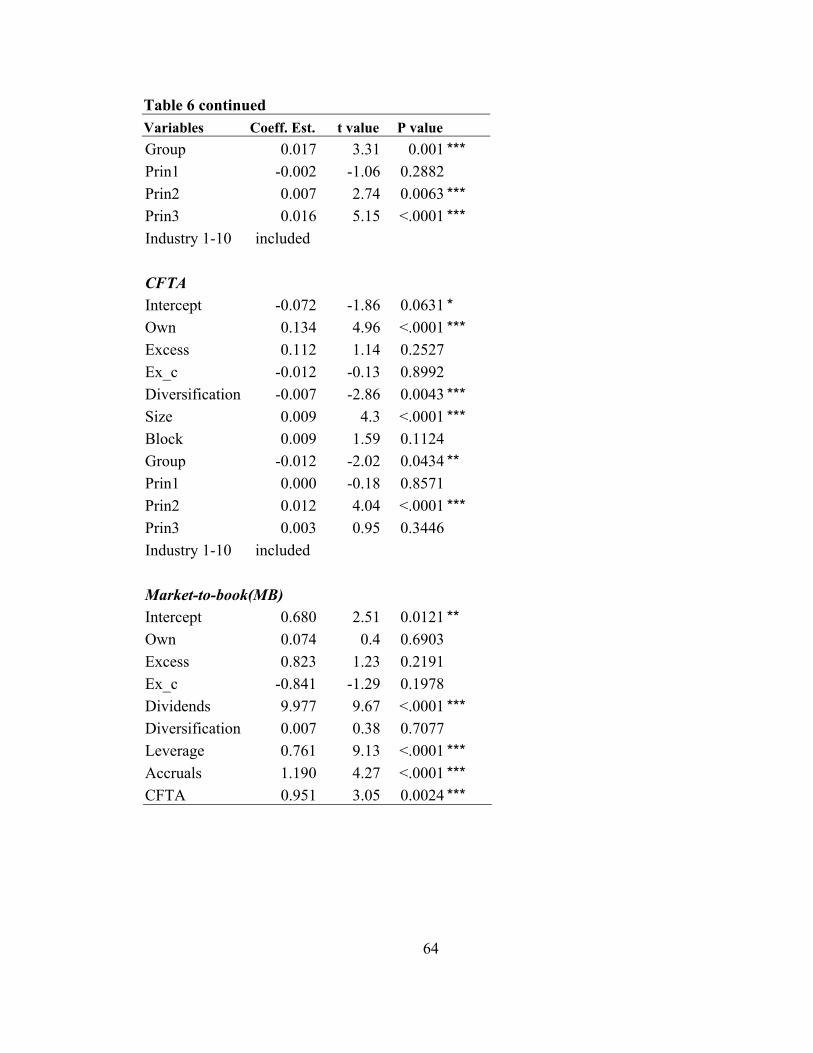
64
Table 6 continued Variables Coeff. Est. t value P value Group 0.017 3.31 0.001 *** Prin1 -0.002 -1.06 0.2882 Prin2 0.007 2.74 0.0063 *** Prin3 0.016 5.15 <.0001 *** Industry 1-10 included CFTA Intercept -0.072 -1.86 0.0631 * Own 0.134 4.96 <.0001 *** Excess 0.112 1.14 0.2527 Ex_c -0.012 -0.13 0.8992 Diversification -0.007 -2.86 0.0043 *** Size 0.009 4.3 <.0001 *** Block 0.009 1.59 0.1124 Group -0.012 -2.02 0.0434 ** Prin1 0.000 -0.18 0.8571 Prin2 0.012 4.04 <.0001 *** Prin3 0.003 0.95 0.3446 Industry 1-10 included Market-to-book(MB) Intercept 0.680 2.51 0.0121 ** Own 0.074 0.4 0.6903 Excess 0.823 1.23 0.2191 Ex_c -0.841 -1.29 0.1978 Dividends 9.977 9.67 <.0001 *** Diversification 0.007 0.38 0.7077 Leverage 0.761 9.13 <.0001 *** Accruals 1.190 4.27 <.0001 *** CFTA 0.951 3.05 0.0024 ***
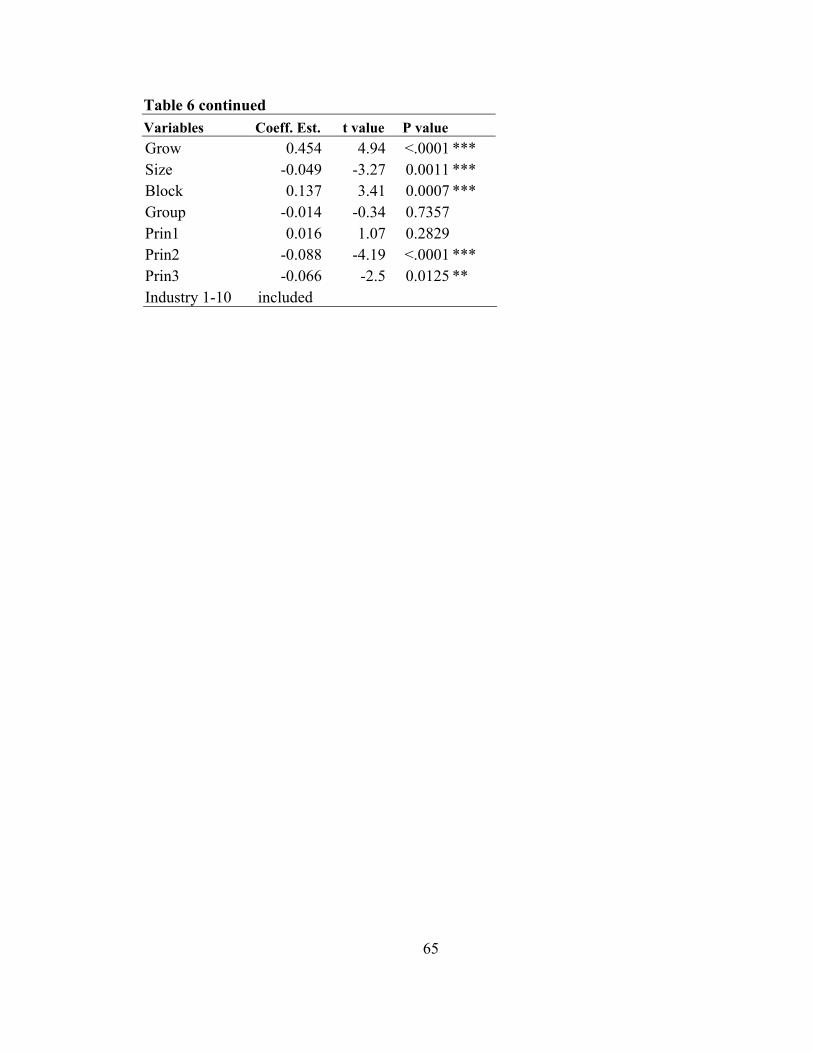
65
Table 6 continued Variables Coeff. Est. t value P value Grow 0.454 4.94 <.0001 *** Size -0.049 -3.27 0.0011 *** Block 0.137 3.41 0.0007 *** Group -0.014 -0.34 0.7357 Prin1 0.016 1.07 0.2829 Prin2 -0.088 -4.19 <.0001 *** Prin3 -0.066 -2.5 0.0125 ** Industry 1-10 included
66
Part III. The Benefits and Costs of Concentrated Ownership of Western
European Firms: A Simultaneous Equations Approach
67
1. Introduction
This essay extends the analysis of corporate ownership structure to Western
Europe. The review of theoretical and empirical literature relating to ownership structure
(see the Introduction to Essay 1) is hereby incorporated. Faccio and Lang (2002)
document that listed firms in Western European countries have high ownership
concentration. They also document that forty-four percent of 5,232 listed firms are
family-controlled.
As in Essay 1, I adopt a simultaneous equations approach to empirically examine
(1) whether the controlling shareholder uses a combination of corporate policies to
acquire private benefits; (2) the potential tradeoff between efficiency gain and
expropriation costs associated with concentrated ownership structure.
Researchers suggest that the European capital market provides better monitoring
than the Asian market. This affects the nature of the agency problems between the
controlling owners and minority shareholders. For example, in their study of the
controlling owners’ decision regarding dividend payment, Faccio, Lang, and Young
(2001b) find that the excess control rights held by the largest shareholder are positively
related to dividend payout for Asian firms but negatively related to dividend payout for
European firms. Faccio, Lang, and Young (2001a) document that the excess control
rights held by the largest shareholder are positively related to leverage for Asian firms.
However, this relationship reverses for European firms. They conclude that the European
capital market exerts effective monitoring on corporate insiders, therefore, they use less
leverage when the firm’s ownership structure signal outsiders that more expropriation

68
opportunities exist.28 Given these documented differences regarding corporate policy
choices by the controlling owners in Europe and Asia, coupled with the anecdotal
evidence regarding the effectiveness of capital markets in these two regions, I expect
some differences in the relationship between ownership structure and firm policy and
performance for my European sample using a simultaneous equations approach.
For a sample of 1,757 listed firms from 13 Western European countries, I find that
the policy choices are interrelated and have joint impact on firm performance,
specifically, (1) the cash flow rights held by the largest owner has negative effects on
leverage and firm value; (2) the excess control rights are negatively related to dividend
payment, diversification, leverage, and firm value; (3) principal component analysis
reveals that strong investor protection is beneficial to minority shareholders.
The remainder of this essay is organized as follows. Section 2 introduces the
simultaneous equations model and sample. Section 3 presents empirical results. Section 4
discusses robustness checks of model specification. Section 5 concludes. Section 6
compares the empirical results of East Asian firms and Western European firms.
2. Methodology and sample
2.1. Model specification
The model consists of two groups of equations: the policy group and the
performance group. The policy group consists of equations (numbered parenthetically)
for the four jointly determined corporate policies: dividend (1), diversification (2),
leverage (3), and earnings management (4). The performance group consists of equations
28 Faccio, Lang, and Young (2001a) suggest that leverage is used by the controlling owner to enhance control and thereby facilitates expropriation.
69
for firm operating efficiency, using accounting measure return on total assets (CFTA) (5),
and a market valuation measure, market-to-book value of assets (MB) (6). Each
individual policy variable is regressed against ownership structure variables, other policy
variables, and CFTA.29 CFTA is regressed against ownership structure variables, and
diversification policy. MB is regressed against ownership structure variables, policy
variables, and CFTA. In all six equations, I also control for other firm- and country-
specific characteristics.
2.2. Sample
The ownership structure data are taken from Faccio and Lang (2002) which
assemble ownership data of 5,232 listed firms (financial and nonfinancial) from 13
Western European countries. Claessens et al. (2002) suggest that the valuation of
financial industries and regulated utilities are not comparable to firms in other industries.
Hence, I exclude corporations in financial industry (SIC: 6000~6999) and regulated
utilities firms (SIC: 4900~4999). I collect annual financial and business segment data for
individual firms using the Worldscope database (2003). Then I match firms from these
two sources by name.30 I was able to match 1,928 nonfinancial firms (excluding SIC
4900 ~ 4999) by names.31 Among these 1,928 firms, 171 firms are recorded as having
29 I include ROA in the policy equations due to the feedback effect of ROA on policy choices. Detailed discussion is in section 3.1.3. 30 When the firm name is very similar but not exactly the same, I use the filing information of Worldscope and check the previous name under which the firm was listed. 31 Often times, the names are abbreviated in one source but not the other. Whenever I can not find a match for the firms from the ownership database, I search by the most unique words in the firm name in the Worldscope database. Sometimes, Worldscope indicates the name of the firm has changed and the previous name was the same as the name in the ownership data. Then I consider the firm having the new name as the same one in the ownership database.

70
zero control rights for the largest owner in Faccio and Lang (2002) data.32 I exclude these
firms. My final sample includes 1,757 nonfinancial firms which have all the information
required to construct the policy and other firm-specific control variables.
2.3. Ownership and endogenous variables
To disentangle the alignment and entrenchment effect of ownership structure, I
include the largest owner’s cash flow rights (Own) and the excess control (Excess) that is
the difference between the control and cash flow rights in my analysis. In addition, I
include an interaction term (Ex_c) which is the product of excess control (Excess) and a
binary variable High_c. High_c is set to 1 if the control rights held by the largest owner is
above sample median control rights (0.31) and 0 otherwise. Hence, when the control
rights held by the largest owner are higher than sample median, the total impact of excess
control will be captured by the sum of the coefficients on Excess and Ex_c. Ex_c is
intended to capture the nonlinear effect of ownership structure.
To smooth out transitory effects, the endogenous financial variables are
constructed using three-year average beginning the year after the ownership data is
collected. 33 For France, Germany, Italy, Switzerland, and the UK, the endogenous
variables are computed as the mean values of annual accounting data from 1997 through
1999; for Spain and Portugal, the endogenous variables are the mean values of annual
accounting data from 1998 through 2000; for Sweden and Norway, the endogenous
variables are the mean values of annual accounting data from 1999 through 2001; for 32 Faccio and Lang (2002) could only gather information on control rights when they are equal to or above 5% threshold. Therefore, if the largest owner is recorded as having zero control rights, his actual control might fall between 0 and 5%. 33 The ownership data collected by Faccio and Lang (2002) are as of 1996 for France, Germany, Italy, Switzerland, and the UK, as of 1997 for Spain and Portugal, as of 1998 for Sweden and Norway, and as of 1999 for Austria, Belgium, Finland, and Ireland.
71
Austria, Belgium, Finland, and Ireland, the endogenous variables are the mean values of
annual accounting data from 2000 through 2002.
Except where explicitly noted, variable definitions are identical to those given in
Essay 1, and the structure of the six-equation simultaneous equation model is the same.
2.4. Firm- and country-specific variables
2.4.1. Investor protection measures
The 13 countries included in this study have four different legal origins: English
common law, French civil law, German civil law, and Scandinavian civil law. To capture
a broad dimension of country level investor protection, I include five legal variables (1)
country’s legal origin (2) Anti-director index (Antidirector); (3) Creditor rights (Creditor)
; (4) legal enforcement (Enforce); (5) reserve requirement (Reserve). Anti-director index
and Creditor rights are shareholder and creditor protection measures respectively. (4) and
(5) account for remedial mechanisms.
Table 1 shows that these legal variables are highly correlated. Using all the legal
variables in the regression will introduce the multicollinearity problem. To solve this
problem, I use principal component analysis to derive a smaller set of uncorrelated
variables that contain most of the information from the original data. Table 2 panel A
presents the principal component analysis results. The first two principal components
have Eigenvalues greater than 1 and the third one has an Eigenvalue close to 1 which
suggest that they explain much of the variability of the original legal variables. The
fourth component only has an Eigenvalue of 0.53. Therefore, I include the first three
components in my final analysis. Prin1 has large positive factor loadings on En_law,
Anti-director, Creditor, and Enforce, and negative loadings on Fr_law, Ge_law, and

72
Reserve. It appears to be a contrast between English law countries with strong investor
protection and French/German law countries with weak investor protection [see
LLSV(1998) for the comparison of investor protection around the world]. Panel B reports
the first three principal component scores by legal origin. These country-specific
principal component scores are used in subsequent simultaneous equations model to
control for the difference in investor protection across countries. English law countries
score highest in Prin1, whereas German and French law countries score the lowest. Prin2
has large positive loadings on Ge_law, Creditor, Enforce, and Reserve, and large negative
loadings on Fr_law and Anti-director. It is mainly a contrast between German and French
law countries which have highest and lowest Prin2 values respectively. Prin3 has large
positive loadings on enforce, reserve, and large negative loadings on creditor and
Ge_law. Scandinavian law countries have the strongest legal enforcement, but relatively
weak in creditor and shareholder protection. Prin3 is highest for Scandinavian law
countries and lowest for German law countries. Panel C reports the first three principal
component scores by country along with GDP per capita data and legal origin for each
country.
2.4.2. Other firm- and country-specific control variables
In the Dividends equation, I use the three-year mean of the ratio of capital
expenditure to net sales (Capex) to account for the effect of investment opportunities on
dividend payment. In the diversification equation, I control for the effect of the level of
economic development on firm’s diversification by including the per capita GDP of an
economy (GDP). In Faccio and Lang (2002), the largest owner is identified as family,
unlisted company, widely held company, widely held financial institutions, and

73
miscellaneous including charities, voting trusts, employees, cooperatives, or minority
foreign investors. I conjecture that family-controlled firms have stronger incentives to
diversify their firm-specific risk, ceteris paribus. Using Faccio and Lang (2002)
definition, a binary variable Family is set to 1 if the largest owner is an individual, a
family, or an unlisted company. Family is used in the Diversification equation. In the
leverage equation for the Eurpean sample, I use the same firm-specific controls as for the
Asian firm sample: asset tangibility (Tangible) and non-debt tax shield (NDT). As with
the Asian firm sample, in the Accrual equation, I control for the impact of earnings
volatility (Vol) on total accruals. In the market-to-book equation, I use the 3-year
average growth rate in sales (Grow) to account for the effect of growth opportunity on
firm value. I use the natural log of total assets (Size) to control for the size effect.
2.5. Model and descriptive statistics
The six-equation model is presented as follows. In all equations, I control for
industry effects with ten-industry binary variables (Industry1-10) using Campbell’s
(1996) industry classification.
Policy Group Equations:
Dividends = f1(Own, Excess, Ex_c, leverage, diversification, accruals, CFTA, size,
Capex, Prin1, Prin2, Prin3, Industry1-10) (1)
Diversification = f2(Own, Excess, Ex_c, leverage, dividends, accruals, CFTA, size, GDP,
Family,Prin1, Prin2, Prin3, Industry1-10) (2)
Leverage = f3(Own, Excess, Ex_c, dividends, diversification, accruals, CFTA, size,
Tangible, NDT, Prin1, Prin2, Prin3, Industry1-10) (3)
Accruals = f4(Own, Excess, Ex_c, dividends, leverage, diversification, CFTA, size, vol,

74
Prin1, Prin2, Prin3, Industry1-10) (4)
Performance Group Equations:
CFTA = f5(Own, Excess, Ex_c, diversification, size, Prin1, Prin2, Prin3, Industry1-10)
(5)
Market-to-book = f6(Own, Excess, Ex_c, dividends, diversification, leverage, accruals,
CFTA, size, grow, Prin1, Prin2, Prin3, Industry1-10) (6)
A summary of variable names and definitions is given in Table 3.
Table 4, Panels A [B] presents the overall mean [median] and mean [median] by
country of all the variables used in the model. The largest owner on average has 37% of
control rights and owns 33% equity. The disparity between control and cash flow rights
(Excess) is relatively small, 4% on average. The ownership concentration is even higher
than those East Asian firms [see Claessens, Djankov, and Lang (2000)].
The ownership structure exhibits significant cross-country variations. The largest
owners in English law countries (Ireland and the UK) on average have the lowest control
rights as compared to those from other legal origins. The excess control held by the
largest owner also varies across countries, ranging from 1.2% in France to 13.5% in
Switzerland. Firms in English law countries have highest market-to-book ratios.
3. Empirical results
Table 5 gives the structural form results for the three-stage least squares (3SLS)
estimation of the simultaneous equations model for 1,757 Western European firms. Some
of the industry binary variables are statistically significant in various equations,
suggesting the presence of industry effects (the results are not reported here). Sections
75
3.1. - 3.6. report 3sls estimation results for each equation in the order of control variables,
policy variables, and ownership structure variables. Section 3.7 gives the results of
principal components analysis. Section 3.8. summarizes main results.
3.1. Dividends
The positive coefficient on Size implies that large firms tend to pay more
dividends. Large firms may be mature firms in their industry and have proportionally
fewer growth opportunities than small firms. Therefore, they are likely to retain
proportionally less cash for new investments. The coefficient on capital expenditure ratio
(Capex) is not statistically significant.
Diversification and Leverage are negatively related to dividend payment. Using
OLS regression models, researchers document one-to-one relationships between
ownership and firm policies, specifically, they suggest that low dividends, more
diversification, high leverage facilitate expropriation [see Faccio et al. (2001a,b),
Claessens et al. (2000b)]. My finding suggests that these policies can be substitutes to one
another, that is, the controlling owner use the best combination of firm policies to
maximize his utility and therefore these policies are interdependent. Firms that are more
diversified pay lower dividends, suggesting that more resources have to be used to
acquire new assets. The negative relationship between Dividend and Leverage can be
interpreted as follows: these two policies are substitutes either as bonding mechanisms or
as means for expropriation. Accruals has no significant impact on dividend policy. The
positive coefficient on CFTA is consistent with the view that more profitable firms pay
higher dividends, ceteris paribus.

76
Own has a negative but insignificant coefficient. The excess control (Excess) is
negatively related to Dividends, supporting the view that excess control increases the
likelihood of expropriation manifested in lower dividend payment. The positive but
insignificant coefficient on Ex_c (p-value 0.10) provides some weak evidence of
nonlinear ownership effect, i.e., at high levels of control the controlling owner is more
likely to use high dividend payments as a bonding device. This finding is similar in
nature to the findings of Faccio, Lang, and Young (2001b).34
3.2. Diversification
As expected, larger firms are more diversified. The economic development of a
country as proxied by GDP per capita does not have an impact on diversification. Family-
controlled firms do not appear to use more diversification.
Consistent with the findings in equation 1, Diversification is negatively related to
Dividends. It is also negatively related to Leverage, supporting the hypothesis that firm
policies are interdependent. All else equal, high leverage implies that firms have tight
cash budget constraints, therefore, they have fewer resources to acquire new investments.
Another possibility is that Diversification and Leverage are substitutes as means of
expropriation. CFTA has the expected positive sign, that is, more profitable firms could
acquire new investments in different product lines, all else equal.
The coefficient on Own is negative but not statistically significant. The excess
control (Excess) is negatively related to diversification, although only significant at the
10% level. This finding does not offer any support for the argument that diversification is 34 They find that when outsiders are alert to expropriation problems the controlling owners have to make high dividend payments. They consider firms that are tightly affiliated with business groups are more prone to expropriation problem and document a positive relationship between excess control and dividend payment for tightly affiliated firms.
77
used to facilitate expropriation. The positive but insignificant coefficient on Ex_c implies
that as control reaches sufficiently high levels, the negative effect of excess control on
diversification is diminishing.
3.3. Leverage
Firm size is positively related to leverage suggesting that large firms carry more
debt on their books. Asset tangibility (Tangible) increases debt capacity, although only
significant at 10% level. Non-debt tax shield (NDT) does not appear to be an important
factor.
Similar to the findings in dividends equation, Leverage is negatively related to
Dividends, however, the significance level is below 10%. Diversification is negatively
related to Leverage although only marginally significant. Diversification may have a
similar effect as group affiliation, creating an internal capital market which reduces the
dependence on external borrowing. CFTA is positively related to Leverage at a 10%
significance level. One possible explanation is that more profitable firms are able to
borrow more since creditors have confidence in borrowers’ ability to repay the debt with
future operating cash flows.
The negative relationship between Own and Leverage supports the alignment
effect hypothesis, i.e., it becomes more costly to the controlling owner to misuse leverage
for expropriation purposes when he holds a large ownership stake. Excess is negatively
related to Leverage. As control increases, it appears that the controlling shareholder may
use less leverage as evidenced by the positive coefficient on Ex_c, although it is only
significant at the 10% level.
78
3.4. Accruals
The negative relationship between Size and Accruals implies that small firms are
more likely to manage earnings. A possible explanation is that large firms have more
analysts following and are arguably more transparent than small firms; therefore, insiders
refrain from earnings management for fear of public scrutiny. As expected, Vol is
positively related to Accruals, i.e., firms with more volatile earnings are more likely to
manage their earnings, ceteris paribus.
Dividends and Diversification are positively related to Accruals. More profitable
firms have higher accruals. Claessens and Fan (2003) point out that although Asian firms
with high ownership concentration are more susceptible to expropriation problem by
controlling owners, they are not necessarily run badly. Controlling owners also have
incentives to improve efficiency in order to generate more resources to divert to
themselves. To hide their expropriation actions, they may aggressively manage earnings.
The ownership variables Own, Excess, and Ex_c have no significant direct effects
on Accruals. However, as discussed above, ownership structure has indirect effects on
Accrual through other policies.
3.5. CFTA
Large firms seem to be just as efficient as small firms. In contrast to the findings
ofAsian firms [see Essay 1], diversified firms are more efficient. Own, Excess, and Ex_c
have no significant direct effects on CFTA, although the signs on these three variables
are consistent with the findings of essay 1. In short, there is no statistical evidence of
efficiency improvement due to monitoring in these European firms.
79
3.6. Market-to-book ratio of assets (MB)
Growth opportunity (Grow) does not appear to affect firm value. Similar to the
results in essay 1, larger firms receive higher valuation, possibly because investors prefer
stock ownership in large and well-established firms. Consistent with the findings of
Asian firms, Dividend and Leverage are negatively related to firm value, whereas
Accruals and CFTA are positively related to firm value. Given that mature firms tend to
pay high dividends and use more leverage and mature firms are perceived to be lack of
growth opportunities, these negative relationships may imply that outside investors
consider high dividends and leverage as signs of poor growth prospect and therefore
assign lower value to these firms. are aware of the fact that Dividends and Leverage are
used to facilitate expropriation and therefore discount firm value accordingly. The
positive relationship between Accruals and firm value is surprising, in that it suggests that
European equity markets reward firms that, ceteris paribus, manage earnings. The
negative coefficient on Diversification is consistent with a diversification discount.
In contrast with the Asian results, Own and Excess are negatively related to firm
value, although the significance level on Own is only marginal. These results suggest that
outside investors are wary of expropriation in firms with large excess control held by the
controlling shareholder. The positive coefficient on Ex_c implies that the effect of excess
control is diminishing at high levels of control.
3.7. Legal system features
As shown in table 2, countries having English law origin, high Anti-director
index, high creditor rights, and low reserve requirements have large Prin1 values. Notice
that Prin1 has a positive effect on CFTA and a negative effect on Diversification,
80
suggesting that strong overall investor protection improves firm efficiency and reduces
inefficient diversification.
Firms with German legal origin, and/or large reserve requirement and strong
creditor protection have high Prin2 values. The negative effect of Prin2 on Dividend
suggests that firms in creditor-friendly legal environment may disregard shareholders
interests in favor of creditors interests. These results are similar in nature to the findings
of LLSV (2000). Prin2 has a negative effect on Diversification, possibly because
creditors impose more restrictions on the controlling owner’s policy choices (fewer
opportunities to misuse diversification). Furthermore, countries with strong creditor
protection tend to be conservative in their accounting practice and often use provisions to
smooth earnings such as Germany and Japan [see Black and White (2003)]. The positive
relationship between Prin2 and Accrual supports this argument. The negative effect of
Prin2 on market-to-book ratio implies that the expropriation problem might be more
severe in these German law countries and the costs outweigh the efficiency gain,
therefore the overall impact is destroying firm value.
Table 2 shows that Scandinavian countries have highest values in Prin3, primarily
due to their strong law enforcement. Prin3 is positively related to market-to-book ratio,
suggesting that investors value strong law enforcement. Prin3 is also positively related to
Leverage. Despite their low creditor protection score, creditors in these countries may be
comfortable with firms using more leverage due to strong law enforcement.
3.8. Net effects of Own and Excess
The structural form estimates discussed above present both the (indirect) policy
effect and the direct ownership effect for each equation. Table 5 Panel B presents the net
81
effect of Own and Excess on policy and performance variables. I first compute the
predicted values for the policy and performance variables using the sum of the product of
the mean values of each exogenous variable and their reduced form coefficient. Then,
holding all else constant, I calculate the change of the predicted values for a 5% change
in Own or Excess. To explore the potential nonlinear effect of ownership structure, I
divide the sample into two subsets: (1) low control firms whose largest owners have
control rights below the sample median (30%) and (2) high control firms whose largest
owners have control rights above the sample median. Panel B also presents the ratios of a
5% change in Own/Excess over the predicted values for these two subsets.
For the whole sample and the two subsets, a 5% increase in Own has a positive
effect on Dividends, and negative effects on other policy variables as well as CFTA and
MB. This seems to suggest that cash flow rights are not very effective in aligning the
interests of controlling shareholders with those of minority shareholders for these listed
European firms.
The effect of the change in Excess depends on the level of controls held by the
largest shareholder. For low control firms, an increase in Excess reduces dividends,
diversification, leverage, CFTA, and MB, and increases accruals. For high control firms,
an increase in Excess reduces dividends and MB, but increases diversification, leverage,
accruals, and CFTA. All else equal, the controlling owner is more likely to expropriate
minority shareholders at high levels of control. The results support this conjecture: (1)
excess control reduces dividends payment by a larger amount at high control levels; (2)
the controlling owner uses more diversification at high levels of control; (3) the
controlling owner uses more leverage to facilitate expropriation; (4) excess control is
82
positively related to CFTA but negatively related to MB, suggesting that the controlling
owner improves efficiency but divert the majority of the increased wealth to himself
instead of sharing it with minority shareholders.
Taken together, the results suggest that the controlling owner is more likely to
engage in expropriation activities when he has excess control rights. The policy choices
for expropriation purpose are different depending on the levels of control held by the
controlling owner. The controlling owner pays lower dividends and simultaneously
manage earnings to facilitate expropriation. The controlling owner uses more
diversification and leverage only at high levels of control. These actions taken by the
controlling owner cause inefficiency at low levels of control, but enhances efficiency at
high levels of control. Despite the efficiency gain, the expropriation costs outweigh the
efficiency gains; therefore we still observe a negative effect of Excess on MB.
4. Specification and robustness checks
To compare with previous studies results, I run my six equations separately using
OLS approach. Table 6 reports the OLS regression results. The signs and significance of
the policy and ownership variables are consistent in some equations but not in others. For
example, in the market-to-book equation, the estimated coefficients on Excess, Ex_c,
Diversification, and Accruals have the same signs and similar significance level using
either 3sls or OLS methods. However, the coefficient estimate on Dividend and CFTA
switch signs using OLS estimation method. The negative coefficient on CFTA is counter
intuitive, suggesting there might be a specification error. I conduct the Hausman
endogeneity test [see Hausman (1978)]. The test results indicate that the policy and
83
performance variables are endogenous to the system. Hence, OLS estimation method
suffers from the simultaneous equations bias problem.
For a subset of my sample, I have information regarding whether there exists a
second largest owner.35 Extant literature suggests that the presence of blockholders may
increase monitoring on the controlling owner or management which in turn affects firm
performance. Hence, I use a blockholder binary variable (Block) to control for the effect
of block ownership. Block is set equal to 1 if there exists a second largest owner with at
least 10% voting rights. Only 1,667 out of 1,757 firms have data for this block variable.
Adding this dummy to the original simultaneous equations model does not change the
significance and magnitude of coefficient estimates on other variables [results are not
reported here].
I also use a country-fixed-effect model as an alternative specification as an
additional robustness check. This specification controls for some country-specific factors
such as different taxation policies on dividends that might contribute to the differences in
policy choices and performance that are unrelated to ownership structure. The results (not
reported here) are very similar to those reported in table 5.
I also test whether the owner’s type affects his expropriation behavior as
manifested in his policy choices. Faccio and Lang (2002) classify the largest owner as
family, unlisted company, widely held company, widely held financial institutions, and
miscellaneous including charities, voting trusts, employees, cooperatives, or minority
foreign investors. Hence, I create a binary variable indicating if a firm is family-
controlled (family and unlisted firms), or is controlled by a widely held corporation, or is
35 Faccio and Lang (2002) report this information only for a subset of firms.
84
controlled by a widely held financial institution. The miscellaneous type is the reference
group. I rerun the original specification by adding these binary variables. The results are
qualitatively similar to the main results reported here and the binary variables are often
not significant.
The extant literature suggests that the dual roles played by a financial institution
may have specific implications with respect to agency problems. I also conjecture that
state-controlled firms may exhibit different characteristics regarding the agency
problems. Therefore, I rerun the model by excluding firms that are controlled by financial
institutions (228 observations) or controlled by states (76 observations). The results of the
original specification are largely maintained. The excess control becomes less significant
in various equations. Through examining the descriptive statistics, I find that the largest
owners of state-controlled or financial-institution controlled firms have more excess
control rights than firms with other owner types.
5. Conclusions
This study adopts a simultaneous equations approach to examine how
concentrated ownership structure affects the nature of the agency problems. For a sample
of 1,757 listed firms across 13 Western European countries, I find that the entrenchment
effect exists among firms with high ownership concentration. The empirical analysis
reveals that the policy choices are simultaneously chosen by the controlling owners. With
highly concentrated ownership structure, the controlling owner has the power and
incentive to expropriate minority shareholders. The major corporate policies, namely,
Dividends, Diversification, Leverage, Accruals, may be substitutes as bonding devices or
complimentary means to expropriate minority shareholders. For example, either large
85
dividend payment or high leverage could be used as signals to outside investors that the
controlling owner is committed not to misuse free cash flow. On the other hand, as major
financial policies, Accruals, Dividend and Leverage are influenced by firms’ operating
performance. All else equal, more profitable firms could afford high dividend payments
or use less external borrowing. Furthermore, for high performing firms, the insiders feel
less urgency to engage in earnings management. These relationships may be distorted
when the controlling owner intends to use firm policies to maximize his utility at the
expense of minority shareholders. For example, profitable firms may have high accruals
because the controlling owner intends to divert firm resources to himself and manage
earnings to hide his expropriation activity.
The principal components analysis finds additional evidence supporting the view
that legal protection of investors’ property rights is an important factor in corporate
governance mechanism. Lastly, there is some weak evidence suggesting the existence of
nonlinear ownership effects.
6. Comparison of results between East Asia and Western European firms
The East Asia and Western Europe regions exhibit large differences with respect
to financial development, culture, and market operations. Faccio, Lang, and Young
(2001a) suggest that the European capital markets exert more discipline on firms so that
the insiders’ expropriation behavior may differ across these two markets. My empirical
results for Asian and European firms reveal that the ownership structure has quite
different implications in insiders’ policy choices. These policy choices in turn affect firm
performance. The following discussions are based on the three-stage least squares (3SLS)
results reported in table 5 of essays 1 and 2.
86
6.1. Dividends
Faccio, Lang, and Young (2001b) find that Western European firms on average
pay higher dividends than East Asian firms. They use the ratio of cash flow rights to
control rights (hereafter O/C ratio) of the largest owner as a proxy for the insider’s
incentive to expropriate minority shareholders. They assume that the expropriation
problems of firms that are tightly affiliated with business groups are more visible to
outsiders, ceteris paribus. For East Asian firms that have tight group-affiliation, the O/C
ratio is negatively related to dividends payment, i.e., if the controlling shareholder has
larger excess control rights, the dividend rate will be high. By contrast, for Western
European firms that have tight group-affiliation, O/C ratio is positively related to
dividends payment, i.e., more excess control implies low dividends payment. Although
my specification is different from Faccio, Lang, and Young (2001b), the estimated
coefficient on excess control for my Asian and European sample firms are consistent with
their findings. For Asian firms, I find that excess control rights are positively related to
dividends. However, for European firms, the excess control rights are negatively related
to dividends rate. Furthermore, the cash flow rights are positively related to dividend rate
only for Asian firms.
6.2. Diversification
Claessens, Djankov, Fan, and Lang (2000) document a positive relationship
between excess control held by the largest shareholder and firm level diversification for a
sample of East Asian firms. My results for the Asian sample firms support their findings.
For example, the excess control is positively related to diversification in equation 2 at the
8% significance level, suggesting that the controlling owners of Asian firms overuse
87
diversification as a means of expropriation. By contrast, the excess control is negatively
related to diversification for the European firms, implying that low divergence between
ownership and control rights will result in high diversification. If the controlling
shareholder achieves control without resort to control enhancing mechanism (therefore
low divergence between his cash flow and voting rights), he bears more firm-specific risk
due to his high cash flow stake. Then his incentive is to diversify his firm-specific risk.
6.3. Leverage
Faccio, Lang, and Young (2001a) argue that leverage facilitates expropriation for
East Asia and Western European firms. They document regional differences in the
controlling owner’s choice of leverage which is attributable to the effectiveness of capital
market discipline. In their analysis they assume that the capital markets exert more
effective discipline in the European market than in the Asian market. My results provide
additional evidence supporting their arguments. Specifically, I find that the excess control
held by the controlling shareholder is positively related to leverage ratio for East Asia
firms. Given ineffective external discipline and easy access to related party loans, the
controlling owner misuses leverage to gain control over resources for his private gains.
For the European sample, I find that the excess control is negatively related to leverage,
i.e., firms that are more vulnerable to expropriation use lower leverage. European firms
operate in an environment with better investor protection and more effective external
monitoring. Therefore, the controlling owner has less incentive to try to misuse leverage.
88
6.4. Accruals
I find that the excess control is negatively related to total accruals for East Asian
firms, but is positively (only significant at 12% level) related to total accruals for Western
European firms. All else equal, I find that East Asian firms with excess control have
higher operating efficiency, which mitigates the need to manage earnings, whereas the
excess control has no impact on operating efficiency for the European firms.
6.5. CFTA
Joh (2003) documents that the excess control held by the large owners of Korean
firms is negatively related to operating efficiency. For the Asian sample of eight
economies, I come to a different conclusion. I find that the excess control is positively
related to operating efficiency. However, the excess control has no significant impact on
CFTA for the European firms, indicating lack of monitoring benefits from large
shareholders for these European firms.
6.6. Market-to-book ratio of assets (MB)
Claessens, Djankov, Fan, and Lang (2002) find that the cash flow rights held by
the controlling owner is positively related to firm value measured by Tobin’s Q while the
excess control of the controlling owner is negatively related to firm value. My Asian
sample results show that both cash flow rights and excess control rights are positively
related to firm value. However, my European sample results show that both the cash flow
rights and excess control rights have negative effects on firm value, although the effect of
cash flow rights is only marginally significant.
89
6.7. Summary
Table 7 presents the contrast of the impact of the excess control rights on firm
policy and performance for the European firms and the Asian firms. I rerun the Asian
model excluding the Block and Group variables given that the European sample does not
have sufficient information for these two variables. The excess control has opposite
effects on all policy variables and market-to-book ratio for firms from these two regions.
For the Asian firms, the excess control rights have a positive effect on operating
efficiency (CFTA), suggesting that the alignment effect is operating. However, for the
European firms, the excess control rights have a positive but insignificant effect on
operating efficiency (CFTA), suggesting no efficiency enhancement attributable to
concentrated ownership. The results for the dividends and leverage equations are
consistent with the findings of Faccio, Lang, and Young (2001a, b). The excess control is
beneficial to Asian firms but detrimental to European firms.
Taken together, the cash flow and excess control rights exhibit positive alignment
effect for East Asian firms. For the European firms, these positive effects are largely
muted, leaving only the entrenchment effect as being relevant. Perhaps the external
monitoring effect is more important in Europe where the capital markets play more
important roles in the national economies. Table 8 presents the stock markets’ importance
in each country’s economy as measured by the ratio of total stock market value to
national GDP. The stock markets in countries such as Finland, France, Sweden,
Switzerland, and United Kingdom are relatively large compared to the size of their
national economies. The Asian stock markets in general seem to be less important to their
economic development with exceptions for Hong Kong and Malaysia. The more
90
developed European capital markets potentially constrain the controlling owner’s
expropriation behavior, as manifested in his utilization of corporate policies. The capital
market discipline at least partially substitutes for the internal ownership structure effects
noted in the sample of East Asian firms.
The sample European firms have higher ownership concentration than their Asian
peers. The mean control [cash flow] rights held by the largest owner is 37% [33%] for
European firms versus 30% [25%] for Asian firms. Extant literature documents the
existence of nonlinear ownership effect on firm performance [see Morck, Shleifer and
Vishny (1986)]. The nonlinear ownership effect might partially explain the different
effects of ownership structure on corporate policies and performance across two regions.
In conclusion, the listed firms in East Asia and Western European economies
exhibit high ownership concentration. The majority of these firms are controlled by a
large shareholder (the controlling owner). The simultaneous equations approach reveals
that the controlling owner simultaneously chooses a combination of corporate policies to
maximize his private benefits. The ownership structure has both direct and indirect
impacts (via firm policies) on firm performance. The presence of a large shareholder
enhances operating efficiency for East Asian firms. The European firms do not enjoy the
same effect. These differences might be attributable to the difference in the capital market
development. Future research may provide additional insights into this matter.

91
Appendix
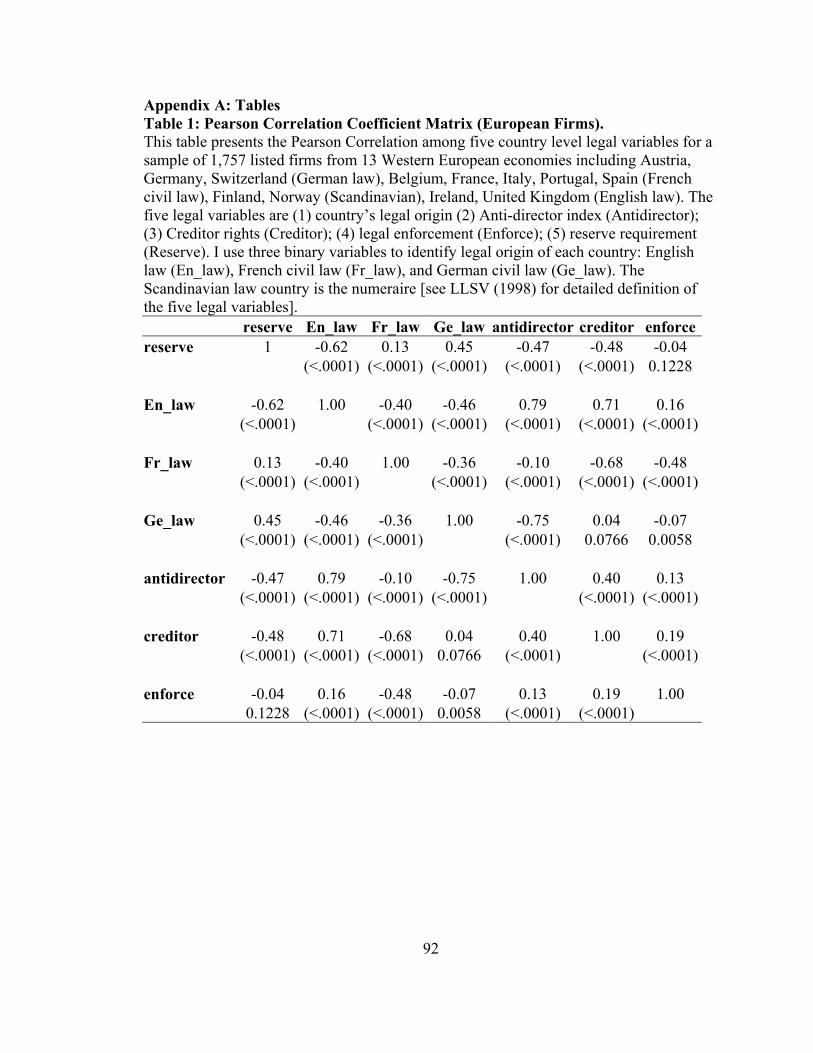
92
Appendix A: Tables Table 1: Pearson Correlation Coefficient Matrix (European Firms). This table presents the Pearson Correlation among five country level legal variables for a sample of 1,757 listed firms from 13 Western European economies including Austria, Germany, Switzerland (German law), Belgium, France, Italy, Portugal, Spain (French civil law), Finland, Norway (Scandinavian), Ireland, United Kingdom (English law). The five legal variables are (1) country’s legal origin (2) Anti-director index (Antidirector); (3) Creditor rights (Creditor); (4) legal enforcement (Enforce); (5) reserve requirement (Reserve). I use three binary variables to identify legal origin of each country: English law (En_law), French civil law (Fr_law), and German civil law (Ge_law). The Scandinavian law country is the numeraire [see LLSV (1998) for detailed definition of the five legal variables]. reserve En_law Fr_law Ge_law antidirector creditor enforcereserve 1 -0.62 0.13 0.45 -0.47 -0.48 -0.04 (<.0001) (<.0001) (<.0001) (<.0001) (<.0001) 0.1228 En_law -0.62 1.00 -0.40 -0.46 0.79 0.71 0.16 (<.0001) (<.0001) (<.0001) (<.0001) (<.0001) (<.0001) Fr_law 0.13 -0.40 1.00 -0.36 -0.10 -0.68 -0.48 (<.0001) (<.0001) (<.0001) (<.0001) (<.0001) (<.0001) Ge_law 0.45 -0.46 -0.36 1.00 -0.75 0.04 -0.07 (<.0001) (<.0001) (<.0001) (<.0001) 0.0766 0.0058 antidirector -0.47 0.79 -0.10 -0.75 1.00 0.40 0.13 (<.0001) (<.0001) (<.0001) (<.0001) (<.0001) (<.0001) creditor -0.48 0.71 -0.68 0.04 0.40 1.00 0.19 (<.0001) (<.0001) (<.0001) 0.0766 (<.0001) (<.0001) enforce -0.04 0.16 -0.48 -0.07 0.13 0.19 1.00 0.1228 (<.0001) (<.0001) 0.0058 (<.0001) (<.0001)
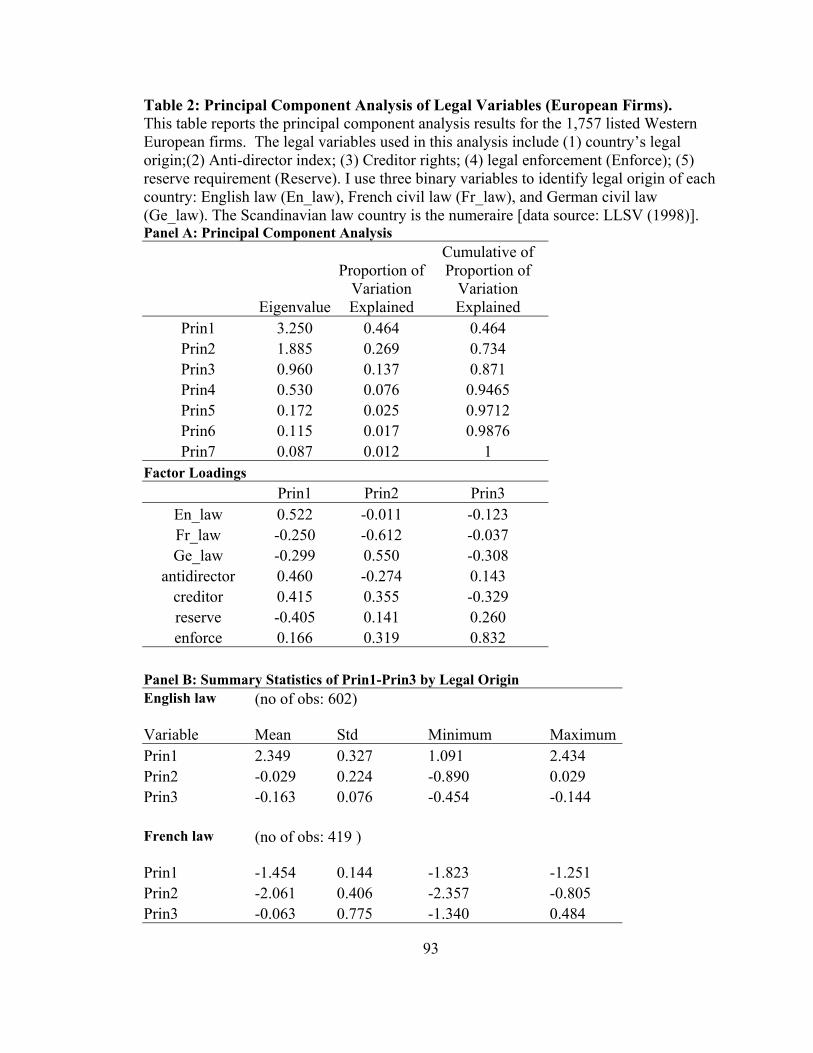
93
Table 2: Principal Component Analysis of Legal Variables (European Firms). This table reports the principal component analysis results for the 1,757 listed Western European firms. The legal variables used in this analysis include (1) country’s legal origin;(2) Anti-director index; (3) Creditor rights; (4) legal enforcement (Enforce); (5) reserve requirement (Reserve). I use three binary variables to identify legal origin of each country: English law (En_law), French civil law (Fr_law), and German civil law (Ge_law). The Scandinavian law country is the numeraire [data source: LLSV (1998)]. Panel A: Principal Component Analysis
Eigenvalue
Proportion of Variation Explained
Cumulative of Proportion of
Variation Explained
Prin1 3.250 0.464 0.464 Prin2 1.885 0.269 0.734 Prin3 0.960 0.137 0.871 Prin4 0.530 0.076 0.9465 Prin5 0.172 0.025 0.9712 Prin6 0.115 0.017 0.9876 Prin7 0.087 0.012 1
Factor Loadings Prin1 Prin2 Prin3
En_law 0.522 -0.011 -0.123 Fr_law -0.250 -0.612 -0.037 Ge_law -0.299 0.550 -0.308
antidirector 0.460 -0.274 0.143 creditor 0.415 0.355 -0.329 reserve -0.405 0.141 0.260 enforce 0.166 0.319 0.832
Panel B: Summary Statistics of Prin1-Prin3 by Legal Origin English law (no of obs: 602)
Variable Mean Std Minimum Maximum Prin1 2.349 0.327 1.091 2.434 Prin2 -0.029 0.224 -0.890 0.029 Prin3 -0.163 0.076 -0.454 -0.144 French law (no of obs: 419 )
Prin1 -1.454 0.144 -1.823 -1.251 Prin2 -2.061 0.406 -2.357 -0.805 Prin3 -0.063 0.775 -1.340 0.484
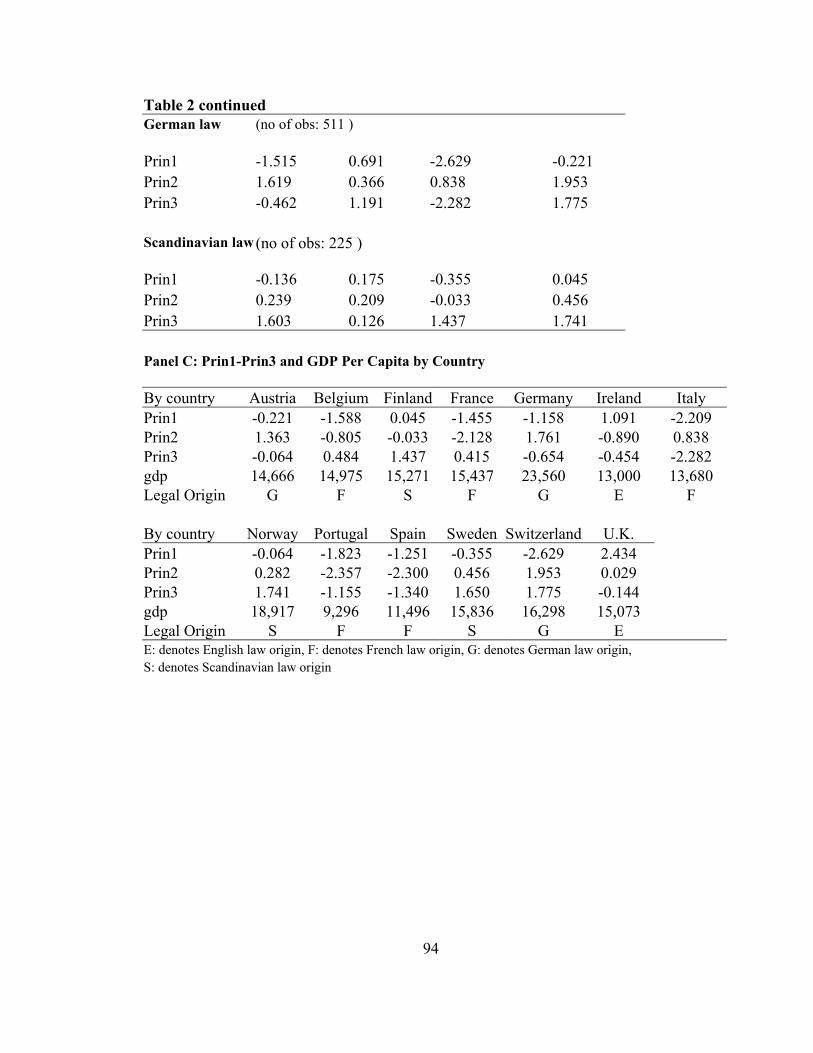
94
Table 2 continued German law (no of obs: 511 )
Prin1 -1.515 0.691 -2.629 -0.221 Prin2 1.619 0.366 0.838 1.953 Prin3 -0.462 1.191 -2.282 1.775 Scandinavian law (no of obs: 225 )
Prin1 -0.136 0.175 -0.355 0.045 Prin2 0.239 0.209 -0.033 0.456 Prin3 1.603 0.126 1.437 1.741 Panel C: Prin1-Prin3 and GDP Per Capita by Country By country Austria Belgium Finland France Germany Ireland Italy Prin1 -0.221 -1.588 0.045 -1.455 -1.158 1.091 -2.209 Prin2 1.363 -0.805 -0.033 -2.128 1.761 -0.890 0.838 Prin3 -0.064 0.484 1.437 0.415 -0.654 -0.454 -2.282 gdp 14,666 14,975 15,271 15,437 23,560 13,000 13,680 Legal Origin G F S F G E F By country Norway Portugal Spain Sweden Switzerland U.K. Prin1 -0.064 -1.823 -1.251 -0.355 -2.629 2.434 Prin2 0.282 -2.357 -2.300 0.456 1.953 0.029 Prin3 1.741 -1.155 -1.340 1.650 1.775 -0.144 gdp 18,917 9,296 11,496 15,836 16,298 15,073 Legal Origin S F F S G E E: denotes English law origin, F: denotes French law origin, G: denotes German law origin, S: denotes Scandinavian law origin
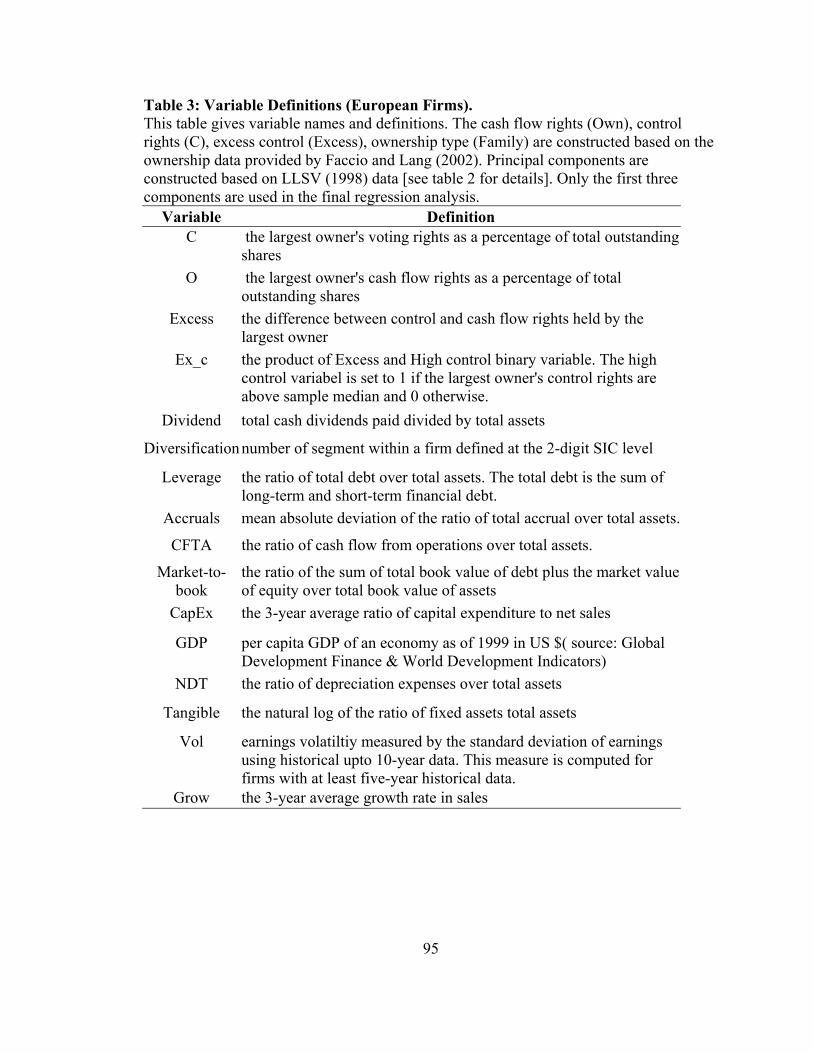
95
Table 3: Variable Definitions (European Firms). This table gives variable names and definitions. The cash flow rights (Own), control rights (C), excess control (Excess), ownership type (Family) are constructed based on the ownership data provided by Faccio and Lang (2002). Principal components are constructed based on LLSV (1998) data [see table 2 for details]. Only the first three components are used in the final regression analysis.
Variable Definition C the largest owner's voting rights as a percentage of total outstanding
shares O the largest owner's cash flow rights as a percentage of total
outstanding shares Excess the difference between control and cash flow rights held by the
largest owner Ex_c the product of Excess and High control binary variable. The high
control variabel is set to 1 if the largest owner's control rights are above sample median and 0 otherwise.
Dividend total cash dividends paid divided by total assets
Diversification number of segment within a firm defined at the 2-digit SIC level
Leverage the ratio of total debt over total assets. The total debt is the sum of long-term and short-term financial debt.
Accruals mean absolute deviation of the ratio of total accrual over total assets.
CFTA the ratio of cash flow from operations over total assets.
Market-to-book
the ratio of the sum of total book value of debt plus the market value of equity over total book value of assets
CapEx the 3-year average ratio of capital expenditure to net sales
GDP per capita GDP of an economy as of 1999 in US $( source: Global Development Finance & World Development Indicators)
NDT the ratio of depreciation expenses over total assets
Tangible the natural log of the ratio of fixed assets total assets
Vol earnings volatiltiy measured by the standard deviation of earnings using historical upto 10-year data. This measure is computed for firms with at least five-year historical data.
Grow the 3-year average growth rate in sales
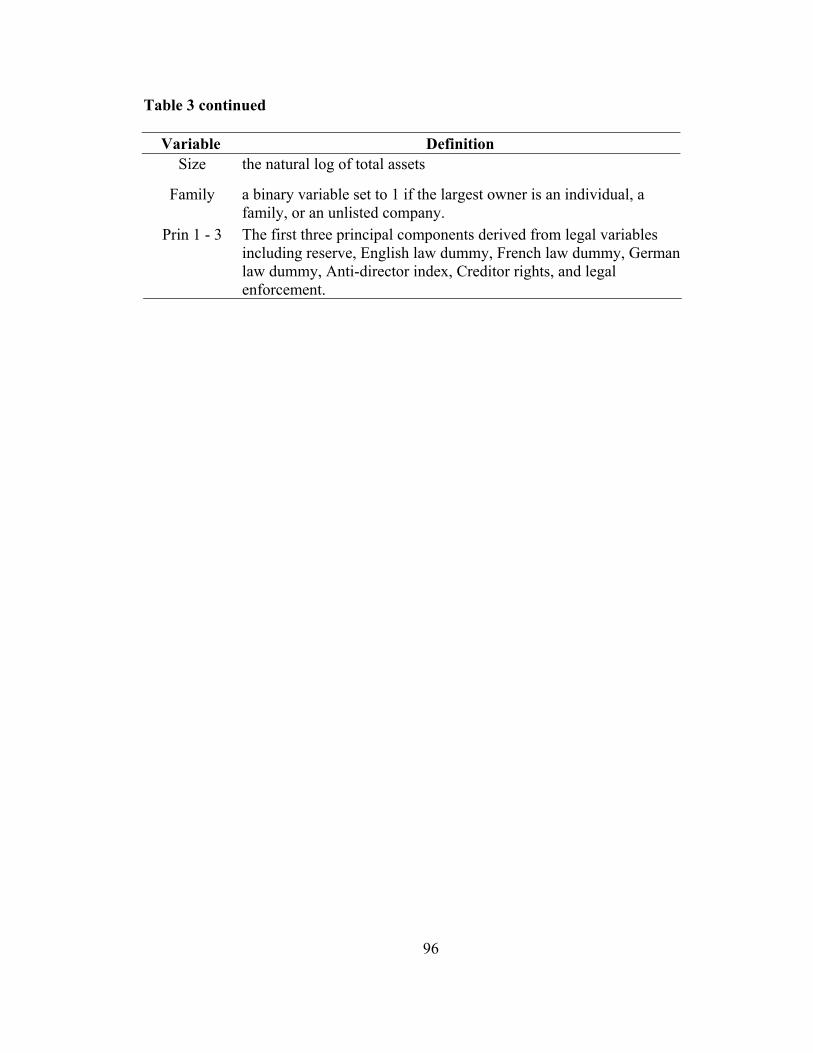
96
Table 3 continued
Variable Definition Size the natural log of total assets
Family a binary variable set to 1 if the largest owner is an individual, a family, or an unlisted company.
Prin 1 - 3 The first three principal components derived from legal variables including reserve, English law dummy, French law dummy, German law dummy, Anti-director index, Creditor rights, and legal enforcement.
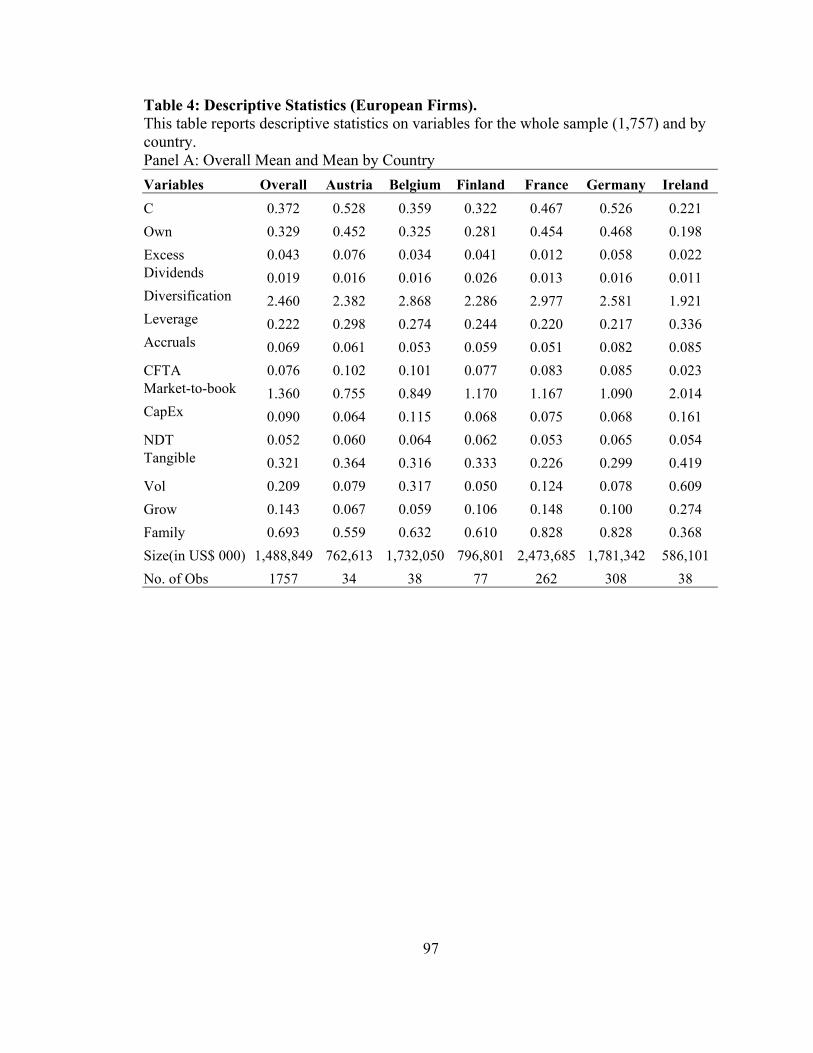
97
Table 4: Descriptive Statistics (European Firms). This table reports descriptive statistics on variables for the whole sample (1,757) and by country. Panel A: Overall Mean and Mean by Country Variables Overall Austria Belgium Finland France Germany Ireland C 0.372 0.528 0.359 0.322 0.467 0.526 0.221 Own 0.329 0.452 0.325 0.281 0.454 0.468 0.198 Excess 0.043 0.076 0.034 0.041 0.012 0.058 0.022 Dividends 0.019 0.016 0.016 0.026 0.013 0.016 0.011 Diversification 2.460 2.382 2.868 2.286 2.977 2.581 1.921 Leverage 0.222 0.298 0.274 0.244 0.220 0.217 0.336 Accruals 0.069 0.061 0.053 0.059 0.051 0.082 0.085 CFTA 0.076 0.102 0.101 0.077 0.083 0.085 0.023 Market-to-book 1.360 0.755 0.849 1.170 1.167 1.090 2.014 CapEx 0.090 0.064 0.115 0.068 0.075 0.068 0.161 NDT 0.052 0.060 0.064 0.062 0.053 0.065 0.054 Tangible 0.321 0.364 0.316 0.333 0.226 0.299 0.419 Vol 0.209 0.079 0.317 0.050 0.124 0.078 0.609 Grow 0.143 0.067 0.059 0.106 0.148 0.100 0.274 Family 0.693 0.559 0.632 0.610 0.828 0.828 0.368 Size(in US$ 000) 1,488,849 762,613 1,732,050 796,801 2,473,685 1,781,342 586,101 No. of Obs 1757 34 38 77 262 308 38
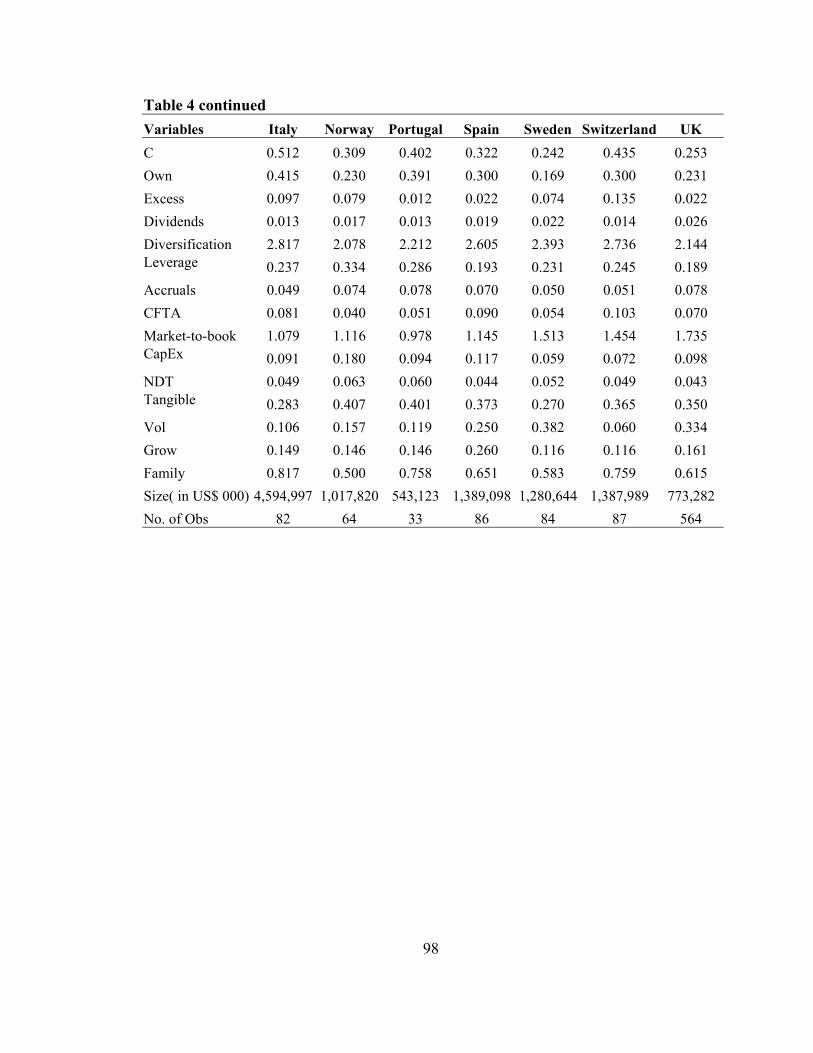
98
Table 4 continued Variables Italy Norway Portugal Spain Sweden Switzerland UK C 0.512 0.309 0.402 0.322 0.242 0.435 0.253 Own 0.415 0.230 0.391 0.300 0.169 0.300 0.231 Excess 0.097 0.079 0.012 0.022 0.074 0.135 0.022 Dividends 0.013 0.017 0.013 0.019 0.022 0.014 0.026 Diversification 2.817 2.078 2.212 2.605 2.393 2.736 2.144 Leverage 0.237 0.334 0.286 0.193 0.231 0.245 0.189 Accruals 0.049 0.074 0.078 0.070 0.050 0.051 0.078 CFTA 0.081 0.040 0.051 0.090 0.054 0.103 0.070 Market-to-book 1.079 1.116 0.978 1.145 1.513 1.454 1.735 CapEx 0.091 0.180 0.094 0.117 0.059 0.072 0.098 NDT 0.049 0.063 0.060 0.044 0.052 0.049 0.043 Tangible 0.283 0.407 0.401 0.373 0.270 0.365 0.350 Vol 0.106 0.157 0.119 0.250 0.382 0.060 0.334 Grow 0.149 0.146 0.146 0.260 0.116 0.116 0.161 Family 0.817 0.500 0.758 0.651 0.583 0.759 0.615 Size( in US$ 000) 4,594,997 1,017,820 543,123 1,389,098 1,280,644 1,387,989 773,282 No. of Obs 82 64 33 86 84 87 564
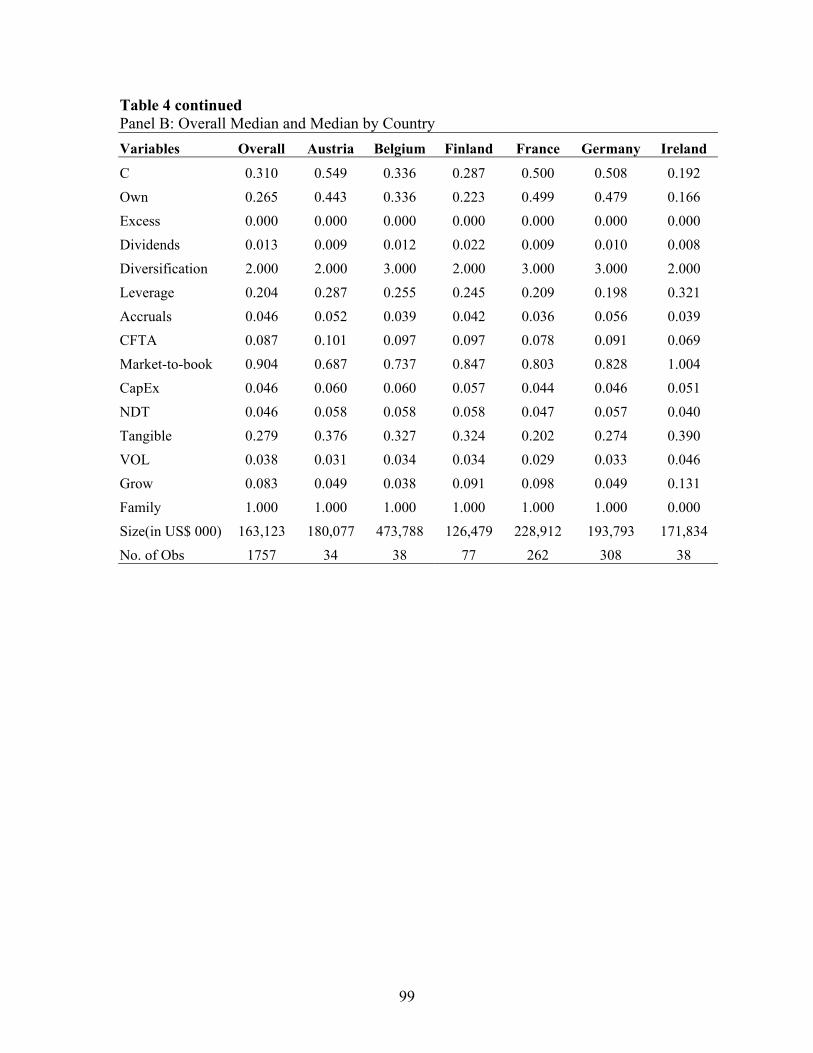
99
Table 4 continued Panel B: Overall Median and Median by Country Variables Overall Austria Belgium Finland France Germany Ireland
C 0.310 0.549 0.336 0.287 0.500 0.508 0.192 Own 0.265 0.443 0.336 0.223 0.499 0.479 0.166 Excess 0.000 0.000 0.000 0.000 0.000 0.000 0.000 Dividends 0.013 0.009 0.012 0.022 0.009 0.010 0.008 Diversification 2.000 2.000 3.000 2.000 3.000 3.000 2.000 Leverage 0.204 0.287 0.255 0.245 0.209 0.198 0.321 Accruals 0.046 0.052 0.039 0.042 0.036 0.056 0.039 CFTA 0.087 0.101 0.097 0.097 0.078 0.091 0.069 Market-to-book 0.904 0.687 0.737 0.847 0.803 0.828 1.004 CapEx 0.046 0.060 0.060 0.057 0.044 0.046 0.051 NDT 0.046 0.058 0.058 0.058 0.047 0.057 0.040 Tangible 0.279 0.376 0.327 0.324 0.202 0.274 0.390 VOL 0.038 0.031 0.034 0.034 0.029 0.033 0.046 Grow 0.083 0.049 0.038 0.091 0.098 0.049 0.131 Family 1.000 1.000 1.000 1.000 1.000 1.000 0.000 Size(in US$ 000) 163,123 180,077 473,788 126,479 228,912 193,793 171,834 No. of Obs 1757 34 38 77 262 308 38
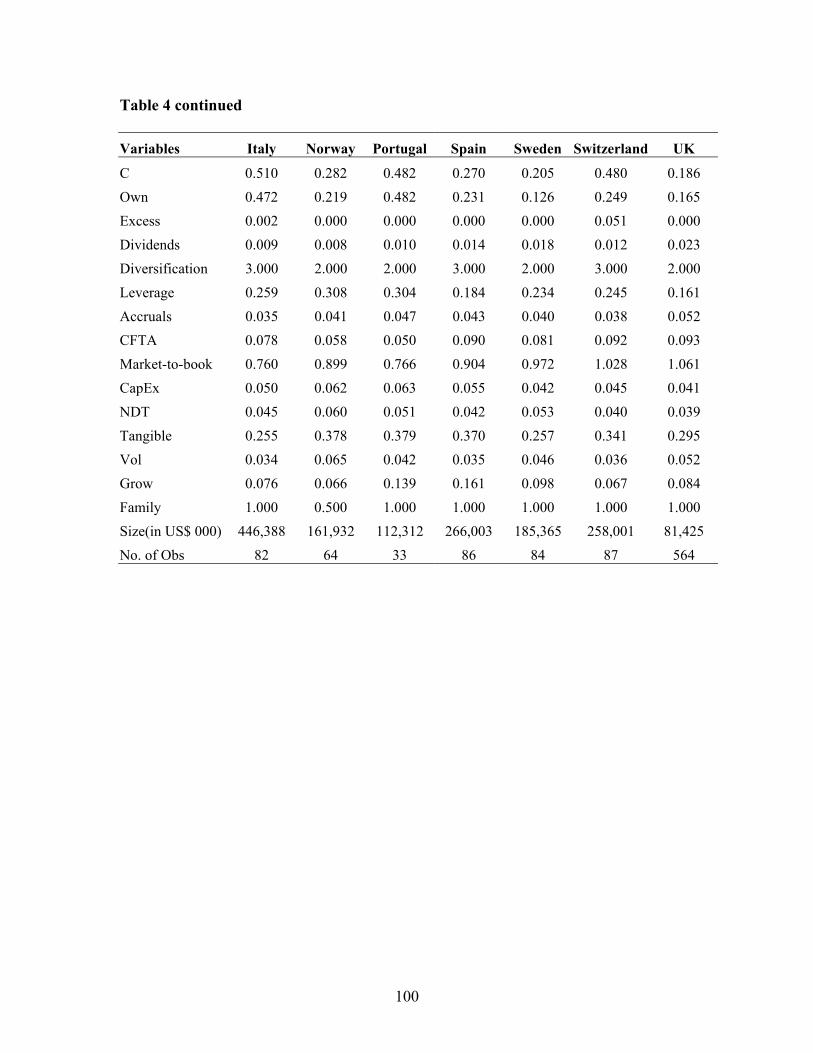
100
Table 4 continued
Variables Italy Norway Portugal Spain Sweden Switzerland UK
C 0.510 0.282 0.482 0.270 0.205 0.480 0.186 Own 0.472 0.219 0.482 0.231 0.126 0.249 0.165 Excess 0.002 0.000 0.000 0.000 0.000 0.051 0.000 Dividends 0.009 0.008 0.010 0.014 0.018 0.012 0.023 Diversification 3.000 2.000 2.000 3.000 2.000 3.000 2.000 Leverage 0.259 0.308 0.304 0.184 0.234 0.245 0.161 Accruals 0.035 0.041 0.047 0.043 0.040 0.038 0.052 CFTA 0.078 0.058 0.050 0.090 0.081 0.092 0.093 Market-to-book 0.760 0.899 0.766 0.904 0.972 1.028 1.061 CapEx 0.050 0.062 0.063 0.055 0.042 0.045 0.041 NDT 0.045 0.060 0.051 0.042 0.053 0.040 0.039 Tangible 0.255 0.378 0.379 0.370 0.257 0.341 0.295 Vol 0.034 0.065 0.042 0.035 0.046 0.036 0.052 Grow 0.076 0.066 0.139 0.161 0.098 0.067 0.084 Family 1.000 0.500 1.000 1.000 1.000 1.000 1.000 Size(in US$ 000) 446,388 161,932 112,312 266,003 185,365 258,001 81,425 No. of Obs 82 64 33 86 84 87 564
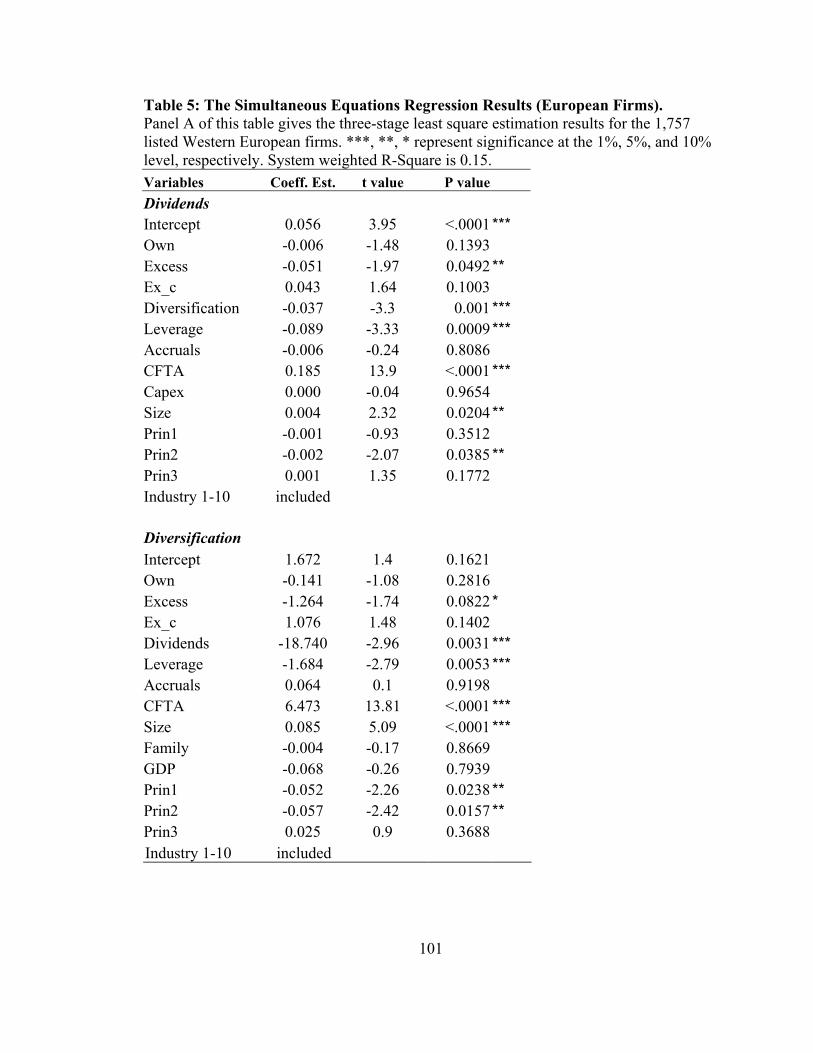
101
Table 5: The Simultaneous Equations Regression Results (European Firms). Panel A of this table gives the three-stage least square estimation results for the 1,757 listed Western European firms. ***, **, * represent significance at the 1%, 5%, and 10% level, respectively. System weighted R-Square is 0.15. Variables Coeff. Est. t value P value Dividends Intercept 0.056 3.95 <.0001 *** Own -0.006 -1.48 0.1393 Excess -0.051 -1.97 0.0492 ** Ex_c 0.043 1.64 0.1003 Diversification -0.037 -3.3 0.001 *** Leverage -0.089 -3.33 0.0009 *** Accruals -0.006 -0.24 0.8086 CFTA 0.185 13.9 <.0001 *** Capex 0.000 -0.04 0.9654 Size 0.004 2.32 0.0204 ** Prin1 -0.001 -0.93 0.3512 Prin2 -0.002 -2.07 0.0385 ** Prin3 0.001 1.35 0.1772 Industry 1-10 included Diversification Intercept 1.672 1.4 0.1621 Own -0.141 -1.08 0.2816 Excess -1.264 -1.74 0.0822 * Ex_c 1.076 1.48 0.1402 Dividends -18.740 -2.96 0.0031 *** Leverage -1.684 -2.79 0.0053 *** Accruals 0.064 0.1 0.9198 CFTA 6.473 13.81 <.0001 *** Size 0.085 5.09 <.0001 *** Family -0.004 -0.17 0.8669 GDP -0.068 -0.26 0.7939 Prin1 -0.052 -2.26 0.0238 ** Prin2 -0.057 -2.42 0.0157 ** Prin3 0.025 0.9 0.3688 Industry 1-10 included

102
Table 5 continued Variables Coeff. Est. t value P value Leverage Intercept 0.224 1.37 0.1699 Own -0.036 -1.75 0.0803 * Excess -0.247 -1.81 0.0708 * Ex_c 0.237 1.83 0.0668 * Dividends -2.288 -0.64 0.5253 Diversification -0.124 -1.75 0.0806 * Accruals -0.054 -0.16 0.8704 CFTA 0.471 1.94 0.0529 * NDT 0.202 1.11 0.2668 Tangible 0.137 1.76 0.079 * Size 0.018 2.04 0.0418 ** Prin1 -0.014 -1.35 0.1785 Prin2 -0.007 -1.47 0.1424 Prin3 0.011 2.5 0.0124 ** Industry 1-10 included Accruals Intercept -0.061 -0.4 0.69 Own 0.021 0.6 0.5477 Excess 0.367 1.56 0.1191 Ex_c -0.342 -1.48 0.138 Dividends 7.402 2.22 0.0262 ** Diversification 0.250 2.42 0.0156 ** Leverage -0.115 -0.4 0.6925 CFTA 1.069 2.68 0.0074 *** Size -0.048 -3.07 0.0021 *** Vol 0.119 3.81 <.0001 *** Prin1 0.000 0.01 0.9936 Prin2 0.017 2.28 0.0229 ** Prin3 -0.001 -0.07 0.946 Industry 1-10 included
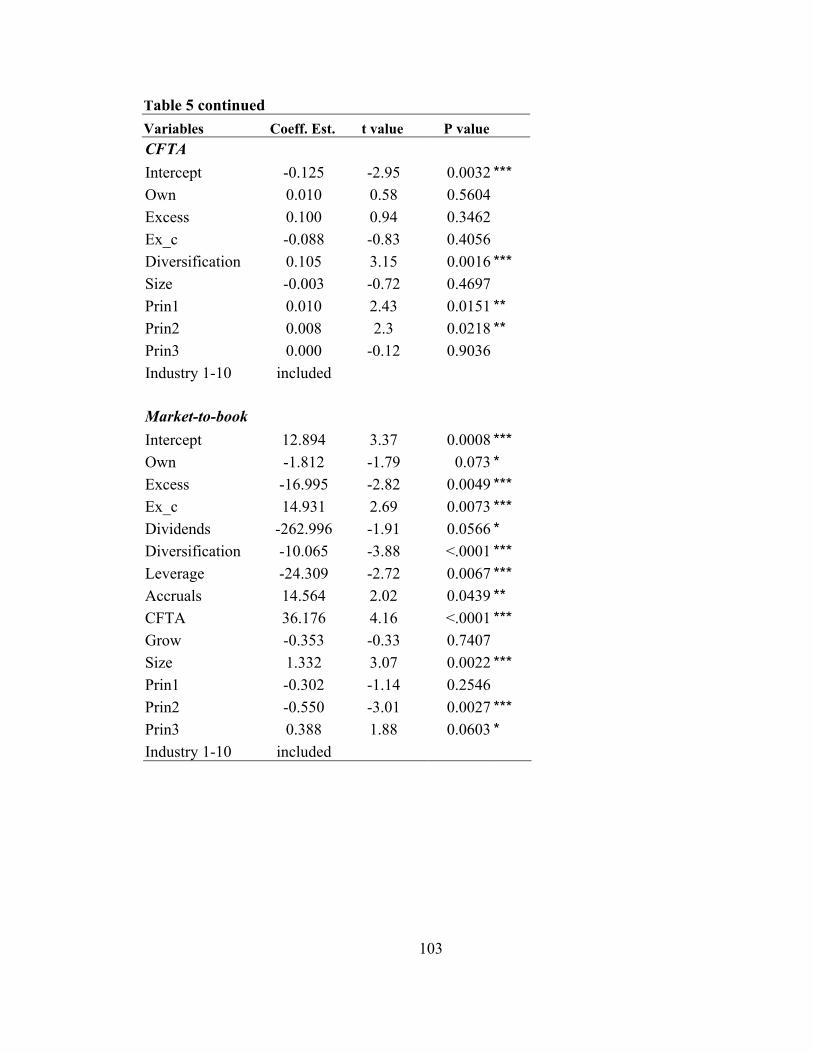
103
Table 5 continued Variables Coeff. Est. t value P value CFTA Intercept -0.125 -2.95 0.0032 *** Own 0.010 0.58 0.5604 Excess 0.100 0.94 0.3462 Ex_c -0.088 -0.83 0.4056 Diversification 0.105 3.15 0.0016 *** Size -0.003 -0.72 0.4697 Prin1 0.010 2.43 0.0151 ** Prin2 0.008 2.3 0.0218 ** Prin3 0.000 -0.12 0.9036 Industry 1-10 included Market-to-book Intercept 12.894 3.37 0.0008 *** Own -1.812 -1.79 0.073 * Excess -16.995 -2.82 0.0049 *** Ex_c 14.931 2.69 0.0073 *** Dividends -262.996 -1.91 0.0566 * Diversification -10.065 -3.88 <.0001 *** Leverage -24.309 -2.72 0.0067 *** Accruals 14.564 2.02 0.0439 ** CFTA 36.176 4.16 <.0001 *** Grow -0.353 -0.33 0.7407 Size 1.332 3.07 0.0022 *** Prin1 -0.302 -1.14 0.2546 Prin2 -0.550 -3.01 0.0027 *** Prin3 0.388 1.88 0.0603 * Industry 1-10 included
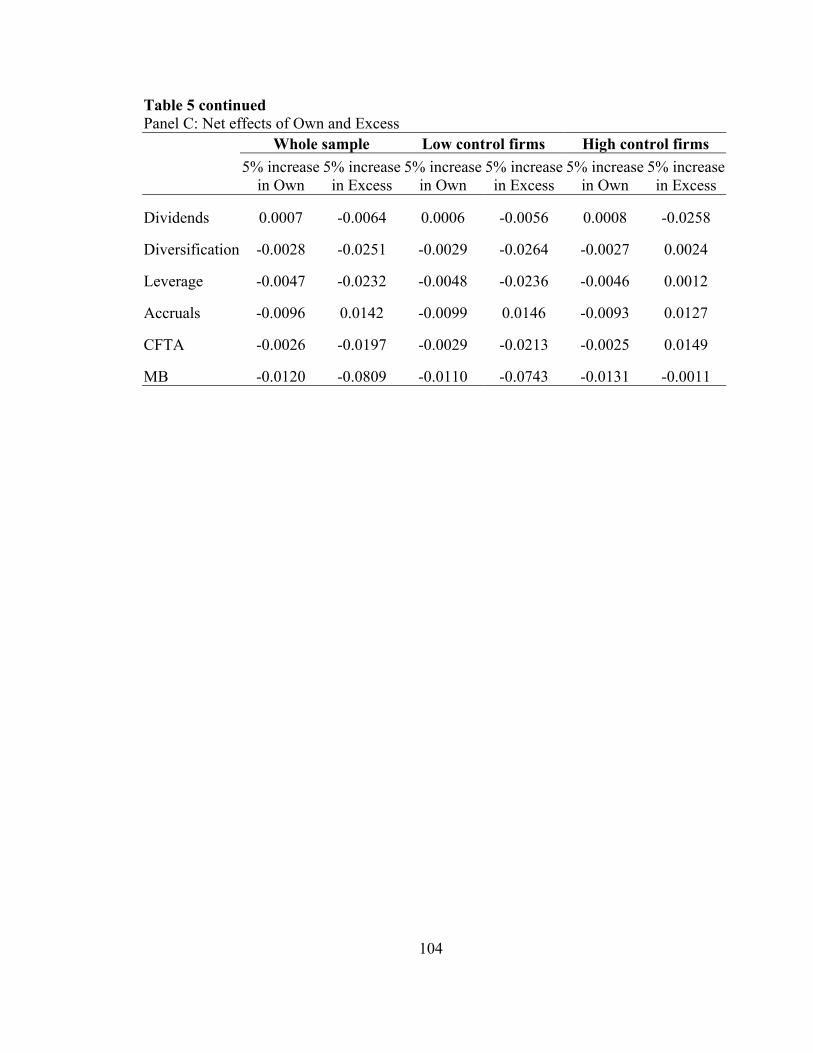
104
Table 5 continued Panel C: Net effects of Own and Excess Whole sample Low control firms High control firms
5% increase
in Own 5% increase
in Excess 5% increase
in Own 5% increase
in Excess 5% increase
in Own 5% increase
in Excess
Dividends 0.0007 -0.0064 0.0006 -0.0056 0.0008 -0.0258
Diversification -0.0028 -0.0251 -0.0029 -0.0264 -0.0027 0.0024
Leverage -0.0047 -0.0232 -0.0048 -0.0236 -0.0046 0.0012
Accruals -0.0096 0.0142 -0.0099 0.0146 -0.0093 0.0127
CFTA -0.0026 -0.0197 -0.0029 -0.0213 -0.0025 0.0149
MB -0.0120 -0.0809 -0.0110 -0.0743 -0.0131 -0.0011
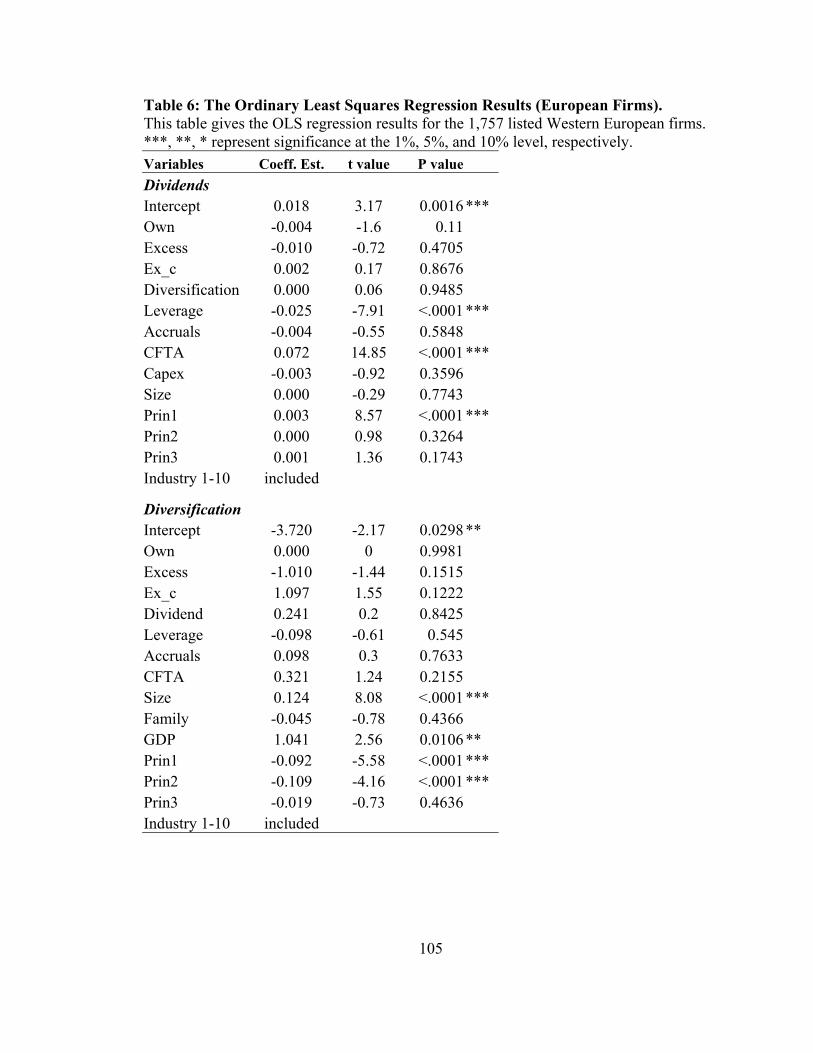
105
Table 6: The Ordinary Least Squares Regression Results (European Firms). This table gives the OLS regression results for the 1,757 listed Western European firms. ***, **, * represent significance at the 1%, 5%, and 10% level, respectively. Variables Coeff. Est. t value P value Dividends Intercept 0.018 3.17 0.0016*** Own -0.004 -1.6 0.11 Excess -0.010 -0.72 0.4705 Ex_c 0.002 0.17 0.8676 Diversification 0.000 0.06 0.9485 Leverage -0.025 -7.91 <.0001*** Accruals -0.004 -0.55 0.5848 CFTA 0.072 14.85 <.0001*** Capex -0.003 -0.92 0.3596 Size 0.000 -0.29 0.7743 Prin1 0.003 8.57 <.0001*** Prin2 0.000 0.98 0.3264 Prin3 0.001 1.36 0.1743 Industry 1-10 included
Diversification Intercept -3.720 -2.17 0.0298** Own 0.000 0 0.9981 Excess -1.010 -1.44 0.1515 Ex_c 1.097 1.55 0.1222 Dividend 0.241 0.2 0.8425 Leverage -0.098 -0.61 0.545 Accruals 0.098 0.3 0.7633 CFTA 0.321 1.24 0.2155 Size 0.124 8.08 <.0001*** Family -0.045 -0.78 0.4366 GDP 1.041 2.56 0.0106** Prin1 -0.092 -5.58 <.0001*** Prin2 -0.109 -4.16 <.0001*** Prin3 -0.019 -0.73 0.4636 Industry 1-10 included
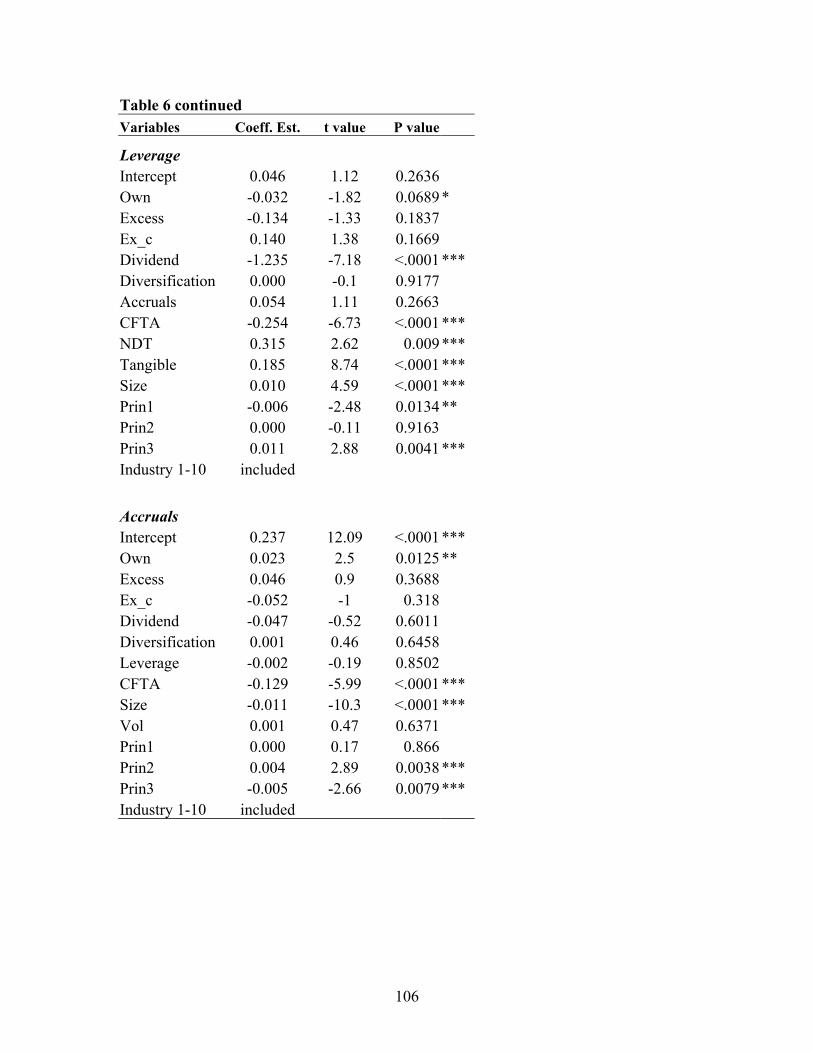
106
Table 6 continued Variables Coeff. Est. t value P value
Leverage Intercept 0.046 1.12 0.2636 Own -0.032 -1.82 0.0689* Excess -0.134 -1.33 0.1837 Ex_c 0.140 1.38 0.1669 Dividend -1.235 -7.18 <.0001*** Diversification 0.000 -0.1 0.9177 Accruals 0.054 1.11 0.2663 CFTA -0.254 -6.73 <.0001*** NDT 0.315 2.62 0.009*** Tangible 0.185 8.74 <.0001*** Size 0.010 4.59 <.0001*** Prin1 -0.006 -2.48 0.0134** Prin2 0.000 -0.11 0.9163 Prin3 0.011 2.88 0.0041*** Industry 1-10 included Accruals Intercept 0.237 12.09 <.0001*** Own 0.023 2.5 0.0125** Excess 0.046 0.9 0.3688 Ex_c -0.052 -1 0.318 Dividend -0.047 -0.52 0.6011 Diversification 0.001 0.46 0.6458 Leverage -0.002 -0.19 0.8502 CFTA -0.129 -5.99 <.0001*** Size -0.011 -10.3 <.0001*** Vol 0.001 0.47 0.6371 Prin1 0.000 0.17 0.866 Prin2 0.004 2.89 0.0038*** Prin3 -0.005 -2.66 0.0079*** Industry 1-10 included

107
Table 6 continued Variables Coeff. Est. t value P value
CFTA Intercept -0.067 -2.55 0.011** O 0.016 1.27 0.204 Excess 0.014 0.2 0.8401 Ex_c -0.003 -0.04 0.9658 Diversification 0.004 1.51 0.1313 Size 0.010 6.33 <.0001*** Prin1 -0.0002 -0.1 0.9231 Prin2 0.002 0.84 0.3994 Prin3 -0.002 -0.58 0.5601 Industry 1-10 included
Market-to-book Intercept 1.340 3.77 0.0002*** Own -0.108 -0.68 0.4978 Excess -2.535 -2.78 0.0055*** Ex_c 2.296 2.51 0.0122** Dividend 11.749 7.42 <.0001*** Diversification -0.066 -2.11 0.0349** Leverage 0.083 0.39 0.6954 Accruals 2.074 4.74 <.0001*** CFTA -1.407 -4.17 <.0001*** Grow 0.945 8.51 <.0001*** Size -0.024 -1.17 0.2411 Prin1 0.037 1.76 0.0779* Prin2 0.024 0.99 0.3247 Prin3 0.035 1.06 0.2898 Industry 1-10 included
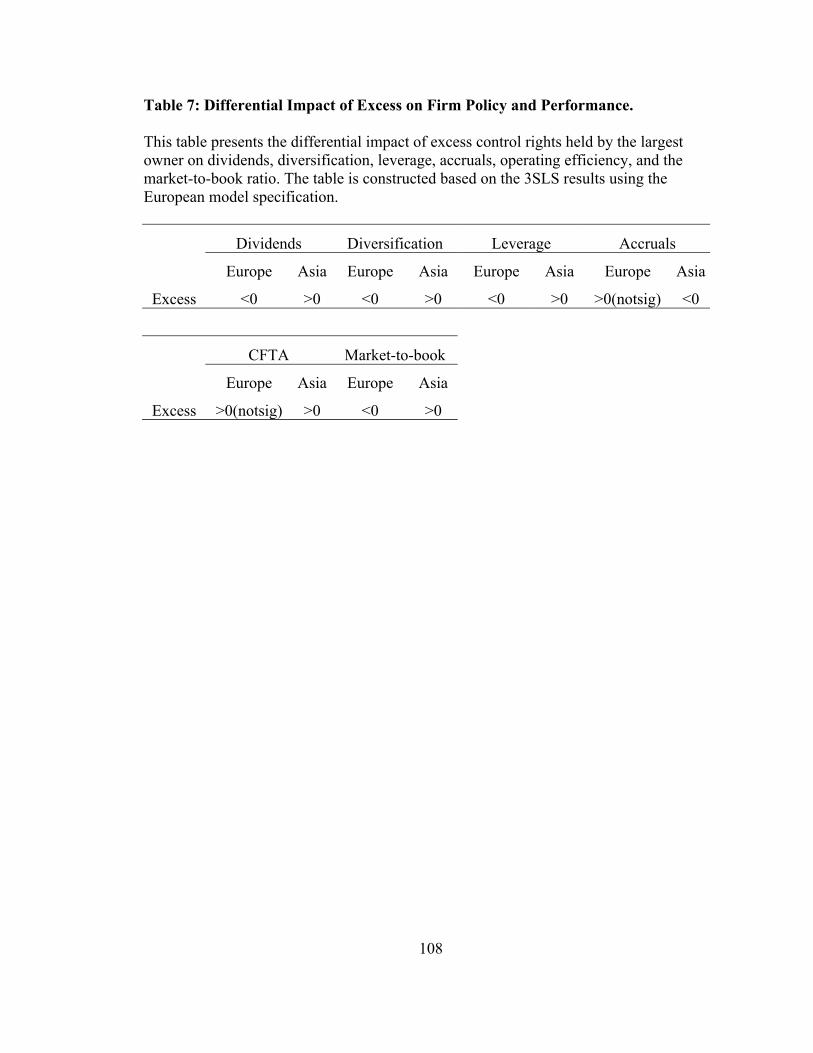
108
Table 7: Differential Impact of Excess on Firm Policy and Performance. This table presents the differential impact of excess control rights held by the largest owner on dividends, diversification, leverage, accruals, operating efficiency, and the market-to-book ratio. The table is constructed based on the 3SLS results using the European model specification.
Dividends Diversification Leverage Accruals
Europe Asia Europe Asia Europe Asia Europe Asia
Excess <0 >0 <0 >0 <0 >0 >0(notsig) <0
CFTA Market-to-book
Europe Asia Europe Asia
Excess >0(notsig) >0 <0 >0

109
Table 8: Stock Markets' Importance in National Economy. (in billions of US $)
Region Country Year 2000 Year 2000 % GDP Stock Market value
North America United States 9,963.1 15,214.6 152.7%
Europe Austria 189.8 29.9 15.8% Belgium 226.6 182.5 80.5% Finland 121.3 293.6 242.1% France 1,294.8 1,446.6 111.7% Germany 1,872.4 1,270.2 67.8% Norway 159.4 65.8 41.3% Portugal 105.1 60.7 57.8% Spain 558.3 504.2 90.3% Sweden 227.3 328.3 144.5% Switzerland 241.2 792.3 328.4% United Kingdom 1,417.6 2,612.2 184.3%
Asia Hong Kong 162.6 623.4 383.4% Indonesia 153.3 26.8 17.5% Korea 457.2 148.4 32.4% Malaysia 89.3 113.2 126.7% Philippines 74.7 25.3 33.8% Taiwan - 247.6 - Thailand 122.2 29.2 23.9%
Source : World Federation of Exchanges Website (Original data is compiled from IMF International Financial Statistics Yearbook 2001).

110
Bibliography
111
Anderson, Ronald C. and David M. Reeb, 2003, Founding-Family Ownership and
Firm Performance: Evidence from the S&P 500, Journal of Finance, Forthcoming.
Backman, Michael, 1999, Asian Eclipse: Exposing the Dark Side of Business in
Asia, Wiley:Singapore.
Bennedsen, Morten and Kasper Nielsen, 2003, The Principle of Proportionality.
Berle, A., Means, G., 1932. The Modern Corporation and Private Property.
MacMillan, New York.
Berger, Philip G. and Eli Ofek, 1995, Diversification’s Effect on Firm Value,
Journal of Financial Economics, 37, 39-65.
Bertrand, Marianne, Paras Mehta, and Sendhil Mullainathan, Ferreting Out
Tunneling: An Application to Indian Business Groups, Massachusetts Institute of
Technology Department of Economics Working Paper 00-28 September 2000.
Bhagat, Sanjai, Richard H. Jefferis Jr., The Econometrics of Corporate
Governance Studies, 2002.
Bhattacharya, Utpal, Hazem Daouk, and Michael Welker, The World Price of
Earnings Opacity EFA 2002 Berlin Meetings Presented Paper.
Bhide, Amar, 1993, The Hidden Costs of Stock Market Liquidity, Journal of
Financial Economics 34 (1), 31-51.
Black, Ervin L. and John J. White, An International Comparison of Income
Statement and Balance Sheet Information: Germany, Japan and the U.S., European
Accounting Review, Vol. 12, No. 1,
Burkart, Michael, Fausto Panunzi, and Andrei Shleifer, 2002, Family firms,
Working paper, Harvard University.
112
Campa, J. Manuel, and Simi Kedia, 2002, Explaining the diversification discount,
Journal of Finance 57, 1731-1762.
Campbell, John, 1996, Understanding Risk and Return, Journal of Political
Economy, 104, 298-345.
Cho, Myeong-Hyeon, 1998, Ownership structure, investment, and the corporate
value: An empirical analysis, Journal of Financial Economics 47, 103-121.
Claessens, S., Simon Djankov, and Larry P.H. Lang, 2000, The Separation of
Ownership and Control in East Asian Corporations. Journal of Financial Economics 58,
81-112.
Claessens, S., Djankov, S., Fan, 2002, Corporate Governance in Asia: A Survey,
International Review of Finance, Volume 3 Issue 2.
Claessens, S., Simon Djankov, Joseph P.H. Fan, and Larry P.H. Lang, December
2002. Disentangling the Incentive and Entrenchment Effects of Large Shareholdings.
Journal of Finance.
Claessens, S., Simon Djankov, Joseph P.H. Fan, and Larry P.H. Lang, 2000,
Corporate Diversification in East Asia: The Role of Ultimate Ownership and Group
Affiliation, World Bank Working Paper.
Cronqvist, Henrik and Mattias Nilsson (2002), Agency Costs of Controlling
Minority Shareholders, Forthcoming Journal of Financial and Quantitative Analysis.
Crutchley, E. Claire, and Robert S. Hansen, 1989, A Test of the Agency Theory
of Managerial Ownership, Corporate Leverage, and Corporate Dividends, Financial
Management, Volume 18, No. 4.
113
Demsetz, Harold, 1986, Corporate Control, Insider Trading, and Rates of Return,
The American Economic Review, Vol. 76, May, Issue 2, 313-316.
Demsetz, Harold and Lehn, Kenneth, 1985, The Structure of Corporate
Ownership: Cause and Consequences, Journal of Political Economy, December, Vol 93,
1155-77.
Demsetz, Harold and Belen Villalonga, 2001,Ownership structure and corporate
performance, Journal of Corporate Finance, Vol. 7, pp. 209-233.
Dechow, P, R. Sloan, and A. Sweeny, 1995, Detecting Earnings Management,
The Accounting Review, Vol. 70, Issue 2, 193-225.
Denis, Diane K., and John J. McConnell, 2002, International Corporate
Governance, Working Paper.
Doidge, C., Andrew Karolyi, and René M. Stulz, Why are Firms Listed in the
U.S. are Worth More?, Forthcoming Journal of Financial Economics 2003.
Dutta, Amitabh S., M. Cary Collins, and James W. Wansley, 2002, An
Examination of the Non-linear Effect of Insider Ownership on Corporate Policy Choices,
The University of Tennessee, Working paper.
Durnve, Art and E. Han Kim, 2002, To Steal or Not to Steal: Firm Attributes,
Legal Environment, and Valuation, Working Paper.
Dyck, Alexander and Luigi Zingales, 2004, Private Benefits of Control: An
International Comparison, Forthcoming, Journal of Finance, Vol 59, 537-600.
Easterbrook, Frank, Two Agency Cost Explanations of Dividends. American
Economic Review, September 1984, 74(4), 650-659.
114
Faccio, Mara, Larry H.P. Lang and Leslie Young, 2001a, Debt and Corporate
Governance, January 10.
Faccio, Mara, Larry H.P. Lang and Leslie Young, 2001b, Dividends and
Expropriation, Forthcoming, American Economic Review.
Faccio, Mara and Larry H.P. Lang, Separation of Ownership from Control: An
Analysis of Ultimate Ownership in Western Europe, Journal of Financial Economics, Sep
2002.
Fama, Eugene, and Michael Jensen, 1983a, The Separation of Ownership from
Control, Journal of Law and Economics, 26: 301-325.
Fama, Eugene, and Michael Jensen, 1983b, Agency Problems and Residual
Claims, Journal of Law and Economics, 26, 327-349.
Fama, Eugene, and Michael Jensen, 1985, Organizational Forms and Investment
Decisions, Journal of Financial Economics 14, 101-119.
Fan, J., and T.J. Wong, Corporate Ownership Structure and the Informativeness
of Accounting Earnings in East Asia, Journal of Accounting and Economics 33 (2002)
401–425.
Garvey, Gerald, T., and Peter L. Swan, 1994, The Economics of Corporate
Governance: Beyond the Marshallian Firm, Journal of Corporate Finance, 139-174.
Gilson, Ronald J., 2000, The Globalization of Corporate Governance:
Convergence of Form or Function, The Center for Law and Economics Studies, Working
Paper No. 174.
Graham, John R., Michael Lemmon, and Jack Wolf, 2002, Does Corporate
Diversification Destroy Value?, Journal of Finance 57, 695-720.
115
Harris, Milton and Artur Raviv, 1988, Corporate Control Contests and Capital
Structure, Journal of Financial Economics 20, 55-86.
Himmelberg, Charles P., R. Glenn Hubbard and Darius Palia, 1999,
Understanding The Determinants Of Managerial Ownership and the Link Between
Ownership and Performance, Journal of Financial Economics 53, 353-384.
James, Harvey, 1999, Owner as Manager, Extended Horizons and the Family
Firm, International Journal of the Economics of Business 6, 41-56.
Jensen, M., Meckling, W., 1976. Theory of the Firm: Managerial Behavior,
Agency Costs, and Ownership Structure. Journal of Financial Economics 11, 5-50.
Jensen, Michael C., 1986, Agency Cost of Free Cash Flow, Corporate Finance,
and Takeovers, American Economic Review, Vol. 76(2), pp.323-329.
Jensen, G. R., D. P. Solberg, and T. S. Zorn, 1992, Simultaneous Determination
of Insider Ownership, Debt, and Dividend Policies, Journal of Financial and Quantitative
Analysis, 27, June, 247-263.
Joh, Sung W., 2003, Corporate Governance and Firm Profitability Evidence from
Korea Before the Economic Crisis. Journal of Financial Economics 68, 287-322.
Johnson, S., La Porta, R., Lopez-de-Silanes, F., Shleifer, A., 2000. Tunneling,
American Economic Review Papers and Proceedings 90, 22-27.
Khanna, Tarun, and Krishna Palepu, 1999, Is Group Affiliation Profitable in
Emerging Markets? An Analysis of Diversified Indian Business Groups, Harvard
Business School working paper.
Lang, Larry H.P. and René M. Stulz, 1994, Tobin’s q, Corporate Diversification,
and Firm Performance, Journal of Political Economy102, 1248-1280.
116
La Porta, R., Lopez-de-Silanes, F., Shleifer, A., Vishny, R. W., 1997. Legal
Determinants of External Finance. Journal of Finance 52, 1131-1150.
La Porta, R., Lopez-de-Silanes, F., Shleifer, A., 1999. Corporate Ownership
Around the World. Journal of Finance 54, 471-518.
La Porta, Rafael, Florencio Lopez-de-Silanes, Andrei Shleifer, and Robert W.
Vishny, Law and Finance. Journal of Political Economy, December 1998, 106(6),
pp.1113-1155.
La Porta, Rafael, Florencio Lopez-de-Silanes, Andrei Shleifer, and Robert W.
Vishny, 2000, Agency Problems and Dividend Policies Around the World, Journal of
Finance, Vol 55, No. 1, 1-55.
La Porta, Rafael, Florencio Lopez-de-Silanes, Andrei Shleifer, and Robert W.
Vishny, 2002. Investor Protection and Corporate Valuation. Journal of Finance, Vol. 57,
1147-1170.
Lemmon, M., Lins, K., 2003. Ownership Structure, Corporate Governance, and
Firm Value: Evidence from the East Asian Financial Crisis. The Journal of Finance.
Lins,K. V., 2002, Equity Onwership and Firm Value in Emerging markets.
Working Paper.
Lins, K., Servaes, H., 1999a. International Evidence on the Value of Corporate
Diversification. Journal of Finance 54, 2215-2239.
Leuz, C., Dhananjay Nanda, and Peter D. Wysocki, Earnings Management and
Investor Protection: An International Comparison, Forthcoming Journal of Financial
Economics 2003.
117
Miller, Merton H., K. Rock, 1985, Dividend Policy under Asymmetric
Information, Journal of Finance, Vol. 40, September, 1031-1052.
Mitton, Todd, 2002, A Cross-firm Analysis of the Impact of Corporate
Governance on the East Asian Financial Crisis. Journal of Financial Economics 64, 215-
241.
Morck, R., A. Shleifer and R. Vishny, 1988, Management Ownership and Market
Valuation: An Empirical Analysis, Journal of Financial Economics, Vol. 20, 293-315.
Palepu, Krishna, Tarun Khanna, and Joseph Kogan, 2002, Globalization and
Similarities in Corporate Governance: A Cross-country Analysis, Harvard University
Working Paper No. 02-31.
Pearce, S.C., 1965. Biological Statistics: An Introduction, p. 180-196. McGraw-
Hill, New York.
Rajan, Raghuram G., and Luigi Zingales, 1995, What Do I Know about Capital
Structure? Some Evidence from International Data, Journal of Finance, 50: 1421-1460.
Ross, 1977, The Determination of Financial Structure: The Incentive Signalling
Approach Bell Journal of Economics 8:23-40
Shleifer, Andrei and Robert Vishny, 1986, Large Shareholders and Corporate
Control, Journal of Political Economy, 94: 461-488.
Shleifer, Andrei and Robert Vishny, 1997, A Survey of Corporate Governance,
Journal of Finance, Volume 52, June 1997, 737-783.
Shleifer, Andrei and Daniel Wolfenzon, 2002, Investor Protection and Equity
Markets, Journal of Financial Economics, forthcoming.
118
Stein, Jeremy, 1989, Efficient Capital Markets, Inefficient Firms: A Model of
Myopic Corporate Behavior, Quarterly Journal of Economics 103, 655-669.
Stulz, René M., 1988, Managerial Control of Voting Rights: Financial Policies
and the Market for Corporate Control, Journal of Financial Economics, 20: 25-54.
Villalonga, Belen, 2004, Diversification Discount or Premium? New Evidence
from the Business Information Tracking Series, Journal of Finance, Vol. 59, 479-506.
Warfield, T.D., J.J. Wild and K.L. Wild (1995), Managerial Ownership,
Accounting Choices, and Informativeness of Earnings, Journal of Accounting and
Economics, Vol. 20, pp. 61-91.
Yeo, G. H. H., Patricia M.S. Tan, Kim W. H. and Sheng-Syan Chen, 2002,
Corporate Ownership Structure and the Informativeness of Earnings, Journal of Business
Finance and Accounting, 29 (7) & (8), September/October.
119
Vita
Rongrong Zhang was born in Shanghai, the People’s Republic of China on
January 4, 1975. She graduated from Hefei No. 1 High School in July 1993. She received
her Bachelor of Engineering degree in Industrial Foreign Trade from Hefei University of
Technology in July 1997. She began her graduate study at the University of Tennessee in
August 1998, where in May 2000 she received a Master of Science in Management
Science. From August 2000 to August 2004, she worked on her doctoral degree in
Business Administration with a concentration in finance in the College of Business
Administration at the University of Tennessee, Knoxville. She earned the Doctor of
Philosophy degree in August 2004.


![CONCENTRATED OWNERSHIP REVISITED: THE IDIOSYNCRATIC … · Corporate Ownership Around the World, 54 J. FIN. 471 (1999) [hereinafter LLSV, Corporate Ownership] (finding that, after](https://img.dokumen.tips/doc/110x75/5fd04ad6774f19056811e65a/concentrated-ownership-revisited-the-idiosyncratic-corporate-ownership-around-the.jpg)