Embed Size (px)
Citation preview


The Behavioural Insights Team / Gambling bank transaction analysis, Part 1 - Monzo 1
Contents
Contents 1
List of tables and figures 2
1. Executive summary 4
2. Project background 9 2.1 Background 10 2.2 The remainder of this report 13
3. What did we do, and how did we do it? 1 5 3.1 Our approach to working with banks 1 5 3.2 The data, and how we analysed it 1 6 3.3 Our research questions 2 1
4. Theme 1 — Who gambles, how much do they gamble, and when? 2 2 4.1 What are the socio-economic characteristics of our sample? 2 2 4.2 How often do those in our sample gamble, and how much? 2 4 4.3 Are there any daily, weekly, or monthly trends in gambling behaviour in our sample? 2 6 4.4 Characteristic profiles — What Theme 1 tells us about sampled Monzo customers
30
5. Theme 2 — How is gambling related to everyday spending? 3 1 5.1 How does spending in everyday categories vary with gambling behaviour? 3 1 5.2 Characteristic profiles — what Theme 2 tells us about sampled Monzo customers
3 4
6. Theme 3 — How is gambling related to savings behaviour? 3 5 6.1 Are gamblers more or less likely to use savings pots compared to non-gamblers?
3 5 6.2 Are there differences in gamblers’ saving behaviour compared to non-gamblers? 3 6 6.3 Characteristic profiles — What Theme 3 tells us about sampled Monzo customers
3 9
7. Theme 4 — How do people make use of gambling block functions? 40 7.1 Who uses gambling blocks? 40 7.2 How do gamblers use gambling blocks? 4 2 7.3 Does cash use increase when a gambling block is active? 4 6 7.4 Characteristic profiles — What Theme 4 tells us about Monzo customers 4 7
8. Conclusion and cross-cutting themes 4 8
Appendi ces 5 1

The Behavioural Insights Team / Gambling bank transaction analysis, Part 1 - Monzo 2
List of tables and figures
List of tables
1.1: Characteristic profiles constructed using Monzo customer transaction data.
7
2.1: Different approaches to studying gambling behaviour. 9
3.2.1: Sample of customers in the Monzo dataset used in our analysis. 20
3.3.1: Research themes, and questions guiding the research. 21
4.1.1: Demographic features of our sample of Monzo customers, by customer segment.
22
4.2.1: Average gambling spend (£) and number of transactions for gamblers in our Monzo sample.
25
4.4.1: Characteristic profiles - what Theme 1 tells us. 30
5.1.1: Average monthly spend across categories by customer segment. 31
5.1.2: Average monthly spend in gambling and non-gambling categories across months with, and without gambling.
33
5.2.1: Characteristic profiles - what Theme 2 tells us. 34
6.1.1: Proportion of customers who have used internal and external savings pots, by customer segment.
36
6.2.1: Average monthly balance and transfers in customers’ current accounts and savings pots, by customer segment.
37
6.3.1: Characteristic profiles - what Theme 3 tells us. 39
7.1.1: Demographic features of our sample of Monzo customers, by gambling block use.
41
7.2.1: Gambling block use amongst Monzo customers. 43
7.2.2 Average daily gambling spend and number of gambling transactions in the week before and in the week after customers first activate their gambling block.
44
7.3.1: Average daily ATM spend and number of transactions in the week before and in the week after customers first activate their gambling block.
46
7.4.1: Characteristic profiles - what Theme 4 tells us. 47

The Behavioural Insights Team / Gambling bank transaction analysis, Part 1 - Monzo 3
List of figures
3.2.1: Number of Monzo customers for whom we have daily transaction records over time.
18
3.2.2: Average monthly gambling deposits across the sample of Monzo customers by segment (excluding non-gamblers).
20
4.1.1: Age distribution of our sample of Monzo customers by segment. 24
4.3.1: Monthly deposits and number of transactions per gambler across months on record.
27
4.3.2: Monthly per gambler spend in gambling and non-gambling categories.
27
4.3.3: Average per gambler spend and number of transactions across days in a month.
28
4.3.4: Average per gambler spend and number of transactions across days in a week.
29
5.1.1: Average monthly spend across categories by customer segment. 32

The Behavioural Insights Team / Gambling bank transaction analysis, Part 1 - Monzo 4
1. Executive summary
Gambling is an industry worth over £14bn in the year to March 2020, making the British gambling market one of the world’s largest. 1 Over the previous four weeks, as many as 47% of people in Britain have engaged in some form of gambling — from buying a lottery ticket, to placing a sports bet, to visiting a casino. 2 The scale of the gambling industry in Britain, and prevalence of people who gamble in the population, have heightened calls from gambling researchers, public sector bodies, and third sector policy groups for more to be done to mitigate gambling harms. 3
Much existing research about gambling in Britain and gamblers’ behaviours comes from survey data and qualitative research. This can be incredibly useful, but has several limitations, such as underreporting of activity and inaccurate recall. On the other hand, real-world behavioural datasets remain largely inaccessible to researchers, despite their potential to further understanding of individual experiences and patterns of play.
GambleAware’s Patterns of Play programme of research is a wide-ranging endeavour to use behavioural datasets to build a more accurate picture of the varied ways in which people gamble, and the possible impact it has on them. As part of this programme, bank transaction data was identified as offering the potential for richer information about gambling behaviour and new insights into tackling gambling harms.
Our findings shine a light on several aspects of gambling behaviours not previously seen or explored in relation to patterns of play. This report summarises our analysis of and insights from bank transaction data, the advantages of using such data, and its limitations.
1 Gambling Commission. (2020). Industry Statistics covering April 2019 - March 2020. Available from: https://www.gamblingcommission.gov.uk/news-action-and-statistics/Statistics-and-research/Statistics/ Industry-statistics.aspx 2 Gambling Commission. (2020). Gambling participation in 2019: behaviour, awareness and attitudes. Annual report. Available from: https://www.gamblingcommission.gov.uk/PDF/survey-data/Gambling-participation-in-2019-behaviour- awareness-and-attitudes.pdf 3 See for example, National Audit Office. (2020). Gambling regulation: problem gambling and protecting vulnerable people. Available from: https://www.nao.org.uk/wp-content/uploads/2020/02/Gambling-regulation-problem-gambling-and-prot ecting-vulnerable-people.pdf and See for example, House of Lords Select Committee on the Social and Economic Impact of the Gambling Industry. (2020). Gambling harm - Time for action. Available from: https://publications.parliament.uk/pa/ld5801/ldselect/ldgamb/79/79.pdf
The findings of this project will be delivered in two parts, one for each of the two bank partners involved. Here, in Part 1, we detail our work with Monzo. Part 2 of this report - published in parallel - details our work with HSBC UK.

The Behavioural Insights Team / Gambling bank transaction analysis, Part 1 - Monzo 5
Project Background ( Chapter 2 ) The project aims to better understand the kinds of financial impacts experienced by customers who gamble, and to shed new light on what bank transaction data can, and can’t, tell us about gambling behaviour. To this end, we explored four research themes using the data provided to us by Monzo:
1. Who gambles, how much do they gamble, and how often? 2. How is gambling related to other spending? 3. How is gambling related to saving behaviour? 4. How do people make use of gambling block functions?
What did we do and how did we do it? ( Chapter 3 ) Monzo is a so-called ‘challenger bank’ (relatively new to market) and one of the first digital-only banks in the UK. It had 4.3 million customers as of June 2020.
The anonymised data that they shared with us included:
1. Daily transaction records for 10,000 customers, spanning an average of 10 months’
worth of data per customer; 2. Demographic information on age and postcode (first three postcode characters); 3. Gambling block activity over time.
All of the data was anonymised, and shared in line with governing regulations. The socio-demographic makeup of the sample indicated that the average customer captured in this data:
- was 39 years old (40% of the sample was aged 30 – 40); - lived in an urban location (36% lived in London); - had an account balance of £193.
We identified any customer who made at least one gambling-related transaction during the observation period provided in the data, covering May 2018 – November 2019. This amounted to 11% of the total customers on record. In comparison, the Gambling Commission’s most recent participation figures found that 21% of respondents reported gambling online in the past four weeks. 4
For the purpose of our analyses, we categorised customers into three groups: non-gamblers, below-average gamblers, and above-average gamblers. The latter two categories were identified by taking those that deposited either below, or at/above the within sample monthly gambling average (average spend for all gamblers was £136). Throughout this report we consider ‘spend’ in terms of card-based deposits with gambling operators. Withdrawal of funds from operators, including winnings, could not be easily
4 Gambling Commission. (2020) Gambling participation in 2019: behaviour, awareness and attitudes. Available from: https://www.gamblingcommission.gov.uk/PDF/survey-data/Gambling-participation-in-2019-behaviour- awareness-and-attitudes-superseded.pdf

The Behavioural Insights Team / Gambling bank transaction analysis, Part 1 - Monzo 6
identified and factored into our analysis. All three groups shared similar sociodemographic characteristics (see Table 1.2). These groups were used to compare patterns of play across four research themes, each of which investigated a different set of research questions.
Our key findings
Theme 1 - Who gambles, how much do they gamble, and how? ( Chapter 4 ) On average, gamblers made approximately five gambling transactions a month and spent around £22 per gambling transaction.
Above-average gamblers’ monthly gambling deposits were 38 times higher than below average gamblers (£684 per month vs. £18 per month), and their gambling transactions were almost four times bigger (average of £55 per transaction vs. £15 per transaction). These findings are in part reflective of a relatively small number of very high spenders in our sample.
Above-average gamblers also spent more frequently on gambling than below-average gamblers . They averaged almost one gambling transaction per day compared to below-average gamblers’ average of just over one per month. For all gamblers, gambling activity tended to increase (number of transactions, daily spend) from Thursday – Saturday of each week.
Theme 2 - How is gambling related to everyday spending? ( Chapter 5 ) Above-average gamblers total monthly spend from their Monzo account (gambling plus any other spending) was four times higher (£1370) than that of non-gamblers (£325), while gambling transactions accounted for almost exactly 50% of above-average gamblers monthly spend, and only 3% for below-average customers. Above-average gamblers also spent considerably more than below-average gamblers on entertainment (£361 vs. £48) and ATM withdrawals (£151 vs. £74). We were unable to conduct income analyses for Monzo customers, as income data was unavailable for the majority of sampled customers.
Theme 3 - How is gambling related to savings behaviour? ( Chapter 6 ) Below-average gamblers contributed 42 times as much money into an external savings pot (interest-earning) than they spent on gambling. This ratio was considerably smaller — 0.1 — for above average gamblers. Gamblers were more likely than non-gamblers to use Monzo’s internal savings pots function (non-interest earning), however gamblers tended to have a lower internal savings pot balance (£168 vs. £208). Gamblers moved less money on average to their internal pots compared to non-gamblers (£21 per month vs. £27 per month).
Theme 4 - How do people make use of gambling block functions? ( Chapter 7 ) The data showed that a third of above-average gamblers lifted the gambling block for longer than 30 days, compared to a quarter of below-average gamblers. During the week before gamblers activated the block, their average daily gambling spend tripled, from an average of £6.90 to £22.90.

The Behavioural Insights Team / Gambling bank transaction analysis, Part 1 - Monzo 7
Our findings deliver a rich set of insights into the financial behaviour of the sampled customers, summarised below in the form of characteristic profiles.
Table 1.1 Characteristic profiles constructed using Monzo customer transaction data
Profile 1 Non-gamblers
(89% of sample, n = 8380)
Profile 2 Below-average gamblers (9% of sample, n = 848)
Profile 3 Above-average gamblers (2% of sample, n = 182)
Theme 1: Gambling behaviour
●Does not gamble ●Gambling deposits of £18 per month ●Gambles on 3% of days, 27% of
months ●Typically around 1 gambling
transaction per month
●Gambling deposits of £684 per month ●Gambles on 22% of days, 68% of
months ●Typically around 1 gambling
transaction per day
Theme 2: Spending behaviour
●Typically spends £325 per month across 9 major categories
●Highest spend categories are groceries (£49), eating out (£45), shopping (£43)
●Typically spends £601 per month across 9 major categories (incl. gambling)
●Highest spend categories are shopping (£77), groceries (£75), eating out (£76)
●Spends around £30 per month more than non-gamblers on entertainment, groceries, and shopping
●Non-gambling spending is £160 higher in months with gambling vs. without
●Typically spends £1,370 per month across 9 major categories (incl. gambling)
●Highest spend categories are gambling (£684), entertainment (£361), ATM cash withdrawals (£151)
●Similar average monthly spend on groceries, shopping vs. below-average gamblers
●6x higher average monthly spend on entertainment vs. below-average gamblers
●Non-gambling spending £712 higher in months with gambling vs. without
Theme 3: Savings behaviour
●37% have opened an internal savings pot, 6% have opened an external pot
●Average of £208 in internal savings pots, and £1088 in external pots
●Saves an average of £27 per month into internal savings pots, and £208 per month into external pots (42% of total monthly account outgoings)
●59% have opened an internal savings pots, 9% have opened an external pot
●Average of £168 in internal savings pots, and £627 in external pots
●Saves an average of £22 per month into internal savings pots, and £91 per month into external pots (16% of total monthly account outgoings)
●59% have opened an internal savings pot, 6% have opened an external pot
●Average of £169 in internal savings pots, and £68 in external pots
●Saves an average of £14 per month into internal savings pots, and £68 per month into external pots (5.6% of total monthly account outgoings)
Theme 4: Use of gambling block
●91% of those who enabled the block at least once were non-gamblers
●Enable the block for an average of 72% of days
●1% of block users in this group have subsequently lifted the block at least once
●2% of those who enabled the block at least once were below-average gamblers
●Enabled the block for an average of 45% of days
●33% of block users in this group have lifted the block at least once
●7% of those who enabled the block at least once were above-average gamblers
●Enabled the block for an average of 34% of days
●46% have gambled on the days of enabling the block

The Behavioural Insights Team / Gambling bank transaction analysis, Part 1 - Monzo 8
Conclusion and cross-cutting themes ( Chapter 8 ) Our research demonstrates the potential value, and feasibility of using bank data to generate a holistic picture of the financial lives and patterns of play of people who gamble compared to those who do not. This study should be seen as an initial step from which several cross-cutting ideas and questions emerge. For instance, customers may benefit from more tailored controls on their gambling spend, gambling spend could be leveraged to encourage saving behaviour, and there is scope to test the impact of friction and flexibility in turning off gambling blocks. There are also opportunities for banks themselves to use their transaction data as a basis for developing and testing new features to identify and help to mitigate gambling harms.
This feasibility study suggests that bank transaction data has strong potential as a source of research information but data from a single bank is unlikely to offer a full picture.
Our findings, and indeed the constraints we faced, stand to benefit from further research and testing, as does the role that financial services can take to protect and support people who gamble.
●25% have gambled on the day of enabling the block
●Gambling spend in the week prior to enabling the block was six times higher than average
●Average daily gambling spend went from £13 in the week before enabling the block to £0 in the week following
●Gambling spend in the week prior to enabling the block was three times higher than average
●Average daily gambling spend went from £70 in the week before enabling the block to £4 in the week after

The Behavioural Insights Team / Gambling bank transaction analysis, Part 1 - Monzo 9
2. Project background
A benefit of investigating gambling through the lens of bank transaction data is the potential for a more holistic and objective perspective on gambling behaviour compared to other methods such as self-report surveys, or data from a single gambling operator. While gambling operator data, for instance, can provide an in-depth account of someone’s interaction on their platform, it does not tell us anything about that person’s financial status or the frequency of their gambling behaviours across multiple operator accounts.
Table 2.1: Different approaches to studying gambling behaviour
Given the great potential of bank transaction data, our project set out to explore the extent to which we could use it to provide insights into questions such as:
● how the frequency and amount of money spent on gambling is associated with
other categories of spending; ● whether there are identifiable trends in gambling behaviour over a week, month, or
year, for example; and ● how gambling spend might differ before and after someone enacts a feature such
as a gambling block.
We also took a data-driven approach to distinguishing between different kinds of gamblers — our approach to which is outlined in this chapter.
This work can be used to develop guidance for banks on how they can proactively consider the impact of gambling on their customers, and consider who needs support and
What we see What we can learn Limitations
Self-report survey Ask people about how often they gamble, and how much they spend as well as how they think and feel about gambling
The overall prevalence of particular behaviours specifically asked about as well as attitudes and beliefs
May not provide a true and accurate reflection of actual behaviour
Online gambling operator account data
See the frequency, and amount of deposits made on an individual account, time spent gambling, types of gambling and use of safer gambling tools
A clear picture of how much someone spends, wins and loses on a specific gambling site
People who gamble online typically have multiple accounts across various operators, meaning we may see only part of the picture
Bank transaction data
See a full array of deposits made across multiple online operators, broader financial status, spending, and use of credit
A fuller total picture of what people spend gambling, and how this relates to other aspects of their finances
People may have multiple bank accounts, or use other electronic payment methods to gamble (such as e-wallets); cash gambling will also be missed

The Behavioural Insights Team / Gambling bank transaction analysis, Part 1 - Monzo 10
when, and aligns with the Gambling Commission’s 2019 three-year National Strategy to Reduce Gambling Harms, which calls for much wider collaboration between stakeholders, including banks. 5
2.1 Background 2.1.1: While we know about the prevalence of gambling in the Britain, there’s little primary evidence on gambling behaviours
Britain is home to the largest regulated gambling market in the world. 6 The industry produced a gross gambling yield — that is, gross profits after payouts — of £14.2bn in the year to March 2020, with online gambling accounting for over a third of this. 7 Around 47% of British people have gambled in any form in the past four weeks. Even excluding those who only played the National Lottery (the most prevalent form of gambling), about 1 in 3 people gambled (32%). 8
In Great Britain, there are an estimated 400,000 ‘problem’ gamblers who can “experience more extreme consequences from gambling, including a possible loss of control of their gambling activity”. 9 Great Britain’s gambling regulator, the Gambling Commission, estimates that there are a further 1.8 million ‘at-risk’ gamblers — those showing some signs of problematic behaviour, but below the threshold for ‘problem’ gambling. 10
5 https://www.reducinggamblingharms.org/ 6 Edison investment research. (2019). Online gaming sector: diversification and scale for online success. Available from: https://www.edisongroup.com/wp-content/uploads/2019/07/GamingSectorReport2019-1.pdf 7 Gambling Commission. (2020). Industry Statistics covering April 2019 - March 2020. Available from: https://www.gamblingcommission.gov.uk/news-action-and-statistics/Statistics-and-research/Statistics/ Industry-statistics.aspx 8 Gambling Commission. (2020). Gambling participation in 2019: behaviour, awareness and attitudes. Annual report. Available from: https://www.gamblingcommission.gov.uk/PDF/survey-data/Gambling-participation-in-2019-behaviour- awareness-and-attitudes.pdf 9 The figure reported by the National Audit Office is a combination of adult and young person (11- 16) estimates. National Audit Office. (2020). Gambling regulation: problem gambling and protecting vulnerable people. Available from: https://www.nao.org.uk/wp-content/uploads/2020/02/Gambling-regulation-problem-gambling-and-prot ecting-vulnerable-people.pdf Gambling Commission. (2019). Young People Gambling Report 2019. Available from: https://www.gamblingcommission.gov.uk/PDF/Young-People-Gambling-Report-2019.pdf 10 At-risk gamblers are those who score 1 or more on the Problem Gambling Severity Index, a widely-used measure capturing key indicators of pathological gambling. Quoted statistic from the National Audit Office. (2020). Gambling regulation: problem gambling and protecting vulnerable people. Available from: https://www.nao.org.uk/wp-content/uploads/2020/02/Gambling-regulation-problem-gambling-and-prot ecting-vulnerable-people.pdf

The Behavioural Insights Team / Gambling bank transaction analysis, Part 1 - Monzo 11
Despite the prevalence of gambling in Britain, and the various harmful effects problem gambling can have, there is a lack of objective data about the behaviours and characteristics of British gamblers. In particular, most existing research on the extent of gambling in Britain and gamblers’ behaviours comes from survey self-report data. Such data suffers from two major shortcomings:
1) Social desirability bias : as gambling is often associated with shame and social stigma, gamblers may underreport their behaviours to avoid negative appearances. 16
11 Guardian. (2020, April). Impose strict curbs on gamling during COVID-19 lockdown, MPs urge. 12 Betting and Gaming Council. (2020, April). BGC members to remove TV and radio gaming advertising during COVID-19 lockdown . 13 Betting and Gaming Council. (2020, March). Ten safer gambling pledges for the COVID-19 pandemic. 14 Gambling Commission. (2020). Covid-19 and its impact on gambling — what we know so far [Updated July 2020]. Available from: https://www.gamblingcommission.gov.uk/news-action-and-statistics/Statistics-and-research/Covid-19 -research/Covid-19-updated-July-2020/Covid-19-and-its-impact-on-gambling-%E2%80%93-what-we- know-so-far-July-2020.aspx 15 Gambling Commission. (2020) Gambling business data on gambling during Covid-19 [Updated September 2020]. Available from: https://www.gamblingcommission.gov.uk/news-action-and-statistics/Statistics-and-research/Covid-19 -research/Covid-19-updated-September-2020/Gambling-business-data-on-gambling-during-Covid-19 -updated-September-2020.aspx 16 Goldstein, A. L., Vilhena-Churchill, N., Munroe, M., Stewart, S. H., Flett, G. L., & Hoaken, P. N. (2016). Understanding the effects of social desirability on gambling self-reports. International Journal of Mental Health and Addiction , 15(6), 1342-1359.
Gambling and the COVID-19 pandemic lockdown
Isolation, more downtime, and the ease-of-access to online gambling have led to calls, including from several MPs, for stronger constraints on gambling adverts, and stakes during the COVID-19 lockdown. 11 In March 2020, the Betting and Gaming Council announced a 10-pledge COVID-19 action plan for safer gambling during the crisis, followed by a periodic ban on TV and radio advertising, and active promotion of deposit limits 12 13 During the lockdown, the Gambling Commission required all major online operators to submit additional data, and ran public surveys to gauge changes in gambling behaviour. It made the following initial observations in July 2020:
● Both surveys and operator data suggest that the lockdown may not have attracted
many new consumers to gambling. ● The lockdown has, however, prompted some people who were gambling already to
try new products. ● Of those who participated in three or more gambling activities in the last four
weeks, a majority claim to be spending more time or money on at least one product. 14
The Gambling Commission continues to update and report data on gambling during COVID-19. 15

The Behavioural Insights Team / Gambling bank transaction analysis, Part 1 - Monzo 12
2) Inaccurate recalling of behaviours and outcomes: for example, in one study, when retrospective estimates of past gambling outcomes were compared with actual data, 34% – 40% of players overestimated their wins or underestimated losses. 17
These issues can lead to underestimating the true prevalence of gambling and, importantly, how gambling really impacts people’s financial lives.
2.1.2: Bank transaction data gives a more objective picture of gambling behaviour and financial circumstances
While issues of recall or social desirability bias might limit survey-type approaches to studying gambling behaviour, the alternative approach of studying gambling behaviour data directly is not straightforward. Online gamblers, for example, hold accounts with three different operators on average. Without being able to ‘join up’ a gambler’s behaviours across all outlets, it isn’t possible to obtain a full picture of their gambling tendencies. 18
Prevalence surveys show that the majority of people who gamble (which is almost half of British adults) are considered ‘non-’ or ‘low-risk’ gamblers but we know very little about how gambling fits within their overall financial behaviour. 19 M any British people, including those who don’t gamble as frequently, experience precarious financial situations: as many as 40% of people have less than £100 in available savings, and about 17% of people carry problem debt. 20
Further, ‘problem gamblers’ are three times more likely to be in debt than non-gamblers, and 34% of ‘problem gamblers’ experience severe financial difficulty compared to 23% of moderate-risk gamblers, and 10% of non-gamblers. 21 Some of the more everyday financial impacts experienced by ‘problem gamblers’ include lower savings, and having less to spend on everyday n ecessities. 22 However, these kinds of insights have typically been derived from self-report studies, meaning they rely on respondents giving a true and accurate reflection of their situation.
17 Braverman, J., Tom, M. A., & Shaffer, H. J. (2014). Accuracy of self-reported versus actual online gambling wins and losses. Psychological Assessment , 26(3), 865-877 18Gambling Commission. (2020). Gambling participation in 2019: behaviour, awareness and attitudes. Annual report. Available from: https://www.gamblingcommission.gov.uk/PDF/survey-data/Gambling-participation-in-2019-behaviour- awareness-and-attitudes.pdf 19 N.B. The terms ‘low-risk’, ‘at-risk’ and ‘problem’ gambler stem from the Problem Gambling Severity Index (PGSI), which measures the degree to which a respondent experiences negative consequences as a result of gambling. 20 Money Advice Service. (2016). Low savings levels puts millions at financial risk. ‘Problem debt’ means that someone owes more each month than they can afford to repay. 21 Wardle, H., Seabury, C., Ahmed, H., Payne, C., Byron, C., Corbett, J., & Sutton, R. (2014). Gambling behaviour in England and Scotland: findings from the Health Survey for England 2012 and Scottish Health Survey 2012. Available from: https://www.gamblingcommission.gov.uk/PDF/survey-data/Gambling-behaviour-in-England-and-Scotl and-Findings-from-the-Health-Survey-for-England-2012-and-Scottish-Health-Survey-2012.pdf 22 Shannon, K., Anjoul, F., & Blaszczynski, A. (2017). Mapping the proportional distribution of gambling-related harms in a clinical and community sample. International Gambling Studies , 17(3), 366-385.

The Behavioural Insights Team / Gambling bank transaction analysis, Part 1 - Monzo 13
Bank transaction data holds the potential to overcome some aspects of these problems — banks have sight of when, where, how frequently, and how much people spend on online gambling, and customer data is not subject to social scrutiny, or poor recall. Differential impacts across different types of gamblers can be examined (that is, not just ‘at-risk’ or ‘problem’ gamblers) and phenomena can be studied in context. For instance, we can observe such things as how gambling behaviour fluctuates around payday; the impacts of gambling block functions; and how gambling spend relates to other forms of spending.
2.1.3: Using bank transaction data, we created characteristic gambler profiles that capture the differential impacts of gambling
A core objective of the project was to utilise the insights we gain from bank transaction data to build archetypal ‘portraits’ of customers in our constructed sample: their financial lives, and how gambling affects them. Building these ‘portraits’ based on bank transaction data, we aim to overcome some of the shortcomings with data reliability outlined earlier. In particular, observing data on gambling transactions directly from banks’ records will mitigate the biases related to self-report surveys. We will also be able to explore broader impacts of gambling on people’s savings and consumption behaviours.
2.1.4: We worked with two banks to try and address some of the limitations of bank transaction data
Bank transaction data is not a perfectly reliable source of information. We recruited two different banking partners to try mitigate some of the following:
● Results may differ between banks because the characteristics of customers differ. For example, a digital-only bank like Monzo may have younger customers than HSBC UK.
● The insights we can gain from the data depend on the tools and features offered by a bank. For example, Monzo’s division of all outgoing transactions into spending categories allows it to look at other types of spending associated with problem gambling.
● The way customers use their account restricts the patterns we can identify. For example, many Monzo customers do not use their Monzo account to receive their salaries, limiting our ability to detect the effects of payday on gambling behaviour.
2.2 The remainder of this report
The remainder of this report is structured as follows:
● Chapter 3 details what we did, and how , giving an overview of how we approached working with banks for a project of this nature, and of the exact transaction data provided to us by Monzo. This chapter also covers our key research questions, categorised into the four major themes.
● Chapters 4 – 7 present our findings across each of our four research themes. Here you will find various tables, figures, and graphs detailing the data, and summary tables highlighting key findings and observations across each of the characteristic gambler profiles.

The Behavioural Insights Team / Gambling bank transaction analysis, Part 1 - Monzo 14
● Chapter 8 summarises the key insights gained across each of our four major research themes, commenting on outstanding questions for future research.

The Behavioural Insights Team / Gambling bank transaction analysis, Part 1 - Monzo 15
3. What did we do, and how did we do it?
In this Part 1 report we detail the findings of our analyses of Monzo customer data. Part 2 of this report — forthcoming in 2021 — will detail our findings based on HSBC UK customer data.
Monzo is a so-called ‘challenger bank’ (newer to market) and one of the first digital-only banks in the UK, with 4.3 million customers as of June 2020. 23 They were the first bank in the UK to introduce a gambling block — a form of self-exclusion tool to block transactions related to gambling. 24
3.1 Our approach to working with banks Transaction data has the potential to provide insight into where, when, and how much people spend on gambling; the use of credit around gambling; and how consumers might be using financial tools, such as gambling blocks, to limit risky behaviours around gambling.
Banks must, however, protect their customers’ identifying data. A challenge for this project was therefore how we could best partner with interested banks while remaining fully compliant with data privacy requirements. To that end, we offered various ways that banks could partner with BIT on this project:
A) Bank shares requested anonymised data with BIT (preferred option)
● Data sharing agreements and data processing agreements must be developed and co-signed
● Considerable security and risk assessment checks needed ● Access to secure file transfer service required
B) BIT analyst works on the bank premises to access data
● Mitigates need for data sharing agreements, and data processing agreements
● Requires a secondment agreement between the partners ● Requires secondee who is able to work with the analytical software that the
bank’s own analysts use
C) BIT shares an analysis plan allowing bank’s own analysts to conduct the work internally
● BIT analysts do not at any point access any primary data ● Bank shares the output of the analyses with BIT ● Recommended to set up a formal agreement (e.g. Memorandum of
Understanding) to establish expectations
23 Number from Monzo’s official website 24 Monzo. (2018). How to block gambling spending from your Monzo account.

The Behavioural Insights Team / Gambling bank transaction analysis, Part 1 - Monzo 16
We partnered with Monzo on the basis of option A.
3.2 The data, and how we analysed it We approached each bank with a detailed analysis plan that listed specific variables, outcomes, and other data characteristics suited to the research questions we aimed to answer (see Section 3.3. for more on those questions).
We recommended a) compiling data that covered at least one year’s worth of transactions, but preferably covering up to five; and b) including a minimum of 10,000 customers in the data. We also gave specific directions around particular types of data to compile, such as common everyday spending categories.
As expected, both banking partners were able to meet our specifications to different degrees and, as a result, the final data made available by each bank differs in terms of scope, depth, and specificity. The types of customers served by each bank are also expected to be very different. Digital-only banks like Monzo, for example, are typically preferred by younger people. 25 Additionally, only around 12% of the UK population has made a digital-only bank account their primary account, that is the account into which their salary or wages are paid. Almost half of digital bank account users keep less than £1000 in these accounts. 26 We were therefore unable to use the data provided by Monzo to address research questions around income or overdraft use.
For this reason, we opted to present the findings of our analyses separately for each bank, and across two individual reports.
3.2.1. Overview of data received from Monzo
The anonymised data we received from Monzo had three key components:
1. Daily transaction records for 10,000 customers. 2. Demographic information on age (in 10-year tranches) and postcode area (first
three digits). 3. Gambling block activity over time.
Note that by ‘transactions’ we mean card-based transactions — debit card transactions specifically — involving deposits to online gambling sites. The data did not capture cash transactions at gambling venues, for example, nor digital transactions to gambling sites made using third party digital ‘wallets’ such as Paypal or Skrill . It is possible that people who use cash to gamble behave differently, or differ in profile, and as such we must accept that our sample will not reflect every type of gambler.
Our methodological choices were in part informed by the nature of the data provided by the banks but more generally reflect that this work is exploratory. In the following sections, we offer insights into why we opted for certain methods, as well as legitimate alternatives, which may indeed merit further work.
25 This is Money. (2019, February). Why younger generations are attracted to digital-only banks. 26 Statistics taken from finder.com’s Digital Banking Statistics , updated April 2020.

The Behavioural Insights Team / Gambling bank transaction analysis, Part 1 - Monzo 17
3.2.2. How our sample was constructed
Monzo provided a sample constructed to comprise approximately 50% of customers who had activated Monzo’s gambling block at least once during the period in which their daily transaction records were available, and approximately 50% who had not. Although the sample was split evenly between gambling block users and non-users, only around 5% of Monzo’s overall customer base use the gambling block. 27 This informed Monzo’s decision to compile the approximately 50:50 sample — so as to increase the number of block users analysed in this research.
For comparative purposes, we analysed some key parts of the data using a weighted 95% / 5% split in block use. The resulting tables can be found in Appendix A to this report. Weighting affects the raw reported values, specifically the segmentation of below-average vs. above-average gamblers and the calculations of average gambling deposits and number of transactions. However, these changes are not material in that they are inconsequential to our subsequent observations and summary themes.
As we explore further in Chapter 7, the vast majority gambling block users had not gambled in the period that our data covers.
3.2.3. Customer transaction records
Each customer’s transaction records spanned between one day and 1.5 years (between May 2018, and November 2019; Figure 3.2.1), with an average of 10 months per customer. The variation in timespan of transaction records reflected Monzo’s growing customer base. We report the average number of days on record by customer type in Table 3.2.1.
We narrowed our sample to 9,410 customers for whom at least one complete calendar month of transaction data is available. Our sample is therefore customers whose daily transaction records begin no later than 1 October 2019.
27 Reported to us by Monzo.

The Behavioural Insights Team / Gambling bank transaction analysis, Part 1 - Monzo 18
Figure 3.2.1: Number of Monzo customers for whom we have daily transaction records over time.
The transaction data recorded daily spending amounts across several everyday categories in intervals of £10. We used the interval midpoint (e.g. treating the spending interval £10 – £20 as £15 spent) when aggregating spending amounts (summing or averaging) across time and/or customers. As the transaction data also recorded the number of transactions on a given day, we treated the spending interval £0 – £10 as £0 spent if the number of transactions on that day was zero.
3.2.4. How we segmented customers 28
BIT were able to see discrete transactions in the data provided, but not specific merchants. Monzo does capture merchants in accordance with Mastercard’s merchant category codes, and can organise transactions into aggregated spending categories, such as ‘gambling’, or ‘utilities’. The data provided to us included the captured aggregate category for each transaction.
We identified ‘gamblers’ as customers who made at least one online gambling-related deposit in the data provided. Each gambler’s average monthly gambling deposits over all months on record was calculated. 29 Withdrawal of funds from operators, including
28 Throughout the report we do not perform any statistical tests comparing group averages. This decision is driven largely by the fact that the volume of statistical tests involved would necessitate a level of correction for multiple comparisons that would likely render any individual test non-significant. This decision does limit the level of inferences we can draw from the data, but allows us to retain a broader overall scope for the investigation. 29 We calculated each gambler’s average monthly gambling deposits as a weighted average over all months on record, where each month’s weight is the number of observed days (a day for which we have the customer’s transaction records) divided by the number of days in that month. Each customer’s first calendar month on record had incomplete transaction data if records began after the first day of the month. Similarly, their last calendar month on record was incomplete since records ended on 13 November 2019.

The Behavioural Insights Team / Gambling bank transaction analysis, Part 1 - Monzo 19
winnings, could not be easily identified and factored into our analysis. On this basis, we found that on average, gambling deposits amounted to £136 per month.
We chose to further subdivide the gambling group to reflect differences in levels of gambling deposits. We opted to segment gamblers into two segments based on their average (mean) monthly gambling deposits (Figure 3.2.2):
1. Below-average , deposits below the sample average value of £136 per month. 2. Above-average , deposits on or above the sample average value of £136 per
month.
This split provides a legitimate comparison of higher and lower gambling spenders, sufficient for the purposes of our exploratory analyses.
We chose to categorise below- and above-average gamblers around the mean deposits value. Table 3.2.1 shows that above-average gamblers comprised 18% of gamblers in the dataset (N = 182), yet accounted for 86% of total gambling deposits and 72% of transactions. In contrast, below-average gamblers constituted the remaining 82% of gamblers (N = 848), and accounted for 14% of the overall gambling deposits (£169,270) and 28% of total gambling transactions (12,732).
Using median values, as an alternative approach, would create two equally-sized groups of gamblers (515 each of below-, and above-median spend). An ‘above-median’ category would therefore include more gamblers than our ‘above-average’ category . 30
We note that the data includes a small number of very high spenders. 31 We did not have reason to believe that these values were erroneous, and saw merit in retaining them in our analysis for this descriptive report. As such, throughout the report we present mean values.
For reference, Appendix B presents key tables from the report with both mean, and median values. As expected, equivalent median values for observations reduce the values across segments substantially, particularly for ‘above-average’ and ‘all gamblers’, as the otherwise very high values would not skew medians upw a rd. To illustrate:
- Average weekly gambling deposits (£):
- mean = £4 vs. £164, median = £1 vs. £95 for below- vs. above-average gamblers respectively
- Average weekly gambling transactions:
- mean = 0.3 vs. 4.8, median = 0.1 vs. 3.5 for below- vs. above-average gamblers respectively
30 The median average monthly gambling deposit was £7/month (vs. a mean of £136/month). 31 For instance, 41 customers exceeded £800/month in gambling deposits.

The Behavioural Insights Team / Gambling bank transaction analysis, Part 1 - Monzo 20
Figure 3.2.2: Average monthly gambling deposits across the sample of Monzo customers by segment (excluding non-gamblers).
Table 3.2.1: Sample of customers in the Monzo dataset used in the analysis.
Notes: Monthly gambling deposits pertain to card-based transactions, and do not capture cash-based gambling spend.
Non-gamblers Below-average
gamblers Above-average
gamblers All
customers
Customers
N 8,380 848 182 9,410 % of all customers 89% 9% 2% 100%
% of gamblers 82% 18% Transaction data
Number of days on record 2,585,123 305,232 51,854 2,942,209
Average per customer 308 360 285 313
Total gambling deposits
£ £0 £169,270 £1,084,420 £1,253,690 % 14% 86% 100%
No. of gambling transactions
Number on record 0 12,732 32,157 44,889
% 28% 72% 100%

The Behavioural Insights Team / Gambling bank transaction analysis, Part 1 - Monzo 21
3.3 Our research questions We framed our analyses according to four major research themes, each of which relates to different aspects of the available banking data and, in turn, different aspects of people’s financial lives. The themes contain secondary research questions which further explore the theme in more detail. Below we outline each research theme and its associated research questions, with further detail on each presented in Chapters 4 (Theme 1) to 7 (Theme 4).
Table 3.3.1: Research themes, and questions guiding the research
Research Theme Research Questions
Theme 1 - Gambling behaviour
Who gambles, how much do they gamble, and how?
1. What are the demographic characteristics of our sample?
2. How often do people gamble, and how much?
3. Are there daily/weekly/monthly trends in gambling behaviour?
Theme 2 - Spending behaviour
How is gambling related to income, and spending?
1. How does spending in everyday categories vary with gambling behaviour?
2. How do gambling deposits vary relative to income level? (HSBC only)
3. How do gambling patterns change (if at all) around pay days? (HSBC only)
Theme 3 - Savings behaviour, and overdrafts
How is gambling related to saving and overdraft use?
1. Are gamblers more or less likely to use savings pots compared to non-gamblers? (Monzo only)
2. Are there differences in gamblers’ savings behaviour compared to non-gamblers? (Monzo only)
3. How has different gamblers’ overall financial standing changed in the past year? (HSBC only)
4. Are there differences in gamblers’ use of overdrafts compared to non-gamblers? (HSBC only)
Research Theme 4 - How do people make use of gambling block functions? (Monzo only)
1. Who uses gambling blocks? 2. How do gamblers use gambling blocks? 3. Does cash use increase when a gambling
block is active?
The Behavioural Insights Team / Gambling bank transaction analysis, Part 1 - Monzo 22
4. Theme 1 — Who gambles, how much do they gamble, and when?
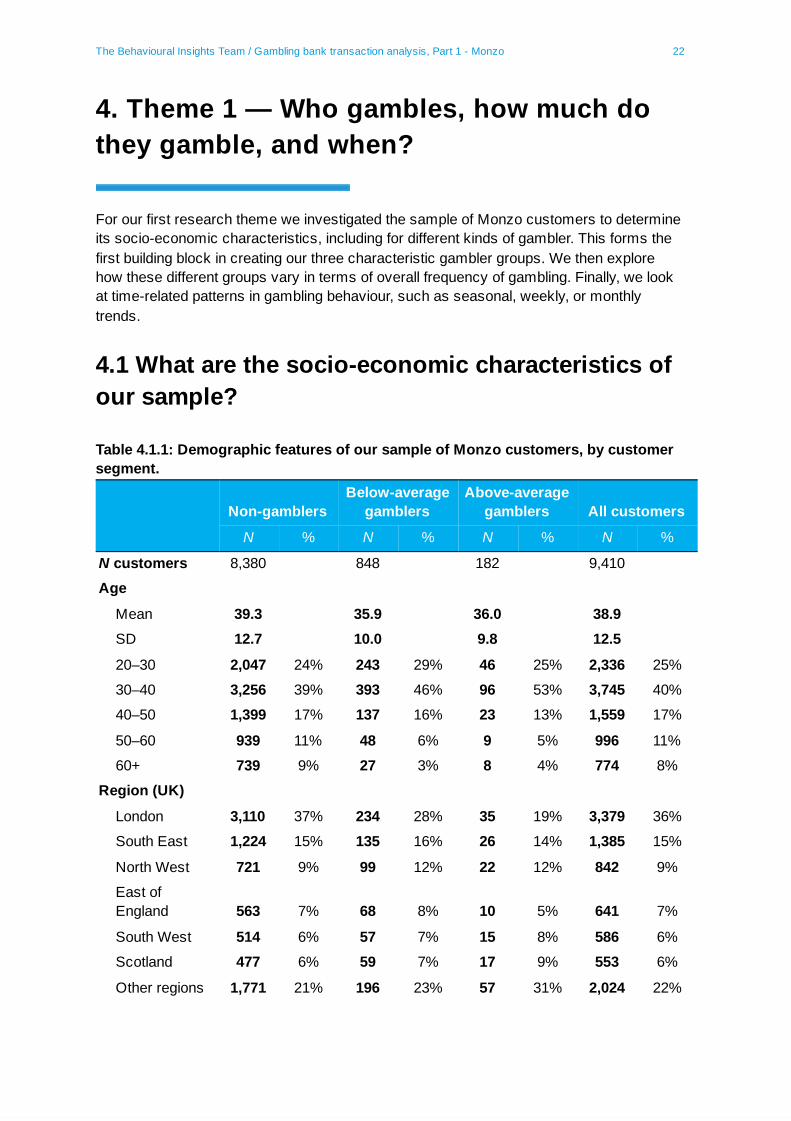
For our first research theme we investigated the sample of Monzo customers to determine its socio-economic characteristics, including for different kinds of gambler. This forms the first building block in creating our three characteristic gambler groups. We then explore how these different groups vary in terms of overall frequency of gambling. Finally, we look at time-related patterns in gambling behaviour, such as seasonal, weekly, or monthly trends.
4.1 What are the socio-economic characteristics of our sample?
Table 4.1.1: Demographic features of our sample of Monzo customers, by customer segment.
Non-gamblers Below-average
gamblers Above-average
gamblers All customers
N % N % N % N %
N customers 8,380 848 182 9,410
Age
Mean 39.3 35.9 36.0 38.9
SD 12.7 10.0 9.8 12.5
20–30 2,047 24% 243 29% 46 25% 2,336 25%
30–40 3,256 39% 393 46% 96 53% 3,745 40%
40–50 1,399 17% 137 16% 23 13% 1,559 17%
50–60 939 11% 48 6% 9 5% 996 11%
60+ 739 9% 27 3% 8 4% 774 8%
Region (UK)
London 3,110 37% 234 28% 35 19% 3,379 36%
South East 1,224 15% 135 16% 26 14% 1,385 15%
North West 721 9% 99 12% 22 12% 842 9%
East of England 563 7% 68 8% 10 5% 641 7%
South West 514 6% 57 7% 15 8% 586 6%
Scotland 477 6% 59 7% 17 9% 553 6%
Other regions 1,771 21% 196 23% 57 31% 2,024 22%

The Behavioural Insights Team / Gambling bank transaction analysis, Part 1 - Monzo 23
Notes : As age and account balance are provided as intervals in the data (intervals of 10 years for age, and £250 for account balance), values for mean and standard deviation (SD) are calculated using the interval midpoint. 32 Urban-rural classification is unavailable for nine customers’ postcode areas. 33 Percentages are within-segment. The table displays the six regions with the highest proportion of customers. "Other regions" are (% of all customers): West Midlands (5.6%); Yorkshire and the Humber (5.5%); East Midlands (3.9%); Wales (2.5%); Northern Ireland (1.9%); North East (1.8%); unavailable (0.1% or 5 customers); Channel Islands (4 customers).
Comparing customers’ age distribution (see Figure 4.1.1) we see that, overall, the distribution of customers was similar across the various age groups captured. The highest proportions of gamblers in our sample (46% – 53%) were found to be aged 30 – 40 years old, which aligns with recent a report from the Gambling Commission that showed greatest reported online gam bling behaviour amongst 35–44 year olds (28%), followed by 45 – 54 year olds (26%) and 25 – 34 year olds (25%). 34 The vast majority of people across all groups in our sample were based in urban areas.
Despite our grouping of customers, the sociodemographic observations here may be largely reflective of the overall Monzo customer base.
32 The interval midpoint for account balance is undefined if the customer’s balance exceeds £10,000 on a given day, as the maximum observable balance interval is £9,750–£10,000 in the daily transaction data. This affects 1.3% (123 of 9,410) of customers in the sample, for whom we treat the day’s balance as £10,000 (an underestimate). 33 We derive each customer’s Rural-Urban Classification (RUC) from their postcode area via the ONS Postcode Directory. As each postcode area comprises many postcodes, we use the classification of the majority of postcodes in the postcode area (or the majority of small areas in the case of Northern Ireland). We use each country's specific definition of "urban" and "rural" (even though their population thresholds differ), given by the 2011 Rural-Urban Classification for England and Wales, the Scottish Government Urban Rural Classification 2016 for Scotland, and NISRA Urban - Rural Classification 2015 for Northern Ireland. 34 Gambling Commission. (2020). Gambling participation in 2019: behaviour, awareness and attitudes. Annual report. Available from: https://www.gamblingcommission.gov.uk/PDF/survey-data/Gambling-participation-in-2019-behaviour- awareness-and-attitudes.pdf
Location
Urban 8,042 96% 810 96% 169 93% 9,021 96%
Rural 330 4% 38 4% 12 7% 380 4%
Monthly account balance (£)
Mean 197 171 152 167
Median 123 124 117 123
SD 516 422 425 507

The Behavioural Insights Team / Gambling bank transaction analysis, Part 1 - Monzo 24
Figure 4.1.1: Age distribution of our sample of Monzo customers by segment.
Gamblers had a lower average monthly balance than non-gamblers. Compared to non-gamblers’ monthly average of £197 in their current account, below-average gamblers had a balance of £171 (£26 lower, or a percentage difference of 14%), and above-average gamblers had a balance of £152 (£44 lower, or a difference of 25%). The median average monthly balance was £123 for non-gamblers, £124 for below-average gamblers, and £117 for above-average gamblers.
4.2 How often do those in our sample gamble, and how much? Table 4.2.1, below, shows the average gambling spend and number of transactions per customer in our Monzo data, given as monthly, weekly, and daily averages.

The Behavioural Insights Team / Gambling bank transaction analysis, Part 1 - Monzo 25
Table 4.2.1: Average gambling deposits (£) and number of transactions for gamblers in our Monzo sample. 35
Notes : As the transaction data recorded daily deposits in intervals of £10, values for mean and standard deviation (SD) are calculated using the interval midpoint. Gambling deposits pertain to card-based transactions, and do not capture cash-based gambling spend. Example read : The typical above-average gambler spends an average of £685 a month on gambling. On the days when they do gamble, they spend an average of £168 a day on gambling. They gamble on 22% of days on record.
Looking at all gamblers, gambling deposits of £4.70 are made each day when averaged across all days in the data. This daily average becomes £50 when considering only days on which gambling occurred.
35 We calculated each gambler’s monthly (respectively, weekly) averages as weighted averages, where each month’s (week’s) weight is the number of observed days divided by the number of days in that month (seven days in the week). Customers had incomplete daily transaction data for a month or week if their transaction records began after the first day of the month or of the week (Monday). The last calendar month and week on record are incomplete since records ended on Wednesday 13 November 2019.
Per customer averages
Below-average gamblers
Above-average gamblers All gamblers
N = 848 N = 182 N = 1,030
Mean SD Mean SD Mean SD
Average deposits (£) (across all days on record)
Monthly 18 30 685 1,043 136 507
Weekly 4 7 164 244 33 119
Daily 0.6 1.1 23.5 34.9 4.7 17.1
Average deposits (£) (across only days when gambled)
Monthly 58 98 1,148 1,711 250 834
Weekly 37 70 418 566 104 286
Daily 25 248 168 248 50 125
Per transaction 15 20 55 83 22 42
Average no. of transactions (across all days on record)
Monthly 1.1 2.6 19.9 18.4 4.7 10.7
Weekly 0.3 0.6 4.8 4.7 1.14 2.66
Daily 0.05 0.09 0.70 0.67 0.16 0.38
Average % on record with gambling
Months 27% 23% 68% 26% 34% 28%
Weeks 12% 14% 48% 27% 18% 22%
Days 3% 5% 22% 17% 6% 11%
The Behavioural Insights Team / Gambling bank transaction analysis, Part 1 - Monzo 26
Overall, gamblers made an average of just under five gambling transactions a month. On days when gambling occurred, the average spend per gambling transaction was £22. Gambling typically occurred on 6% of all days on record.
Compared to below-average gamblers, above-average gamblers:
● Deposit 38 times more when averaged over all days on record (£684 per month vs.
£18 per month) . Looking only at days when gambling occurred, they deposit almost seven times more on average (£168 per day vs. £25 per day). Their gambling transactions were almost four times bigger (£55 per transaction vs. £15 per transaction).
● About 19 times more frequently: averaging almost one gambling transaction per day (0.7) compared to below-average gamblers’ average of just over 1 per month (1.1).
4.3 Are there any daily, weekly, or monthly trends in gambling behaviour in our sample? We analysed temporal gambling patterns by plotting:
● Monthly trends across months on record; ● Daily trends across dates in a month; and ● Daily trends across days in a week.
To plot monthly trends, we calculated the spend per gambler in each month by dividing the total spend by the number of gamblers on record; and similarly for the number of transactions per gambler. We weighted each gambler’s spend and number of transactions in a given month by the number of days on record divided by the number of days in the month.
Figure 4.3.1. shows that gambling deposits peaked in June 2018 and in August – October 2019.

The Behavioural Insights Team / Gambling bank transaction analysis, Part 1 - Monzo 27
Figure 4.3.1: Monthly deposits and number of transactions per gambler across months on record.
Figure 4.3.2 compares gambler spend in gambling and non-gambling categories, where we defined the latter as total spend minus gambling spend.
Figure 4.3.2: Monthly per gambler spend in gambling and non-gambling categories

The Behavioural Insights Team / Gambling bank transaction analysis, Part 1 - Monzo 28
Figures 4.3.1 and 4.3.2 both show peaks in gambling over June 2018, when our available data begins. Monzo customers in our sample were not only spending more on gambling than in non-gambling spending categories, but were likely also spending more per gambling transaction.
To plot trends across dates in a month, we first calculated each gambler’s average spend on a given day of the month, over as many months in which the gambler had transaction records for that day (including days when they did not gamble). We then averaged over all gamblers who had records for the given day of the month, plotting this as ‘average per gambler spend’ in Figure 4.3.3. We obtained the average per customer number of transactions for each day of the month in a similar way.
Figure 4.3.3: Average per gambler spend and number of transactions across dates in a month.
We took a similar approach to plot daily trends across days in a week, shown in Figure 4.3.4.

The Behavioural Insights Team / Gambling bank transaction analysis, Part 1 - Monzo 29
Figure 4.3.4: Average per gambler spend and number of transactions across days in a week.
Figures 4.3.3 and 4.3.4 show that:
a) Average per gambler spend was higher in the latter third of the month (19th, 25th, 30th, 31st) and on the 1st of the month; and lower in the middle of the month (8th – 12th). The average number of transactions on a given day follows a broadly similar trend.
b) During a week, gambling deposits increased between Wednesday and Friday. The number of transactions was highest on Fridays and Saturdays, and spending highest on Thursdays and Fridays.
While we lacked specific income data for Monzo customers, a reasonable assumption is that many people receive their income towards the end of each month. This is one possible explanation for the upward trend in gambling behaviours at this time and raises interesting questions about how payday might affect gambling behaviour. For instance, whether gambling spending increases when an individual’s account balance is at its highest, or whether increased spending represents an attempt to supplement one’s income until payday.
The trends in gambling behaviour across dates in a month, in particular, suggest that self-control over gambling may wane towards the end of each month. This suggests a timely moment for interventions. For instance, customers making gambling transactions during the final week of each month could be asked to confirm each transaction via a notification in the Monzo app, adding a slight degree of friction and encouraging customers to reflect more on their intended deposit, without fully restricting their behaviour.

The Behavioural Insights Team / Gambling bank transaction analysis, Part 1 - Monzo 30
4.4 Characteristic profiles — What Theme 1 tells us about sampled Monzo customers Table 4.4.1 outlines the key findings observed under our first research theme across each of our characteristic gambler profiles.
Table 4.4.1: Characteristic profiles - what Theme 1 tells us
Profile 1 Non-gamblers
(89% of sample, n = 8380)
Profile 2 Below-average gamblers (9% of sample, n = 848)
Profile 3 Above-average gamblers (2% of sample, n = 182)
Socio-economic characteristics
●Aged 30 – 40 years old (39%), with an average age of 39
●Typically has £197 in their Monzo account
●Aged 30 – 40 years (46%), with an average of 36
●Typically has £166 in their Monzo account
●Aged 30 – 40 years (40%), with an average age of 39.
●Typically has £153 in their Monzo account
Gambling behaviour
●Does not gamble ●Gambling deposits of £18 per month ●Gambles on 3% of days, 27% of
months ●Typically around one gambling
transaction per month
●Gambling deposits of £684 per month
●Gambles on 22% of days, 68% of months
●Typically around one gambling transactions per day

The Behavioural Insights Team / Gambling bank transaction analysis, Part 1 - Monzo 31
5. Theme 2 — How is gambling related to everyday spending?
As many customers tend not to receive their primary income into digital-only bank accounts, we were unable to assess how gambling behaviour changed in and around payday for our sampled Monzo customers. We were, however, able to explore how differences in everyday spending varied across the characteristic gambler profiles in our sample.
5.1 How does spending in everyday categories vary with gambling behaviour? We were interested in how gambling deposits compared to spending in other major categories, and as such provide context to how gambling may fit into the wider financial lives of those customers in our sample. Research has shown, for example, that gambling can put significant financial strain on individuals, and families. 36 37 Following the substantial differences observed between average monthly gambling deposits of above-average (£684) and below-average gamblers (£18) in our sample, for instance, our next analysis investigated whether substantial differences in spending arose elsewhere.
To compare customers’ average monthly spend across the major everyday spending categories captured by Monzo, we first obtained each customer’s average monthly spend by category over all months they had on record.
Table 5.1.1: Average monthly spend across categories by customer segment.
36 Salonen, A.H., Hellman, M., Latvala, T., Castrén, S. (2018). Gambling participation, gambling habits, gambling-related harm, and opinions on gambling advertising in Finland in 2016. Nordic Studies on Alcohol and Drugs . 35(3):215–3 37 Dickson-Swift, V. A., James, E. L., & Kippen, S. (2005). The experience of living with a problem gambler: Spouses and partners speak out. Journal of Gambling Issues , (13).
Average monthly spend (£)
Non-gamblers ( N = 8,380)
Below-average gamblers ( N = 848)
Above-average gamblers ( N = 182)
All gamblers ( N = 1,030)
Mean SD Mean SD Mean SD Mean SD
Gambling 0 0 18 30 684 1,043 136 507
ATM 28 82 74 137 151 185 87 149
Bills 9 320 4 386 14 264 6 367
Eating out 45 73 76 94 58 111 73 97
Entertainment 19 42 48 59 361 880 103 392
Expenses 0 3 0 5 2 45 0 19
General 23 120 40 118 40 83 40 112

The Behavioural Insights Team / Gambling bank transaction analysis, Part 1 - Monzo 32
Notes : As the transaction data recorded daily spend in intervals of £10, values for mean and standard deviation (SD) are calculated using the interval midpoint. Total spending reported here is not a marginal total, and includes spending not captured by Monzos categories. As some months had incomplete transaction records, we calculated each customer’s monthly averages as weighted averages, where each month’s weight is the number of observed days divided by the number of days in that month. We then calculated the mean and standard deviation of average monthly spend in each category for each of our three characteristic profile groups.
Figure 5.1.1 focuses on the six remaining categories where group differences were more pronounced, and drops the categories of Bills, Expenses, and General (where spending was either very low overall, or similar between groups).
Figure 5.1.1: Average monthly spend across categories by customer segment.
In Table 5.1.1 and Figure 5.1.1, we see that above-average gamblers spend four times more each month than non-gamblers (£1370 vs. £325) and more than twice as much as below-average gamblers (£601). Gambling accounts for over 50% of their spend compared to 0% and 3% respectively for the remaining groups.
Above-average gamblers spend disproportionately more than both non-gamblers and below-average gamblers on two other distinct categories: ATM cash withdrawals, and entertainment (which captures spending on things such as cinema and music venue trips, and online entertainment such as music/video streaming services).
These findings raise a number of questions that cannot be answered using this dataset, but merit further investigation. Prime candidates include the relationship between income level and gambling spend, and overall spend; and how spending on gambling and other
Groceries 49 84 75 284 85 109 77 262
Shopping 43 98 77 294 80 232 78 284
Total 325 496 601 766 1,370 1,518 737 987

The Behavioural Insights Team / Gambling bank transaction analysis, Part 1 - Monzo 33
categories are distributed across different kinds of accounts (digital-only, traditional and so on) held by an individual. 38
We also explored gamblers’ average monthly spending in months when they did gamble compared to months when they did not, summarised in Table 5.1.2
Table 5.1.2: Average monthly spend in gambling and non-gambling categories across months with, and without gambling.
Notes : As the transaction data recorded daily spend in intervals of £10, values for mean and standard deviation (SD) are calculated using the interval midpoint. Non-gambling spend is defined as total spend minus gambling spend. As some months had incomplete transaction records, we calculated each customer’s monthly averages as weighted averages, where each month’s weight is the number of observed days divided by the number of days in that month.
We found that gamblers’ average spending in months with gambling activity (£944) is generally twice as high as for average spending in months without gambling activity (£498). Where below-average gamblers have a £162 higher non-gambling spend in gambling months vs. non-gambling months, the same difference is £366 for above-average gamblers. This could reflect general fluctuations in income, for instance, or contextual factors — such as a relationship between time spent gambling online and other forms of online spending such as shopping.
A further open question is the extent to which this kind of trend could be driven by more psychological factors. That is, could changes in psychological mindset be associated with, or triggered by gambling behaviour? The latter, in particular, has implications for financial harm-identification, and reduction interventions. Research indicates links between heavier gambling and impulsivity. 39 If gambling may lead people to subsequently increase their
38 See Finder.com’s Digital Banking Statistics , updated April 2020. 39 Navas, J. F., Billieux, J., Perandrés-Gómez, A., López-Torrecillas, F., Cándido, A., & Perales, J. C. (2017). Impulsivity traits and gambling cognitions associated with gambling preferences and clinical status. International Gambling Studies , 17 (1), 102-124.
Average monthly spend (£)
Below-average gamblers ( N = 848)
Above-average gamblers ( N = 182)
All gamblers ( N = 1,030)
Mean SD Mean SD Mean SD
Gambling spend
Across all months 18 30 684 1,043 136 507
Across only months with gambling 58 98 1,148 1,711 250 834
Non-gambling spend Across all months 583 762 685 735 601 758
Across only months with gambling 675 869 785 871 694 870
Across only months without gambling 513 610 419 579 498 606

The Behavioural Insights Team / Gambling bank transaction analysis, Part 1 - Monzo 34
general spending, customers with above-average gambling could be targeted with interventions whenever a gambling transaction occurs.
5.2 Characteristic profiles — what Theme 2 tells us about sampled Monzo customers
Table 5.2.1: Characteristic profiles - what Theme 2 tells us
Profile 1 Non-gamblers
(89% of sample, n = 8380)
Profile 2 Below-average gamblers (9% of sample, n = 848)
Profile 3 Above-average gamblers (2% of sample, n = 182)
Spending behaviour
●Typically spends £325 per month across 9 major categories
●Highest spend categories are groceries (£49), eating out (£45), shopping (£43)
●Typically spends £601 per month across 9 major categories (incl. gambling)
●Highest spend categories are shopping (£77), groceries (£75), eating out (£76)
●Spend around £30 per month more than non-gamblers on entertainment, groceries, and shopping
●Non-gambling spending is £160 higher in months with gambling vs. without
●Typically spends £1,370 per month across 9 major categories (incl. gambling)
●Highest spend categories are gambling (£684), entertainment (£361), ATM (cash) (£151)
●Similar average monthly spend on groceries, shopping vs. below-average gamblers
●6x higher average monthly spend on entertainment vs. below-average gamblers
●Non-gambling spending £712 higher in months with gambling vs. without

The Behavioural Insights Team / Gambling bank transaction analysis, Part 1 - Monzo 35
6. Theme 3 — How is gambling related to savings behaviour?
The project’s third research theme explores gamblers’ saving behaviour. In particular whether different kinds of gamblers were more or less likely to save at all, but also the extent to which saving varied with their level of gambling. To do this, we assessed how our groups differed in terms of:
1. The average monthly balance of all internal, and external (interest-earning) Monzo
savings pots; 2. The average number of transfers made into savings pots per month; and 3. The overall ratio of monthly contributions made to pots to against monthly gambling
spend
Understanding how gambling relates to activities like saving behaviour is valuable in the context of individuals’ financial wellbeing and resilience to financial shocks and can help to further our understanding of the associations between gambling and broader financial standing.
6.1 Are gamblers more or less likely to use savings pots compared to non-gamblers? Research has shown that better financial outcomes are associated with relatively straightforward financial management behaviours, such as mental budgeting, or avoiding carrying cash/bank cards so as to prevent unwanted spending. 40 41 To that end, bank transaction data might also provide some opportunity to shed light on how different types of gamblers might manage their money.
We assessed the proportions of customers making use of Monzo’s ‘pots’ function, which allows customers to set money aside from their main account balance. Users can set savings goals for their pots, and add ‘frictions’ to making withdrawals. 42 Monzo also offers interest on some types of savings pots (external pots), which are administered by external providers.
Table 6.1.1 shows the proportion of customers who have used internal (non-interest accruing) and external savings pots, by customer segment.
40 Antonides, G., De Groot, I. M., & Van Raaij, W. F. (2011). Mental budgeting and the management of household finance. Journal of Economic Psychology , 32 (4), 546-555. 41 Webley, P., & Nyhus, E. K. (2001). Life‐cycle and dispositional routes into problem debt. British journal of psychology , 92 (3), 423-446. 42 https://monzo.com/blog/2019/05/07/how-to-save-money-with-monzo

The Behavioural Insights Team / Gambling bank transaction analysis, Part 1 - Monzo 36
Table 6.1.1: Proportion of customers who have used internal and external savings pots, by customer segment.
Notes : We considered a customer to have used savings pots if they had at least one day with non-zero balance in the pot.
A greater proportion of gamblers (59%) than non-gamblers (37%) used Monzo’s internal savings pots. Similar proportions of below-average and above-average gamblers use pots. Overall proportions of uptake for external pots were low, and there was a marginally higher use amongst gamblers compared to non-gamblers. The higher savings pot use among gamblers compared to non-gamblers reflects the similar trends observed for spending. This perhaps points to gambling customers in our Monzo sample having greater financial capability more generally, with more money to spend, and save.
6.2 Are there differences in gamblers’ saving behaviour compared to non-gamblers? The Money and Pensions Service found that around 19% of low income earners have £100 – £499 in readily available savings, as many as 40% have less than £100 in readily available savings, with 14% having no available savings at all. 43 44 Our subsequent analysis assessed the levels of available savings different types of gamblers have in their Monzo account, as well as the comparative extent of saving-to-gambling spend per month. Note, however, the analytical limitation of the very small number of above-average gamblers that used external savings pots in our sample (11).
43 Money Advice Service. (2016). Millions at risk with savings of £100 or less. 44 Money and Pensions Service. (2020). The UK strategy for financial wellbeing 2020 - 2030. Available from: https://moneyandpensionsservice.org.uk/wp-content/uploads/2020/01/UK-Strategy-for-Financial-Well being-2020-2030-Money-and-Pensions-Service.pdf
Non-gamblers All gamblers Below-averag
e gamblers Above-averag
e gamblers
N % N % N % N %
N customers 8,380 1,030 848 182
Internal pots
Have used 3,063 37% 612 59% 504 59% 108 59%
Have not used 5,317 63% 418 41% 344 41% 74 41%
External pots
Have used 472 6% 83 8% 72 8% 11 6%
Have not used 7,908 94% 947 92% 776 92% 171 94%

The Behavioural Insights Team / Gambling bank transaction analysis, Part 1 - Monzo 37
Table 6.2.1: Average monthly balance and transfers in customers’ current accounts and savings pots, by customer segment.
Notes : We consider a customer to have used savings pots if they had at least one day with non-zero balance in the pot. As the daily transaction records provide balance amounts in £250 intervals, values for mean and standard deviation (SD) are calculated using the interval midpoint. 45 As some months had incomplete transaction records, we calculated each customer’s monthly averages as weighted averages, where each month’s weight is the number of observed days divided by the number of days in that month. Ratio of average monthly transfers to average monthly gambling spend is first calculated at the customer level before obtaining mean and SD values across customers in the given segments; e.g. if a segment has N customers, each with average monthly transfer T i and gambling spend S i , we calculate the mean transfers-to-gambling ratio of customers in the segment as (1/ N )*[( T 1 / S 1 ) + ( T 2 / S 2 ) + … + ( T N / S N )]. Example read : Of the 848 below-average gamblers in our sample, 59% have used internal savings pots. Such a customer typically has a monthly average balance of £168 in internal pots, and saves an average of £22 per month.
A greater propensity among sampled gamblers to use Monzo savings pots does not translate into higher balances in those pots. Gamblers tended to have a lower balance (at £168 vs. £208 for non-gamblers) and smaller net transfers into their internal pots (at £21 per month vs. £27 per month). Above-average gamblers have the smallest net transfers into their internal pots (£14). Similarly, gamblers had lower balances and
45 The interval midpoint for account balance is undefined if the customer’s balance exceeds £10,000 on a given day, as the maximum observable balance interval is £9,750–£10,000 in the daily transaction data. This affects 1.3% (123 of 9,410) of customers in the sample, for whom we treat the day’s balance as £10,000 (an underestimate).
Monthly averages per customer
Non-gambler s ( N = 8,380)
All gamblers ( N = 1,030)
Below-average gamblers ( N = 848)
Above-average gamblers ( N = 182)
Mean SD Mean SD Mean SD Mean SD
Internal pots (if ever used)
N customers 3,063 612 504 108
% customers 36.6% 59.4% 59.4% 59.3%
Balance (£) 208 553 168 390 168 386 169 409
Transfers (£) 27 103 21 93 22 100 14 54
Ratio of average monthly transfers vs. gambling spend n/a n/a 10 49 13 54 0 0
External pots (if ever used)
N customers 472 83 72 11
% customers 5.6% 8.1% 8.5% 6.0%
Balance (£) 1,088 1,934 553 996 627 1,050 68 82
Transfers (£) 208 463 81 184 91 196 18 24
Ratio of average monthly transfers to gambling spend n/a n/a 37 123 42 131 0.1 0.2

The Behavioural Insights Team / Gambling bank transaction analysis, Part 1 - Monzo 38
transfers into their external pots (£553 vs. £1,088), though the proportion of customers who have used them is similar across segments and much lower than for internal pots.
Differences in overall saving behaviour between below- and above-average gamblers also emerge in the ratios of transfers-to-gambling: below-average gamblers put 42 times as much money into an external saving pot vs. what they deposit on gambling. This ratio is close to zero for the 11 above-average gamblers in our sample who have used external savings pots. In other words, these above-average gamblers’ transfers into their external pots tend to be far smaller than their average monthly gambling spend.
Our observations suggest that while above-average gamblers show interest in opening pots, they are less active in using them. A pertinent question is therefore how to encourage saving behaviour among these gamblers who opt to open pots. One idea worth trialling could be to mark gambling transactions as a special case for savings pots’ ‘round-up’ functionality, whereby the difference between the transaction amount and the nearest pound is automatically added to a savings pot on the customers behalf.
A better understanding of motivations for opening and using pots would add to the picture. For example, across each group, how does the use of pots vary in terms of the underlying goal behaviour? 46 Are non-gamblers, for instance, more driven to save because they are better able to set goals? Understanding more about this would shed light on how best to frame messages to different groups around how to get the most out of their pots (e.g. encouraging customers to visualise a specific goal).
It may be that gamblers see pots as a means of offsetting their expected gambling spend. For example, much like the decision to activate a gambling block is an attempt to prevent future gambling, so too could be the choice to actively save money that could otherwise be expected to be spent on gambling. An investigation of when specific contributions to savings pots occur relative to gambling transactions could be another productive area of further work.
46 Ülkümen, G., & Cheema, A. (2011). Framing goals to influence personal savings: The role of specificity and construal level. Journal of marketing research , 48 (6), 958-969.

The Behavioural Insights Team / Gambling bank transaction analysis, Part 1 - Monzo 39
6.3 Characteristic profiles — What Theme 3 tells us about sampled Monzo customers
Table 6.3.1: Characteristic profiles - what Theme 3 tells us
Profile 1 Non-gamblers
(89% of sample, n = 8380)
Profile 2 Below-average gamblers (9% of sample, n = 848)
Profile 3 Above-average gamblers (2% of sample, n = 182)
Saving behaviour
●37% have opened an internal savings pot, 6% have opened an external pot
●Average of £208 in internal savings pots, and £1088 in external pots
●Saves an average of £27 per month into internal savings pots, and £208 per month into external pots
●59% have opened an internal savings pots, 9% have opened an external pot
●Average of £168 in internal savings pots, and £627 in external pots
●Saves an average of £22 per month into internal savings pots, and £91 per month into external pots
●59% have opened an internal savings pot,6% have opened an external pot
●Average of £169 in internal savings pots, and £68 in external pots
●Saves an average of £14 per month into internal savings pots, and £68 per month into external pots

The Behavioural Insights Team / Gambling bank transaction analysis, Part 1 - Monzo 40
7. Theme 4 — How do people make use of gambling block functions?
Gambling block functions are tools through which bank customers can disable gambling transactions and therefore prevent gambling spending via cards. They operate by blocking transactions from occurring at the point of sale. As of April 2021, 11 financial institutions in the UK offer gambling block functions, including Monzo and HSBC. 47 Of those offering gambling blocks, most typically require customers wishing to lift the block to give 48 hours notice, during which the customer can rescind the request. 48 This friction in the process is aimed at countering more impulsive decisions to begin gambling again, which is a particular issue for more problematic gamblers. 49
Gambling block functions are still a nascent product, having only been available in the UK since 2018. A 2020 report detailing eight banks in the UK who offer gambling blocks found they cumulatively account for 49m current accounts, and 29m credit card accounts, but that blocking functions are not typically available across a bank’s full portfolio of accounts. 50 What we do know is that a majority of people who activate bank-level gambling blocks do so despite not being gamblers. 51
We had three main research questions of interest: who uses gambling blocks; how they use them; and changes in spending behaviour when a block is implemented.
7.1 Who uses gambling blocks?
As the full picture on gambling block use is still emerging, our first step under research theme four was to understand who in our sample used these tools, and how.
We defined gambling block users as customers who activated the gambling block at least once during the period in which their daily transaction records are available. Of the Monzo sample’s 9,410 customers, 4,087 (43%) have enabled the gambling block at least once. It is important to reiterate that this is a non-random sample, however, and was constructed in order to comprise approximately 50% block users. Weighting non-block users as w =
47 Gambling Commission. (2021, April). Block gambling payments with your bank. 48 Evans, J., Collard, S., & Fitch, C. (2020) A blueprint for bank card gambling blockers. Report published by GambleAware. Available from: http://www.bristol.ac.uk/media-library/sites/geography/pfrc/A%20Blueprint%20for%20Bank%20Card %20Gambling%20Blockers%20-%20Report.pdf. 49 Ioannidis, K., Hook, R., Wickham, K., Grant, J. E., & Chamberlain, S. R. (2019). Impulsivity in gambling disorder and problem gambling: A meta-analysis. Neuropsychopharmacology , 44 (8), 1354-1361. 50 Evans, J., Collard, S., & Fitch, C. (2020) A blueprint for bank card gambling blockers. Report published by GambleAware. Available from: http://www.bristol.ac.uk/media-library/sites/geography/pfrc/A%20Blueprint%20for%20Bank%20Card %20Gambling%20Blockers%20-%20Report.pdf 51 Ibid

The Behavioural Insights Team / Gambling bank transaction analysis, Part 1 - Monzo 41
0.95 and block users as w = 0.05 as only 5% of Monzo’s overall customer base use the gambling block, the weighted percentage of customers who are block users is 3.9%. 52
Table 7.1.1 summarises further demographic features of customers by block use.
Table 7.1.1: Demographic features of our sample of Monzo customers, by gambling block use.
52 Weighted proportion calculated as (0.05×4087 block users) / (0.05 × 4087 block users + 0.95 × 5323 non-users) = 0.039.
Non-users Users All customers
N % N % N %
N customers 5,323 4,087 9,410
Segment
Non-gamblers 4,678 88% 3,702 91% 8,380 89%
Below-average gamblers 564 11% 284 7% 848 9%
Above-average gamblers 81 2% 101 2% 182 2%
Age
Mean 37.1 41.4 38.9
SD 11.6 13.1 12.5
20–30 1,545 29% 791 19% 2,336 25%
30–40 2,274 43% 1,471 36% 3,745 40%
40–50 751 14% 808 20% 1,559 17%
50–60 430 8% 566 14% 996 11%
60+ 323 6% 451 11% 774 8%
Region (UK)
London 1,986 37% 1,393 34% 3,379 36%
South East 789 15% 596 15% 1,385 15%
North West 457 9% 385 9% 842 9%
East of England 360 7% 281 7% 641 7%
South West 317 6% 269 7% 586 6%
Scotland 328 6% 225 6% 553 6%
Other regions 1,086 20% 938 23% 2,024 22%
Location
Urban 5,113 96% 3,908 96% 9,021 96%
Rural 206 4% 174 4% 380 4%
Monthly account balance (£)
Mean 168 227 193
Median 121 125 123

The Behavioural Insights Team / Gambling bank transaction analysis, Part 1 - Monzo 42
Notes : As age and account balance are provided as intervals in the data (intervals of 10 years for age, and £250 for account balance), values for mean and standard deviation (SD) are calculated using the interval midpoint. 53 Urban-rural classification is unavailable for nine customers’ postcode areas. Gambling block use is considered only for dates on which the customer has transaction records available. Percentages are within-segment.
From table 7.1.1, we see that 33% of below-average gambling customers enabled the block at least once (284 out of 848), compared to 55% of above-average gambling customers (101 out of 182), and 44% of non-gambling customers (3,702 out of 8,380). The weighted percentages of gambling block users are 2.6% of below-average gambling customers, 6.2% of above-average gambling customers, and 4.0% of non-gambling customers. Above-average gambling customers in our sample are thus more likely to have used the block than the average customer in our sample (weighted percentage of 3.9%) or in Monzo’s customer base (5%).
The vast majority (91%) of gambling block users had not gambled in the period our data covers; just 9% of people who used a block over the period observed had gambled. We cannot determine from these statistics alone whether the block curbed gambling intentions or if blocks were generally being used by people who had no intention of gambling. Nonetheless, this finding is congruent with other recent research, showing a high trend of block use among non-gamblers. That research indicated that many activate the block as a security feature to prevent their account from being defrauded. 54
While overall we see smaller proportions of gambling block users comprising actual gambling customers, the rate of uptake within each of these individual groups is higher for above-average gambling customers. Yet, despite 55% of above average gambling customers having used the block at least once, there remains a sizeable proportion of this group who do not engage with the block. Recent research indicates that 43% of people who gamble were not aware their bank could block gambling transactions. 55 This offers one potential explanation for the findings in our sample.
7.2 How do gamblers use gambling blocks? While 11 financial institutions currently offer gambling blocks in the UK, there is variability across banks in terms of how these tools can be activated, and deactivated. 56 In particular, several banks vary in terms of their ‘cooling off’ period — the time lag between a customer choosing to deactivate a block, and their bank actually re-enabling gambling transactions. This ‘friction’ in the process is designed to mitigate against impulsive decisions to begin gambling again. It does, however, raise questions about how it might affect customers’
53 The interval midpoint for account balance is undefined if the customer’s balance exceeds £10,000 on a given day, as the maximum observable balance interval is £9,750–£10,000 in the daily transaction data. This affects 1.3% (123 of 9,410) of customers in the sample, for whom we treat the day’s balance as £10,000 (an underestimate). 54 Evans, J., Collard, S., & Fitch, C. (2020) A blueprint for bank card gambling blockers. Report published by GambleAware. Available from: http://www.bristol.ac.uk/media-library/sites/geography/pfrc/A%20Blueprint%20for%20Bank%20Card %20Gambling%20Blockers%20-%20Report.pdf 55 Ibid 56 Gambling Commission. (2021, April). Block gambling payments with your bank.
SD 421 599 507

The Behavioural Insights Team / Gambling bank transaction analysis, Part 1 - Monzo 43
tendencies towards activating and deactivating the tool. To that end we aimed to explore how long customers in our sample tended to activate blocks for, and how frequently our different characteristic gambling groups deactivated a block.
Decisions to activate gambling blocks may be driven in part by recent gambling behaviour. We therefore also inspected how our different gambler groups gambled in the time leading up to their activation of a block. Comparing gambling spend in this immediate period to that more generally could help to highlight what kinds of fluctuations may signal that customers are concerned about their behaviour.
Table 7.2.1 summarises our findings on how the 4,087 users in our Monzo sample engaged with the block.
Table 7.2.1: Gambling block use amongst Monzo customers.
Non-gambler s
All gamblers
Below-averag e gamblers
Above-average gamblers
N % N % N % N %
N customers 3,702 385 284 101
Lifted the block at least once
For any period 20 1% 138 36% 95 33% 43 43%
For longer than 1 day 20 1% 138 36% 95 33% 43 43%
For longer than 1 week 18 0% 130 34% 88 31% 42 42%
For longer than 30 days 17 0% 106 28% 71 25% 35 35%
No. of times block was lifted
Once 20 1% 119 31% 87 31% 32 32%
Twice 0 0% 12 3% 7 2% 5 5%
Thrice or more 0 0% 7 2% 1 0% 6 6%
Average % of days in transaction records with block on
Mean 72% 42% 45% 34%
Median 84% 37% 45% 26%
SD 29% 29% 29% 27%
Customers with gambling transactions on day of activation 0 0% 117 30% 71 25% 46 46%
Customers with gambling transactions in days after activation 0 0% 8 2% 2 1% 6 6%

The Behavioural Insights Team / Gambling bank transaction analysis, Part 1 - Monzo 44
Notes : Sample includes 4,087 Monzo customers who activated the gambling block at least once during the period in which their daily transaction records are available. The remaining 5,323 Monzo customers in the sample had no instances of gambling block use. To calculate the average percentage of days in transaction records with the block switched on, we define each day’s block status as the latest status recorded, thus ignoring any previous changes in block status on the given day (affecting 26 users in the sample, of whom 5 gambled on a day in which they changed their block status more than once). Gambling transactions listed after activating the block can happen for three reasons: a) the point of sale occurred before the block was active, but was not posted to the account until after the block was activated; b) customers gamble on the day the block is deactivated, and then reactivate the block on the same day; c) transactions have occurred at merchants not recognised at the time by Monzo as gambling operators, but which later have been added to Monzo’s block list.
Fewer than 1% of non-gamblers lifted the block at least once compared with 36% of gamblers. Above-average gamblers, in particular, were more likely than below-average gamblers to lift the block (43% vs. 33%). A third of above-average gamblers lifted the block for longer than 30 days, whereas a quarter of below-average gamblers and none of the non-gamblers did so. Assuming that the gambling block is best-placed to protect above-average gambling customers in particular, the ease of being able to turn off the block indefinitely could be a cause for concern. Recent calls have been made for banks to increase the friction involved in this process by increasing the ‘cooldown’ period between when a customer lifts the block, and when they can gamble again. 57 However, a potentially useful further step would be to ask customers how long they wish to disable the block for, rather than offer only a binary choice. Pre-selected periods could be offered as options, with customers still being able to turn the block off indefinitely should they wish. Framing the choice in this way could spur people to take more active consideration about their behaviour. Additionally, above-average gambling customers who lift the block for an extended period could be prompted to consider re-enabling the block if their data showed an increase on prior levels of gambling.
Table 7.2.2 shows the average daily gambling deposits and number of transactions in the week before and in the week after each customer’s first gambling block activation (within the data window available). We omitted gamblers who did not have this two-week observation window around any activation. Our sample thus included 353 gamblers, of whom 74% (256) are below-average gamblers and 26% (97) are above-average gamblers.
Table 7.2.2: Average daily gambling deposits and number of gambling transactions in the week before and in the week after customers first activate their gambling block.
57 Ibid.
Per customer daily averages for gambling
transactions
Below-average gamblers
Above-average gamblers All gamblers
N = 260 N = 93 N = 353
Mean SD Mean SD Mean SD
No. and % of customers in segment who gambled
In week before 92 58% 68 58% 160 58%
On day of activation 62 39% 40 34% 102 37%

The Behavioural Insights Team / Gambling bank transaction analysis, Part 1 - Monzo 45
Notes : As the transaction data recorded daily spend in intervals of £10, values for mean and standard deviation (SD) are calculated using the interval midpoint. Sample is N = 353 gamblers who have used the gambling block and who have daily transaction records available for the week before and the week after they activated the block. Gambling deposits pertain to card-based transactions, and do not capture cash-based gambling spend.
The proportion of gamblers who gambled at any point in the week dropped after activation, from 58% gambling in the week prior to activation to 5% in the week after activation. Those who still gambled in the week after activating their block may have done so after having deactivated the block within that same week (in our sample, four below-average and seven above-average gamblers had deactivated their gambling block within a week of activating it). Slightly over a third of customers had gambled on the day of activation. Predictably, average daily gambling deposits fell in the week after block activation, decreasing from £5 per day to near-zero for below-average gamblers, and from £72 per day to £4 per day for above-average gamblers.
Although the sample is small, block users’ average daily gambling deposits are three times higher in the week prior to block activation, from a mean of £6.90 per day over all days on record, to £22.90 per day over the week prior to block activation. This observation could suggest that spikes in gambling deposits represent a timely moment at which gamblers may be more receptive to prompts about activating the block. Further analysis would be needed to determine whether such spikes are predictive of subsequent likelihood to activate a block. If such a relationship is confirmed, then an opportunity may exist to intervene and prompt the customer to activate a block to mitigate harm. These types of messages would need to be sensitively communicated; BIT has previously worked with a bank around how best to design these kinds of interactions. 58 Other organisations such as the Money and Mental Health Policy Institute and GamCare have produced guidance and toolkits on how firms can best communicate with vulnerable customers. 59 60
58 Behavioural Insights Team. (2018). Testing behaviourally-informed messaging to increase rates of contact between mortgage lenders and customers facing arrears: A report by the Behavioural Insights Team for the Department for Communities, Northern Ireland. Available from: https://www.bi.team/wp-content/uploads/2019/02/20180704-BIT-Final-Report-R1.pdf 59 Alpin, K., & Holkar, M. (2019). Data protecting: Using financial data to support customers. Available from: https://www.moneyandmentalhealth.org/wp-content/uploads/2019/10/Data-Protecting-report.pdf 60 GamCare. (2020). Gambling-related financial harm: Core messages and self-help toolkit - Core messages to be used by organisations helping customers affected by gambling harms, and a self-help toolkit for customers. Available from :
In week after 4 3% 10 8% 14 5%
Average deposits (£) In week before 5.4 14.9 71.8 155.1 22.9 85.5
In week after 0.0 0.2 3.8 20.1 1.0 10.4
All days on record 0.9 1.2 23.6 39.9 6.9 22.8
Average no. of gambling transactions
In week before 0.3 0.7 1.4 1.8 0.6 1.2
In week after 0.0 0.0 0.1 0.5 0.0 0.3
All days on record 0.1 0.1 0.6 0.5 0.2 0.4

The Behavioural Insights Team / Gambling bank transaction analysis, Part 1 - Monzo 46
7.3 Does cash use increase when a gambling block is active? While for some gamblers the block will represent a means to an end in preventing further gambling spend, those with stronger gambling tendencies may try to circumvent this barrier. Indeed, research by the Personal Finance Research Centre indicates that as much as 15% - 35% of block users have circumvented the block, sometimes through using cash. 61
Using bank transaction data afforded the opportunity to investigate whether ATM cash withdrawals fluctuated in the weeks immediately before and after a customer activated a gambling block. While we cannot comment on whether any increased tendencies towards cash use after activating a block genuinely represents attempts to continue gambling, any substantial increases would nonetheless raise concerns particularly for more active gamblers.
Table 7.3.1 shows the average ATM transaction value and number of transactions in the week before and in the week after block activation. Across customer segments, ATM use increases very slightly after block activation.
Table 7.3.1: Average daily ATM spend and number of transactions in the week before and in the week after customers first activate their gambling block.
https://www.gamcare.org.uk/app/uploads/2020/09/GamCare-Core-Messages-and-Self-Help-Toolkit.p df 61 Evans, J., Collard, S., & Fitch, C. (2020). A blueprint for bank card gambling blockers. Available from: https://about.gambleaware.org/media/2217/bri-uni-gambling-a4-06_07_2020_final_report.pdf
Per customer daily averages for ATM
transactions
Below-average gamblers
Above-average gamblers All gamblers
N = 260 N = 93 N = 353
Mean SD Mean SD Mean SD
No. and % of customers in segment with an ATM transaction
In week before 73 45% 38 41% 111 44%
On day of activation 19 12% 10 11% 29 11%
In week after 69 43% 44 48% 113 45%
Average value of withdrawals (£)
In week before 3.5 9.9 6.0 13.4 4.2 10.9
In week after 4.5 16.3 6.6 16.0 5.0 16.2
Over all days on record 3.5 5.7 5.6 6.3 4.1 5.9
Average no. of withdrawals
In week before 0.07 0.14 0.10 0.18 0.08 0.15

The Behavioural Insights Team / Gambling bank transaction analysis, Part 1 - Monzo 47
Notes : As the transaction data recorded daily spend in intervals of £10, values for mean and standard deviation (SD) are calculated using the interval midpoint. Sample is N = 353 gamblers who have used the gambling block and who have daily transaction records available for the week before and the week after they activated the block.
Average value of withdrawals, in particular, remains almost identical prior to and after Monzo customers activate the block. This is perhaps the strongest indicator that block users are not pivoting towards maintaining their prior gambling behaviour through using cash, however, the possibility remains that people may still be able to gamble via other bank accounts, or other electronic means (e.g. Paypal).
7.4 Characteristic profiles — What Theme 4 tells us about Monzo customers Table 7.4.1 outlines the key findings observed under our fourth research theme across each of our characteristic gambler profiles.
Table 7.4.1: Characteristic profiles - what Theme 4 tells us
In week after 0.09 0.21 0.13 0.19 0.10 0.21
Over all days on record 0.07 0.11 0.11 0.12 0.08 0.12
Profile 1 Non-gamblers
(89% of sample, n = 8380)
Profile 2 Below-average gamblers (9% of sample, n = 848)
Profile 3 Above-average gamblers (2% of sample, n = 182)
Use of gambling block
●44% enabled the block at least once ●Enable the block for an average of
72% of days ●1% of block users in this group have
subsequently lifted the block at least once
●33% of those who enabled the block at least once were below-average gamblers
●Enabled the block for an average of 45% of days
●33% of block users in this group have lifted the block at least once
●25% have gambled on the day of enabling the block
●Gambling deposits in the week prior to enabling the block was six times higher than average.
●Average daily gambling deposits went from £13 in the week before enabling the block to £0 in the week following
●55% of those who enabled the block at least once were above-average gamblers
●Enabled the block for an average of 34% of days
●43% of block users in this group have lifted the block at least once
●46% have gambled on the days of enabling the block
●Gambling deposits in the week prior to enabling the block was three times higher than average.
●Average daily gambling deposits went from £70 in the week before enabling the block to £4 in the week after

The Behavioural Insights Team / Gambling bank transaction analysis, Part 1 - Monzo 48
8. Conclusion and cross-cutting themes
We set out to better understand the kinds of financial consequences experienced by customers who gamble, and to shed new light on what bank transaction data can, and can’t, tell us about gambling behaviour. This type of analysis has only started to be explored recently as a research tool. 62
While we have demonstrated the feasibility of bank transaction data as a tool for gambling behaviour research, we encountered a number of limitations. Given this and the exploratory nature of our study, we do not consider our findings to be conclusive, but rather, early steps towards answering our research questions. Our findings can, nevertheless, offer some initial insights and ideas for further work.
What does this data tell us about how to tackle gambing harms? Customers may benefit from more tailored controls on their gambling spend Above-average gamblers, in particular, were markedly different in the extent of their gambling behaviour. They spent considerably more on gambling per month; gambled more frequently, spent more per gambling transaction; and had a larger overall proportion of their total monthly spend accounted for by gambling (Themes 1 and 2).
Such customers may benefit from more targeted, gambling-specific spending controls. For example, being able to set a maximum number of daily or weekly gambling transactions allowed, or maximum daily/weekly spend. Where limits are reached, additional friction could be built into the transaction process.
Gambling behaviour could be leveraged to encourage saving behaviour Findings for Theme 3 show similar levels of engagement across groups with Monzo’s savings ‘pots’, but clear contrasts in saving behaviour. For example, gamblers in our sample were more likely than non-gamblers to use Monzo’s internal savings pots function (non-interest earning), but tended to have a lower internal savings pot balance.
The more tailored spending controls noted above could be further augmented by building in an additional active choice asking customers if they would prefer to save instead. For instance, for gambling transactions above average expenditure, customers could be served a prompt asking: “To continue with this transaction tap here, or to save it into your pot tap here”.
62 See for example: Nature Human Behaviour. (2021) The association between gambling and financial, social and health outcomes in big financial data. Available from: https://www.nature.com/articles/s41562-020-01045-w

The Behavioural Insights Team / Gambling bank transaction analysis, Part 1 - Monzo 49
There is scope to test the impact of friction and flexibility in turning off the gambling block The findings show there are upticks in gambling behaviour Thursday – Saturday, and in the latter half of month (Theme 1); 35% of above-average gamblers also lift the gambling block for periods longer than a month (Theme 4). Gambling block functions currently offered by banks remain relatively simple to turn off, and offer little flexibility in how they operate. ‘Softer’ blocking functions could be offered whereby customers can elect to block transactions for certain periods (e.g. Thursdays – Saturdays).
As well as existing ‘cooldown’ periods — the time lag between a customer choosing to deactivate a block, and the bank re-enabling gambling transactions — phased cooldowns could be offered. For example, people could choose to lift the block for lower-cost gambling transactions only, or for certain time periods (e.g. Sunday – Wednesday, or between certain times of day).
What are the benefits and limitations of using bank transaction data?
We discussed in Chapter 2 the potential advantages of using bank transaction data. The ability to see an array of deposits across multiple online gambling operators, as well as broader financial status and spending can give a fuller picture of gambling behaviours.
The initial insights gained from our analysis of Monzo customer data are encouraging in terms of demonstrating a role for using bank transaction data to predict, identify, and help to mitigate gambling harms. We did, however, encounter limitations. While bank transaction data has the advantage of capturing deposits made across multiple online operators, records from a single bank may not reflect an individual’s gambling spend if they gamble using another account, or use other electronic payment methods to gamble (such as e-wallets). Transaction records also miss cash-based gambling.
Further, analysis of data from a single bank reflects only the kinds of transactions an individual makes using that account. Using data from a digital-only bank, as we did here, meant that we were unable to address research questions around income or overdraft use as only a small proportion of customers use digital-only banks as their main accounts.
Our relatively small sample of customers (10,000 out of a total customer base of around 4.3m Monzo customers) and timespan for transaction records (1.5 years) mean that we approach the wider applicability of our findings with caution.
Overall, this feasibility study suggests that:
● Understanding the relationships between gambling spending and broader financial
circumstances can offer new insights into predicting, identifying, and helping to mitigate gambling harms.
● As real-world datasets, bank transaction data has strong potential as a source of research information.

The Behavioural Insights Team / Gambling bank transaction analysis, Part 1 - Monzo 50
● Data from a single bank is unlikely to offer a full picture. Work across different types of banks, with different customer profiles would strengthen the basis for any recommendations.
● There is wide scope for individual banks to use the data they hold as a basis for developing and testing new features to identify and help to mitigate gambling harms.
Given the important role that banks have in preserving and enhancing the financial wellbeing of their customers, we welcome and commend Monzo’s partnership on this work and recommend that banks continue to work collaboratively with gambling researchers to the benefit of individuals who experience gambling harms, and society as a whole.
This concludes Part 1 of our report into the use of bank transaction data as a means to analyse gambling behaviour. Part 2 of this report — available alongside Part 1 — details our remaining work on this project, completed in partnership with HSBC UK.
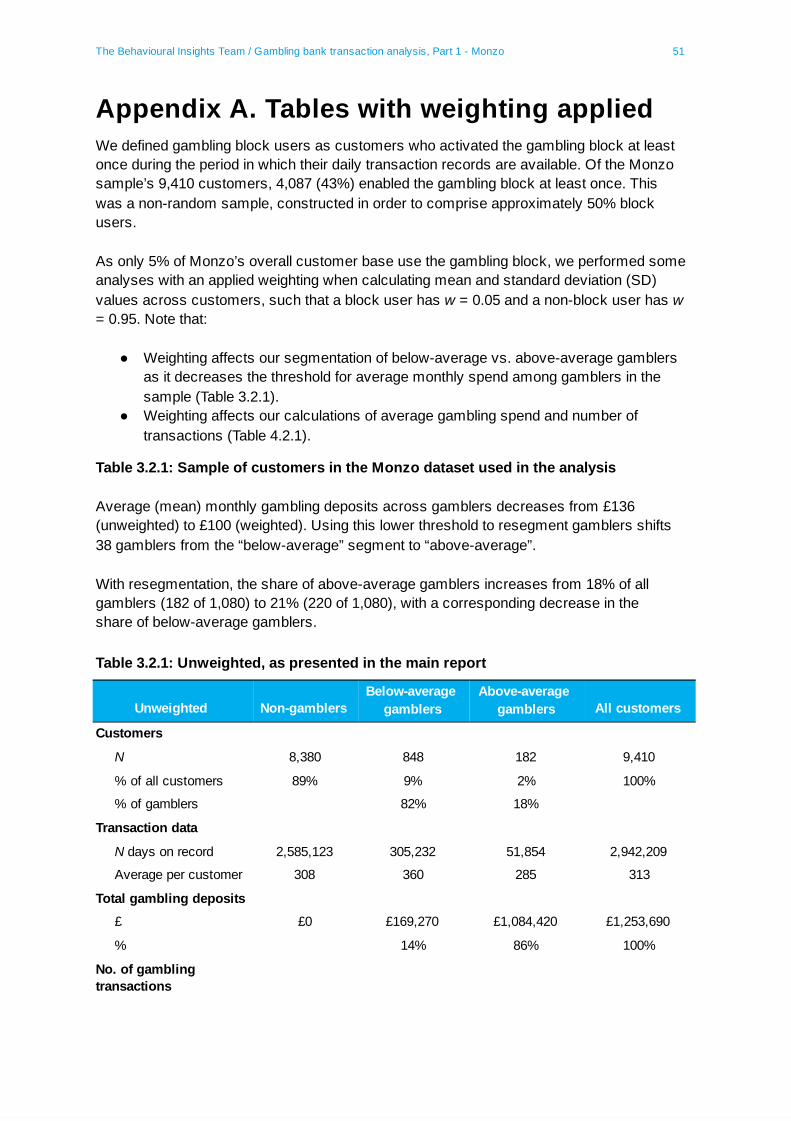
The Behavioural Insights Team / Gambling bank transaction analysis, Part 1 - Monzo 51
Appendix A. Tables with weighting applied We defined gambling block users as customers who activated the gambling block at least once during the period in which their daily transaction records are available. Of the Monzo sample’s 9,410 customers, 4,087 (43%) enabled the gambling block at least once. This was a non-random sample, constructed in order to comprise approximately 50% block users.
As only 5% of Monzo’s overall customer base use the gambling block, we performed some analyses with an applied weighting when calculating mean and standard deviation (SD) values across customers, such that a block user has w = 0.05 and a non-block user has w = 0.95. Note that:
● Weighting affects our segmentation of below-average vs. above-average gamblers
as it decreases the threshold for average monthly spend among gamblers in the sample (Table 3.2.1).
● Weighting affects our calculations of average gambling spend and number of transactions (Table 4.2.1).
Table 3.2.1: Sample of customers in the Monzo dataset used in the analysis
Average (mean) monthly gambling deposits across gamblers decreases from £136 (unweighted) to £100 (weighted). Using this lower threshold to resegment gamblers shifts 38 gamblers from the “below-average” segment to “above-average”.
With resegmentation, the share of above-average gamblers increases from 18% of all gamblers (182 of 1,080) to 21% (220 of 1,080), with a corresponding decrease in the share of below-average gamblers.
Table 3.2.1: Unweighted, as presented in the main report
Unweighted Non-gamblers Below-average
gamblers Above-average
gamblers All customers
Customers
N 8,380 848 182 9,410
% of all customers 89% 9% 2% 100%
% of gamblers 82% 18%
Transaction data
N days on record 2,585,123 305,232 51,854 2,942,209
Average per customer 308 360 285 313
Total gambling deposits
£ £0 £169,270 £1,084,420 £1,253,690
% 14% 86% 100%
No. of gambling transactions

The Behavioural Insights Team / Gambling bank transaction analysis, Part 1 - Monzo 52
Table 3.2.1w: Weighted and resegmented (new threshold for average monthly gambling spend based on the weighted mean)
Table A.1: Unweighted vs. weighted segments by block use.
N transactions 0 12,732 32,157 44,889
% 28% 72% 100%
Weighted and resegmented Non-gamblers
Below-average gamblers
Above-average gamblers All customers
Customers
N 8,380 810 220 9,410
% of all customers 89% 9% 2% 100%
% of gamblers 79% 21%
Transaction data
N days on record 2,585,123 291,632 65,454 2,942,209
Average per customer 308 360 298 313
Total gambling deposits
£ £0 £114,690 £1,139,000 £1,253,690
% 9% 91% 100%
No. of gambling transactions
N transactions 0 8,856 36,033 44,889
% 20% 80% 100%
Gamblers who are block users
Gamblers who are not block
users All gamblers
N = 385 N = 645 N = 1,030 N % N % N %
Segment Below-average 284 74% 564 87% 848 82%
Above-average 101 26% 81 13% 182 18% Resegment after weighting
Below-average 263 68% 547 85% 810 79%
Above-average 122 32% 98 15% 220 21%

The Behavioural Insights Team / Gambling bank transaction analysis, Part 1 - Monzo 53
Table A.2: Gambling block use by segment (threshold is unweighted average monthly gambling spend among gamblers)
Table A.3: Gambling block use by resegmentation (new threshold is weighted average monthly gambling spend among gamblers).
Table 4.2.1: Average gambling deposits (£) and number of transactions for gamblers in our Monzo sample.
After resegmenting, Table 4.2.1w includes weights when calculating mean and SD values for average gambling deposits and number of transactions by segment.
Overall, gamblers made an average of just under five (weighted: just under four) gambling transactions a month. Focusing specifically on days when gambling occurred, the average spend per gambling transaction amounted to £22 (weighted: £18), with gambling typically occurring on 6% (weighted: 6%) of all days on record.
The weighted analysis yields lower levels of average monthly spend and number of transactions than the unweighted analysis because block users tend to gamble more heavily, e.g. compared to gamblers who are not block users, gamblers who are block users have an average monthly spend that is twice as high (£200/month vs. £97/month over all days on record; Table 4.2.1wb).
Comparing average monthly spend (over all days on record) between below-average and above-average gamblers:
● Unweighted analysis: Above-average gamblers’ average monthly spend was 38
times’ higher (£684/month vs. £18/month). ● Weighted analysis: Above-average gamblers’ average monthly spend is 55 times’
higher (£582/month vs. £11/month). This factor (55x) is larger than in the
Gambling block use
Below-average gamblers
Above-average gamblers All gamblers
N = 848 N = 182 N = 1,030
N % N % N %
Block users 284 33% 101 55% 385 37%
Non-block users 564 67% 81 45% 645 63%
Gambling block use
Below-average gamblers
Above-average gamblers All gamblers
N = 810 N = 220 N = 1,030
Mean SD Mean SD Mean SD
Block users 263 32% 122 55% 385 37%
Non-block users 547 68% 98 45% 645 63%

The Behavioural Insights Team / Gambling bank transaction analysis, Part 1 - Monzo 54
unweighted analysis (38x), primarily because the lower segmentation threshold (average monthly spend among gamblers is £100 weighted vs. £136 unweighted) reduces below-average gamblers’ average monthly spend from £18 to £11.
Table 4.2.1: Unweighted, as presented in the main report
Per customer averages (unweighted)
Below-average gamblers
Above-average gamblers All gamblers
N = 848 N = 182 N = 1,030
Mean SD Mean SD Mean SD
Average deposits (£) (across all days on record)
Monthly 18 30 685 1,043 136 507
Weekly 4 7 164 244 33 119
Daily 0.6 1.1 23.5 34.9 4.7 17.1
Average deposits (£) (across only days when gambled)
Monthly 58 98 1,148 1,711 250 834
Weekly 37 70 418 566 104 286
Daily 25 248 168 248 50 125
Per transaction 15 20 55 83 22 42
Average no. of transactions (across all days on record)
Monthly 1.4 2.6 19.9 18.4 4.7 10.7
Weekly 0.3 0.6 4.8 4.7 1.14 2.66
Daily 0.05 0.09 0.70 0.67 0.16 0.38
Average no. of transactions (across only days when gambled)
Monthly 4.1 6.1 27.8 19.8 8.3 13.5
Weekly 2.3 2.7 9.4 5.6 3.6 4.4
Daily 1.6 1.2 3.3 1.5 1.9 1.4
Average % on record with gambling
Months 27% 23% 68% 26% 34% 28%
Weeks 12% 14% 48% 27% 18% 22%
Days 3% 5% 22% 17% 6% 11%

The Behavioural Insights Team / Gambling bank transaction analysis, Part 1 - Monzo 55
Table 4.2.1w: Weighted and resegmented.
Per customer averages (block users & non-users
respectively weighted 0.05 & 0.95; resegmented)
Below-average gamblers
Above-average gamblers All gamblers
N = 810 N = 220 N = 1,030
Mean SD Mean SD Mean SD
Average deposits (£) (acoss all day on record)
Monthly 11 18 582 856 100 397
Weekly 3 5 141 201 24 94
Daily 0.4 0.7 20.3 28.7 3.5 13.5
Average deposits (£) (across only days when gambled)
Monthly 35 58 867 1,377 166 624
Weekly 25 42 314 479 70 220
Daily 19 32 121 180 35 85
Per transaction 13 19 44 57 18 31
Average no. of transactions (across all days on record)
Monthly 0.9 1.7 20.0 18.7 3.9 10.3
Weekly 0.2 0.4 5.0 4.8 0.97 2.60
Daily 0.03 0.06 0.71 0.70 0.14 0.38
Average no. of transactions (across only days when gambled)
Monthly 2.8 3.3 25.7 19.9 6.4 11.9
Weekly 1.8 1.5 8.5 5.7 2.8 3.6
Daily 1.3 0.7 2.9 1.4 1.6 1.0
Average % on record in with gambling
Months 26% 23% 74% 24% 34% 29%
Weeks 10% 13% 53% 26% 17% 22%
Days 2% 4% 24% 17% 6% 11%

The Behavioural Insights Team / Gambling bank transaction analysis, Part 1 - Monzo 56
Table 4.2.1wa: Categorised by block use.
Per customer averages (categorised by block use)
Gamblers who are block users
Gamblers who are not block
users All gamblers
N = 385 N = 645 N = 1,030
Mean SD Mean SD Mean SD
Average deposits (£) (across all days on record)
Monthly 200 658 97 386 100 397
Weekly 48 155 24 91 24 94
Daily 6.8 22.1 3.4 13.1 3.5 13.5
Average deposits (£) (across only days when gambled)
Monthly 404 1,105 159 602 166 624
Weekly 166 370 67 213 70 220
Daily 78 173 33 81 35 85
Per transaction 28 57 18 29 18 31
Average no. of transactions (all days on record)
Monthly 6.0 11.4 3.9 10.2 3.9 10.3
Weekly 1.4 2.7 1.0 2.6 0.97 2.60
Daily 0.21 0.39 0.14 0.38 0.14 0.38
Average no. of transactions (across only days when gambled)
Monthly 11.7 15.4 6.2 11.7 6.4 11.9
Weekly 5.0 5.2 2.8 3.5 2.8 3.6
Daily 2.4 1.8 1.6 1.0 1.6 1.0
Average % on record with gambling
Months 35% 27% 34% 29% 34% 29%
Weeks 20% 22% 17% 22% 17% 22%
Days 7% 11% 6% 11% 6% 11%

The Behavioural Insights Team / Gambling bank transaction analysis, Part 1 - Monzo 57
Table 5.1.2: Average monthly spend in gambling and non-gambling categories across months with, and without gambling
Table 5.1.2: Unweighted, as presented in the main report
Table 5.1.2w: Weighted and resegmented.
Average monthly deposits (£)
Below-average gamblers ( N = 848)
Above-average gamblers ( N = 182)
All gamblers ( N = 1,030)
Mean SD Mean SD Mean SD
Gambling deposits In all months 18 30 685 1,043 136 507
In months with gambling 58 98 1,148 1,711 250 834 Non-gambling spend
In all months 583 762 685 735 601 758
In months with gambling 675 869 785 871 694 870 In months without gambling 513 610 419 579 498 606
Average monthly deposits (£) (gambling block users & non-users respectively weighted 0.05 & 0.95;
resegmented)
Below-average gamblers ( N = 810)
Above-average gamblers ( N = 220)
All gamblers ( N = 1,030)
Mean SD Mean SD Mean SD
Gambling deposits In all months 11 18 582 856 100 397
In months with gambling 35 58 867 1,377 166 624 Non-gambling spend
In all months 526 765 597 625 537 745 In months with gambling 639 898 691 740 647 875 In months without gambling 446 496 287 458 425 494

The Behavioural Insights Team / Gambling bank transaction analysis, Part 1 - Monzo 58
Table 6.1.1: Proportion of customers who have used internal and external savings pots, by customer segment.
Table 6.1.1: Unweighted, as presented in main report
Table 6.1.1w: Weighted and resegmented.
Non-gamblers
( N = 8.380) All gamblers (N = 1,030)
Below-average gamblers (N = 848)
Above-average gamblers (N = 182)
Internal pots
Have used 37% 59% 59% 59%
Have not used 63% 41% 41% 41%
External pots
Have used 6% 8% 8% 6%
Have not used 94% 92% 92% 94%
Non-gamblers
(N = 8,380) All gamblers (N = 1,030)
Below-average gamblers (N = 810)
Above-average gamblers (N = 220)
Internal pots
Have used 30% 54% 54% 54%
Have not used 70% 46% 46% 46%
External pots
Have used 4% 6% 7% 2%
Have not used 96% 94% 93% 98%

The Behavioural Insights Team / Gambling bank transaction analysis, Part 1 - Monzo 59
Appendix B. Tables with median values As Section 3.2 notes, our data contains a small number of Monzo customers who make very high average gambling deposits that skew mean values upward. We report mean values in the main report as these spenders provide valid and informative data points to characterise spending behaviour between segments, whereas median values are less illustrative of such skewness in the data.
For completeness, we reproduce all tables reporting mean values in the main text below but with median values also included. While the medians tend to be much lower the means, this does not change the report’s overall narrative, nor does it change the outcomes of any descriptive comparisons made in the text based on observations from the means.
Table 4.2.1: Average gambling spend (£) and number of transactions for gamblers in our Monzo sample
Per customer averages
Below-average gamblers
Above-average gamblers All gamblers
N = 848 N = 182 N = 1,030
Median Mean Median Mean Median Mean
Average deposits (£) (across all days on record)
Monthly 4 18 389 685 7 136
Weekly 1 4 95 164 2 33
Daily 0.1 0.6 13.5 23.5 0.3 4.7
Average deposits (£) (across only days when gambled)
Monthly 19 58 629 1,148 30 250
Weekly 15 37 226 418 20 104
Daily 12 25 85 168 15 50
Per transaction 8 15 29 55 10 22
Average no. of transactions (across all days on record)
Monthly 0.4 1.4 14.7 19.9 0.7 4.7
Weekly 0.1 0.3 3.5 4.8 0.2 1.1
Daily 0.01 0.05 0.50 0.70 0.16 0.16
Average no. of transactions (across only days when gambled)
Monthly 2.0 4.1 24.2 27.8 2.5 8.3
Weekly 1.3 2.3 8.5 9.4 1.9 3.6

The Behavioural Insights Team / Gambling bank transaction analysis, Part 1 - Monzo 60
Table 5.1.1: Average monthly spend across categories by customer segment
Table 5.1.2: Average monthly spend in gambling and non-gambling categories across months with, and without gambling
Daily 1.0 1.6 2.9 3.3 1.3 1.9
Average % on record in which they did gamble
Months 19% 27% 72% 68% 24% 34%
Weeks 6% 12% 41% 48% 9% 18%
Days 1% 3% 16% 22% 2% 6%
Average monthly spend (£)
Non-gamblers ( N = 8,380)
All gamblers ( N = 1,030)
Below-average gamblers ( N = 848)
Above-average gamblers ( N = 182)
Median Mean Median Mean Median Mean Median Mean
Gambling 0 0 7 136 4 18 389 685
ATM 2 28 28 87 24 74 81 151
Bills 0 9 3 -6 3 -4 5 -14
Eating out 22 45 48 73 50 76 42 58
Entertainment 6 19 39 103 29 48 203 361
Expenses 0 0 0 0 0 0 0 -2
General 4 23 14 40 13 40 15 40
Groceries 22 49 54 77 54 75 54 85
Shopping 13 43 33 78 33 77 35 80
Total 171 325 509 737 414 601 1,076 1,370
Average monthly deposits (£)
Below-average gamblers ( N = 848)
Above-average gamblers ( N = 182)
All gamblers ( N = 1,030)
Median Mean Median Mean Median Mean
Gambling deposits
In all months 4 18 389 685 7 136
In months with gambling 19 58 629 1,148 30 250
Non-gambling spend
In all months 400 583 538 685 416 601
In months with gambling 460 675 562 785 477 694
In months without gambling 346 513 185 419 319 498

The Behavioural Insights Team / Gambling bank transaction analysis, Part 1 - Monzo 61
Table 6.2.1: Average monthly balance and transfers in customers’ current accounts and savings pots, by customer segment
Monthly averages per customer
Non-gamblers ( N = 8,380)
All gamblers ( N = 1,030)
Below-average gamblers ( N = 842)
Above-average gamblers ( N = 188)
Median Mean Median Mean Median Mean Median Mean
Current account
Balance 123 192 124 163 124 166 117 153
Transfers 5 19 5 6 5 8 4 -6
Ratio of average monthly transfers to gambling spend n/a n/a 0 7 1 8 0 0
Internal pots (if ever used)
% customers 37% 59% 59% 61%
Balance 92 206 85 166 89 166 60 163
Transfers 7 28 7 20 7 22 4 11
Ratio of average monthly transfers to gambling spend n/a n/a 1 10 1 13 0.01 0.04
No. of pots 0.69 0.79 0.58 0.74 0.63 0.78 0.35 0.54
External pots (if ever used)
% customers 6% 8% 9% 5%
Balance 196 1,093 118 556 155 621 25 78
Transfers 43 217 12 83 13 92 6 20
Ratio of average monthly transfers to gambling spend n/a n/a 1 37 2 42 0.0 0.1
No. of pots 0.30 0.47 0.19 0.25 0.20 0.26 0.11 0.23

The Behavioural Insights Team / Gambling bank transaction analysis, Part 1 - Monzo 62
Table 7.2.2: Average daily gambling deposits and number of gambling transactions in the week before and in the week after customers first activate their gambling block
Table 7.3.1: Average daily ATM spend and number of transactions in the week before and in the week after customers first activate their gambling block
Per customer daily averages for gambling
transactions
Below-average gamblers
Above-average gamblers All gamblers
N = 260 N = 93 N = 353
Median Mean Median Mean Median Mean
No. and % of customers in segment who gambled
In week before 92 58% 68 58% 160 58%
On day of activation 62 39% 40 34% 102 37%
In week after 4 3% 10 8% 14 5%
Average deposits (£)
In week before 0.0 5.4 20.7 71.8 0.0 22.9
In week after 0.0 0.0 0.0 3.8 0.0 1.0
Over all days on record 0.3 0.9 12.9 23.6 0.8 6.9
Average no. of transactions
In week before 0.00 0.33 0.71 1.41 0.00 0.61
In week after 0.00 0.00 0.00 0.11 0.00 0.03
Over all days on record 0.03 0.06 0.43 0.58 0.06 0.20
Per customer daily averages for ATM
transactions
Below-average gamblers
Above-average gamblers All gamblers
N = 260 N = 93 N = 353
Median Mean Median Mean Median Mean
No. and % of customers in segment with an ATM transaction
In week before 73 45% 38 41% 111 44%
On day of activation 19 12% 10 11% 29 11%
In week after 69 43% 44 48% 113 45%
Average amount of withdrawals (£)
In week before 0.0 3.5 0.0 6.0 0.0 4.2
In week after 0.0 4.5 0.0 6.6 0.0 5.0
Over all days on record 1.4 3.5 3.8 5.6 1.9 4.1

The Behavioural Insights Team / Gambling bank transaction analysis, Part 1 - Monzo 63
Average no. of withdrawals
In week before 0.00 0.07 0.00 0.10 0.00 0.08
In week after 0.00 0.09 0.00 0.13 0.00 0.10
Over all days on record 0.04 0.07 0.06 0.11 0.05 0.08