Embed Size (px)
Citation preview
September 2003 Preliminary draft
EVALUATION OF THE BARBADOS SOLAR WATER HEATING EXPERIENCE
Bob Perlack Environmental Sciences Division
Oak Ridge National Laboratory, USA
William Hinds Renewable Energy Center
Ministry of Energy and Public Utilities, Barbados Background and Purpose USAID has embarked on a multi-year strategy to assist Caribbean region countries. Two key objectives of this strategy are to facilitate economic growth through initiatives that seek to expand tourism and exports of non-traditional products and to improve environmental management through the promotion of best management practices and compliance as well as securing financing to help implement the improvements. In carrying out the objectives of the overall strategy, USAID developed an energy component targeted in the near-term at: • facilitating access to financing to implement cost-effective energy efficiency improvements
and renewable energy applications, • expanding export markets for renewable energy technologies (RETs) by improving the
competitiveness of energy sector firms, and • building institutional capacity to conduct sustainable energy system analysis, training, and
implementation. One of the initial activities to expand RET export markets is to assess the experience Barbados has had with solar water heaters (SWHs). This report attempts to document this experience by identifying net economic benefits and lessons learned. The next section of this report provides a brief overview of the energy situation in Barbados. This section is followed by summary of the diffusion of SWHs in Barbados. It is followed by an evaluation of the costs and benefits of the SWH incentives and an evaluation of SWH from the perspective of the homeowner. The final section provides a summary of findings and lessons learned. Overview of Energy Situation in Barbados Barbados has a total installed electricity generation capacity of 186 MW – 40 MW of steam, 64 MW of gas, and 82 MW of diesel.1 According to Barbados Light and Power (BL&P) the 1 The cement and sugar industries using fuel oil and bagasse also generate power and sell excess to the grid.
1

September 2003 Preliminary draft
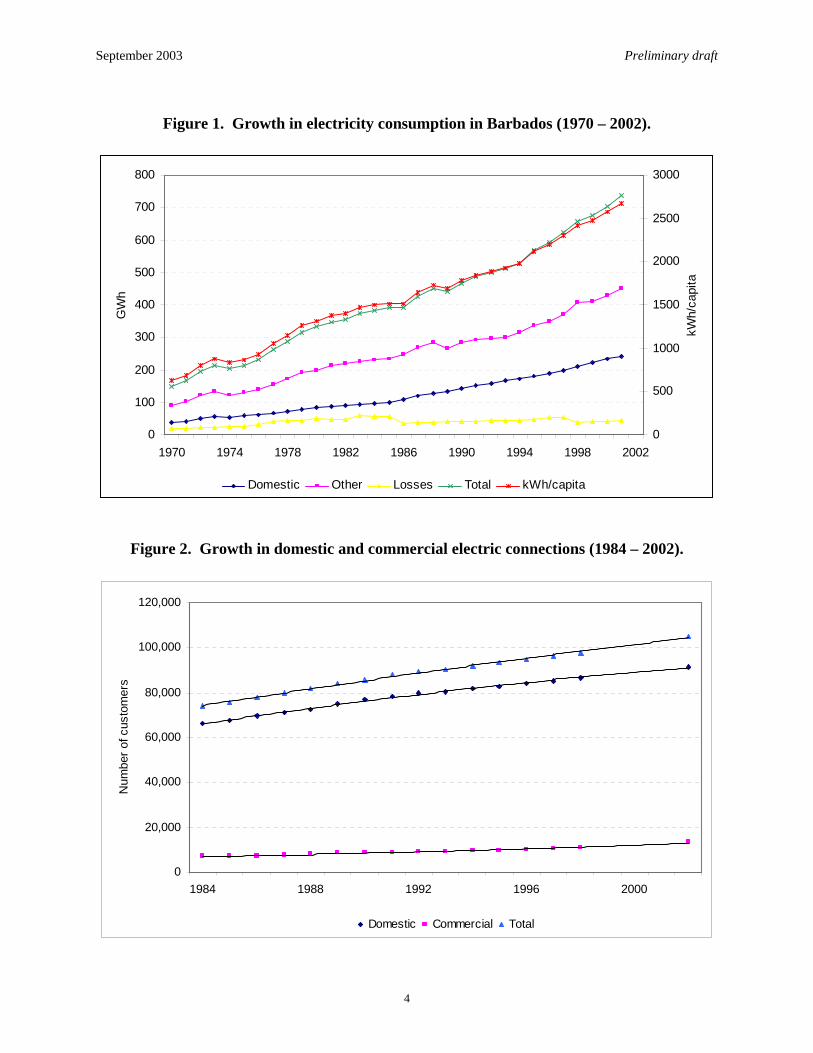
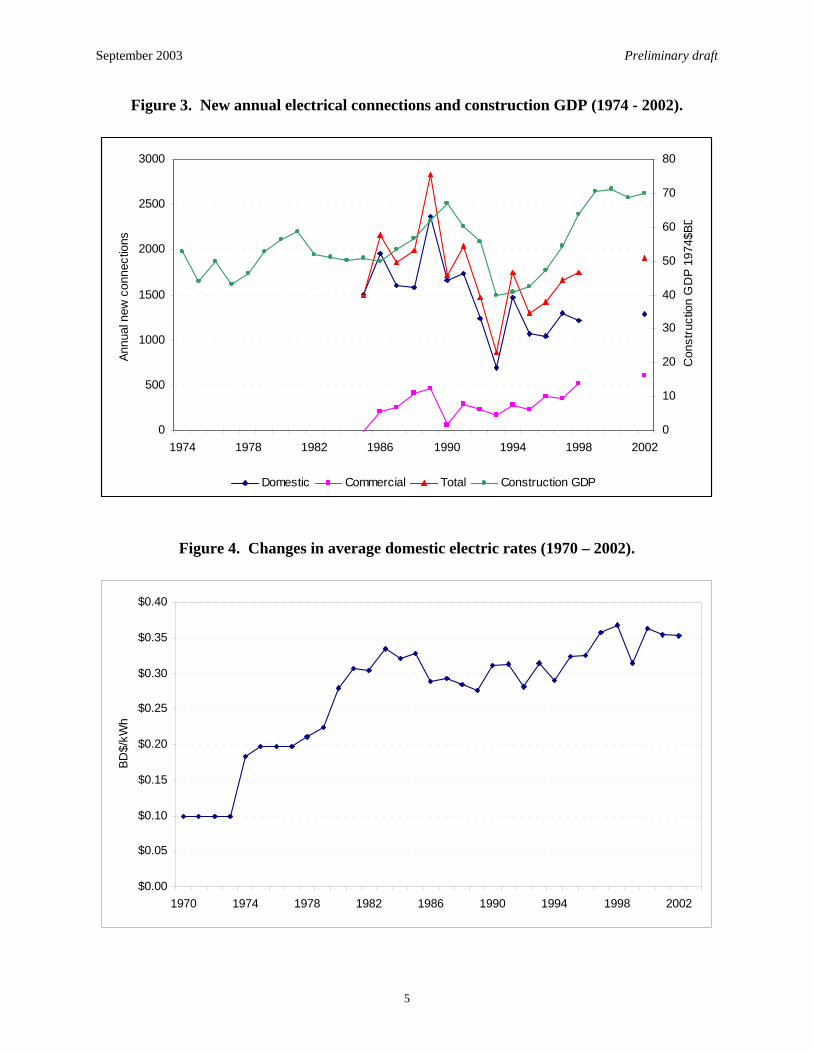
minimum baseload demand is slightly less than 80 MWh. Demand increases during the day as use of air conditioners rise, commercial businesses open, and households use appliances. Demand peaks at about 120 MWh in a typical day.2 The daytime peak is fairly steady and predictable throughout the year and generally lasts for 12 to 14 hours. Since BL&P is the sole electric utility on the island and there are no alternatives should generating units be forced to shut down, there is a relatively high level of installed capacity relative to peak demand. Electricity demand in the domestic and commercial sectors has grown steadily since the 1970s (Figure 1). In recent years, electricity demand has grown at an average annual rate of more the 4%. Currently, total annual electricity consumption is about 735 GWh or slightly less than 2700 kWh per capita (Figure 1). This consumption is higher than other island countries within the region with the exception of Trinidad and Tobago. Electrical connections have also increased steadily with population and the expansion of the economy (Figure 2). Since the mid-1980s, new domestic and commercial connections have increased at annual rates of 2.5% and 3.3% for domestic and commercial customers, respectively. However, new domestic and commercial electricity connections are somewhat volatile from year to year and generally follow construction spending. BL&P annual connections are shown in Figure 3. The data show BL&P adding about 1300 new domestic connections and 600 commercial connections each year Electric rates charged by BL&P include a base rate and a fuel adjustment charge that varies monthly and is indexed to the world price of Brent Sea crude oil. With the exception of the monthly fuel charge, basic rate structures have remained fairly stable in Barbados. Figure 4 shows the historical average domestic electric charges for domestic customers. The variation in the average domestic rates is almost exclusively due to changes in the fuel charge. Currently, domestic consumers pay about $BD0.32/kWh or roughly $US0.16/kWh.3
Barbados currently produces slightly more than 1,000 barrels of oil and 1.7 million cubic feet of natural gas per day. Plans are underway to expand production of oil and gas by about 50%.4 All domestically produced oil is exported to Trinidad where it is refined and shipped back as refined product. For all practical purposes, Barbados relies on imported refined product to meet nearly all (about 95%) of its power and transport fuel needs. Less than 15% of the refined product comes from domestic oil production.5 Domestically produced natural gas provides less than 5% of total energy needs.
2 Lawson K., S. Kolar, and C. Kelly, A Regional Approach to Developing Multi-Project Baselines for the Power Sector, Center for Clean Air Policy, Caribbean CDM Forum, November 2000 3 Currency conversion is $BD1.95 = $US1.00 4 Wood, Anthony P., CARILEC Engineers Conference and Supply Chain Seminar, Barbados, July 29, 2003. 5 Energy Information Administration (EIA) -- http://www.eia.doe.gov/emeu/world/country/cntry_BB.html
2
September 2003 Preliminary draft
Given its reliance of imported oil, the Government of Barbados (GOB) has long been an advocate of developing renewable sources of energy.6 However, efforts to develop renewable energy sources have generally not met expectations with the exception of the SWH program. The next section of this provides a much more in-depth chronology of the growth of the SWH industry in Barbados.
6 BL&P has pursued the development of renewable energy through a number of demonstrations of photovoltaic power systems, wind electric energy, and through informal purchases of power from sugar mills.
3
September 2003 Preliminary draft
Figure 1. Growth in electricity consumption in Barbados (1970 – 2002).
0
100
200
300
400
500
600
700
800
1970 1974 1978 1982 1986 1990 1994 1998 2002
GW
h
0
500
1000
1500
2000
2500
3000
kWh/
capi
ta
Domestic Other Losses Total kWh/capita
Figure 2. Growth in domestic and commercial electric connections (1984 – 2002).
0
20,000
40,000
60,000
80,000
100,000
120,000
1984 1988 1992 1996 2000
Num
ber o
f cus
tom
ers
Domestic Commercial Total
4
September 2003 Preliminary draft
Figure 3. New annual electrical connections and construction GDP (1974 - 2002).
0
500
1000
1500
2000
2500
3000
1974 1978 1982 1986 1990 1994 1998 2002
Annu
al n
ew c
onne
ctio
ns
0
10
20
30
40
50
60
70
80
Con
stru
ctio
n G
DP
1974
$BD
Domestic Commercial Total Construction GDP
Figure 4. Changes in average domestic electric rates (1970 – 2002).
$0.00
$0.05
$0.10
$0.15
$0.20
$0.25
$0.30
$0.35
$0.40
1970 1974 1978 1982 1986 1990 1994 1998 2002
BD$/
kWh
5
September 2003 Preliminary draft
Experience and Diffusion of Solar Water Heaters in Barbados The Barbados SWH program is unparalleled in the Caribbean. According to Ellis (2000), the SWH industry in Barbados started as a venture initiated by Canon Andrew Hatch to provide jobs for boys at one of the local churches.7 Andrew Hatch was also an associate director of the Christian Action for Development in the Eastern Caribbean (CADEC), an ecumenical organization that assisted with development projects. To start the assembly of the SWHs CADEC provided a $US4200 loan to Solar Dynamics. The critical expertise to develop the solar water heating concept into marketable and functional product was provided by James Husbands. At about the same time, Prime Minister Tom Adams was investigating alternatives to imported oil as a way to reduce the country’s dependency on imports. He installed a Solar Dynamics SWH and was very favorably impressed with the performance and the potential energy savings. This favorable impression led to his government’s support of the initial fiscal incentives to help stimulate the SWH market. Shortly afterward, a second company, SunPower, under the direction of Peter Hoyos, entered the SWH market.8 In 1981, a third company, AquaSol, founded by Vincent McClean entered the Barbados SWH market. Virtually all of the SWHs in Barbados operate on the basis of a thermosyphon system.9 The thermosyphon system relies on natural convection to circulate water through the collector and to the storage tank. For this system to operate, the tank is installed above the collector. As the solar collector heats the water, it rises into the tank. Cooler water in the tank flows down tubes to the bottom of the collector creating the circulation. A typical thermosyphon system consists of a roof-mounted solar collector, roof-mounted tank, associated plumbing, and a backup electrical heating system in the tank. System sizing guidelines suggest an allocation of 15 to 20 gallons of hot water per person per day. Depending on the size of the collector, these systems can heat water to about 130 to 140 °F. Currently, there are approximately 35,000 SWH units installed on the island. Over 25,000 systems are installed in homes and the remainder in hotels and other tourist accommodations. The current Barbados market is estimated at about 1500 systems per year split unevenly among three companies – Solar Dynamics, SunPower, and AquaSol. Solar Dynamics has about 55-60% of the Barbadian market with the remaining amount divided more or less equally between 7 See David Ellis, “In Hot Water – And Liking It,” Business Barbados, May 7, 2000. 8 Ellis mentions that the new and under-capitalized Solar Dynamics was under pressure by another company to sell shares in exchange for needed financial resources. The resistance of Solar Dynamics to sell shares led to the development of the competing manufacturer (SunPower).
6

September 2003 Preliminary draft
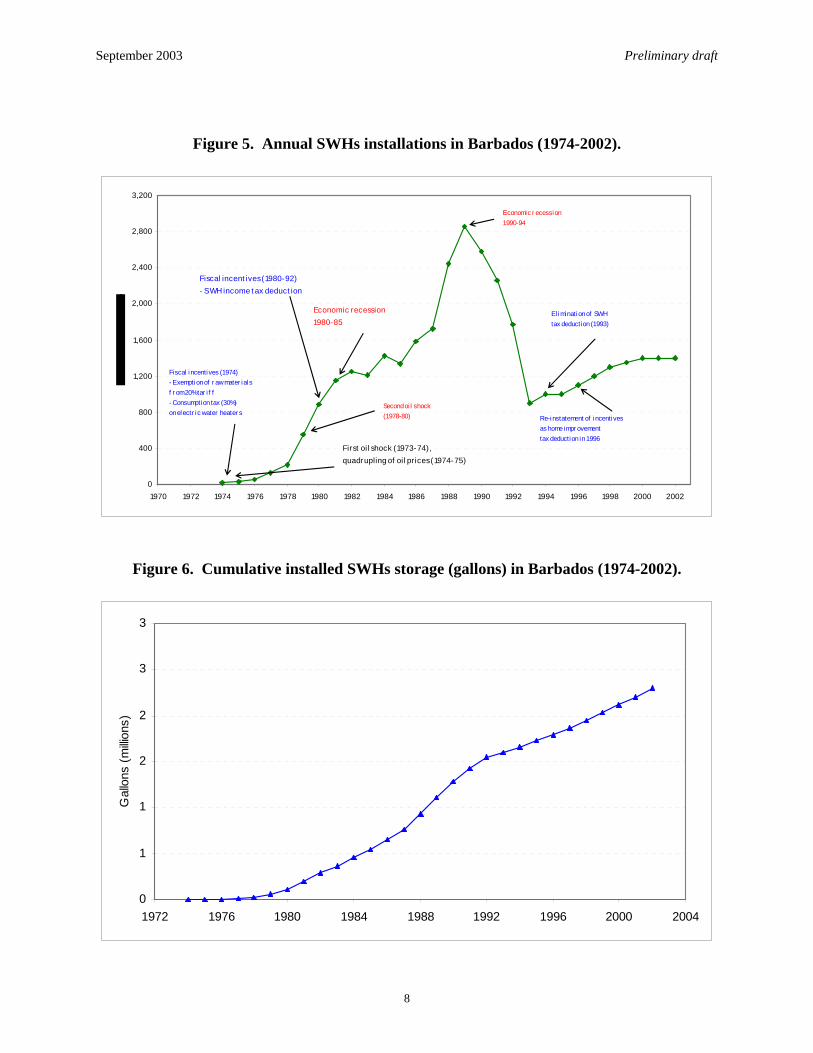
SunPower and AquaSol. The size of this market is relatively stable consisting primarily of new construction and to a lesser extent installations in existing construction. All three companies also install replacement components (mostly tanks) and routine maintenance (e.g., replacement of anodes). Figure 5 provides a summary graphical chronology of annual SWH installations in Barbados with the more important events affecting the sale of SWHs noted. Cumulative SWH installations, measured in gallons of capacity, are shown in Figure 6. (The data for these two figures is provided in Table 1.) With the exception to the early to mid-1980s, sales of SWHs increased steadily from 1974 when 12 units were sold to 1989 when more than 2800 units were sold. In the early to mid-1980s growth in SWH sales slackened considerably despite the promulgation of the homeowner SWH tax deduction in 1980. The lessening in sales during this period was no doubt due to the economic recession following the second oil price shock in the late 1970s. With the onset of the major economic recession in 1990 installations declined precipitously to under 1000 units in 1993.10 As the economic recovery began SWH sales started increasing toward current levels. A more detailed chronology of events in the development of the Barbadian SWH industry is provided in Table 2.
9Additional details of systems can be found on the manufacturer website – Solar Dynamics (http://www.solardynamicsltd.com/index.html), SunPower (http://www.sunpowr.com/index.html), and AquaSol (http://www.aquasolonline.com/generalinfo.htm). 10 Data for the 1993-2002 period are unavailable. Estimates provided here are inferred from conservations with the manufacturers and from various published anecdotal sources.
7
September 2003 Preliminary draft
Figure 5. Annual SWHs installations in Barbados (1974-2002).
0
400
800
1,200
1,600
2,000
2,400
2,800
3,200
1970 1972 1974 1976 1978 1980 1982 1984 1986 1988 1990 1992 1994 1996 1998 2000 2002
First oil shock (1973-74), quadrupling of oil pr ices (1974-75)
Fiscal incent ives (1980-92)- SWH income t ax deduct ion
Economic r ecession1990-94
Second oi l shock(1978-80) Re-instatement of incentives
as home impr ovementtax deduction in 1996
El imination of SWHtax deduction (1993)
Fiscal incentives (1974)- Exemption of r aw mater ialsf r om 20% tar i f f- Consumption tax (30%)on electr ic water heater s
Economic recession1980-85
Figure 6. Cumulative installed SWHs storage (gallons) in Barbados (1974-2002).
0
1
1
2
2
3
3
1972 1976 1980 1984 1988 1992 1996 2000 2004
Gal
lons
(milli
ons)
8
September 2003 Preliminary draft
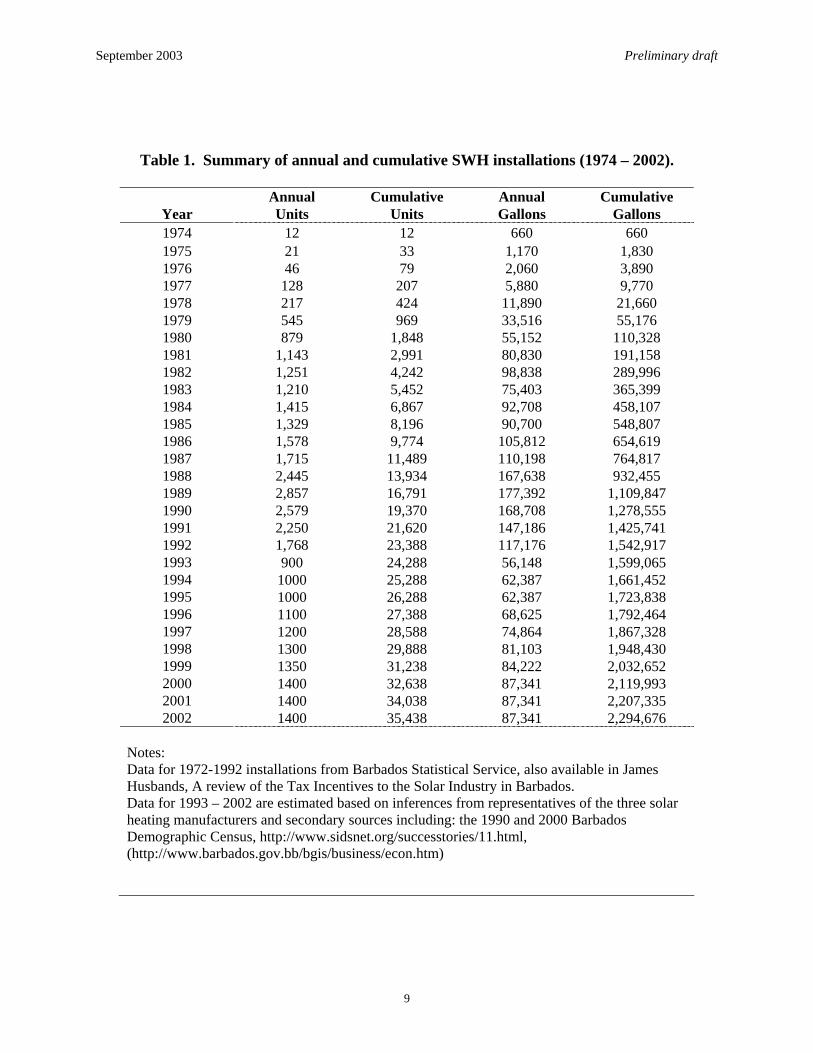
Table 1. Summary of annual and cumulative SWH installations (1974 – 2002).
Annual Cumulative Annual Cumulative Year Units Units Gallons Gallons 1974 12 12 660 660 1975 21 33 1,170 1,830 1976 46 79 2,060 3,890 1977 128 207 5,880 9,770 1978 217 424 11,890 21,660 1979 545 969 33,516 55,176 1980 879 1,848 55,152 110,328 1981 1,143 2,991 80,830 191,158 1982 1,251 4,242 98,838 289,996 1983 1,210 5,452 75,403 365,399 1984 1,415 6,867 92,708 458,107 1985 1,329 8,196 90,700 548,807 1986 1,578 9,774 105,812 654,619 1987 1,715 11,489 110,198 764,817 1988 2,445 13,934 167,638 932,455 1989 2,857 16,791 177,392 1,109,847 1990 2,579 19,370 168,708 1,278,555 1991 2,250 21,620 147,186 1,425,741 1992 1,768 23,388 117,176 1,542,917 1993 900 24,288 56,148 1,599,065 1994 1000 25,288 62,387 1,661,452 1995 1000 26,288 62,387 1,723,838 1996 1100 27,388 68,625 1,792,464 1997 1200 28,588 74,864 1,867,328 1998 1300 29,888 81,103 1,948,430 1999 1350 31,238 84,222 2,032,652 2000 1400 32,638 87,341 2,119,993 2001 1400 34,038 87,341 2,207,335 2002 1400 35,438 87,341 2,294,676
Notes: Data for 1972-1992 installations from Barbados Statistical Service, also available in James Husbands, A review of the Tax Incentives to the Solar Industry in Barbados. Data for 1993 – 2002 are estimated based on inferences from representatives of the three solar heating manufacturers and secondary sources including: the 1990 and 2000 Barbados Demographic Census, http://www.sidsnet.org/successtories/11.html, (http://www.barbados.gov.bb/bgis/business/econ.htm)
9

September 2003 Preliminary draft
Table 2. Chronology of key events in the development of the Barbadian SWH industry.
Year Event 1970 - 1975
Stagnant economic growth that lasted until 1975.
1973 - 1974
First OPEC oil embargo leading to a quadrupling of world oil prices
1974
CADEC loan to help establish Solar Dynamics develop and market a SWH.
1974
Active involvement of an informed Prime Minister in seeking ways to reduce oil dependency.
1974
Promulgation of the Fiscal Incentives Act – - Exemption of SWH raw materials (e.g., tanks, collectors) from the 20% import duty (lowered the installed cost of a SWH by 5 to 10%) - A 30% consumption tax placed on conventional electric water heaters.
1975 - 1977
Government purchase of 84 units for a housing development project (Oxnards project)
1978 – 1980
Second world oil price shock brought about by the Iranian Revolution and the Iran-Iraq War leading to a doubling of prices.
1980
Income Tax Amendment provided a specific line item to deduct the full-cost of a SWH installation. SWH deduction was in-place from 1980 through June 1992.
1980 - 1985
International economic recession brought on by the second oil crisis
1988 – 1992 (?)
Government purchase of 300 units for a housing development project (Venezuela project)
1990 - 1994
Severe international economic recession creating significant fiscal and balance of payments deficits. Significant decline in GDP (real GDP fell from BD$909 million in 1989 to BD$784 in 1992) that produced significant fiscal and balance of payment deficits. Tax deduction suspended as part of IMF structural reforms.
1993-1995
Suspension of tax deduction for SWHs. Tax deduction suspended as part of structural reforms.
1996 - present
Reinstatement of SWH deduction as part of a personal home improvement allowance deduction of up to BD$3,500 per year for mortgage interest, repairs, renovations, energy or water saving devices, solar water heaters, and water storage tanks.
** Need to insert three additional government purchase programs at Flat Rocks (St. George), Orange Hill (St. James), and London Tower (?), Bridgetown.
10
September 2003 Preliminary draft
Evaluation of the Costs and Benefits of SWH Fiscal Incentives Numerous incentives and mechanisms have been used and/or suggested to promote the diffusion of RETs. These incentives include a host of fiscal incentives (e.g., tax credits, tax deductions, rebates, subsidies, and green pricing); various regulatory measures including renewable portfolio standards, surcharges to fund renewable energy projects, net metering, and environmental standards; financing mechanisms such as low-interest loans; government purchase programs; government investment in research and development; and programs aimed at educating the public about potential benefits. In all cases, however, incentives are used to achieve specific policy objectives:
• lower the installed costs of RETs, • reduce the risk associated with the purchase of a new technology, • help condition or create a market for producers, and • capture societal benefits, such as reducing environmental emissions and oil imports.11
As noted in Table 2, the GOB used two fiscal incentives initially to promote SWHs. The suspension of import duties on raw materials used to manufacture SWHs and the imposition of a 30% consumption tax on the electric water heaters.12 In 1980, the GOB implemented a third fiscal incentive. This third incentive allowed homeowners to deduct the full-cost of a SWH installlation up to a maximum of $BD3500. This tax deduction was eliminated in 1993 as part of a package of IMF structural reforms to deal with the economic recession. In 1996, a SWH tax deduction was reinstated as part of a broader homeowners allowance deduction.13 This deduction allows homeowners to deduct up to BD$3,500 per year for mortgage interest, repairs, renovations, energy or water saving devices, solar water heaters, and water storage tanks.14 In addition to the fiscal incentives, the GOB purchased significant numbers of water heaters for housing development projects. The initial purchase was for about 80 units in the mid-1970s
11 A useful summary of incentives can be fund in Alleng G., J. Byrne, and A. Zhou, “Using Economic Incentives to Accelerate Development of Green technologies, Green Building Workshop, Pacific Energy Center (China) and Environmental Market Solutions, Inc. (USA), Shanghai, China, July 9-10,2001. 12 It should be acknowledged that LPG and gas water heaters are also used but there use is limited. Shower head type fixtures are also used. These water heaters tend to be used more frequently in lower income households and dwellings that have single water lines. 13 Individuals with an income of BD$15,000 or more must complete and file an income tax return. There is a basic deduction of BD$15,000 with an additional BD$1,000 for each dependent child up to a maximum of two and BD$3,500 for a non-working spouse. In addition to the homeowners allowance, there are also deductions for certain retirement savings plans (<BD$6,000) and pensions (BD$30,000). Marginal tax rates are set at 25% for taxable income up to BD$24,200 and 40% for taxable income over BD$24,200. 14 The Hotel Aids Act of 1956 and its replacement, The Tourism Development Act of 2002, allow hotels to import duty-free building materials and equipment used in construction and rehabilitation.
11
September 2003 Preliminary draft
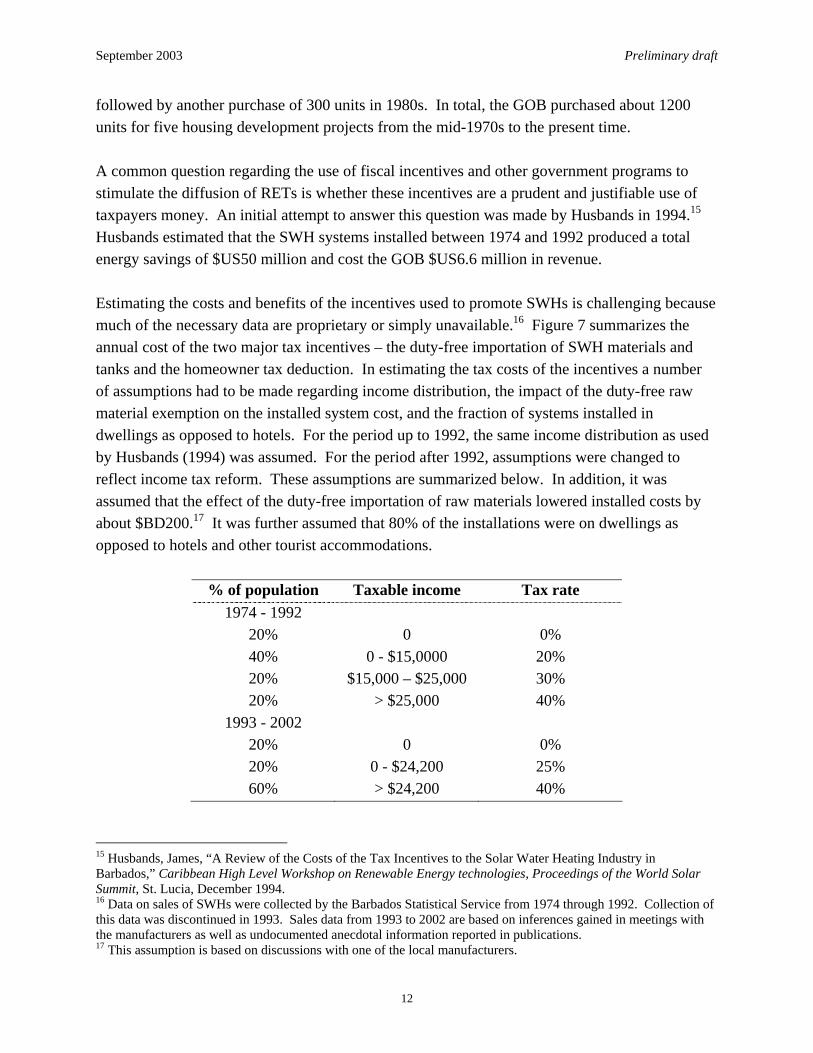
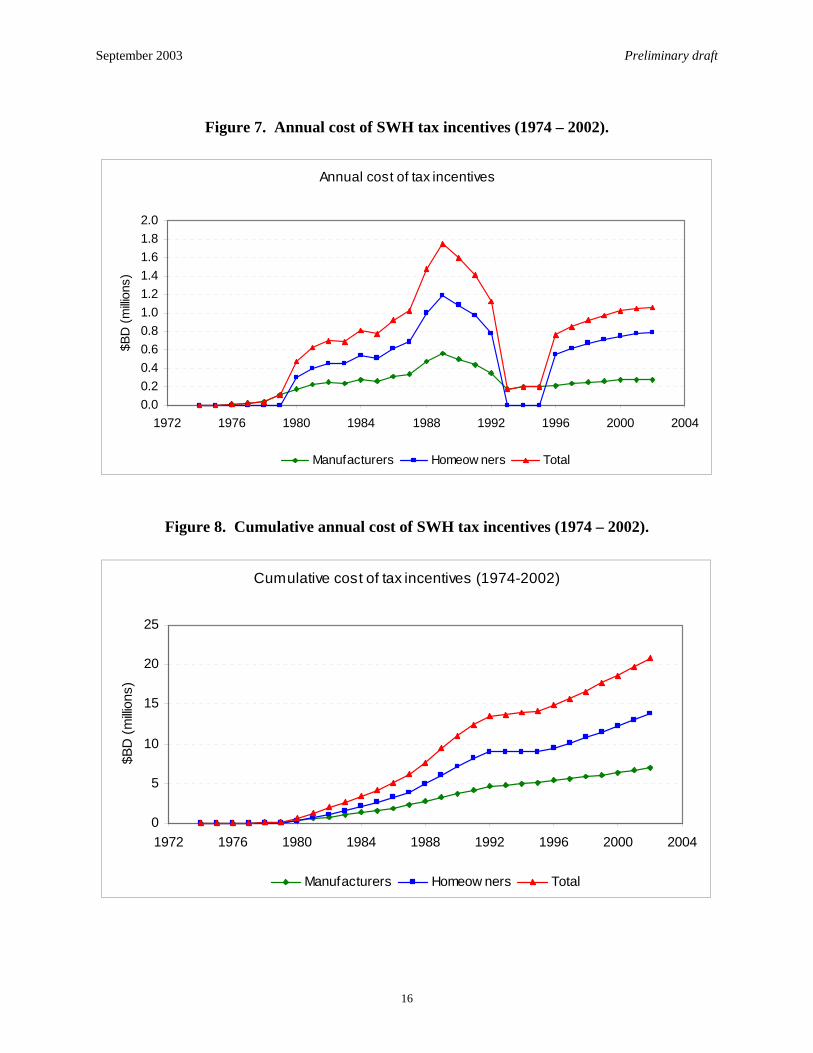
followed by another purchase of 300 units in 1980s. In total, the GOB purchased about 1200 units for five housing development projects from the mid-1970s to the present time. A common question regarding the use of fiscal incentives and other government programs to stimulate the diffusion of RETs is whether these incentives are a prudent and justifiable use of taxpayers money. An initial attempt to answer this question was made by Husbands in 1994.15 Husbands estimated that the SWH systems installed between 1974 and 1992 produced a total energy savings of $US50 million and cost the GOB $US6.6 million in revenue. Estimating the costs and benefits of the incentives used to promote SWHs is challenging because much of the necessary data are proprietary or simply unavailable.16 Figure 7 summarizes the annual cost of the two major tax incentives – the duty-free importation of SWH materials and tanks and the homeowner tax deduction. In estimating the tax costs of the incentives a number of assumptions had to be made regarding income distribution, the impact of the duty-free raw material exemption on the installed system cost, and the fraction of systems installed in dwellings as opposed to hotels. For the period up to 1992, the same income distribution as used by Husbands (1994) was assumed. For the period after 1992, assumptions were changed to reflect income tax reform. These assumptions are summarized below. In addition, it was assumed that the effect of the duty-free importation of raw materials lowered installed costs by about $BD200.17 It was further assumed that 80% of the installations were on dwellings as opposed to hotels and other tourist accommodations.
% of population Taxable income Tax rate 1974 - 1992
20% 0 0% 40% 0 - $15,0000 20% 20% $15,000 – $25,000 30% 20% > $25,000 40%
1993 - 2002 20% 0 0% 20% 0 - $24,200 25% 60% > $24,200 40%
15 Husbands, James, “A Review of the Costs of the Tax Incentives to the Solar Water Heating Industry in Barbados,” Caribbean High Level Workshop on Renewable Energy technologies, Proceedings of the World Solar Summit, St. Lucia, December 1994. 16 Data on sales of SWHs were collected by the Barbados Statistical Service from 1974 through 1992. Collection of this data was discontinued in 1993. Sales data from 1993 to 2002 are based on inferences gained in meetings with the manufacturers as well as undocumented anecdotal information reported in publications. 17 This assumption is based on discussions with one of the local manufacturers.
12
September 2003 Preliminary draft
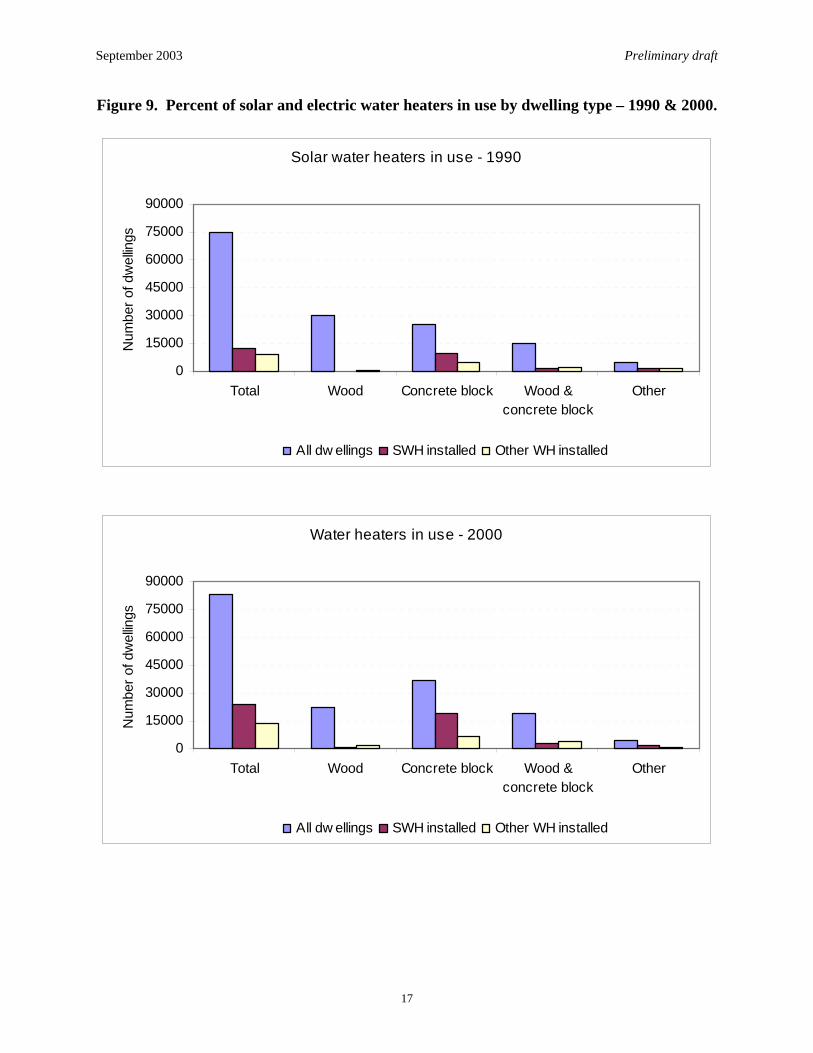
As expected, the shape of the curves in Figure 7 generally follows that of the installation data presented in Figure 5. Historically, about two-thirds of the cost of the incentives is due to the homeowner deduction and one-third due to the manufacturer duty exemption on raw materials. The tax cost of the incentive reached a maximum of nearly $BD1.8 million in 1989. The consumer deduction cost about $BD1.2 million and the duty-free importation of raw materials about $BD0.6 million. In the most recent year, the cost of the tax incentives was about $BD1.1 million. This tax cost is a very small fraction of GOB revenues. In 2002, the GOB collected $BD1740 million of which $300 million was from personal income taxes. Cumulatively, the tax cost of the SWH incentives is estimated at about $BD21.5 million through 2002 (Figure 8). Three types of benefits are usually attributable to RETs. These include the direct energy savings, the local and global environmental benefits, and energy security benefits. The estimation of energy savings is based on the assumption that SWHs displace some fraction of electric water heaters. Census data collected by the Barbados Statistical Service in 1990 and 2000 provides an indication of the extent of installed SWHs and other water heaters and how these installations are distributed by dwelling type – concrete block, wood, wood and block, and other.18 The number of dwellings with SWHs and other (or non-solar) water heaters are summarized in Figure 9. These data for year 2000 show about 24,140 (30%) of dwellings had SWHs installed and about 13,460 (16%) had some other type of water heater. By comparison, these numbers are substantially higher than the estimates for 1990 – 12,390 and 8,640 for SWHs and other water heaters, respectively. These data also indicate the following:
• other types of water heaters continue to be installed despite the presence of the tax incentives,
• the penetration of SWHs is markedly different among dwelling types, and • the preponderance of SWHs are installed on concrete block constructed houses.
What might be inferred from these data is that owners of concrete block dwellings have enough income to take advantage of the tax incentives. Owners of the wood constructed dwellings, which are typically the low-income housing stock, may not have sufficient income to qualify for a tax deduction or simply cannot afford to pay for a SWH installation.19 Owners of wood and concrete block, which is typical of the more expensive housing, may prefer electric water heaters for aesthetics reasons.
18 Barbados Statistical Service, Population and Housing Statistics, 1990 and 2000. 19 Many of the low-income type dwellings in Barbados only have a single pipe for water delivery. If water is heated, then a shower head or faucet type electric heater is used. Installation of a SWH requires both hot and cold plumbing.
13

September 2003 Preliminary draft
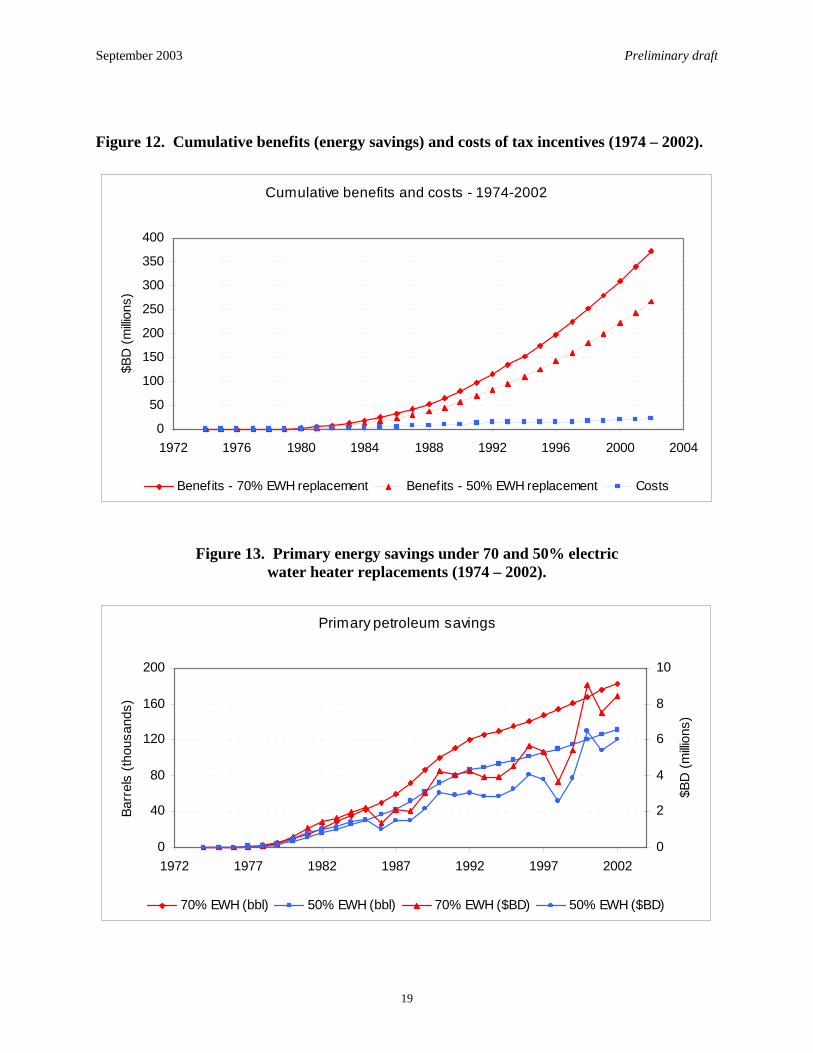
To estimate energy savings it was assumed that SWHs displace about 50 to 70% of electric water heaters. The amount of energy saved per unit was estimated 3710 kWh.20 The product of cumulative installations, energy savings per unit, and an electric water heater displacement of 50 to 70% yields SWH energy savings. The estimated energy savings and kWhs saved are summarized annually in Figure 10. Figure 11 provides cumulative energy savings. Valuation of the kWh savings is based on an average electric rate data from Figure 4. Assuming that the preceding assumptions are reasonable, the Barbadian SWHs are saving about 65 to 92 million kWh annually with a ratepayer value of $BD23 to $BD32 million. By comparison, Husbands estimated energy savings in 1992 at 75 million kWh with a valuation of $BD19 million. The energy savings have a cumulative value through year 2002 of $BD267 to $BD274 million dollars. A comparison the cumulative costs of tax incentives and the benefits measured in energy savings is shown in Figure 12. Clearly, the energy saving benefits substantially exceeds the cost of the tax incentives. However, this comparison should not be construed that the tax incentives were entirely responsible for the relatively high penetration of SWHs in Barbados. Without conducting extensive surveys it would be impossible to tell how much effect the tax incentives had in a homeowners decision to install a water heater. The data presented earlier in Table 1 shows that the SWH industry was already growing at a relatively fast pace prior to the passage of the homeowner tax deduction. Regardless of the factors responsible, energy savings significantly exceed the tax costs. A second category of benefits provided by SWHs are the primary oil savings. These estimated benefits are summarized in Figure 13 in barrels and $BD for 50 and 70% electric water heater replacement.21 In 2002, it is estimated that the 35,000 installed SWHs saved between 130.4 to 182.6 thousand barrels of oil with a value of $BD6.0 to $BD8.4 million depending on the assumed electric water heater replacement. These savings amount to about 30 to 40% of current domestic oil production.22
Environmental emissions are the final category of benefits evaluated. These include the local benefits (i.e., SO2, NOx, particulates, VOCs, etc) and the global benefits, defined as reduced emissions of carbon. The local environmental benefits were not quantified. Figures 14 and 15 summarize the carbon savings due to the installation of SWHs. The carbon savings are based on a composite carbon emission coefficient of 20 metric tons/Billion Btu. This composite emission factor reflects the percentage of fuel oil, diesel, and gas used by BL&P to generate power. Carbon emissions for the entire country are also displayed in Figure 14 to provide some 20 This unit energy savings of 3,710 kWh is based on the following assumption: one BTU required to heat one pound of water one degree F, an average tank size of 62 gallons, an efficiency of 90%, and a water temperature change of 60°F. Husbands (1994) assumed an average energy savings per SWH unit of 4,000 kWh. 21 It was assumed that primary to end-use energy is 30%.
14
September 2003 Preliminary draft
perspective. Figure 15 shows the percentage of carbon savings to total Barbadian carbon emissions from all sources.23 These results show carbon savings in 2002, depending on the level of electric water heater replacement, at 4.3 to 6% of all Barbadian carbon sources (principally power and to a lesser extent cement manufacturing). The preceding clearly shows that there are some significant benefits from SWHs. Although the effect of the tax incentives on homeowner and hotel owner decisions to install SWHs cannot be determined precisely, it can be said that the cost of the tax incentives is relatively low compared with the benefits – user energy savings, reduced oil imports, and reduced carbon emissions.
22 Based on an assumed production level of 1200 bbl/day. 23 Carbon emissions from all sources are from the Carbon Dioxide Information Analysis Center (CDIAC) -- http://cdiac.ornl.gov/ .
15
September 2003 Preliminary draft
Figure 7. Annual cost of SWH tax incentives (1974 – 2002).
Annual cost of tax incentives
0.00.20.40.60.81.01.21.41.61.82.0
1972 1976 1980 1984 1988 1992 1996 2000 2004
$BD
(milli
ons)
Manufacturers Homeow ners Total
Figure 8. Cumulative annual cost of SWH tax incentives (1974 – 2002).
Cumulative cost of tax incentives (1974-2002)
0
5
10
15
20
25
1972 1976 1980 1984 1988 1992 1996 2000 2004
$BD
(milli
ons)
Manufacturers Homeow ners Total
16
September 2003 Preliminary draft
Figure 9. Percent of solar and electric water heaters in use by dwelling type – 1990 & 2000.
Solar water heaters in use - 1990
0
15000
30000
45000
60000
75000
90000
Total Wood Concrete block Wood &concrete block
Other
Num
ber o
f dw
ellin
gs
All dw ellings SWH installed Other WH installed
Water heaters in use - 2000
0
15000
30000
45000
60000
75000
90000
Total Wood Concrete block Wood &concrete block
Other
Num
ber o
f dw
ellin
gs
All dw ellings SWH installed Other WH installed
17

September 2003 Preliminary draft
Figure 10. Annual energy savings from installation of SWHs (1974 – 2002).
Energy savings - 1974-2002
0
5
10
15
20
25
30
35
1972 1976 1980 1984 1988 1992 1996 2000 2004
$BD
(milli
ons)
0102030405060708090100
kWh
(milli
ons)
70% - $BD 50% - $BD 70% - kWh 50% - kWh
Figure 11. Cumulative energy savings from installation of SWHs (1974 – 2002).
Cumulative energy savings - 1974-2002
0
50
100
150
200
250
300
350
400
1972 1976 1980 1984 1988 1992 1996 2000 2004
$BD
(milli
ons)
70% EWH replacement 50% EWH replacement
18
September 2003 Preliminary draft
Figure 12. Cumulative benefits (energy savings) and costs of tax incentives (1974 – 2002).
Cumulative benefits and costs - 1974-2002
0
50
100
150
200
250
300
350
400
1972 1976 1980 1984 1988 1992 1996 2000 2004
$BD
(milli
ons)
Benefits - 70% EWH replacement Benefits - 50% EWH replacement Costs
Figure 13. Primary energy savings under 70 and 50% electric water heater replacements (1974 – 2002).
Primary petroleum savings
0
40
80
120
160
200
1972 1977 1982 1987 1992 1997 2002
Barr
els
(thou
sand
s)
0
2
4
6
8
10$B
D (m
illion
s)
70% EWH (bbl) 50% EWH (bbl) 70% EWH ($BD) 50% EWH ($BD)
19

September 2003 Preliminary draft
Figure 14. Total annual Barbadian carbon emissions and carbon savings
from installation of SWHs (1974 – 2002).
Carbon emissions/savings
0
50
100
150
200
250
300
350
1972 1976 1980 1984 1988 1992 1996 2000 2004
Car
bon
(thou
sand
MT)
All C sources Savings - 70% EWH replacement Savings - 50% EWH replacement
Figure 15. Carbon savings as percent of total Barbadian carbon emissions (1974 – 2002).
Carbon savings as % of Barbados total
0%
2%
4%
6%
8%
1972 1977 1982 1987 1992 1997 2002
70% EWH replacement 50% EWH replacement
20
September 2003 Preliminary draft
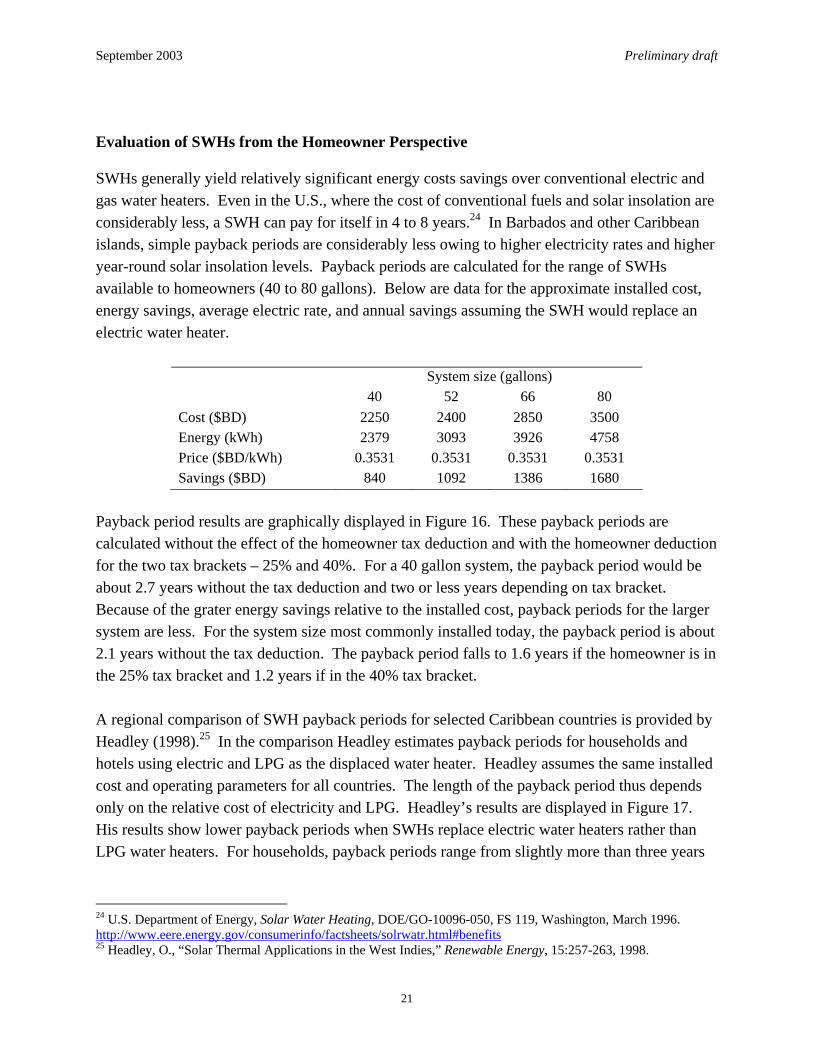
Evaluation of SWHs from the Homeowner Perspective SWHs generally yield relatively significant energy costs savings over conventional electric and gas water heaters. Even in the U.S., where the cost of conventional fuels and solar insolation are considerably less, a SWH can pay for itself in 4 to 8 years.24 In Barbados and other Caribbean islands, simple payback periods are considerably less owing to higher electricity rates and higher year-round solar insolation levels. Payback periods are calculated for the range of SWHs available to homeowners (40 to 80 gallons). Below are data for the approximate installed cost, energy savings, average electric rate, and annual savings assuming the SWH would replace an electric water heater.
System size (gallons) 40 52 66 80 Cost ($BD) 2250 2400 2850 3500 Energy (kWh) 2379 3093 3926 4758 Price ($BD/kWh) 0.3531 0.3531 0.3531 0.3531 Savings ($BD) 840 1092 1386 1680
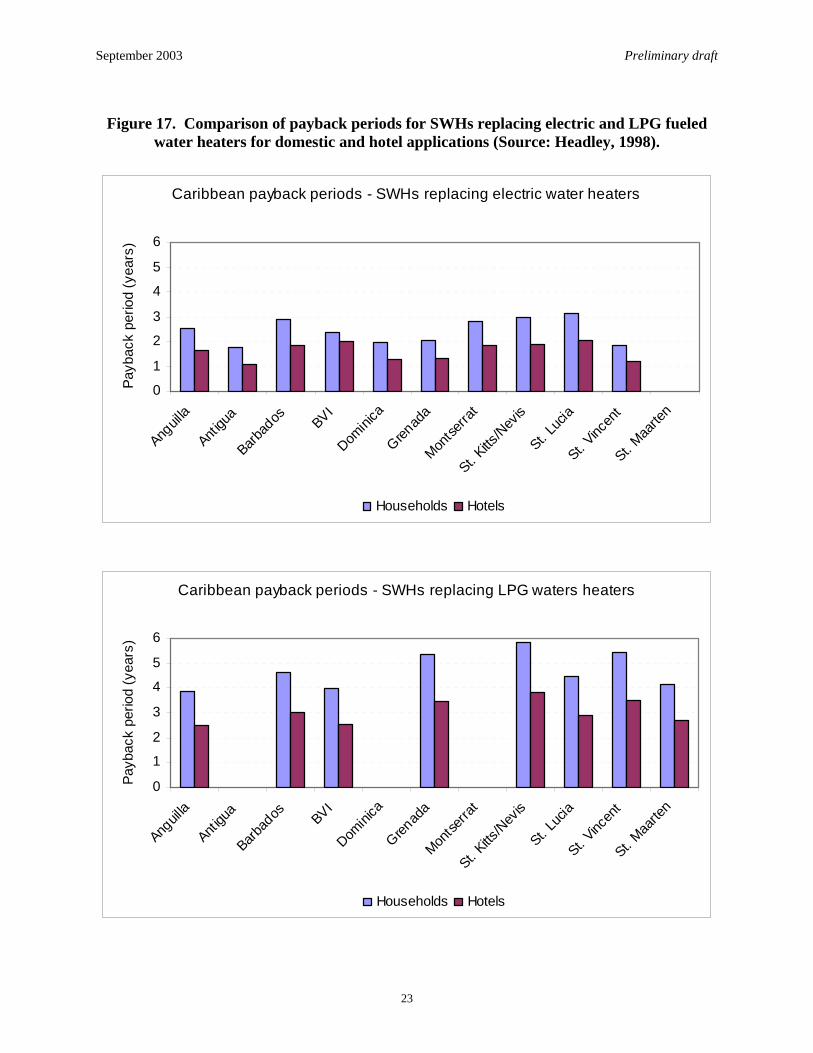
Payback period results are graphically displayed in Figure 16. These payback periods are calculated without the effect of the homeowner tax deduction and with the homeowner deduction for the two tax brackets – 25% and 40%. For a 40 gallon system, the payback period would be about 2.7 years without the tax deduction and two or less years depending on tax bracket. Because of the grater energy savings relative to the installed cost, payback periods for the larger system are less. For the system size most commonly installed today, the payback period is about 2.1 years without the tax deduction. The payback period falls to 1.6 years if the homeowner is in the 25% tax bracket and 1.2 years if in the 40% tax bracket. A regional comparison of SWH payback periods for selected Caribbean countries is provided by Headley (1998).25 In the comparison Headley estimates payback periods for households and hotels using electric and LPG as the displaced water heater. Headley assumes the same installed cost and operating parameters for all countries. The length of the payback period thus depends only on the relative cost of electricity and LPG. Headley’s results are displayed in Figure 17. His results show lower payback periods when SWHs replace electric water heaters rather than LPG water heaters. For households, payback periods range from slightly more than three years
24 U.S. Department of Energy, Solar Water Heating, DOE/GO-10096-050, FS 119, Washington, March 1996. http://www.eere.energy.gov/consumerinfo/factsheets/solrwatr.html#benefits 25 Headley, O., “Solar Thermal Applications in the West Indies,” Renewable Energy, 15:257-263, 1998.
21

September 2003 Preliminary draft
in St. Lucia and slightly less than two years in Antiqua and St. Vincent. For hotels, the Headley estimates show payback periods uniformly less than two years.
Figure 16. Estimated simple payback period for SWHs.
Household solar water systems
0.0
0.5
1.0
1.5
2.0
2.5
3.0
40 52 66 80
System size (gallons)
Payb
ack
perio
d (y
ears
)
w /o incentives 25% tax bracket 40% tax bracket
22
September 2003 Preliminary draft
Figure 17. Comparison of payback periods for SWHs replacing electric and LPG fueled
water heaters for domestic and hotel applications (Source: Headley, 1998).
Caribbean payback periods - SWHs replacing electric water heaters
0
1
2
3
4
5
6
Anguil
la
Antigu
a
Barbad
os BVI
Domini
ca
Grenad
a
Montse
rrat
St. Kitts
/Nev
is
St. Luc
ia
St. Vinc
ent
St. Maa
rten
Payb
ack
perio
d (y
ears
)
Households Hotels
Caribbean payback periods - SWHs replacing LPG waters heaters
0
1
2
3
4
5
6
Anguil
la
Antigu
a
Barbad
os BVI
Domini
ca
Grenad
a
Montse
rrat
St. Kitts
/Nev
is
St. Luc
ia
St. Vinc
ent
St. Maa
rten
Payb
ack
perio
d (y
ears
)
Households Hotels
23
September 2003 Preliminary draft
Findings and Lessons Learned The SWH program in Barbados is perhaps the best known and successful of all RET programs in the Caribbean. It is clear from this study that the fiscal incentives used by the GOB to promote SWHs had a definite effect. However, it is equally clear other events and individuals played a key role in the success of the program. Some of the more important factors responsible for the program success are noted below. • Recognition of the potential importance of SWHs at the very highest levels of government. • An innovative entrepreneur that developed a reliable product and a successful marketing
strategy. • Development of the industry at a time of rapidly rising electricity costs and awareness of
energy costs. • Implementation of key fiscal incentives to lower SWH costs. • A small but timely government purchase program for housing development projects. • The combination of high electricity costs and fiscal incentives made for very low payback
periods and financial little risk for the consumer. • Local companies that stand behind the product by offering performance warranties, specified
temperatures, and reliable after sales service. In sum, Barbadian SWH program has been and continues to be very successful. Although the market for SWHs is relatively stable based primarily on sales to new housing units, there are many homeowners that still do not have SWHs. Most of these are no doubt low-income homeowners that cannot afford to purchase a SWH because they do not qualify for tax deduction or do not have available financing.26 It would appear that additional sales of SWHs would be possible if low-cost financing is made available to homeowners that do not have sufficient income to qualify for the tax deduction.
26 For example, based on the census data very few of the wood constructed houses in Barbados have SWHs.
24