Embed Size (px)
Citation preview
The Bad Assets

Company Overview
Ticker: QCOMRecent Price: $53.30 Incorporated: 1985Headquarters: San Diego, CAMarket Cap: 95.4 B
Enterprise Value: 85 BReturn on Equity: 18.4%Return on Capital: 14.2%Return on Assets: 11.7%P/E (TTM): 14

History of Multiple Access
Wire
1800s: Morse Telegraph

History of Multiple Access
Wire
1860s: Bell Multiple Telegraph

History of Multiple Access
Frequency
1G - Frequency Division Multiple Access (FDMA)
Time
Time
Hertz
Hertz120 Hz60 Hz

History of Multiple Access2G - 1982: Time Division Multiple Access (TDMA)
FDMA
Freq
uenc
y
Time
TDMA
Freq
uenc
y
Time
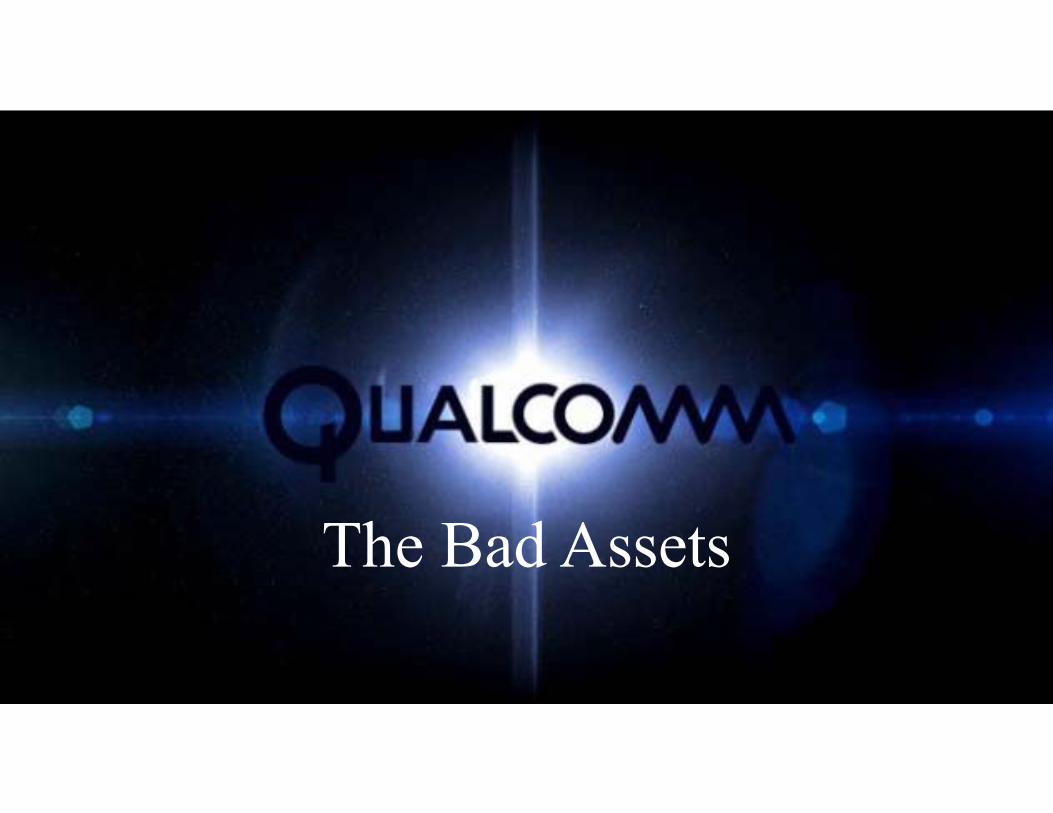
History of Multiple Access2G/3G/4G – 1987: Code Division Multiple Access (CDMA)
Freq
uenc
y
Time

History of Multiple Access2G/3G/4G – 1987: Code Division Multiple Access (CDMA)
Freq
uenc
y
Time

History of Multiple Access
Time
Freq
uenc
y
2G/3G/4G – 1987: Code Division Multiple Access (CDMA)

History of Multiple Access
Time
Freq
uenc
y
A
B
C
D
Orthogonal-Frequency Division Multiple Access
2G/3G/4G – 1987: Code Division Multiple Access (CDMA)

History
1985 – “Quality Communications” (Qualcomm) is founded 1989 – CDMA is proven during San Diego convention1991 – Qualcomm goes public1993 – CDMA is made an industry standard1998 – Qualcomm unveils world’s first CDMA smartphone 1999 – Qualcomm joins the S&P 500 and the Fortune 500

History
2000 – Qualcomm releases first multimedia CDMA chipset2003 – Qualcomm spearheads the evolution of wireless broadband2007 – Qualcomm named the world’s leading mobile chipset provider2010 – 3G connections surpass 1 billion users2011 – Qualcomm acquires Atheros 2013 – Qualcomm powers the world’s first LTE Smartphone

Business Overview
Leader in development and commercialization of CDMA– Coded Division Multiple Access
Owner of several substantial intellectual property rights– Coded Division Multiple Access (CDMA)– Time Division Multiple Access (TDMA)– Orthogonal Frequency - Division Multiple Access (OFDMA)
Manufacturer and developer of industry standards
Manufactures chips and system software

Business Segments
Qualcomm CDMA Technologies (QCT)– Voice and Data Communications– Networking– Application Processing– Multimedia – Global Positioning Systems
Qualcomm Technology Licensing (QTL)– Grants licenses and rights to use portfolio of intellectual property – Licensees pay QCOM fees and royalties for use of intellectual property

How Qualcomm Makes Money
QCT is responsible for manufacturing and developing software
QTL collects royalties and fees on intellectual rights
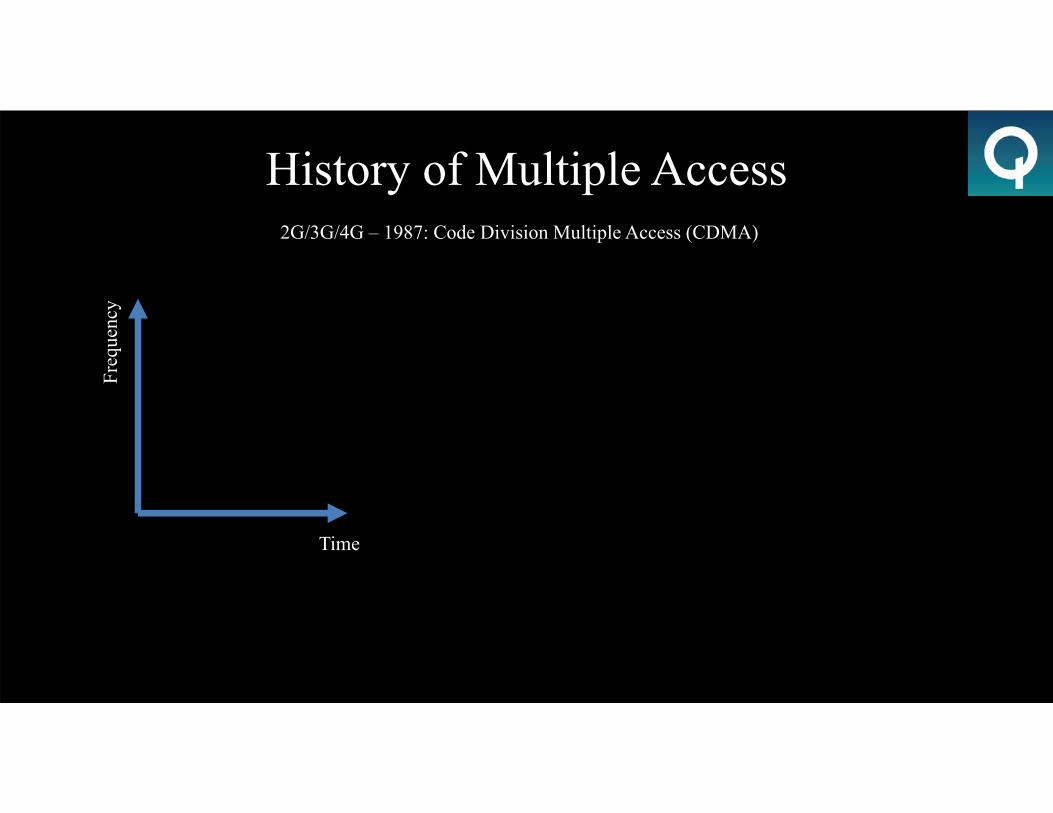
9 Key Business Applications of QCT
AutomotiveHealthcareEducation Mobile ComputingNetworkingSmart CitiesSmart HomesWearables Internet of Everything

How Qualcomm Collects Money
Smartphones cannot use modern networks without paying QTLQualcomm is essentially a “highway system” with tolls
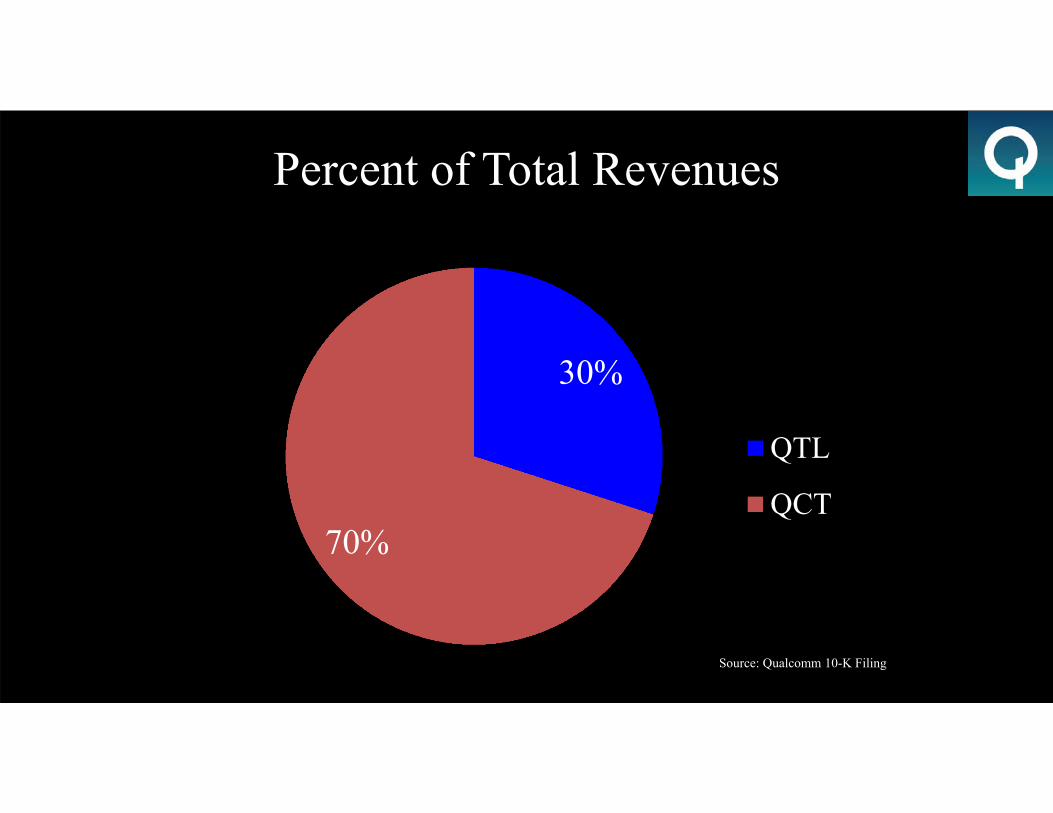
Percent of Total Revenues
30%
70%
QTL
QCT
Source: Qualcomm 10-K Filing

Revenue by Segment
$12,141
$16,715
$18,665
$6,327 $7,554 $7,569
$0
$2,000
$4,000
$6,000
$8,000
$10,000
$12,000
$14,000
$16,000
$18,000
$20,000
2012 2013 2014
Rev
enue
(in
Mill
ions
)
QCT QTL
Source: Qualcomm 10-K Filing

9 Month Revenues by Segment
$9,012
$12,258
$13,816 $13,529
$4,775 $5,680 $5,774 $6,162
$0
$2,000
$4,000
$6,000
$8,000
$10,000
$12,000
$14,000
$16,000
Q1-Q3 2012 Q1-Q3 2013 Q1-Q3 2014 Q1-Q3 2015
Rev
enue
(in
Mill
ions
)
QCT QTL
Sources: Qualcomm Q3 2015, 2014, 2013, 2012 Reports
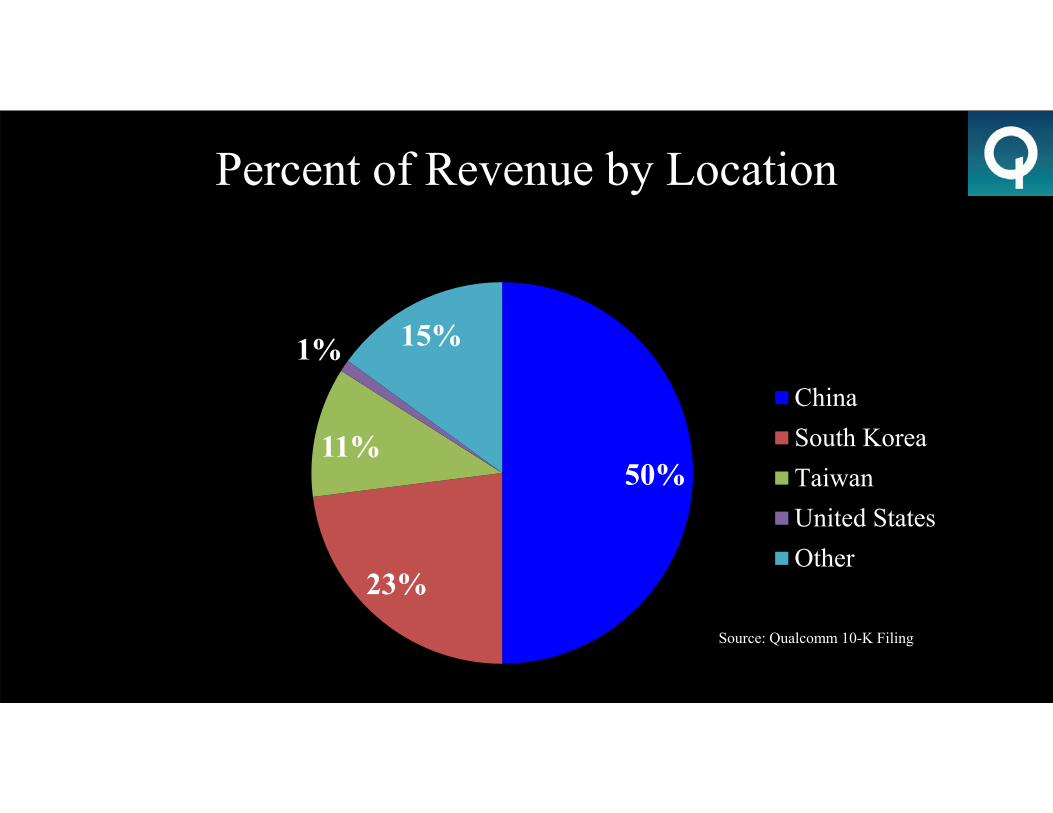
Percent of Revenue by Location
50%
23%
11%
1% 15%
ChinaSouth KoreaTaiwanUnited StatesOther
Source: Qualcomm 10-K Filing

Employees
31,300 Employees 40 Countries
120 Different NationalitiesHighly Educated & Skilled
New Board Members
Identifying the Moat
Monopoly like business Ability to charge fees and royalties on property rights CDMA is an industry standard Growing market for wireless connectivityBiggest spender of R&D in the industry

Is There Opportunity Today?
Samsung and Q4 earnings outlookChinese InvestigationTrading at multi-year lowsStrong financial track recordGrowing wireless markets Strategic realignment planNew board membersSeparation of QCOM Segments??
Risks
Inability to innovate faster than the competitionSubject to tax increasesUnsecured floating rate debtInability to efficiently collect revenuesKey customers

Qualitative ReviewQualitative Question
What type of business is this: commodity or sustained competitive advantage?
Competitive Advantage
Can you easily explain what the business does? Yes *sweats*Is it heavily unionized? NoDoes it require heavy capital infusion? NoDoes it require lots of research and development? YesCan inventory become obsolete? NoAre there chronic "one time" write offs? NoIs the company able to raise its prices to offset inflation? YesWill the company be able to sell more in the future? YesIf I gave you $1 billion could you develop a competitor? If the answer is "no" your business has a sustained competitive advantage. No

In the News
Q4 EarningsFDA Approval Jana Partners Steve Mollenkopf takes over as CEODr. Paul E. Jacobs is named CFO
Recent Acquisitions
Cambridge Silicon Radio (CSR)IkanosCapsule Technolgie

Strategic Realignment Plan
Designed to:-Improve execution-Enhance financial performance-Drive profitable growth-Create sustainable long-term value for stockholders
Implementation of a cost realignment plan -Targeted reductions that will not threaten growth-Reduction of annual share-based compensation grants
Total restructuring costs are expected be $350 to $450 million

China’s National Development and Reform Commission (NDRC)
Qualcomm was found guilty of violating Anti-Monopoly Law (AML)The abuse:
– Licensing of patents• Non adjusting royalty rates with changing patents• Non disclosed list of patents in licenses sold• Creating cross-license agreements without offsetting the royalties charged
– Baseband chipsets• Requirement of licensees to sign a contract that violates the AML• Requirement of licensees to promise not to challenge Qualcomm’s patents

China’s National Development and Reform Commission (NDRC)
Qualcomm must now:– List the patents to be licensed in the portfolios and stop licensing expired patents– Stop bundling Standard Essential Patents (SEPs) with non-SEPS– Change cross-licensing methods– Stop including no-challenge clauses in supply contracts– Pay a penalty of $975 million
Qualcomm committed to a voluntary rectification plan
Quantitative Analysis
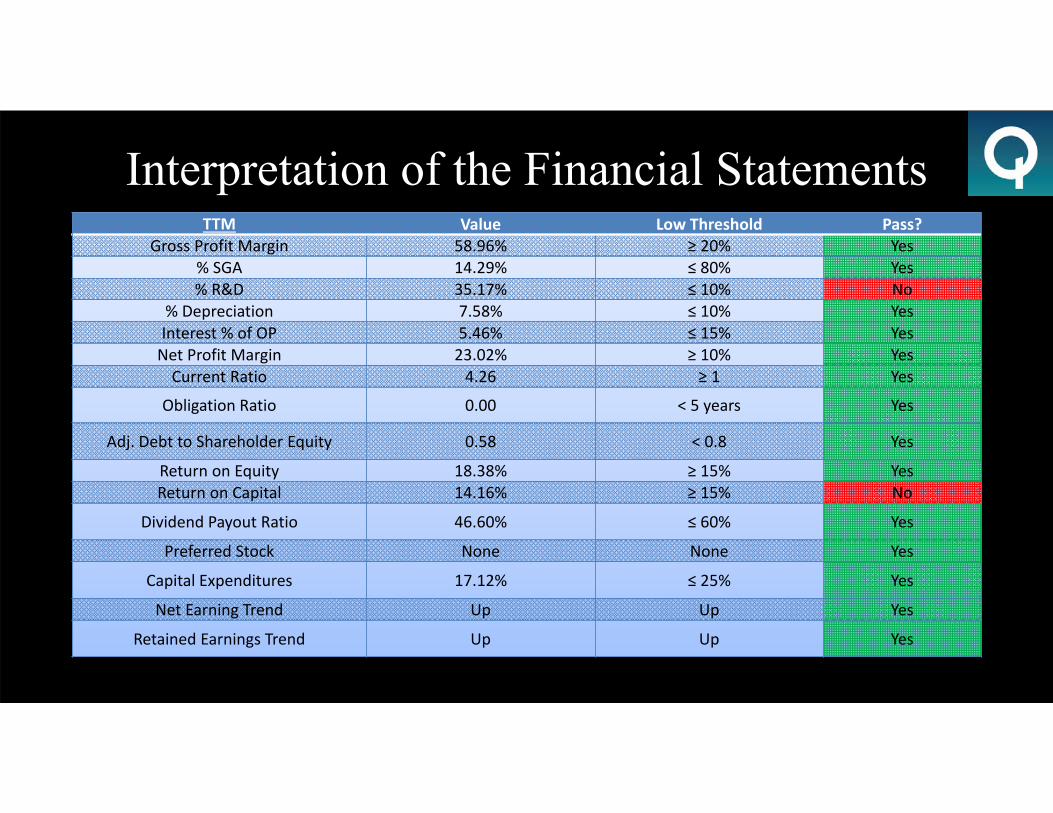
Interpretation of the Financial StatementsTTM Value Low Threshold Pass?
Gross Profit Margin 58.96% ≥ 20% Yes% SGA 14.29% ≤ 80% Yes% R&D 35.17% ≤ 10% No
% Depreciation 7.58% ≤ 10% YesInterest % of OP 5.46% ≤ 15% YesNet Profit Margin 23.02% ≥ 10% YesCurrent Ratio 4.26 ≥ 1 Yes
Obligation Ratio 0.00 < 5 years Yes
Adj. Debt to Shareholder Equity 0.58 < 0.8 Yes
Return on Equity 18.38% ≥ 15% YesReturn on Capital 14.16% ≥ 15% No
Dividend Payout Ratio 46.60% ≤ 60% Yes
Preferred Stock None None Yes
Capital Expenditures 17.12% ≤ 25% Yes
Net Earning Trend Up Up Yes
Retained Earnings Trend Up Up Yes
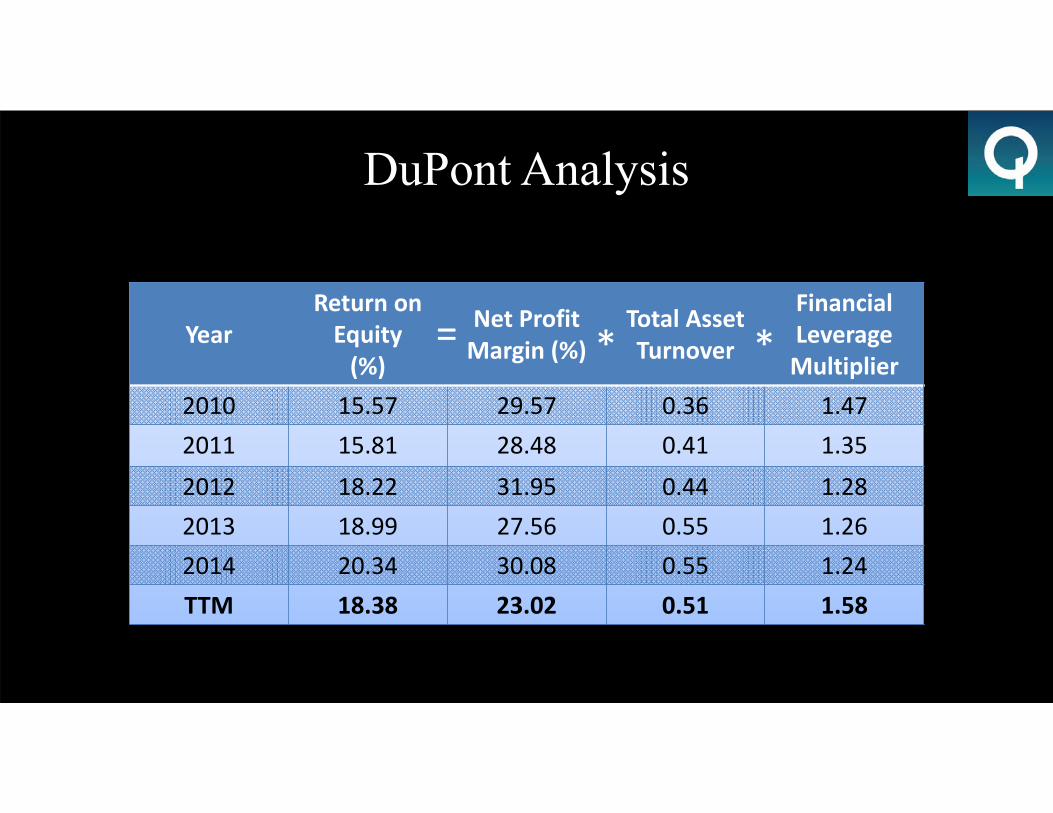
DuPont Analysis
YearReturn on Equity(%)
Net Profit Margin (%)
Total Asset Turnover
Financial Leverage Multiplier
2010 15.57 29.57 0.36 1.472011 15.81 28.48 0.41 1.35
2012 18.22 31.95 0.44 1.282013 18.99 27.56 0.55 1.262014 20.34 30.08 0.55 1.24TTM 18.38 23.02 0.51 1.58
= * *

Net Profit Margin
37.78%
32.82%37.23%
28.36%
15.28%
29.57% 28.48%
31.95%
27.56%30.08%
23.02%
0.00%
5.00%
10.00%
15.00%
20.00%
25.00%
30.00%
35.00%
40.00%
2005 2006 2007 2008 2009 2010 2011 2012 2013 2014 TTM
Net
Pro
fit M
argi
n (%
)
Year
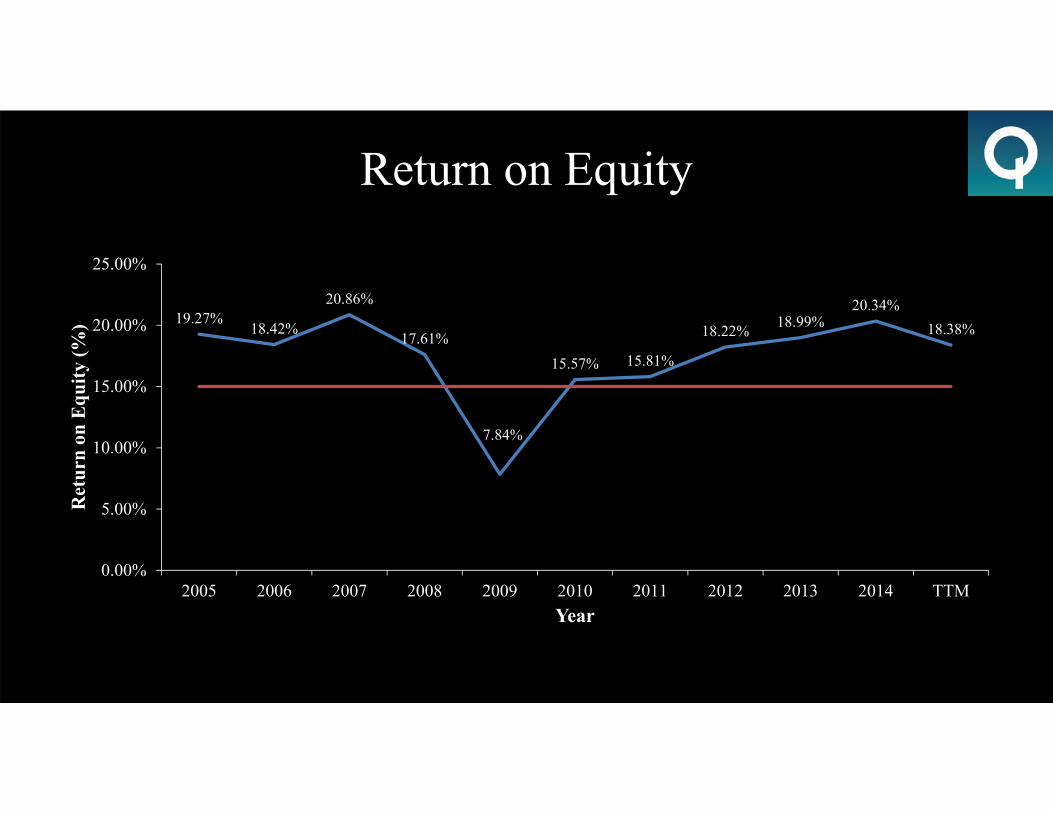
Return on Equity
19.27%18.42%
20.86%
17.61%
7.84%
15.57% 15.81%
18.22% 18.99%20.34%
18.38%
0.00%
5.00%
10.00%
15.00%
20.00%
25.00%
2005 2006 2007 2008 2009 2010 2011 2012 2013 2014 TTM
Ret
urn
on E
quity
(%)
Year
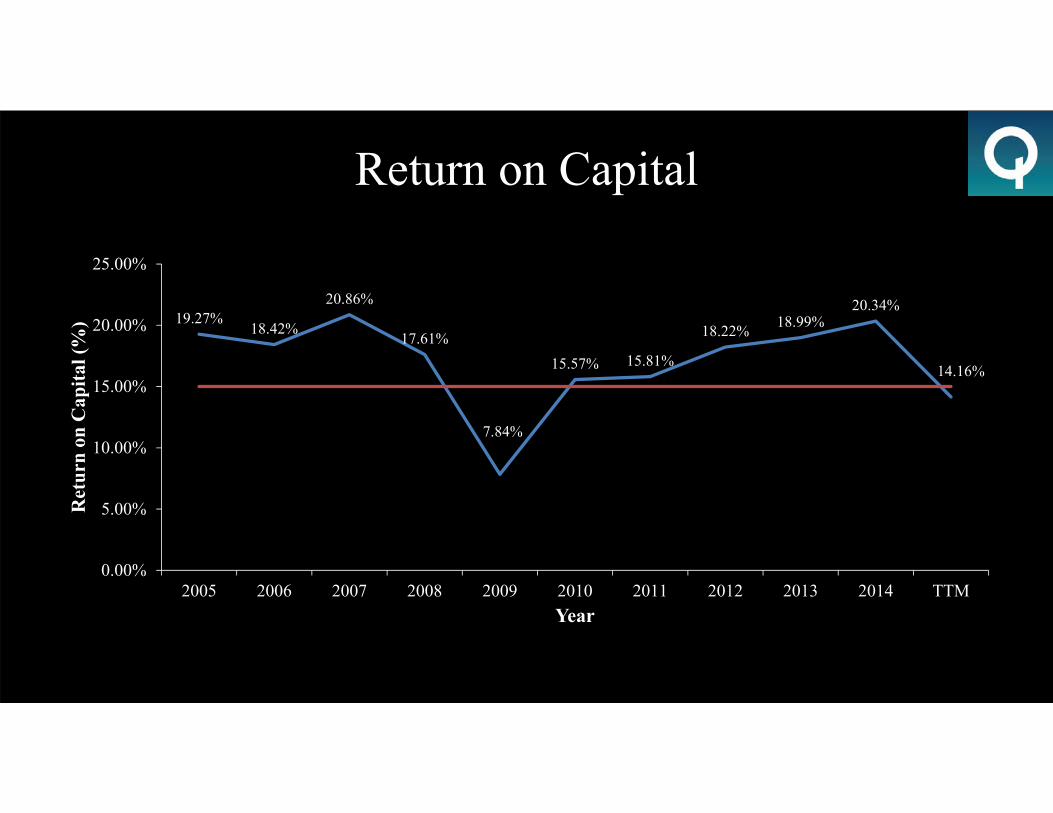
Return on Capital
19.27%18.42%
20.86%
17.61%
7.84%
15.57% 15.81%
18.22% 18.99%20.34%
14.16%
0.00%
5.00%
10.00%
15.00%
20.00%
25.00%
2005 2006 2007 2008 2009 2010 2011 2012 2013 2014 TTM
Ret
urn
on C
apita
l (%
)
Year

Retained Earnings
4,328
8,54111,235
16,204
25,461
32,699
$0.00
$5,000.00
$10,000.00
$15,000.00
$20,000.00
$25,000.00
$30,000.00
$35,000.00
2005 2006 2007 2008 2009 2010 2011 2012 2013 2014 TTM
Ret
aine
d E
arni
ngs (
$ in
mill
ions
)
Year
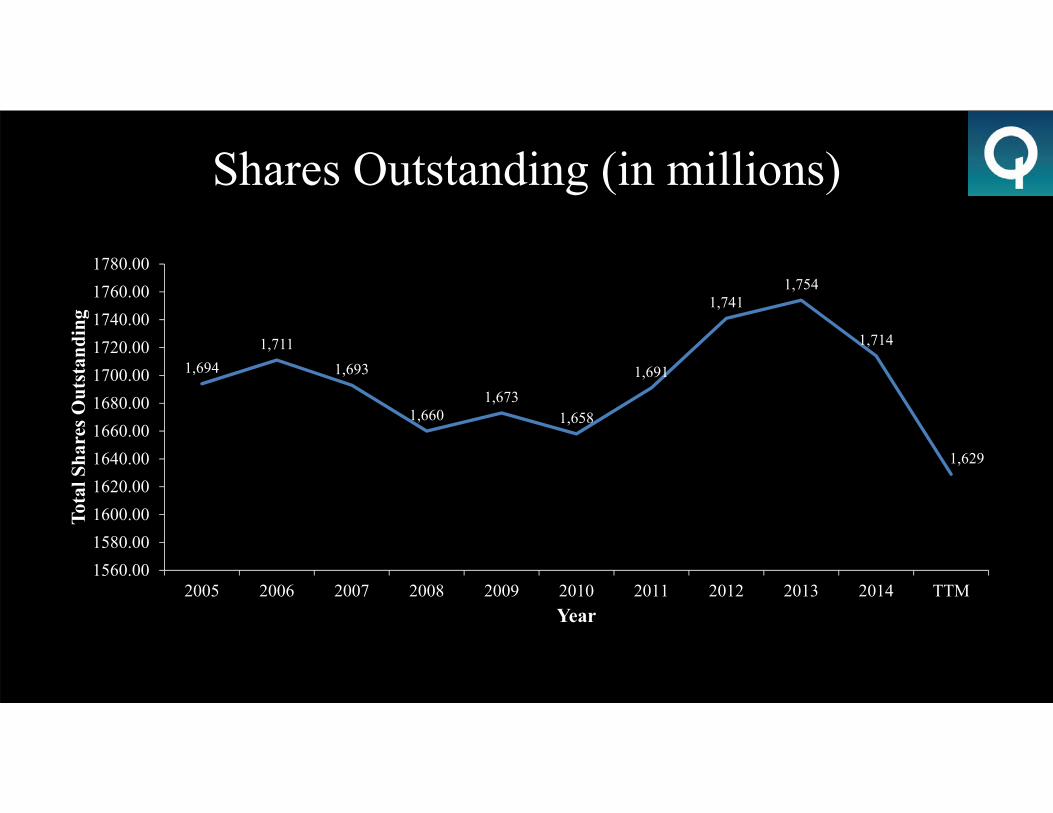
Shares Outstanding (in millions)
1,6941,711
1,693
1,6601,673
1,658
1,691
1,7411,754
1,714
1,629
1560.001580.001600.001620.001640.001660.001680.001700.001720.001740.001760.001780.00
2005 2006 2007 2008 2009 2010 2011 2012 2013 2014 TTM
Tota
l Sha
res O
utst
andi
ng
Year
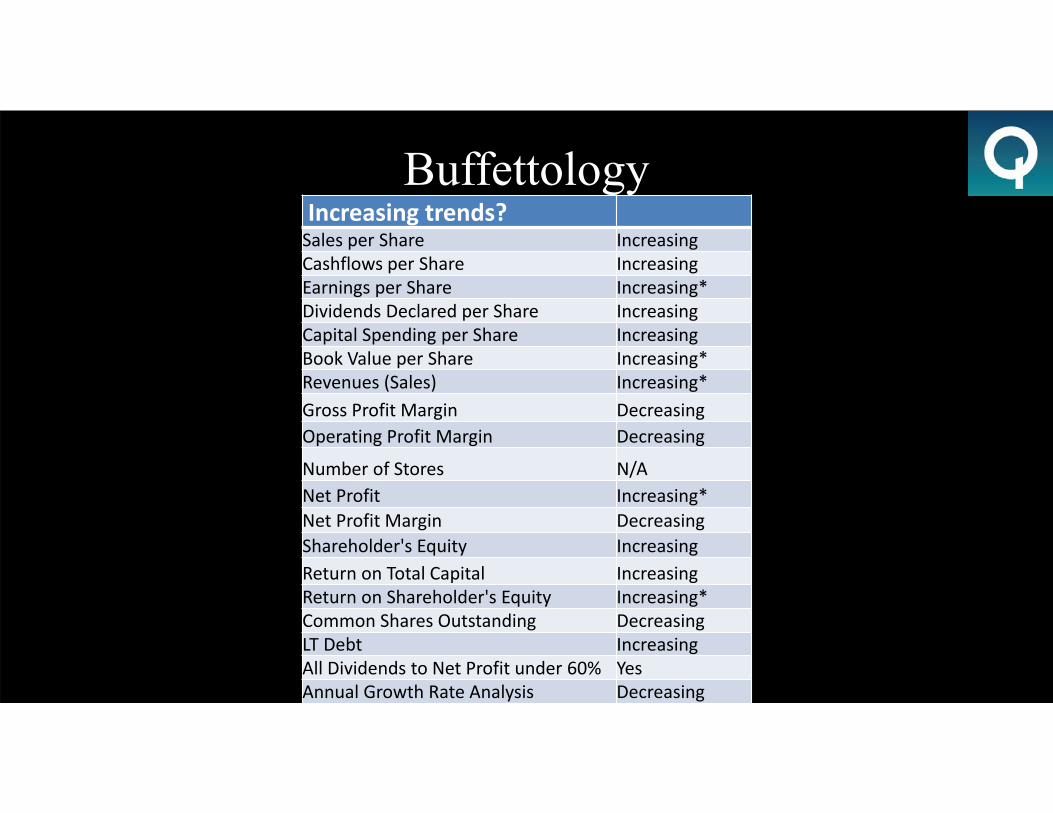
BuffettologyIncreasing trends?Sales per Share IncreasingCashflows per Share IncreasingEarnings per Share Increasing*Dividends Declared per Share IncreasingCapital Spending per Share IncreasingBook Value per Share Increasing*Revenues (Sales) Increasing*Gross Profit Margin DecreasingOperating Profit Margin Decreasing
Number of Stores N/ANet Profit Increasing*Net Profit Margin DecreasingShareholder's Equity IncreasingReturn on Total Capital IncreasingReturn on Shareholder's Equity Increasing*Common Shares Outstanding DecreasingLT Debt IncreasingAll Dividends to Net Profit under 60% YesAnnual Growth Rate Analysis Decreasing

Value Bands

Price/Earnings
10.0
15.0
20.0
25.0
30.0
35.0
40.0

Price/Normalized Earnings (Less Cash)
0
5
10
15
20
25
30
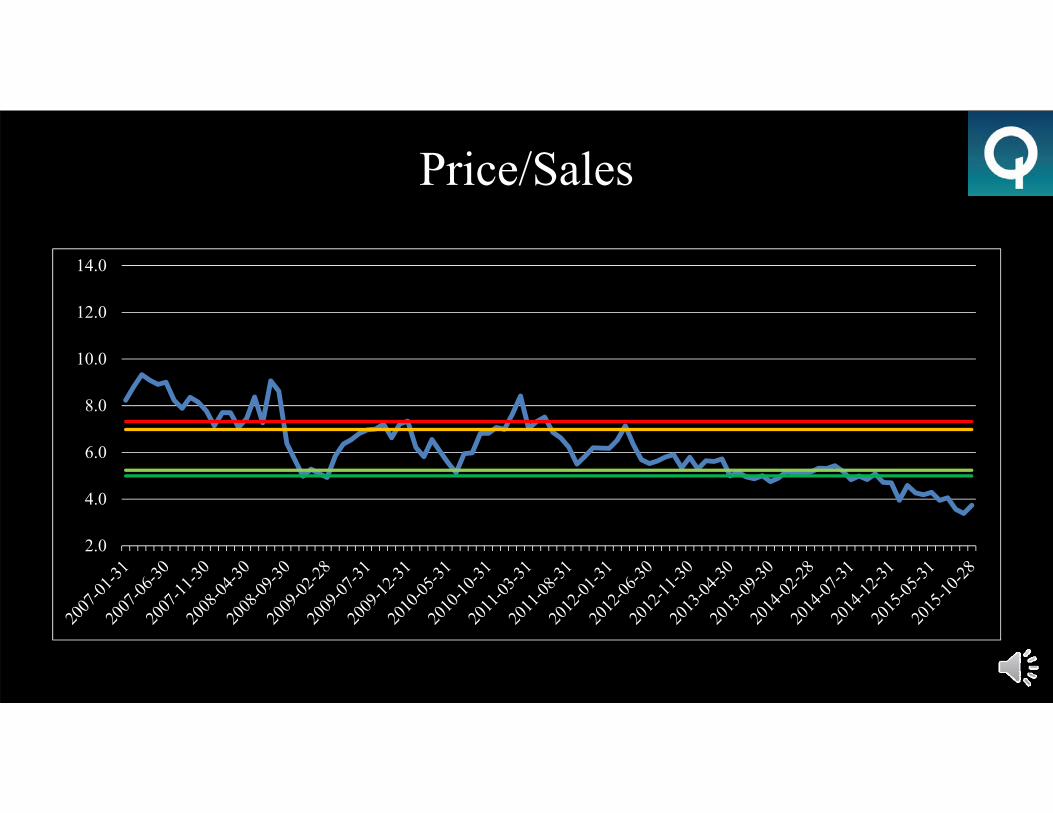
Price/Sales
2.0
4.0
6.0
8.0
10.0
12.0
14.0

Price/Book
2.0
2.5
3.0
3.5
4.0
4.5
5.0
5.5
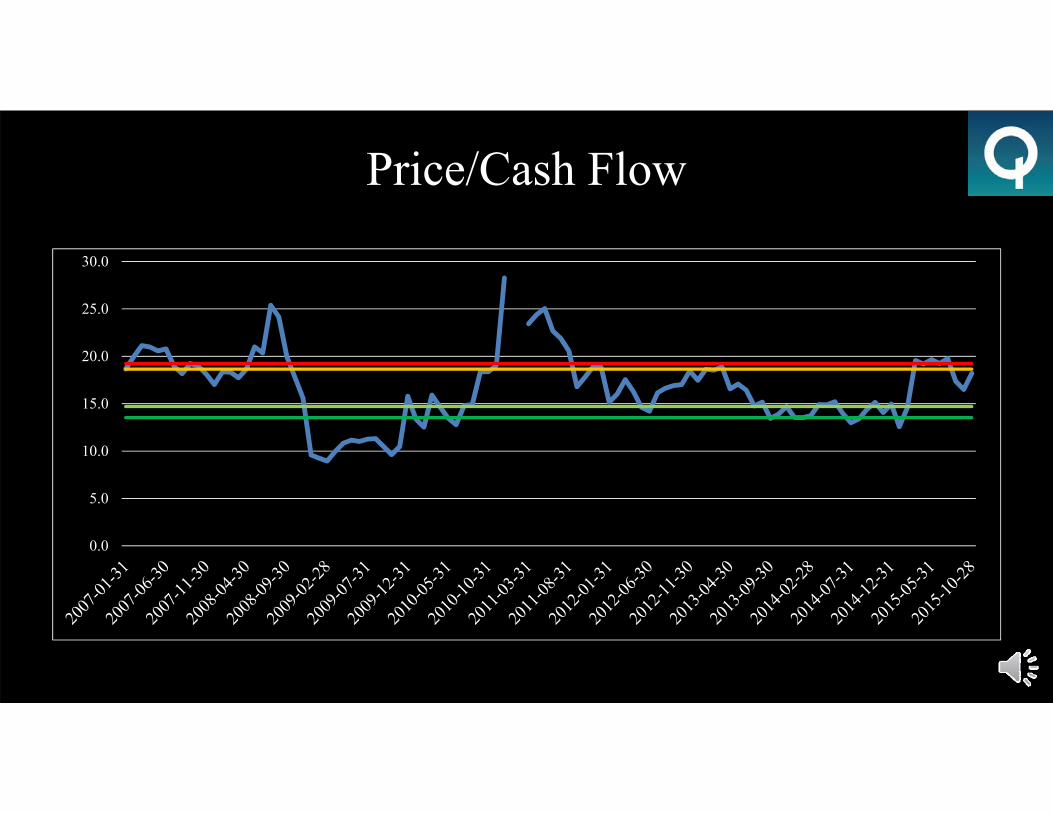
Price/Cash Flow
0.0
5.0
10.0
15.0
20.0
25.0
30.0

Price/Free Cash Flow
10.0
15.0
20.0
25.0
30.0
35.0

Enterprise Value/ Revenue
2.0
3.0
4.0
5.0
6.0
7.0
8.0
9.0
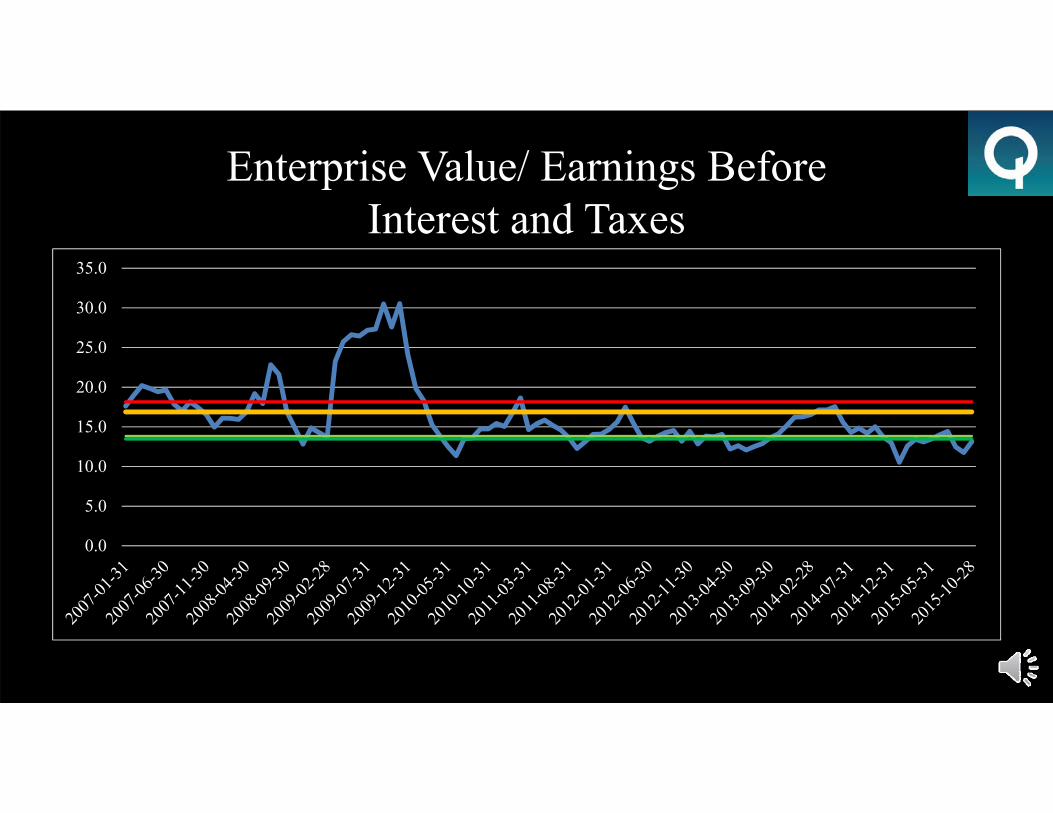
Enterprise Value/ Earnings Before Interest and Taxes
0.0
5.0
10.0
15.0
20.0
25.0
30.0
35.0

Enterprise Value/ Earnings Before Interest, Taxes, Depreciation, and Amortization
5.0
7.0
9.0
11.0
13.0
15.0
17.0
19.0
21.0
Discounted Cash Flow Model

Valueline’s Growth Rate
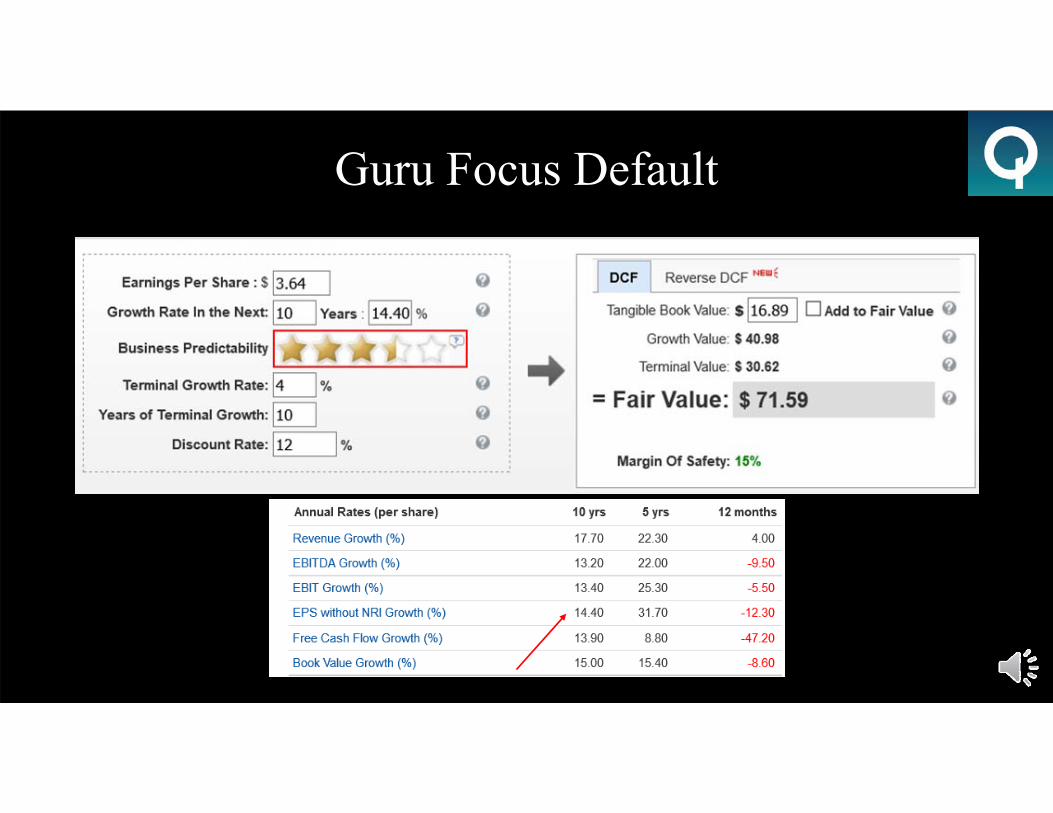
Guru Focus Default

Kill It
Cut 10 Year Growth Rate by 16.6%

Conscious Investor

5 Years

5 Year Safety
Cut Earnings Growth by 41.42% Cut P/E by 17.91%

10 Years

10 Year Safety
Cut P/E by 18.89%Cut Earnings Growth by 33.27%

Kill It
Cut P/E by 3.9%Cut Earnings Growth by 66.93%
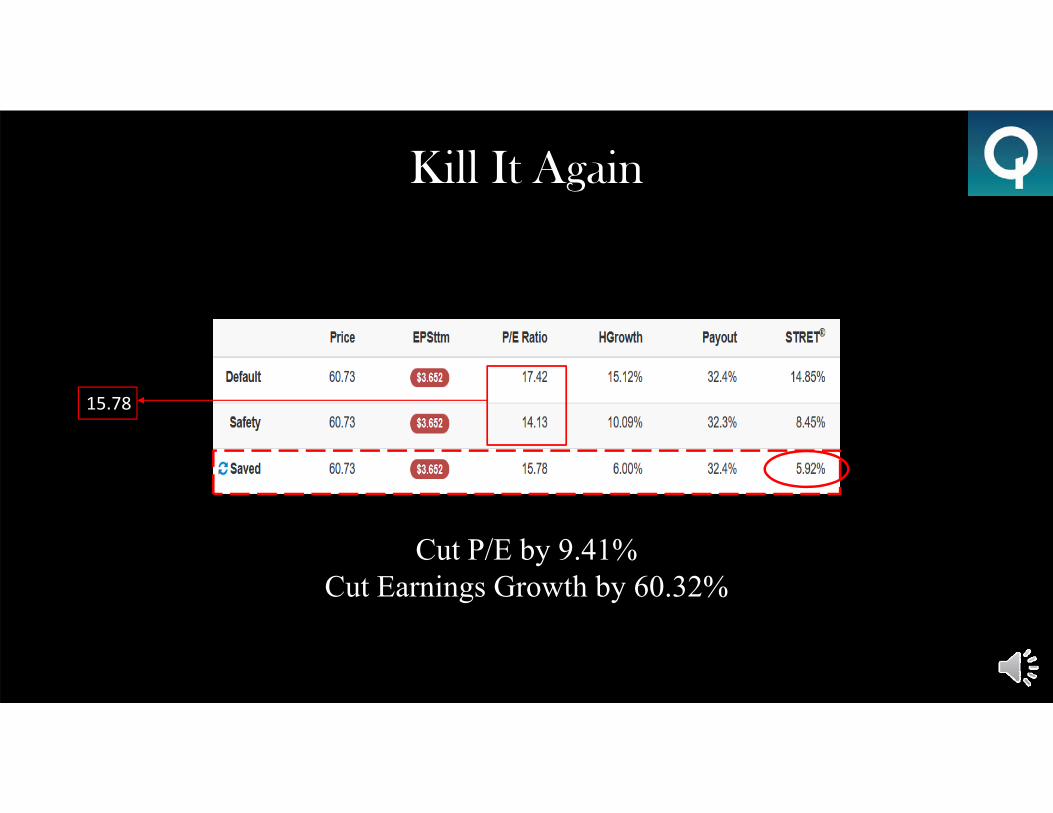
Kill It Again
15.78
Cut P/E by 9.41%Cut Earnings Growth by 60.32%
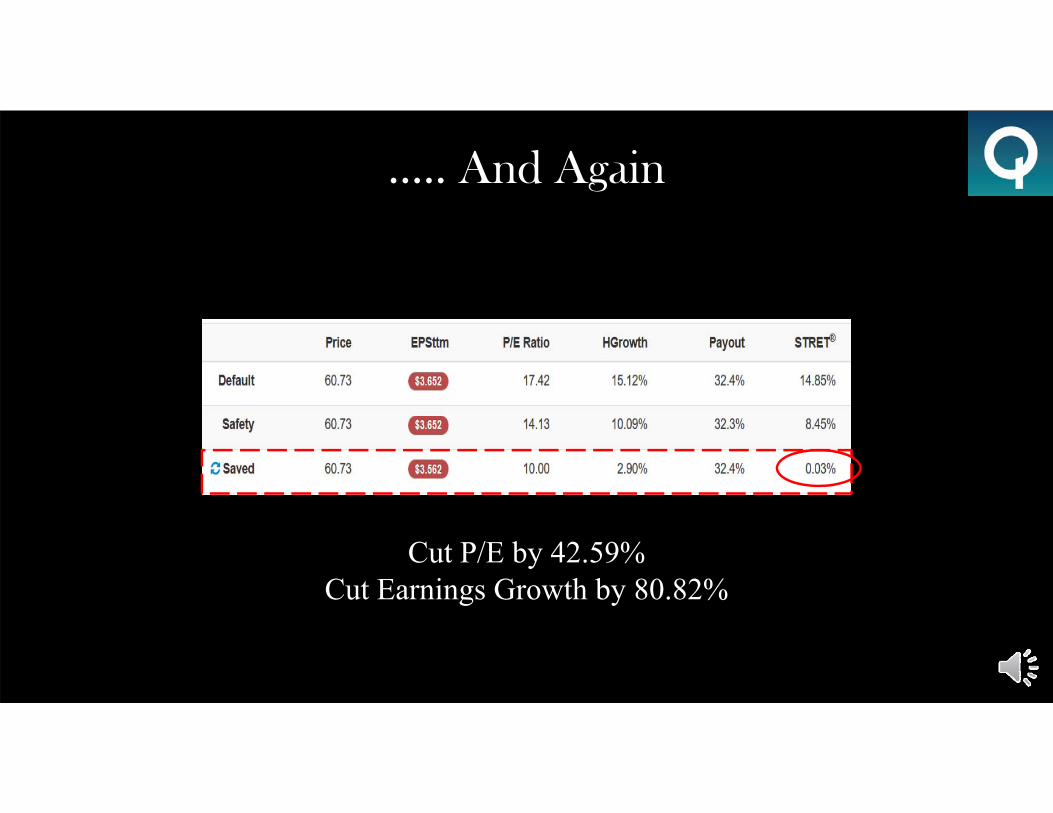
….. And Again
Cut P/E by 42.59%Cut Earnings Growth by 80.82%
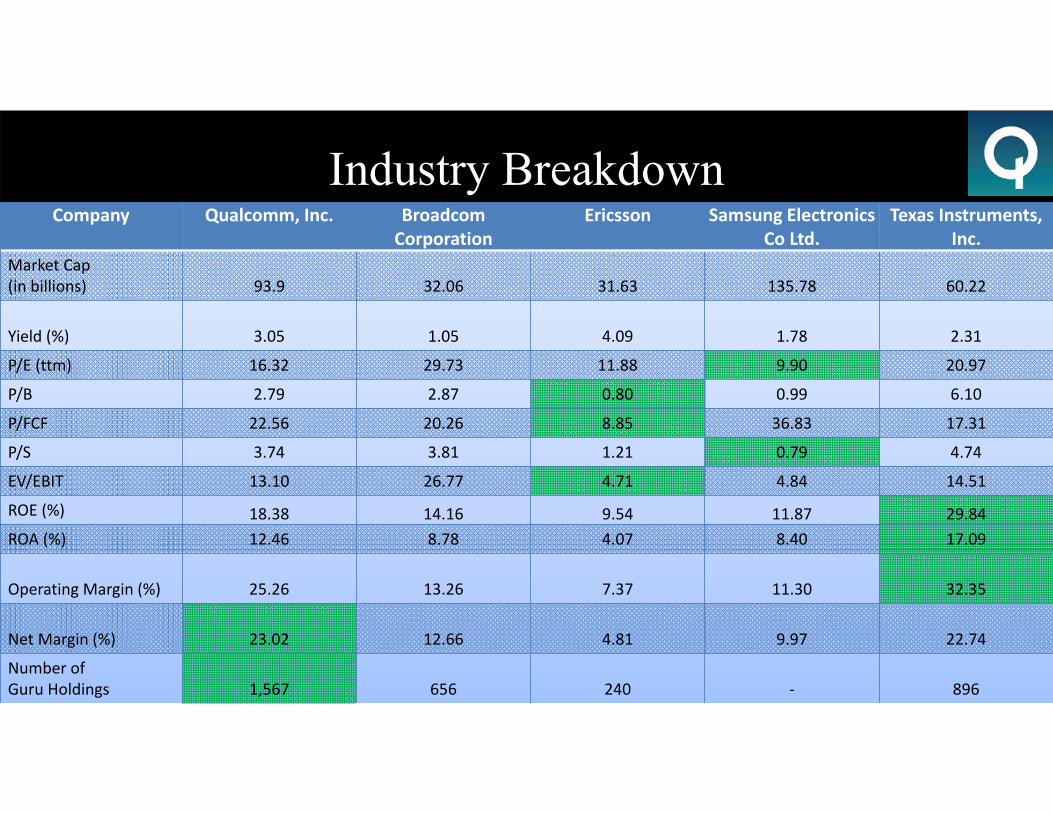
Industry BreakdownCompany Qualcomm, Inc. Broadcom
CorporationEricsson Samsung Electronics
Co Ltd.Texas Instruments,
Inc.Market Cap (in billions) 93.9 32.06 31.63 135.78 60.22
Yield (%) 3.05 1.05 4.09 1.78 2.31
P/E (ttm) 16.32 29.73 11.88 9.90 20.97
P/B 2.79 2.87 0.80 0.99 6.10
P/FCF 22.56 20.26 8.85 36.83 17.31
P/S 3.74 3.81 1.21 0.79 4.74
EV/EBIT 13.10 26.77 4.71 4.84 14.51
ROE (%) 18.38 14.16 9.54 11.87 29.84ROA (%) 12.46 8.78 4.07 8.40 17.09
Operating Margin (%) 25.26 13.26 7.37 11.30 32.35
Net Margin (%) 23.02 12.66 4.81 9.97 22.74
Number of Guru Holdings 1,567 656 240 ‐ 896
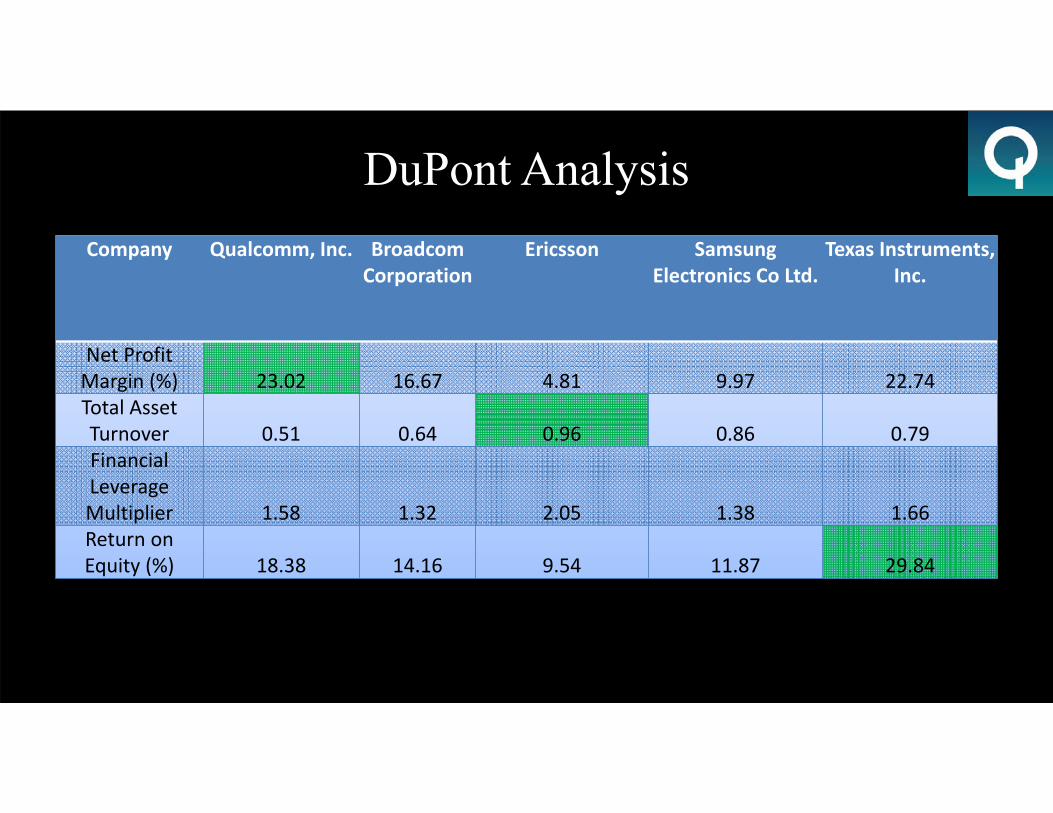
DuPont AnalysisCompany Qualcomm, Inc. Broadcom
CorporationEricsson Samsung
Electronics Co Ltd.Texas Instruments,
Inc.
Net ProfitMargin (%) 23.02 16.67 4.81 9.97 22.74Total Asset Turnover 0.51 0.64 0.96 0.86 0.79FinancialLeverage Multiplier 1.58 1.32 2.05 1.38 1.66Return on Equity (%) 18.38 14.16 9.54 11.87 29.84

Intra-Portfolio Valuations

Price/Earnings

Price/Book

Price/Sales
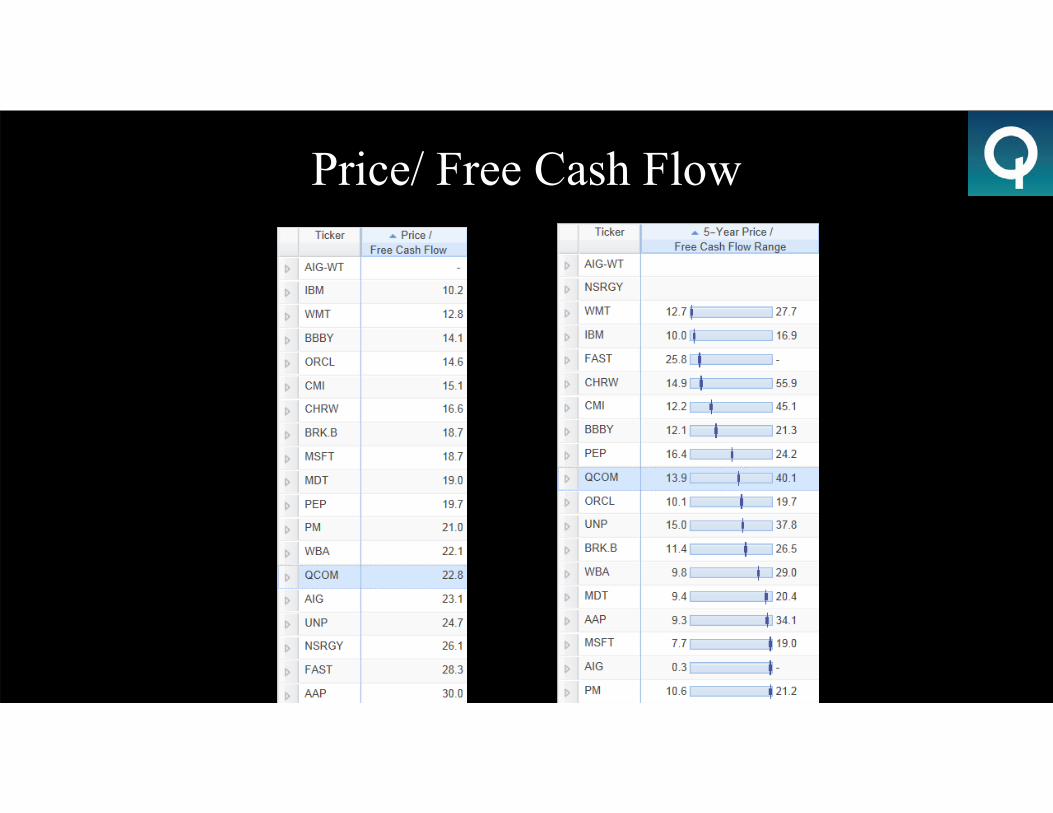
Price/ Free Cash Flow

Enterprise Value to Earnings Before Interest,Taxes, Depreciation, and Amortization
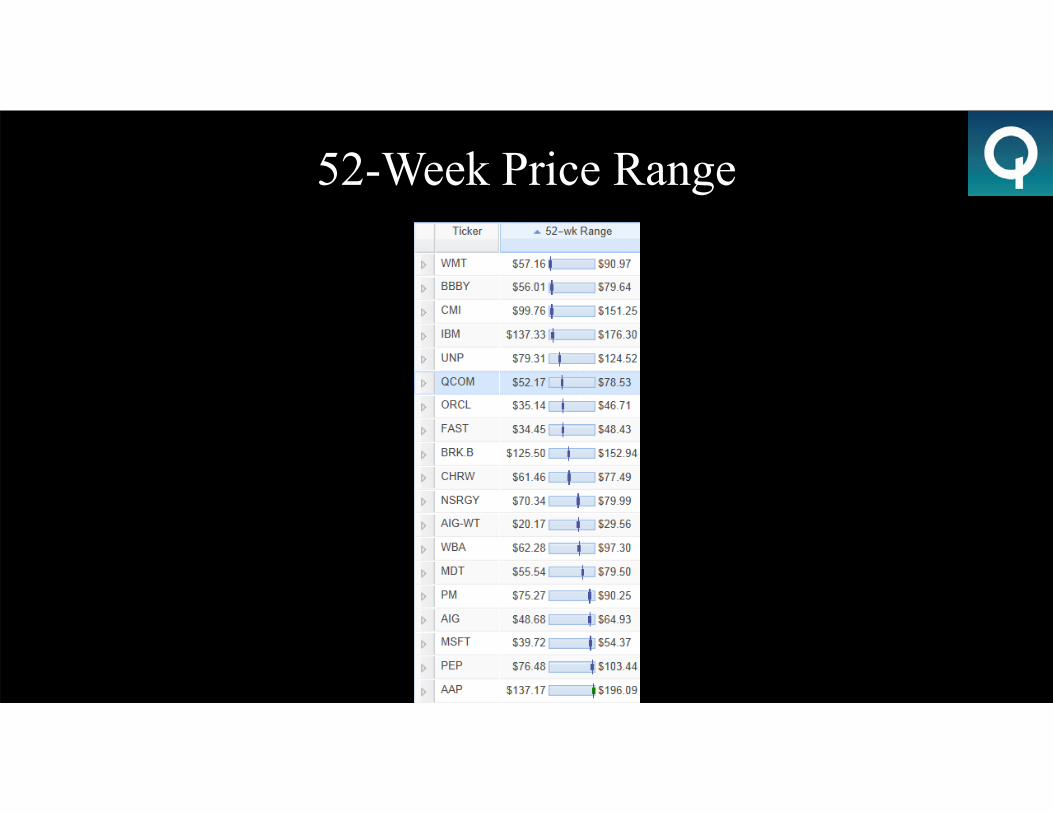
52-Week Price Range
Conclusion
Historically undervaluedStrong operating and profit marginsDeveloper of industry standardEffective use of licenses

Recommendation
Limit Order at $53.14"I try to buy stock in businesses that are so wonderful that an idiot can run them. Because sooner or later, one will.”-Warren Buffett