Embed Size (px)
Citation preview
Visitor Satisfaction & Commitment
(product, brand and service health check)

2
Key Performance Indicators (KPI’s)
3
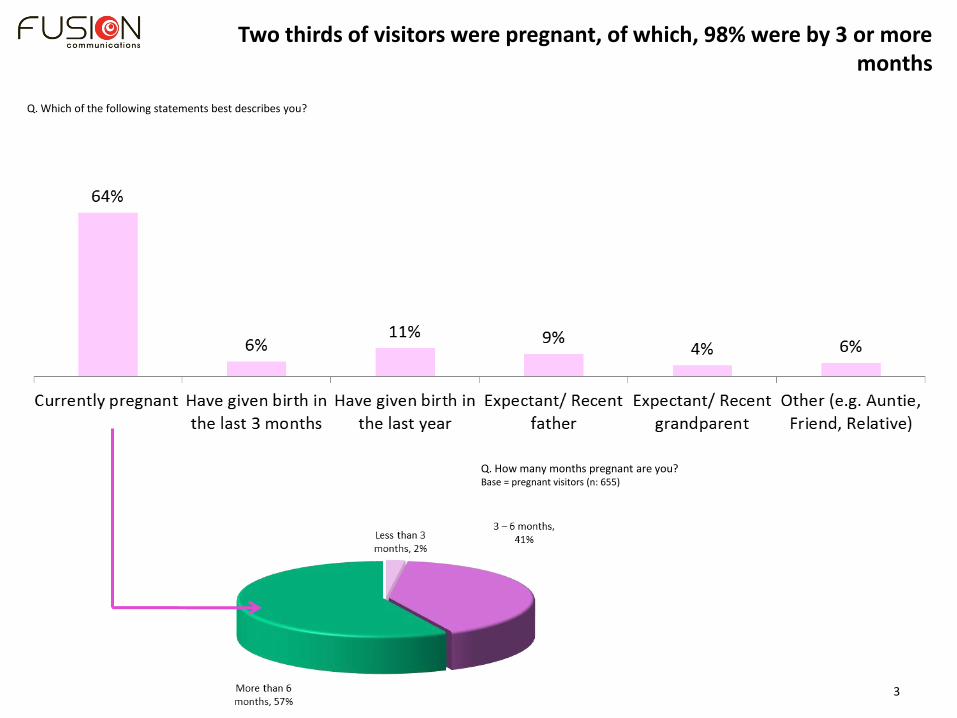
Q. How many months pregnant are you? Base = pregnant visitors (n: 655)
Two thirds of visitors were pregnant, of which, 98% were by 3 or more months
Q. Which of the following statements best describes you?
4
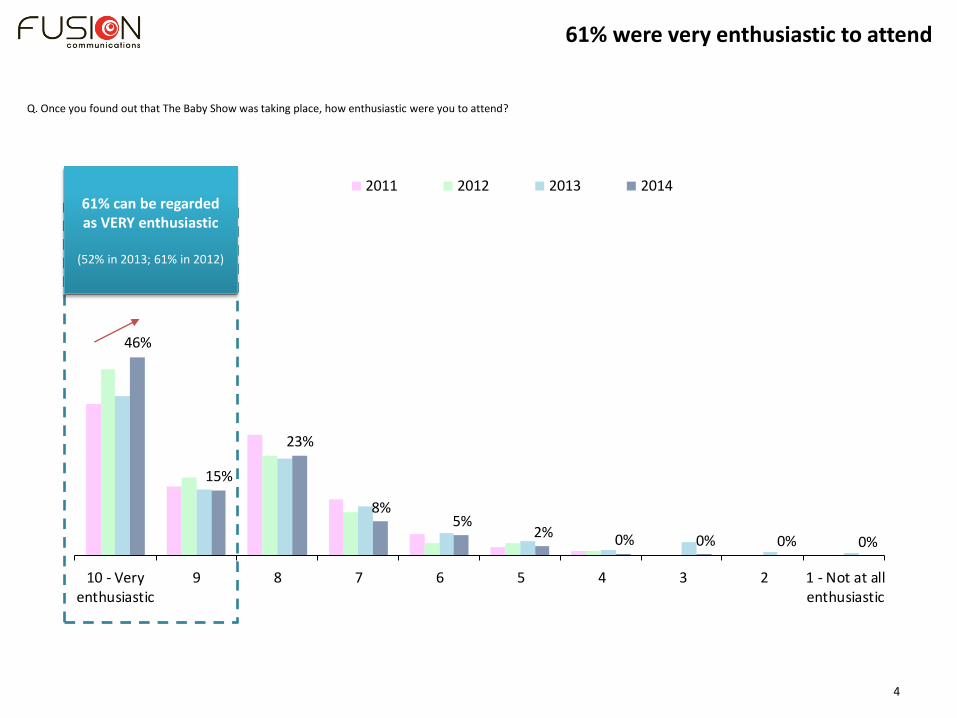
61% were very enthusiastic to attend
Q. Once you found out that The Baby Show was taking place, how enthusiastic were you to attend?
46%
15%
23%
8%5%
2% 0% 0% 0% 0%
10 - Veryenthusiastic
9 8 7 6 5 4 3 2 1 - Not at allenthusiastic
2011 2012 2013 201461% can be regarded as VERY enthusiastic
(52% in 2013; 61% in 2012)
5
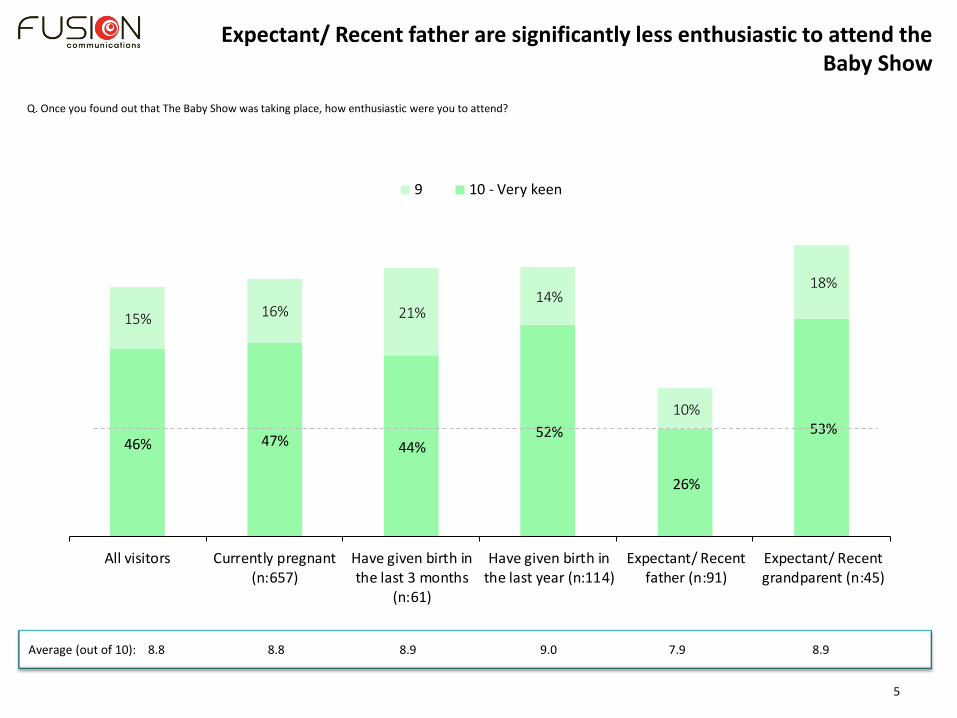
Expectant/ Recent father are significantly less enthusiastic to attend the Baby Show
Q. Once you found out that The Baby Show was taking place, how enthusiastic were you to attend?
46% 47% 44%52%
26%
53%
15% 16% 21%14%
10%
18%
All visitors Currently pregnant(n:657)
Have given birth inthe last 3 months
(n:61)
Have given birth inthe last year (n:114)
Expectant/ Recentfather (n:91)
Expectant/ Recentgrandparent (n:45)
9 10 - Very keen
Average (out of 10): 8.8 8.8 8.9 9.0 7.9 8.9
6
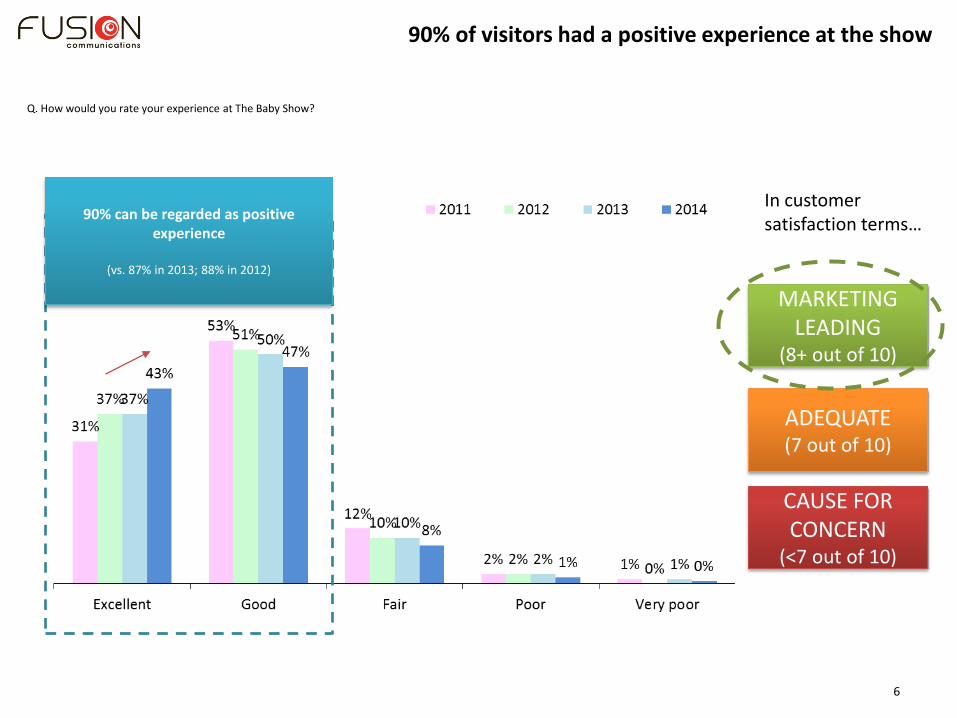
90% of visitors had a positive experience at the show
Q. How would you rate your experience at The Baby Show?
90% can be regarded as positive experience
(vs. 87% in 2013; 88% in 2012)
MARKETING LEADING
(8+ out of 10)
ADEQUATE (7 out of 10)
CAUSE FOR CONCERN
(<7 out of 10)
In customer satisfaction terms…
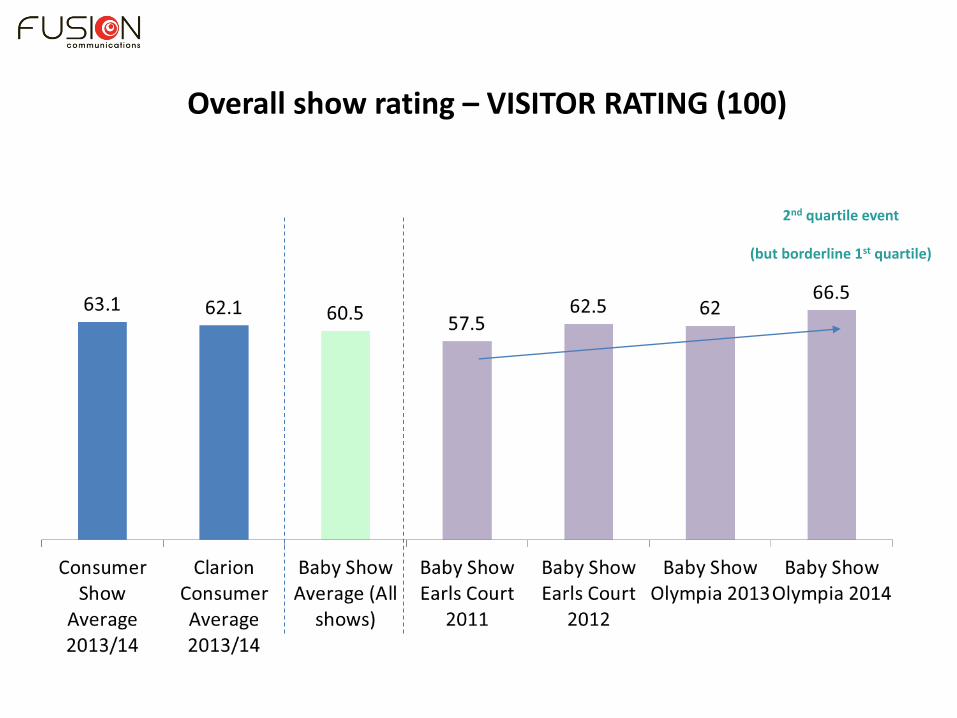
Overall show rating – VISITOR RATING (100)
2nd quartile event
(but borderline 1st quartile)
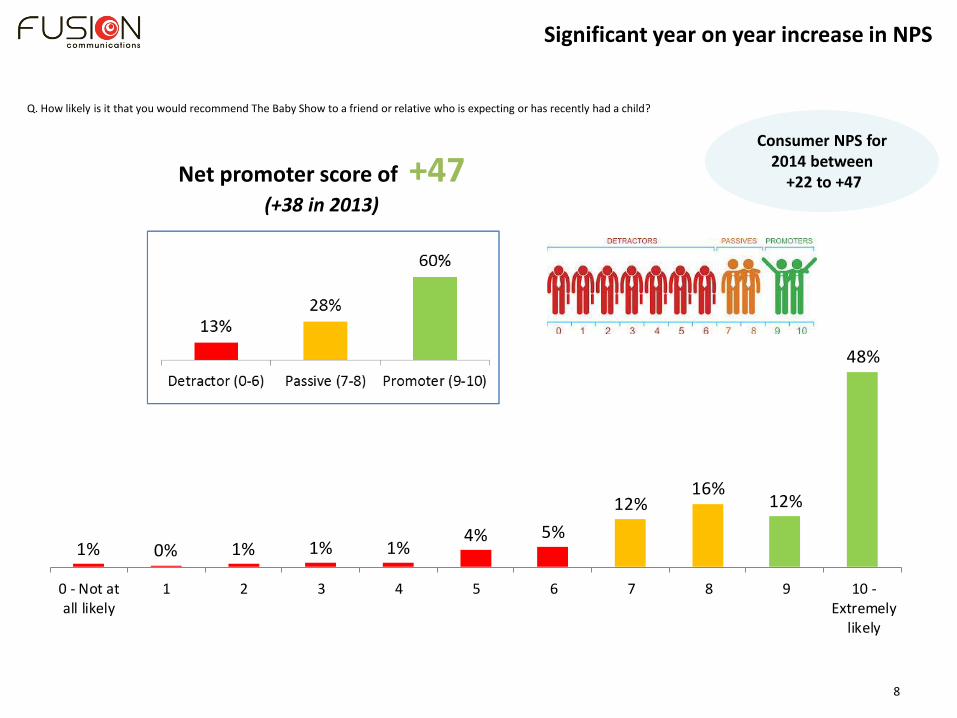
1% 0% 1% 1% 1%4% 5%
12%16%
12%
48%
0 - Not atall likely
1 2 3 4 5 6 7 8 9 10 -Extremely
likely
8
Net promoter score of +47 (+38 in 2013)
Significant year on year increase in NPS
Q. How likely is it that you would recommend The Baby Show to a friend or relative who is expecting or has recently had a child?
Consumer NPS for 2014 between
+22 to +47

9
88% are likely to return in future
Q. How likely would you be to visit The Baby Show in the future?
88% likely to return in future (84% in 2013; 86% in 2012
83% in 2011)

10
KPI modelling
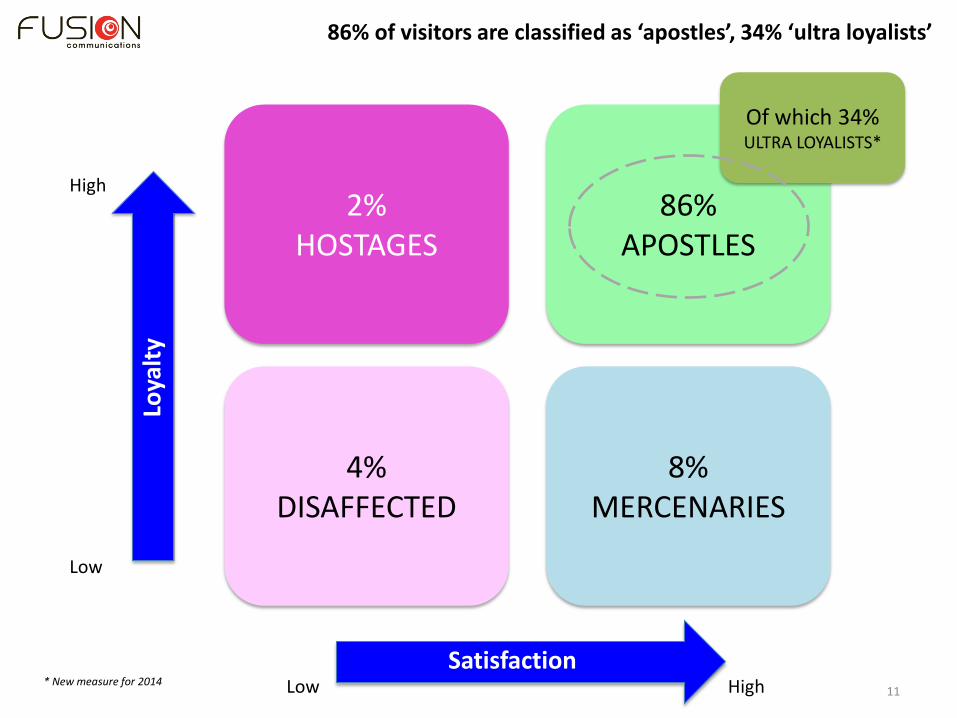
8% MERCENARIES
11
86% of visitors are classified as ‘apostles’, 34% ‘ultra loyalists’
86% APOSTLES
2% HOSTAGES
4% DISAFFECTED
Loya
lty
High
Low
Satisfaction Low High
Of which 34% ULTRA LOYALISTS*
* New measure for 2014

12
Other research results
13
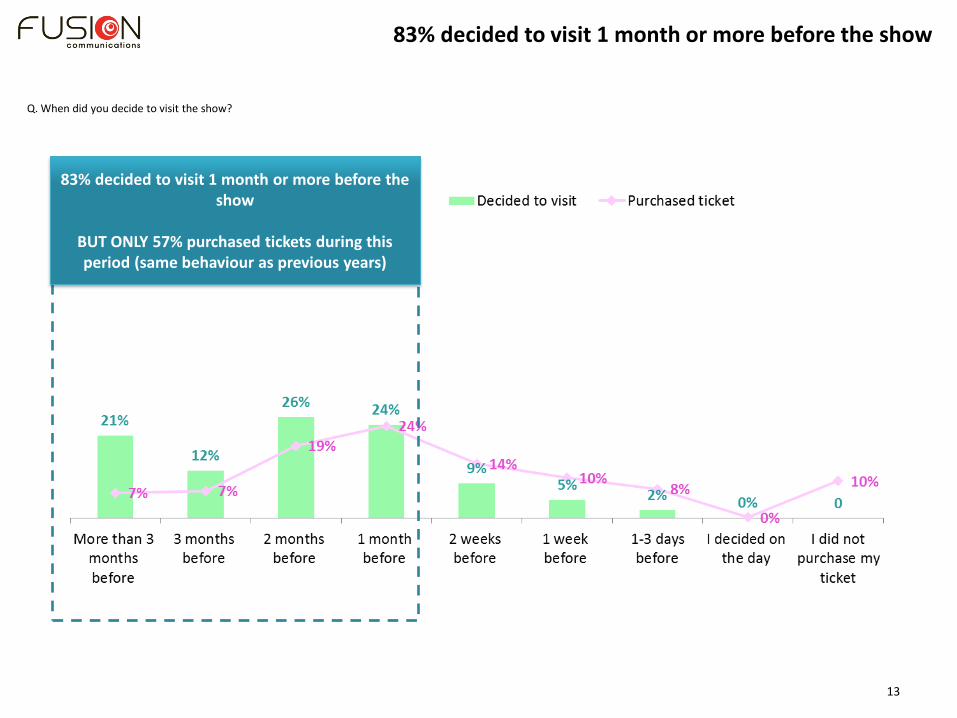
83% decided to visit 1 month or more before the show
BUT ONLY 57% purchased tickets during this period (same behaviour as previous years)
83% decided to visit 1 month or more before the show
Q. When did you decide to visit the show?

4%
2%
0%
1%
1%
1%
2%
3%
3%
5%
5%
8%
8%
8%
14%
21%
62%
I attended on my own
Other
Parent(s)/Guardian(s)
Work colleague(s)
Father-in-law
Brother(s)
Grandparent(s)
Father
Other family
Mother-in-law
Son(s)/Son-in-law(s)
Sister(s)
Children
Daughter(s)/Daughter-in-law(s)
Friend(s)
Mother
Partner
14
Most likely to visit the show with their partner
Q. Who did you visit the show with?
15
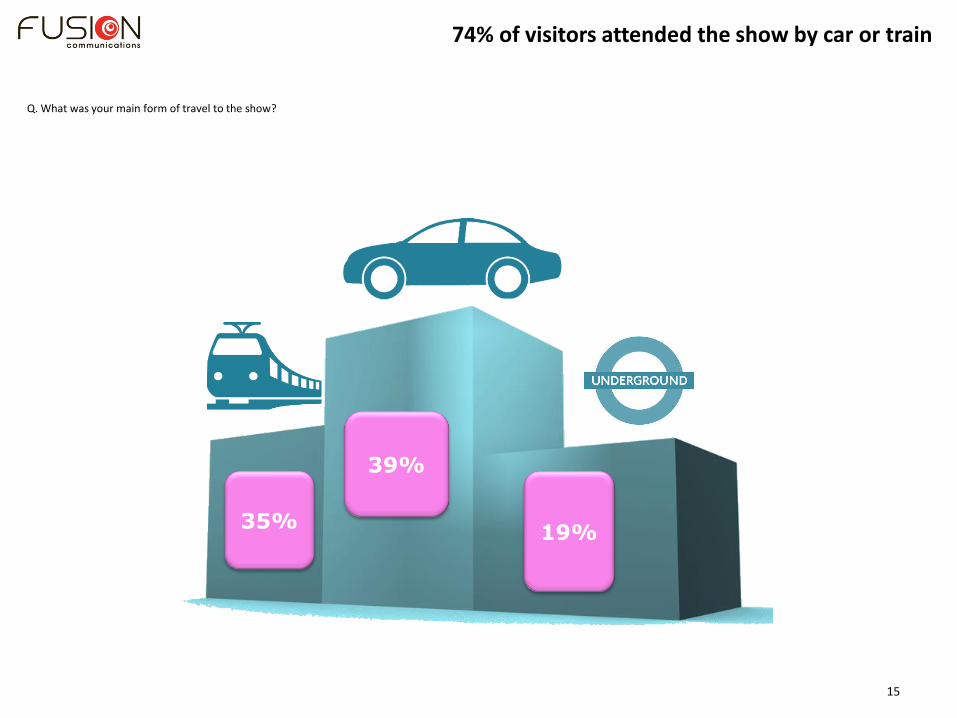
35%
39%
19%
74% of visitors attended the show by car or train
Q. What was your main form of travel to the show?
16
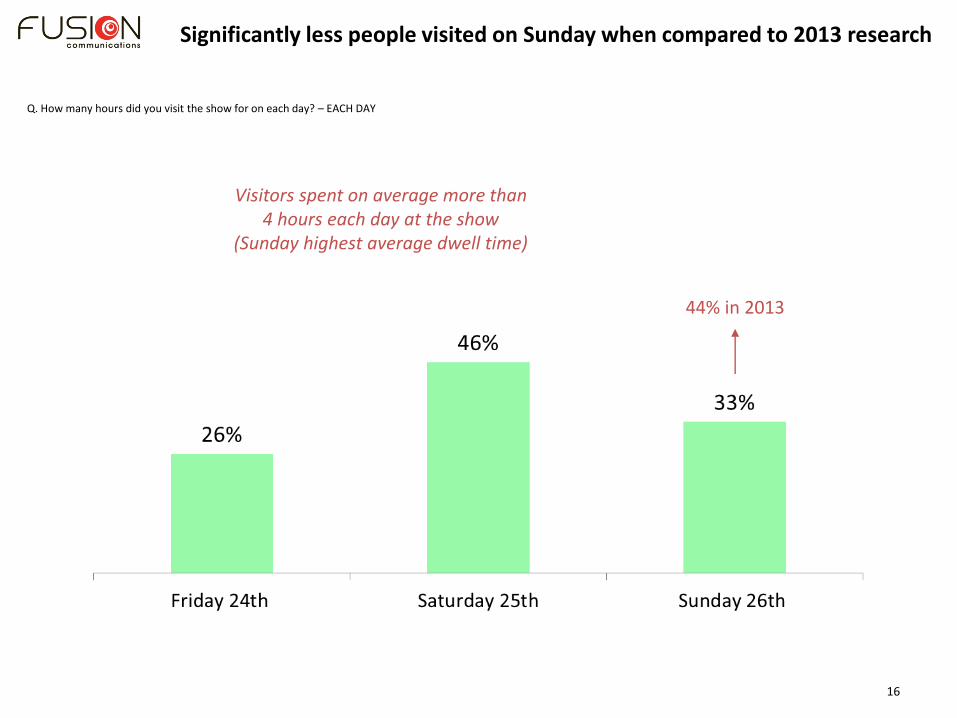
Significantly less people visited on Sunday when compared to 2013 research
Q. How many hours did you visit the show for on each day? – EACH DAY
44% in 2013
Visitors spent on average more than 4 hours each day at the show
(Sunday highest average dwell time)
17
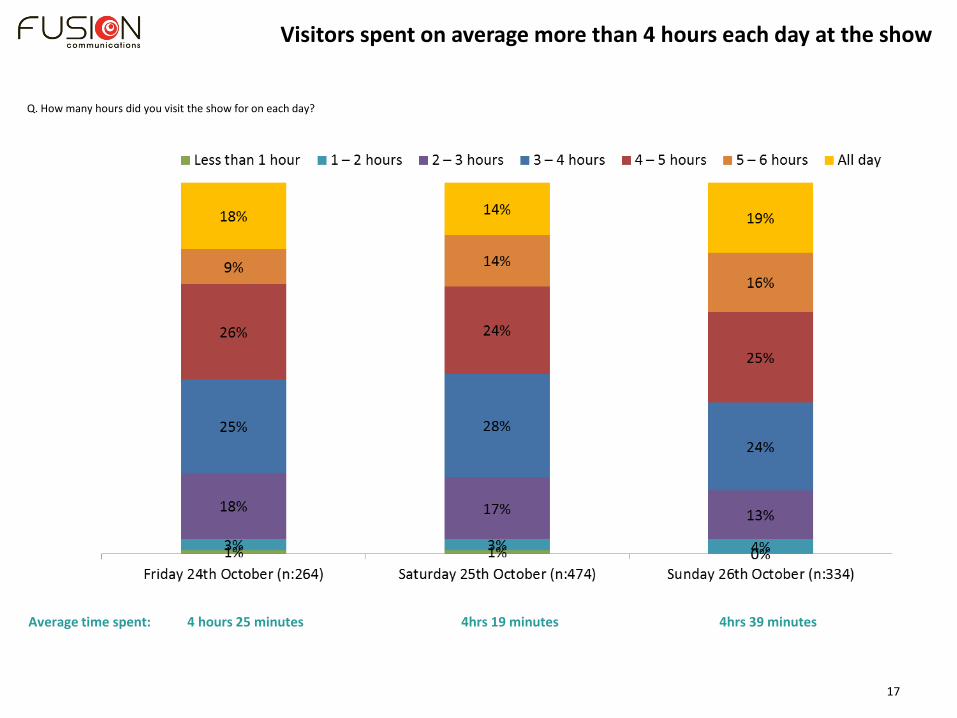
Average time spent: 4 hours 25 minutes 4hrs 19 minutes 4hrs 39 minutes
Visitors spent on average more than 4 hours each day at the show
Q. How many hours did you visit the show for on each day?

18
65% spent as long as they had intended to at the Baby Show
Q. Did you plan to spend more or less time at the show before you arrived?
Planned to
spend more
time at the show
Planned to
spend less time
at the show
17% 18%
I stayed as long as I had intended to,
65%
19
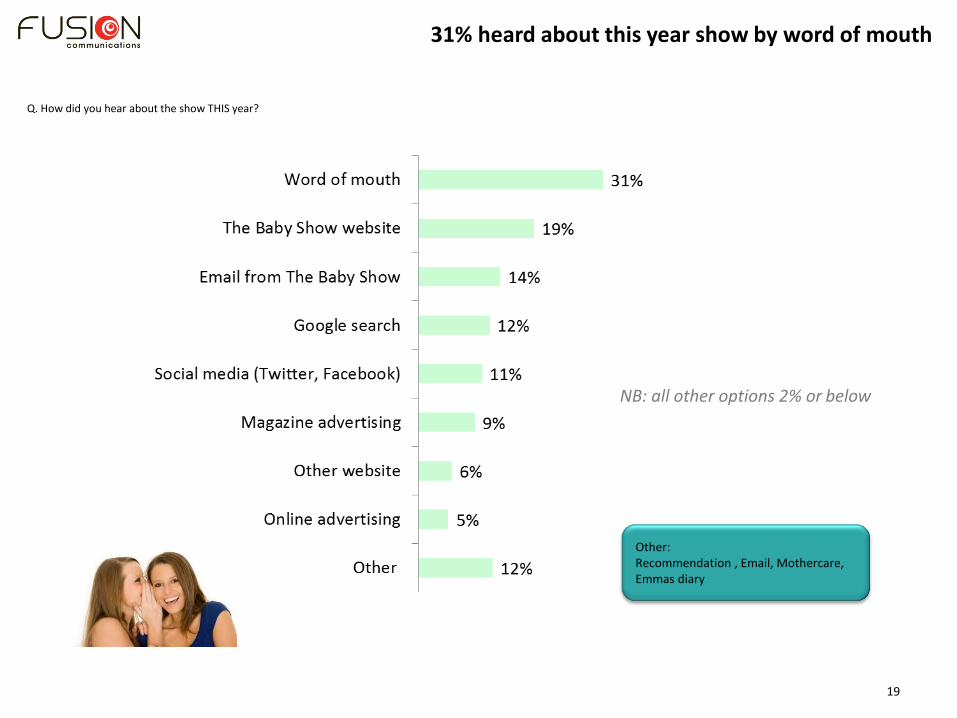
31% heard about this year show by word of mouth
Q. How did you hear about the show THIS year?
NB: all other options 2% or below
Other: Recommendation , Email, Mothercare, Emmas diary

20
On average, visitors were motivated by 5 reasons – key motivators surround products and prices
Q. Which of the following motivated you to visit the show?
21
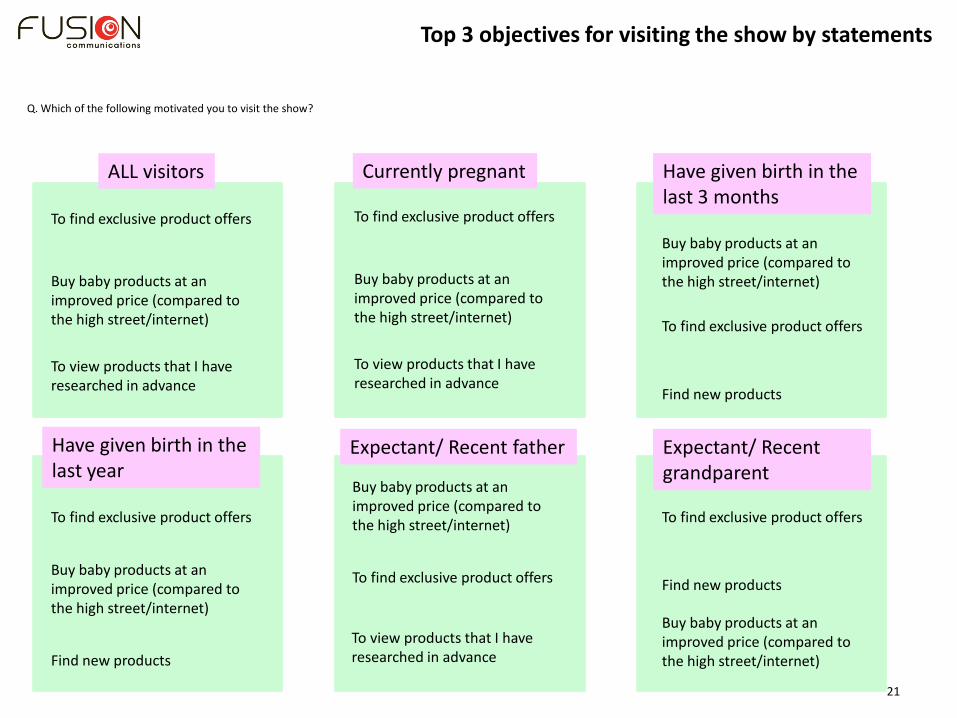
Top 3 objectives for visiting the show by statements
Q. Which of the following motivated you to visit the show?
To find exclusive product offers
Buy baby products at an improved price (compared to the high street/internet)
To view products that I have researched in advance
Currently pregnant Have given birth in the last 3 months
To find exclusive product offers
Buy baby products at an improved price (compared to the high street/internet)
Find new products
Have given birth in the last year
To find exclusive product offers
Buy baby products at an improved price (compared to the high street/internet)
Find new products
To find exclusive product offers
Buy baby products at an improved price (compared to the high street/internet)
To view products that I have researched in advance
Expectant/ Recent father Expectant/ Recent grandparent
To find exclusive product offers
Buy baby products at an improved price (compared to the high street/internet)
Find new products
To find exclusive product offers
Buy baby products at an improved price (compared to the high street/internet)
To view products that I have researched in advance
ALL visitors
22
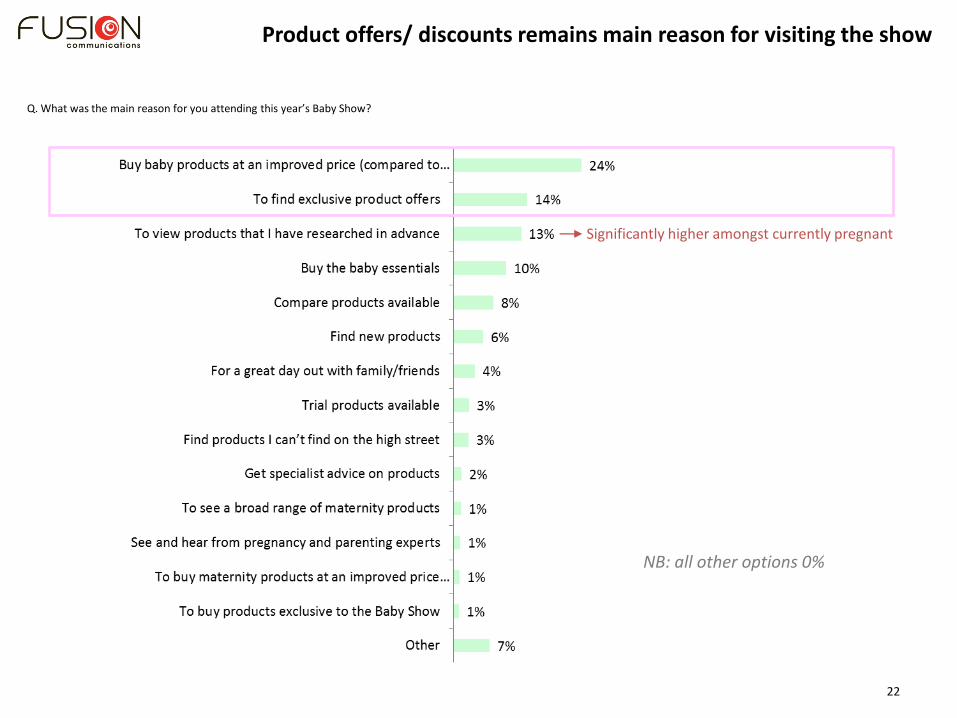
Product offers/ discounts remains main reason for visiting the show
Q. What was the main reason for you attending this year’s Baby Show?
NB: all other options 0%
Significantly higher amongst currently pregnant
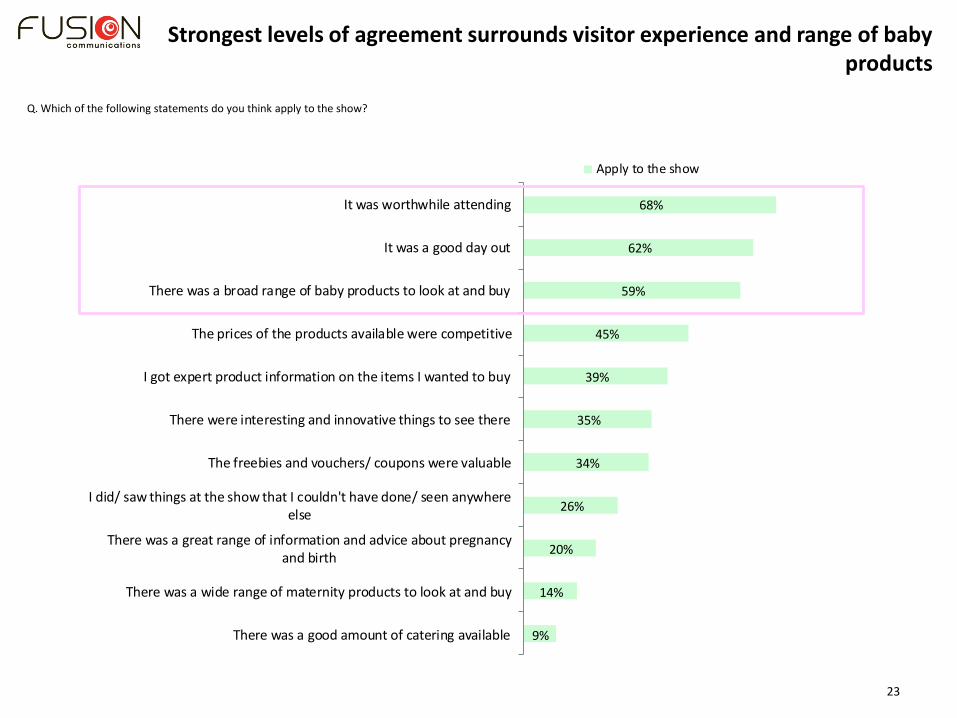
9%
14%
20%
26%
34%
35%
39%
45%
59%
62%
68%
There was a good amount of catering available
There was a wide range of maternity products to look at and buy
There was a great range of information and advice about pregnancyand birth
I did/ saw things at the show that I couldn't have done/ seen anywhereelse
The freebies and vouchers/ coupons were valuable
There were interesting and innovative things to see there
I got expert product information on the items I wanted to buy
The prices of the products available were competitive
There was a broad range of baby products to look at and buy
It was a good day out
It was worthwhile attending
Apply to the show
23
Strongest levels of agreement surrounds visitor experience and range of baby products
Q. Which of the following statements do you think apply to the show?

24
10%
2%
4%
9%
14%
15%
26%
41%
52%
None of these
Other
The Baby Show Blog
Social Media updates (on Facebook,Twitter or Instagram)
Discount vouchers for products
Emails sent by The Baby Show team
Signs around the show
The Show Guide
Baby Show website
90% of visitors used one of the Baby Show visitor tools – Website and Show Guide key tools used
Q. Which of the following did you use to help you get the most from your visit to The Baby Show?
25
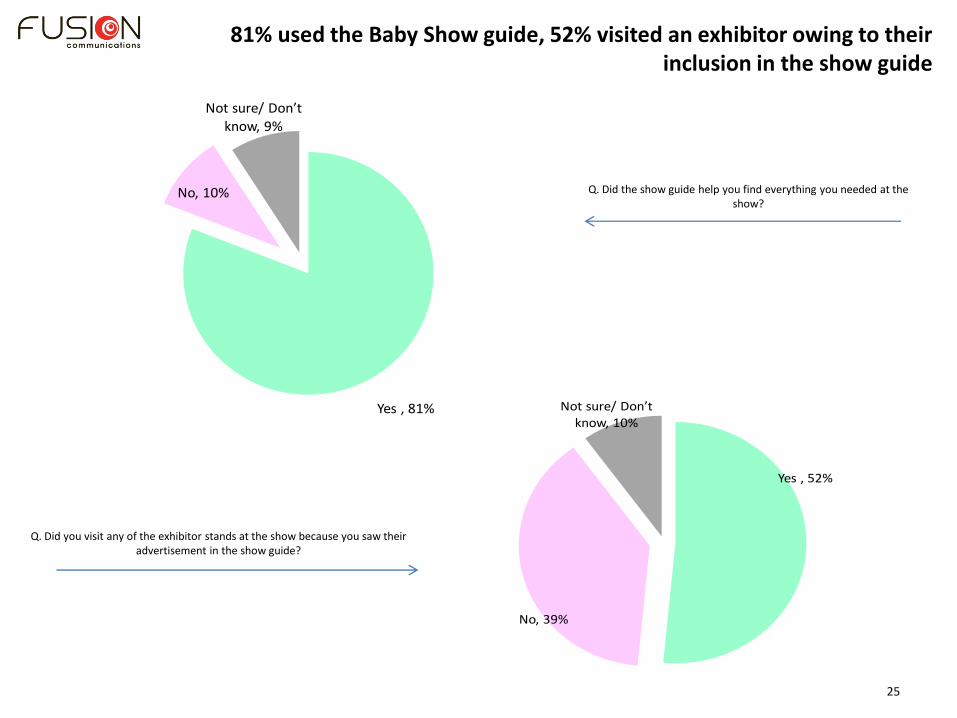
Q. Did the show guide help you find everything you needed at the show?
Yes , 81%
No, 10%
Not sure/ Don’t know, 9%
Q. Did you visit any of the exhibitor stands at the show because you saw their advertisement in the show guide?
Yes , 52%
No, 39%
Not sure/ Don’t know, 10%
81% used the Baby Show guide, 52% visited an exhibitor owing to their inclusion in the show guide
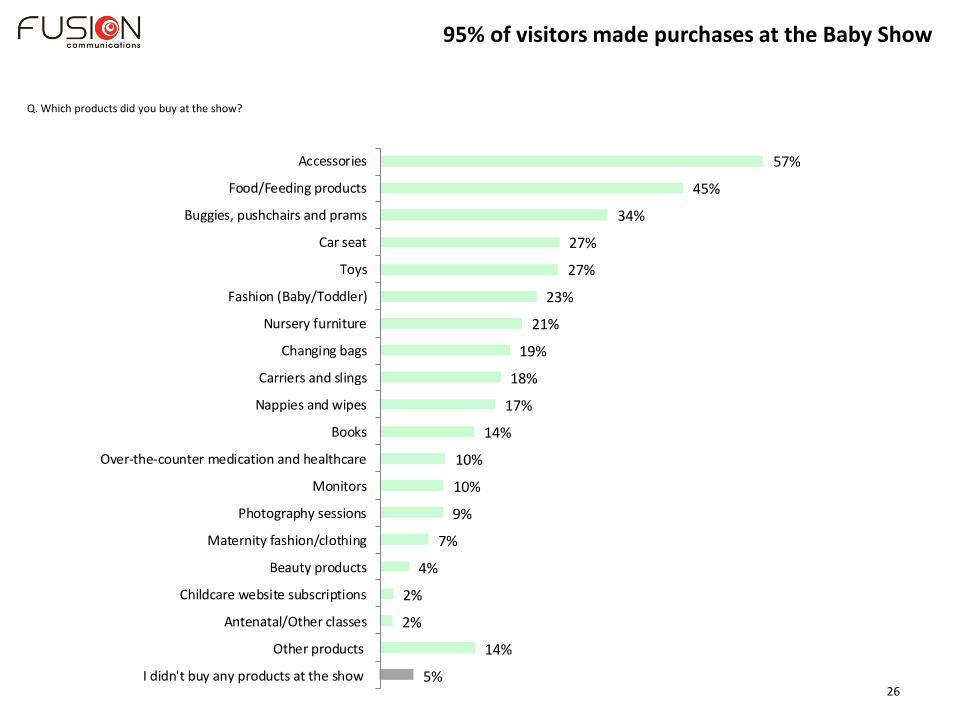
26 5%
14%
2%
2%
4%
7%
9%
10%
10%
14%
17%
18%
19%
21%
23%
27%
27%
34%
45%
57%
I didn't buy any products at the show
Other products
Antenatal/Other classes
Childcare website subscriptions
Beauty products
Maternity fashion/clothing
Photography sessions
Monitors
Over-the-counter medication and healthcare
Books
Nappies and wipes
Carriers and slings
Changing bags
Nursery furniture
Fashion (Baby/Toddler)
Toys
Car seat
Buggies, pushchairs and prams
Food/Feeding products
Accessories
95% of visitors made purchases at the Baby Show
Q. Which products did you buy at the show?
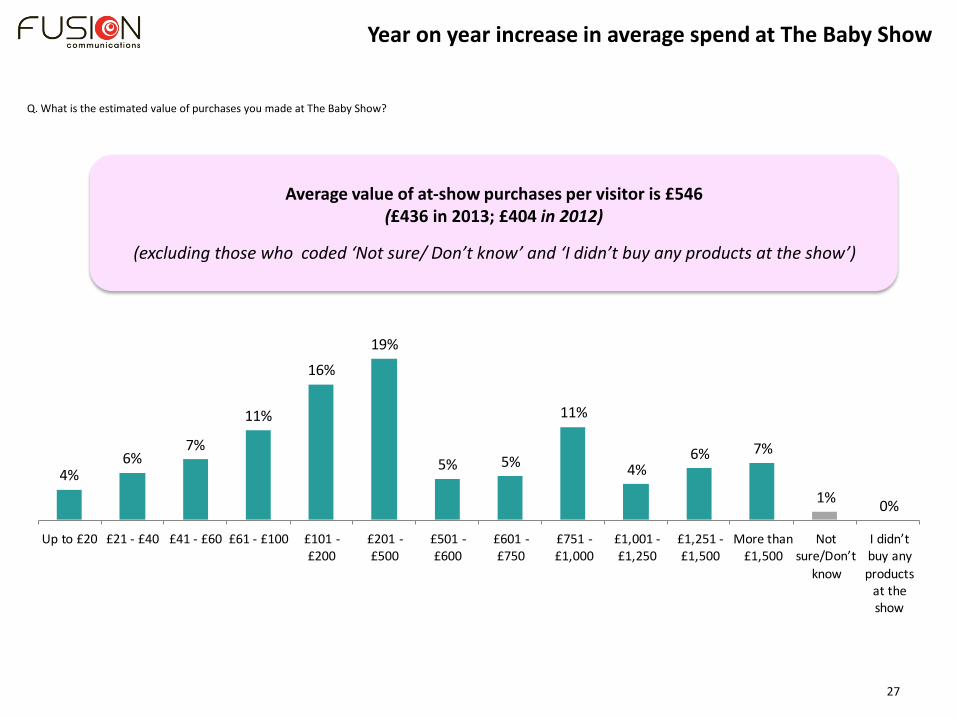
4%6%
7%
11%
16%
19%
5% 5%
11%
4%6% 7%
1%0%
Up to £20 £21 - £40 £41 - £60 £61 - £100 £101 -£200
£201 -£500
£501 -£600
£601 -£750
£751 -£1,000
£1,001 -£1,250
£1,251 -£1,500
More than£1,500
Not sure/Don’t
know
I didn’t buy any
products at the show
27
Average value of at-show purchases per visitor is £546 (£436 in 2013; £404 in 2012)
(excluding those who coded ‘Not sure/ Don’t know’ and ‘I didn’t buy any products at the show’)
Year on year increase in average spend at The Baby Show
Q. What is the estimated value of purchases you made at The Baby Show?

27%
4%
1%
3%
3%
3%
4%
5%
6%
9%
11%
12%
13%
14%
14%
16%
16%
18%
20%
21%
I don’t intend to buy any products after the show
Other products
Childcare website subscriptions
Antenatal/Other classes
Beauty products
Maternity fashion/clothing
Over-the-counter medication and healthcare
Books
Photography sessions
Fashion (Baby/Toddler)
Changing bags
Monitors
Toys
Accessories
Nappies and wipes
Carriers and slings
Car seat
Nursery furniture
Food/Feeding products
Buggies, pushchairs and prams
28
73% intend to make a purchase as a result of seeing it at the Baby Show
Q. Which products, if any, do you now intend to buy as a result of seeing them at The Baby Show?
Buggies, Pushchairs and Prams 20% Nursery Furniture 19% Food/Feeding Products 19% Accessories 16% Toys 15%
Top 5 in 2013
29
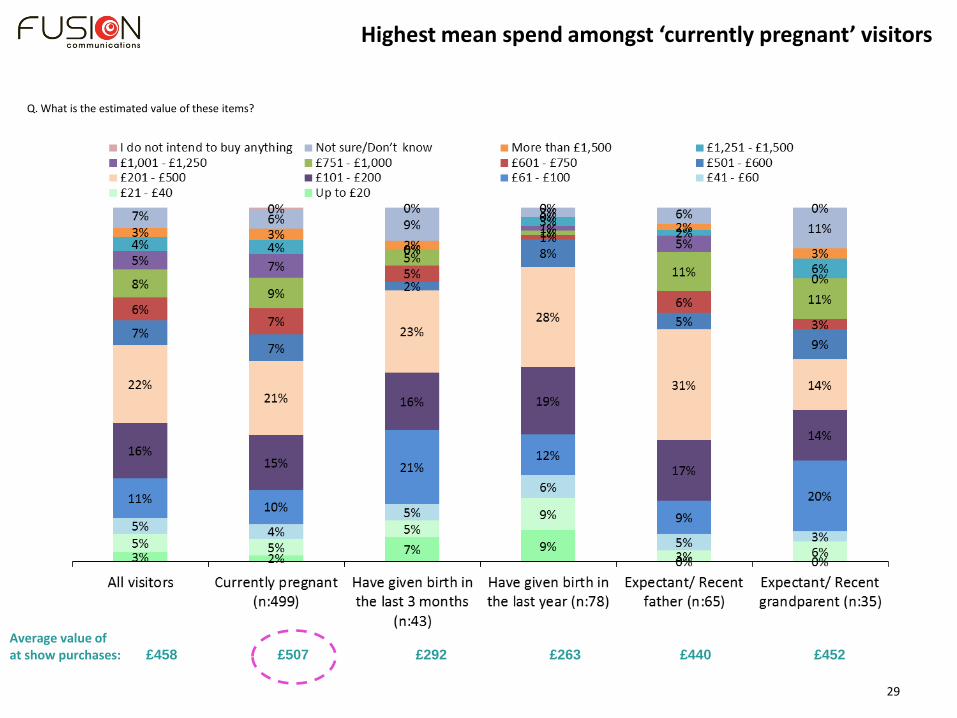
Average value of at show purchases: £458 £507 £292 £263 £440 £452
Highest mean spend amongst ‘currently pregnant’ visitors
Q. What is the estimated value of these items?
30
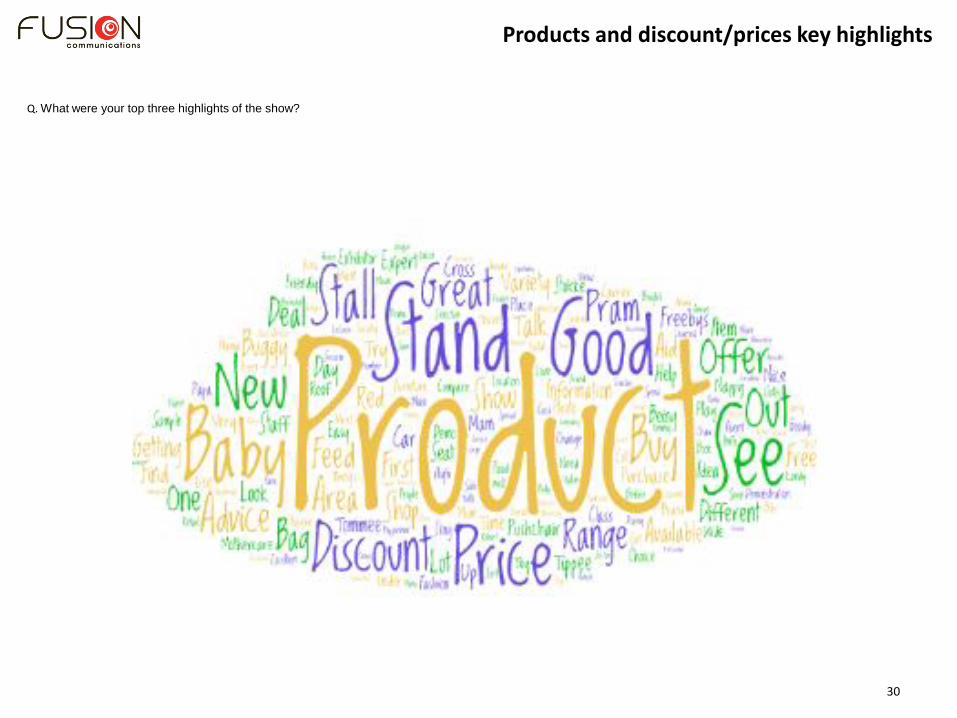
Products and discount/prices key highlights
Q. What were your top three highlights of the show?

31
Midwifes
Pregnancy
& birth
Baby
Pregnancy
topics
Dr Robert Winston
hypnobirthing
Health visitors
‘Mamas&Papas’ and ‘Mothercare’ key brands expected at the show
Q. What brands/ experts would you like to see at future shows to answer your questions on …
Breastfeeding
More
clothing
More
nappies
Organic and
natural products
More toys

32
Visitor profile
1%8%
28%
38%
16%
4% 2% 3% 1%
18 - 20years old
21 - 25years old
26 - 30years old
31 - 35years old
36 – 40 years old
41 – 45 years old
46 – 50 years old
51 – 60 years old
61 + yearsold
33
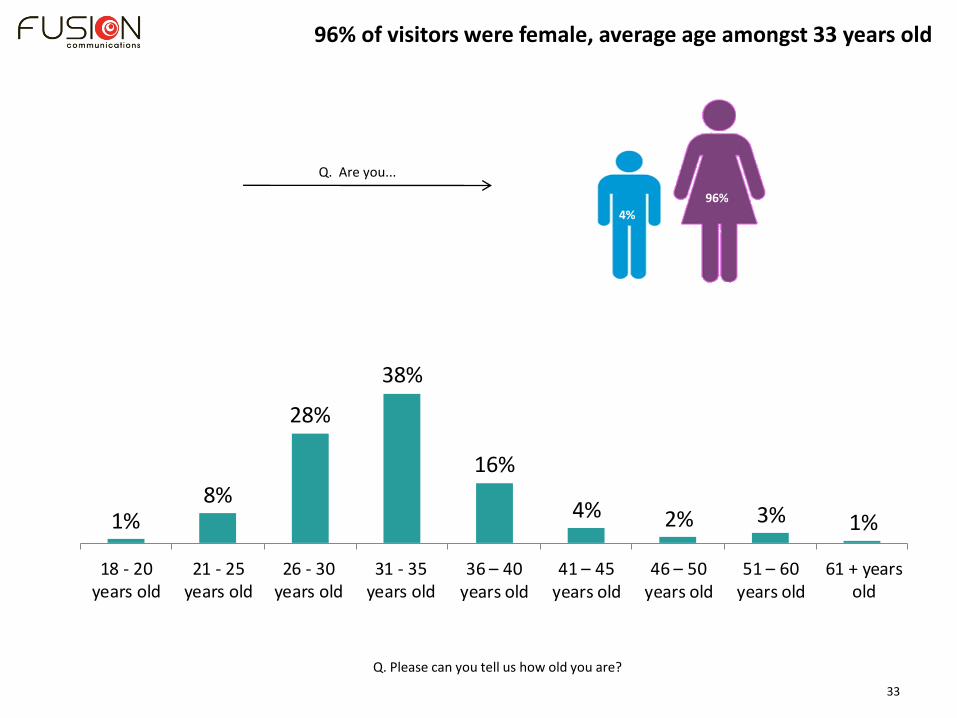
Q. Please can you tell us how old you are?
Q. Are you...
4%
96%
96% of visitors were female, average age amongst 33 years old
34
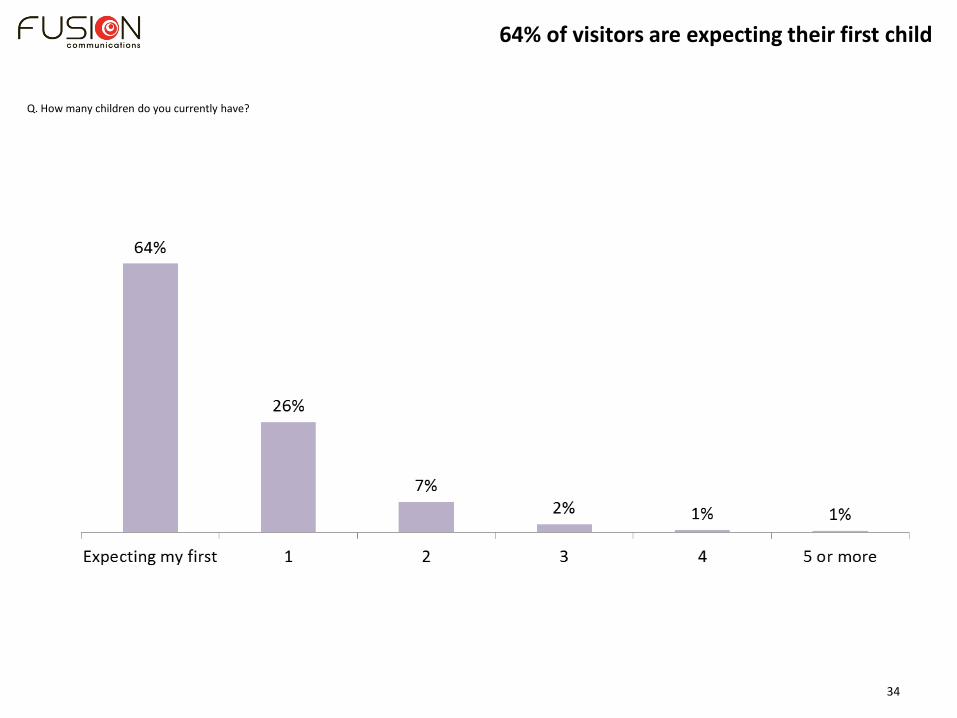
64% of visitors are expecting their first child
Q. How many children do you currently have?
35
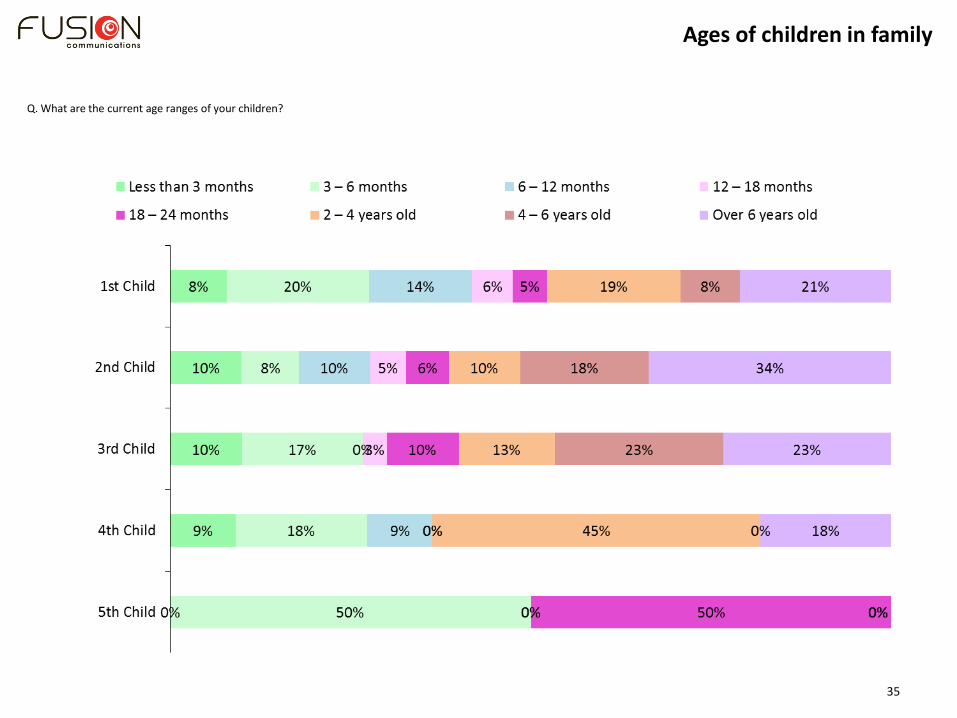
Ages of children in family
Q. What are the current age ranges of your children?
36
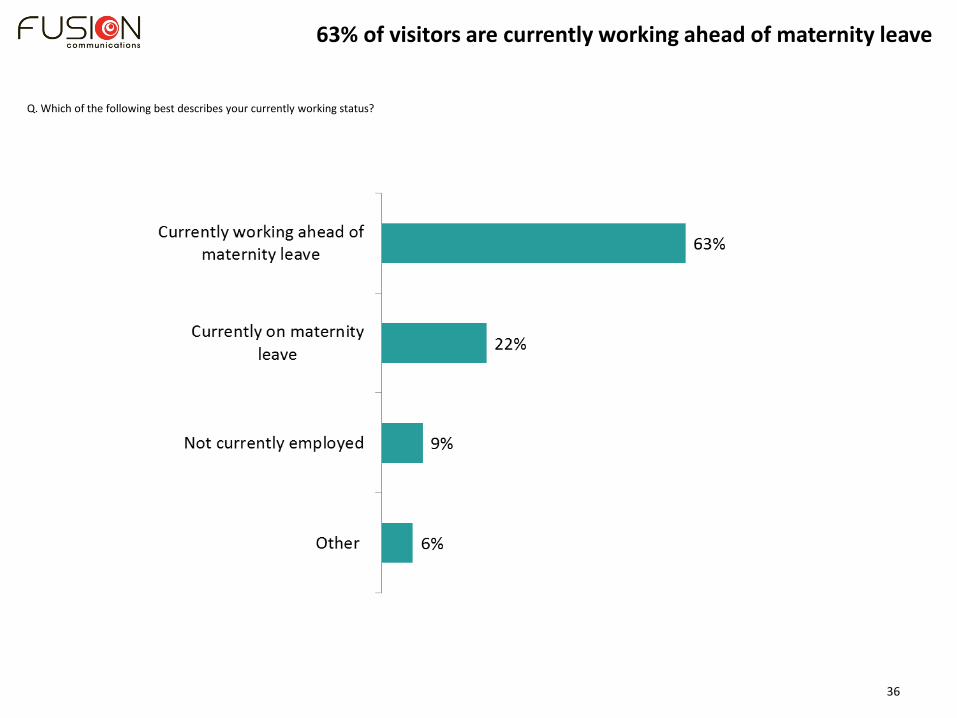
63% of visitors are currently working ahead of maternity leave
Q. Which of the following best describes your currently working status?
37
Key findings
38
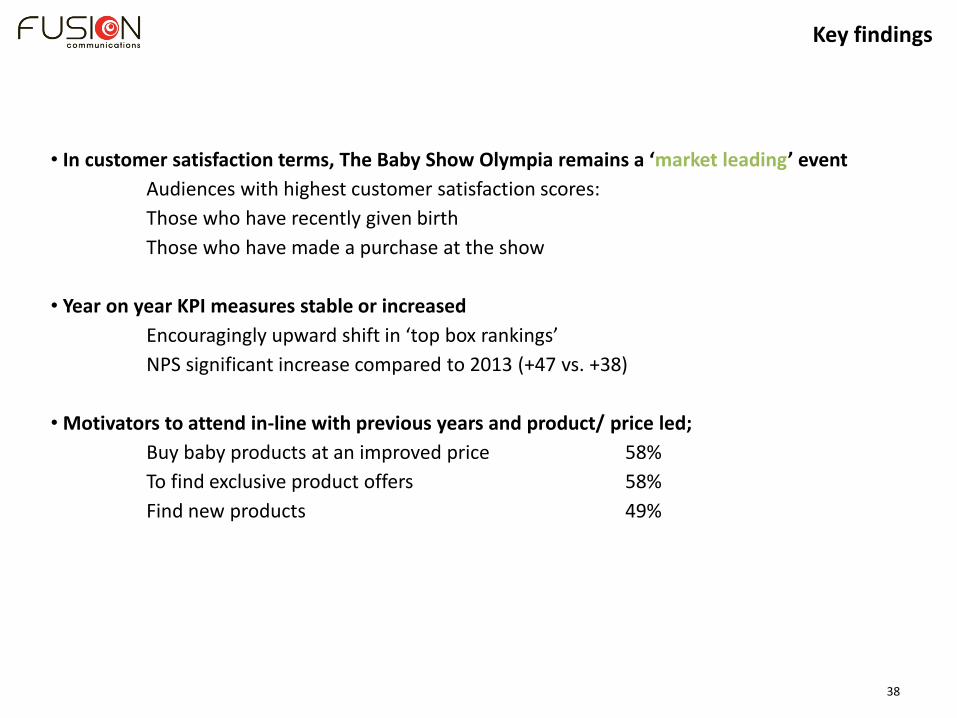
• In customer satisfaction terms, The Baby Show Olympia remains a ‘market leading’ event
Audiences with highest customer satisfaction scores:
Those who have recently given birth
Those who have made a purchase at the show
• Year on year KPI measures stable or increased
Encouragingly upward shift in ‘top box rankings’
NPS significant increase compared to 2013 (+47 vs. +38)
• Motivators to attend in-line with previous years and product/ price led;
Buy baby products at an improved price 58%
To find exclusive product offers 58%
Find new products 49%
Key findings
If you have any questions, please contact: Thiago Alves Senior Business Development Manager DL: +44 (0) 20 7384 8125 E: [email protected]


![INDEX [wa.audubon.org] · 7 Friends Landing 8 Grays Harbor National Wildlife Refuge 9 Humptulips Estuary 4 ... Olympia/Thurston County Visitor & Convention Bureau, 877-704-7500,](https://img.dokumen.tips/doc/110x75/5f5034817ceb8618906c8aa7/index-wa-7-friends-landing-8-grays-harbor-national-wildlife-refuge-9-humptulips.jpg)