Embed Size (px)
Citation preview

THE AUTECOLOGY OF CELTIS LAEVIGATA
IN FLOOD PLAIN FORESTS
OF DENTON COUNTY, TEXAS
APPROVED:
Major Professor
> „ J ClUi-cQ, HP. \< > Minor Professor
m i V n r f i i Director>£>f the Department: \of Biology
Dean of the Graduate School

THE AUTECOLOGY OF CSLTIS LAEVIGATA
IN FLOOD PLAIN FORESTS
OF DENTON COUNTY, TEXAS
THESIS
Presented to the Graduate Council of the
North Texas State University in Partial
Fulfillment of the Requirements
For the Degree of
MASTER OF ARTS
By
Lecil B. Hander, B. A.
Denton, Texas
January, 1970

TABLE OF CONTENTS
Page
LIST OF TABLES iii
LIST OF ILLUSTRATIONS iv
Chapter
I. INTRODUCTION 1
II. LITERATURE SURVEY 5
III. STUDY AREA 10
IV. METHODOLOGY 23
V. RESULTS 27
VI. CONCLUSIONS 61
APPENDIX 64
BIBLIOGRAPHY 95
iii

LIST OF TABLES
Table Page
I. Geographic Coordinates! of Flood Plain Forests Studied 12
II. Analysis of Variance for Balanced Repeated Subsampling 28
III. Lengths of Transects Containing Fifty Hackberry Trees; Analysis of Variance 29
IV. Hackberry Basal Area Totals - Fifty-Tree Transects;
Analysis of Variance . . . , 42,43
V, Hackberry Basal Area Density; Analysis of Variance 44
VI. Average Tree Height per Transect; Analysis of
Variance 45,46
VII. Stand Totals for Bioraass Parameters 47
VIII. Per Cent of Total Tree Density Represented by Hackberry; Analysis of Variance 48
IX. Per Cent Basal Area Attributable to Hackberry; Analysis of Variance 49
X. Twelve-Year Tree-Ring Segment Thickness; Analysis
of Variance 51
XI. Hackberry Reproductives 53
XII. General Observations Regarding Hackberry Phenology 55
XIII. Number of Hackberry Trees per Transect Exhibiting
Specified Phenological Characteristics . . . 56
XIV. Bouyoucos Soil Analysis 57
XV. Analysis of Variance - Fifteen-Minute Hydrometric Readings - B^ Soil Layer 58
XVI. Soil Moisture Factors - Bouyoucos Determination . 59
iv

LIST OF ILLUSTRATIONS
Figure Page
1. Haps of Denton County Showing Stand Locations , . ll
2. A View in Lower Denton Creek 13
3. Aerial View of Lower Denton Creek 15
4. Aerial View of Upper Denton Creek . . . . . . . . 16
5. Aerial View of Lower Elm Fork 17
6. Aerial View of Upper Elm Fork 18
7. A View in Upper Elm Fork 21
8. Map of Hackberry Tree Locations at Lower Denton Creek 31
9. Hap of Hackberry Tree Locations at Upper Denton
Creek 32
10. Hap of Hackberry Tree Locations at Lower Elm Fork 33
11. Map of Hackberry Tree Locations at Upper Elm Fork 34
12. Size Distribution of Hackberry Trees at Lower Denton Creek 36
13. Size Distribution of Hackberry Trees at Upper Denton Creek 36
14. Size Distribution of Hackberry Trees at Lower Elm Fork . . . . . . . . . . . . . . 37
15. Size Distribution of Hackberry Trees at Upper Elm
Fork 37
16. View of 31-Inch Hackberry Tree 40
17. Size Distribution of 600 Sample Hackberry Trees . 41

CHAPTER I
INTRODUCTION
Background
In Denton County, as elsewhere, flood plain forests
form a distinct vegetational community. The hackberry-elm
association along the streams contrasts strongly with the
surrounding grassy prairies and the upland post oak forests.
Few stands remain of the verdant streamside forests, however.
Much of this timberland has been cleared or inundated.
Agriculture, which has played an essential role in the
development of Denton County, has been a prime force in
reducing its wooded flood plain acreage. The deep alluvial
soils are fertile and nearby streams provide irrigation water
supplies and the source of a shallow water table. As the
land is highly productive naturally, so it is productive when
it is farmed. Federal and local governments are called upon
to provide recreation facilities, flood control, and water
supplies for private, municipal, and industrial use. They
respond by constructing reservoir dams which further reduce
the extent of bottomland timber stands.
Of the existing forests most, if not all, have beefc
disturbed by man to varying degrees. During post-settlement
days, timber was the main source of fuel in Denton County,
Limited logging operations provided timber for lumber
production. Presently cattle are permitted to forage through
many of these uncleared bottomlands. Thus within the frame-
work of the progress of civilization, few original flood plain
forests remain in their virgin state.
Statement of the Problem
This thesis describes the present nature of one facet of
some of the flood plain forest stands in Denton County, Texas.
The specific purpose was to demonstrate the presence or absence
of difference between the Celtis laevigata (commonly known as
the hackberry, southern hackberry or sugarberry) populations
in stands on Denton Creek and Elm Fork of the Trinity River.
An attempt was made to determine the cause of variation.
Characteristics were studied as evidence of the current
conditions and of the dynamic aspects of the community.
Approach of the Study
In plant ecology, most field studies have been performed
from a community point of view. Constituent organisms of a
community exist as parts of a closely interrelated functional
unit. The dynamics of this unit is the concern of synecology.
Animal studies taking a community point of view suffer because
the organisms are often highly mobile and intentionally
elusive of observers. Plant ecologists do not encounter this
ephemeral characteristic among their subjects. Plants usually
occur in greater densities than do most animals. Consequently,
ecological studies restricted to plants may be performed
easily from a community point of view.

An autecologic or population approach is admittedly one
which is narrow in scope. Many ecological parameters are
not defined. The broad view is lost. Compensation for these
weaknesses comes, however, by the elucidation of subtleties
which can be exposed by an in-depth study of a member popu-
lation of the community.
The study focused on CJL laevigata, the hackberry, as the
subject. Prior observation indicated that this tree species
occurred with high frequency in flood plain stands throughout
Denton County, Few studies until this time have revealed
this hackberry to be of major importance in the vegetational
association of flood plains. These were limited mainly to
studies of vegetation bordering the Mississippi River. The
literature contains little else regarding Cj. laevigata r
especially from an autecological point of view.
Parts of the Study
The study was divided into several parts. Most of the
work done was directed toward a comparison of the existing
structure of the population in two stands each on Denton
Creek and Elm Fork. Density and biomass were the prime
parameters of consideration. The population was sampled by
means of line transects. Individuals whose crowns inter-
cepted a transect were used as the basic study units. A more
detailed explanation is presented in Chapter IV regarding
field methods.

The dynamics of establishment and perpetuation of the
species was studied by several means. The reproductives
of the population were sampled and compared. Tree rings were
analyzed as evidence of relative growth rates. Some phono-
logical observations indicated additional variation.
In an effort to explain hypothesized variation between
streams, soils were analyzed for particle size as an indi-
cation of moisture-holding capacity. Consideration was
given to the anthropeic factor in explaining variations.
Superficial observation during the course of the study
suggested that variation of the laevigata population
could best be explained by the use which man has made of the
flood plain forests.

CHAPTER II
LITERATURE SURVEY
The literature contains several references to flood
plain community studies. Forests have been variously de-
scribed. The ash-elm association has received the most
attention in the literature. Such an association seems to be
prevalent in flood plains of the middle- and north-central
United States. Lee (1945) studied forests of this type
along the White River in Indiana. The northern hackberry,
C. occidentalis. was described as the third most important
species in the association. Blackmore and Ebinger (1967)
found a similar situation near Sycamore Creek in east-
central Illinois.
Other flood plain forests have also received attention.
Lindsey and others (1961) discussed associations along the
Wabash and Tippecanoe Rivers of Indiana. Low-level bottom-
lands (first bottoms) were dominated primarily by maple and
American elm. Northern hackberry ranked about sixth in
importance. The second bottoms, however, were dominated by
this hackberry species. The third bottoms of the Tippecanoe
River were devoid of hackberry and were dominated by basswood,
white oak, and red oak. Lindsey in 1962 presented a study of
an original forest of the Wabash flood plain in which he

found dominance shared by oak, gum, elm, and hickory. C.
occidentalis was of minor significance.
One paper was found regarding flood plain forest studies
in the eastern United States. Buell and Wistendahl (1955)
described a maple-beech-basswood association by the Raritan
River in New Jersey. Northern hackberry was mentioned as one
of the least important species.
Three studies and one descriptive article discussed the
flood plain occurrence of G. laevigata. Shelford (1954)
referred to the association of this species and sweetgum as the
stage of succession following the cottonwood-willow association
along the lower Mississippi River near Lake Reelfoot. Putnam
(1932) described this hackberry as occurring frequently in
clay flats in "first bottoms". He stated that it was limited
to the hackberry-cedar elm association, in which it was fre-
quently the predominant species. Penfound (1948), in a short
article, described C. laevigata as being of minor importance
in the elm-ash association in a flood plain stand near Norman,
Oklahoma.
The only reference to the hackberry in Texas flood plains
is by Tharp (1926), He discussed the burr oak-pecan-cedar elm
association on San Antonio River bottomlands in the southern
part of the state. The hackberry was mentioned as being fourth
in importance.
Celtid phenology is included in a limited number of
articles. Lamb (1915) indicated April 15 as the mean date
for bud break of £. occidentalis in the eastern United States.
Hulbert (1963) published Gates' phenological records spanning
a thirty-year period. Flowering of CJU occid^ntalis began
around the mean date of April 15, with a range from March 31
to Hay 10. Bonck and Penfound (1944) described twig elongation
of CJL mississjppiensis as beginning on April 7. Total
elongation averaged 38.0 cm. The study was made in 1943 along
the Mississippi River near its mouth. Eggler (1955) studied
radial growth of several tree species near New Orleans, He
reported a 3.9 mm. average increase for ten laevigata
trees during 1952,
References regarding Denton County include articles and
personal interviews with individuals who have lived in the
locality since the early 1900*s. The United States Secretary
of Agriculture's report (1942) of the Trinity River watershed
briefly described the "dark clay-textured soils" of the
county. No details of the vegetation structure in the flood
plains were given. Carter and Beck (1922) discussed Frio and
Lewisville clays as occurring frequently along Denton Creek
and Elm Fork.
Cowling (1922), discussing the use of flood plain trees,
mentioned that hackberry and other timber were used for "log
huts and clap-board roofs." Interviews with Laura Heath and
Hubert Wright of Roanoke and M. L. Swafford of Ponder indi-
cated that timber-cutting for both fuel and lumber purposes
was common around Denton Creek prior to the 1930's. Vegetation
zone maps from Carter and Beck (1922) and from the Trinity

8
River watershed report showed the Grand Prairie enclosing
Denton Creek, Elm Fork was bordered by the Grand Prairie
and the eastern cross timbers. In the cross timbers fuel was
more readily obtained than around Denton Creek, where the
flood plains contained the primary fuel supply.
Some references pertained to techniques and methods used
in the study. Basic information regarding basal area measure-
ment and the line intercept sampling method were obtained from
Phillips (1959). Various areal and line transect sampling
methods were studied and compared by Buell and Cantlon (1950),
Lindsey et al, (1958), and Berry (1962).
CHAPTER BIBLIOGRAPHY !
Berry, Brian J. L. 1962. Sampling, coding, and storing flood plain data. U. S, Dept. Agric. Agric. Handbook 239: 1-27,
Blackmore, B, K, 1967, Vegetation survey of Burgner Acres, East-Central Illinois. 111. State Acad. Sci. Trans, 60: 72-79,
Bonck, J,, and W, T, Penfound. 1944, Seasonal growth of twigs of trees in the batture lands of the New Orleans area. Ecology 25: 473-475,
Buell, M. F., and J. E. Cantlon. 1950. A study of two com-munities of the New Jersey pine barrens and a comparison of methods. Ecology 31: 567-568.
Carter, W. T., and M. W. Beck. 1922. Soil Survey of Denton County, Texas. U. S. Dept. of Agric. Govt; Printing Office, Washington. 58 p.
Cowling, H. J. 1936. Geography of Denton County, Banks Upshaw and Co,, Dallas, 132 p.
Eggler, W. A, 1955, Radial growth in nine species.of trees in southern-'Louisiana. Ecology 36: 130-136,

Heath, Laura. 1969. Personal interview. 5 Aug. Roanoke, Texas.
Hulbert, L. C. 1963. Gates* phenological records of 132 plants at Manhatten, Kansas. 1926-1955. Kansas Acad, Sci. Trans. 66i 82-106.
Lamb, G. N. 1915. A calendar of the leafing, flowering and seeding of the common trees for the eastern United States. Monthly Weather Rev. Supp. No. 2: 5-19.
Lee, Mordie B. 1945. An ecological study of the flood-plain forest along the White River system in Indiana. Butler Univ. Bot. Stud. 7: 155-175.
Lindsey, Alton A, 1962. Analysis of an original forest of the lower Wabash floodplain and upland. Indiana Acad. Sci. Proc. 72: 282-287.
Lindsey, A, A., J. D. Barton, and S. R. Miles. 1958. Field efficiencies of forest sampling methods. Ecology 39: 428-444.
Lindsey, A. A., R. O. Petty, D. K. Sterling, and W. Van Asdall. 1961. Vegetation and environment along the Wabash and Tippecanoe Rivers. Ecol. Monogr. 31: 105-156.
Penfound, W. T. 1948. An analysis of an elm-ash floodplain community near Norman, Oklahoma. Okla. Acad. Sci. Proc. 28:56-60 . 51-kO'
Phillips, E. A. 1959. Methods of vegetation study. Holt, Rinehart and Winston, Inc., New York. 107 p.
Putnam, J. A., and H. Bull. 1932. The trees of the bottom-lands of the Mississippi River delta region. Southern Forest Expt. Sta., Occ. Paper 27: 1-207.
The Secretary of Agriculture. 1942. Survey report of the Trinity River watershed. Seventy-seventh Congress, Second Session. House Doc. No. 708: 66 p.
Shelford, V. E. 1954* Some lower Mississippi valley flood plain biotic communities; their age and elevation. Ecology 35: 126-142,
Swafford, M, L, 1969, Personal interview, 5 Aug, Ponder, Texas,
Tharp, B, C, 1926, Structure of Texas vegetation east of the 98th meridian. Univ. Tex. Bull, No, 2606, 97 p,
Wright, Hubert, 1969, Personal interview, 5 Aug, Roanoke, Texas,
CHAPTER III
STUDY AREA
Selection of stands for sampling involved consideration
of three main criteria. The first of these was size of the
stand. Each stand had to be large enough to accommodate the
line transects used for sampling and to avoid ecotone effects.
The second, closely related to the first, was the homogeneity
of vegetation within a given stand. The greater the uni-
formity, the lower would be the amount of error due to
sampling. Finally, more than one stand per stream was needed
in order to determine the amount of variation existing within
stands along the same stream. An attempt was made to insure
adequate and comparable spacing of the stands on each stream.
To locate stands for sampling, aerial photographs of
Denton County were examined in the Agricultural Stabilization
and Control Office in Denton, From these maps five stands —
three on Denton Creek and two on Elm Fork — were chosen for
reconnaissance, A stand on Denton Creek south of Stony proved
to be too heterogeneous for inclusion into the study. This
stand was irregularly divided by fenceline because it was not
under single ownership. Several head of cattle were being run
in the south part. For some reason, the density of hackberry
trees north of the fenceline was over five times greater than
the density on the other side of the fence.
10

11
t l I • a
C •C U 4-J 0) k Pu
•D C X? (SO c
C* qj D J->
4J CO *M * 0) X> X
C k (d O -P
u to w , £ g) ^ r-l S m
0) j c k +J o ©
§ ^Jm
O CO
U W

12
Four stands, two each on Denton Creek and Elm Fork, were
subsequently studied. The two stands on one stream were coded
as upper and lower. Coordinates of geographic location of
each stand are given in Table 1.
TABLE I
GEOGRAPHIC COORDINATES OF FLOOD PLAIN FORESTS STUDIED
Stand Latitude Longitude
Lower Denton Creek 33° 02.0' N 97° 14.5' W
Upper Denton Creek 33° 08.5« N 97° 20.0' W
Lower Elm Fork 33° 17.0' N 97° 02.5' W
Upper Elm Fork 33° 23.0' N 97° 05.5' W
Maps of north-central and south-west Denton County (Figure l)
show the location of the stands in relation to nearby towns,
streams, and major roads.
The lower Denton Creek stand, two miles north of Roanoke,
is presently included in the Grapevine reservoir recreational
area. The property has been owned jointly by A. L. Slaughter
heirs and the government since 1940 (Denton County Courthouse
Records, 1969). Prior ownership was by Degan and Raley, from
1929. Earlier records were unav&ilable. The stand covers
approximately 206 acres. The stand was sampled in the north-
west part because of its accessibility and apparent uniformity,

13
M C/ 5 V •
14
Transects were laid at 180°, 135°, and 105°, from a single base
point, a large honey locust tree approximately 430 meters south
of the bridge which crosses the stream near the north end of
the stand, and 140 meters east of the gravel road. Figure 2
shows a typical view in this stand. An aerial photograph of
the stand is shown in Figure 3.
The forest coded as upper Denton Greek is privately owned
by the heirs of T. A. Swafford, who purchased the land in 1903.
It is located about 4 miles southwest of Ponder. The stand is
much smaller than the lower Denton Creek stand, covering about
22 acres. Isolated from roads, the stand was accessible
through the dairy farm operated by Sam Teal. Two transects
were laid at 180° and 205° from a common base. The base tree
was a large Shumard oak 50 meters west of the north-east corner
of the stand and 30 meters south from the north fence line.
The second transect changed from 205° to a 135° bearing when
it approached Denton Creek. The third transect was laid at 0°
from a large American elm 50 meters north of the southernmost
projection of the stand. Figure 4 shows an aerial view of the
upper Denton Creek location.
The lower Elm Fork stand has been owned by the City of
Dallas since 1925, and is under the jurisdiction of the Army
Corps of Engineers. Lying about 7 miles north-east of down-
town Denton, this flood plain forest stand covers about 240
acres. It is continuous by means of a narrow wooded strip
with a similar-sized stand immediately to the south-west.

15
• *
I? ' - ***.
% •V/'I K /<*»/* •, (' .. .w«'<%.
y v S & ^ B It
J %*4*» %w
Fig. 3 -- Aerial view of the lower Denton Creek stand. 1 in. = 660 ft.

16
Fig. 4 — Aerial view of upper Denton Creek stand. 1 in. = 660 ft.

17
& < A - . > AVt JA > • - 4 > * J **m4
.
* Vvd<
T F 7 7t'<\Fl V ' % >
sSKs&S M L ' 'J < t r
feff«i9Cs
iiliiiiLi'lii''r'll^ i1[ HrtriMf'
HhP #' I : • •
Fig. 5 — Aerial view of the lower Elm Fork stand. 1 in, = 660 ft.

18
J
Fig. 6 — Aerial view of the upper Elm Fork stand. 1 in. = 660 ft.

19
Access to the stand was gained by crossing a large field to
the west of the stand. A shallow temporary creek cuts south
along the western edge of the stand. Three transects were
angled from one base point, a large cedar elm tree 280 meters
south of the north fence and 30 meters east of the west fence.
Transects were laid at 160°, 110°, and 70°. An aerial view of
the lower Elm Fork stand is shown in figure 5.
The upper Elm Fork stand is centrally located near the
north county line. Courthouse records listed J. P.. Tomkins
as owner since 1938, preceeded by A. 0. Mason. The relatively
small 24-acre stand lies about 5 miles east of Sanger and just
north of farm-to-market road 455. A field and a very deep
creek gully had to be crossed to get to the stand from the
south. Three north-south transects were laid out. from dif-
ferent base points. The east transect started from an
exceptionally large burr oak tree in the north-east part of
the stand. The central and west transects began from large
cedar elms in the south part of the stand. Figure 6 is an
aerial view of this stand.
All of the stands studied lie in what would be called the
second bottom or the upper part of the first bottom. Such
lands typically are subject to infrequent overflow and are
"covered by heavy, luxuriant hardwood forests" (Tharp, 1926).
During the spring of 1969, Denton Creek overflowed the lower
stand and a wide low area of the upper stand only once. The
upper Elm Fork stand was not flooded during the study.

20
Because of the proximity of the Shallow creek, however, th©
sampling area of the lower stand on Elm Fork was inundated
several times. In all cases the period of submergence of the
land was probably for no more than a few hours, and then only
to a shallow depth. The four stands were all located on flat,
poorly-drained land. Following rains and especially after
floods, numerous temporary pools of stagnant water remained.
The pools, being of different depths, lasted from several days
to a few months.
Soils in the four stands seemed to show little difference
in color, texture, or composition. Both the A^ and the Bi layers
were composed of dark gray-brown fine soil which was predomin-
antly clay. Data and analysis of the soils are presented in
Chapter V.
The herbaceous and frutescent layers of vegetation were
very similar between most of the stands. Patches of greenbriar
bramble, deep grass, and coralberry thicket were encountered.
The Denton Creek stands and lower Elm Fork had fairly dense
crown covers produced by 35- to 50-feet-tall trees. This 1 .
resulted in less of the thick weed and grass ground cover.
The upper Elm Fork stand, though was characterized by large
and tall but sparse trees (figure 6). More light penetrated to
the ground there, and consequently the ground cover was much
denser. Less greenbriar occurred in this stand, but the
coralberry thickets were much more extensive and well-developed.
An important characteristic of all of the stands as far as

21
k

22
this study was concerned was the lack of extensive recent
destruction of the vegetation. Only infrequent cattle-
grazing was noted. This occurred only in the Denton Creek
stands. These may have been incidents of. a few cattle
crossing through a break in a fence. Overall, the four
forest stands studied appeared relatively undisturbed,
CHAPTER BIBLIOGRAPHY
Denton County Courthouse Records, 1969, Denton County Land Ownerships, Denton, Texas,
Tharp, B, C, 1926, Structure of Texas vegetation east of the 98th meridian, Univ. Tex, Bull, No, 2606, 97 p.
r -

CHAFTER IV
METHODOLOGY
Intercept Transect for Sampling Mature Trees
To achieve adequate and balanced sampling within stands,
three transects were spaced to cover a wide area. Effort was
exerted to avoid ecotones and ecologically unusual pockets
of vegetation within the stands. Transects were laid out with
the use of a pocket compass which was accurate within about
five degrees. Trees lying on the transects were marked with
a double band of masking tape near eye level. Hackberry trees
that had crowns which intercepted the transect received a
single band. Trees were coded by transect and assigned
numbers from one through fifty. Diameter breast high of each
hackberry was measured with a standard diameter tape. Tree
heights were estimated as accurately as possible without the
use of a direct measuring device.
The length of each transect was arbitrarily set as the
distance required to intercept the crowns of 50 hackberry
trees having trunk diameters of 1% inch or more. Transect
length was estimated by pacing. An attempt was made to make
paces consistently as close to 1 meter length as possible
without actual tape measure,
23

24
For measuring the lateral growth of the tree trunk, cross-
section cuts were made. Sections were returned to the labora-
tory, where they were sanded smooth on one surface. Rings were
counted and measurements were made with the aid of a dissecting
scope
Belt Transect for Sampling Reproductives
Hackberry plants smaller than 1% inches diameter breast
high were considered reproductives and subjected to a belt
transect sampling procedure. The transect size was 1 meter
wide by 100 meters long. Belt transects were laid along the
right side of each line transect and were placed so that
they would not be close to one another. They were run through
areas having roughly equal quantities of high and low mature
hackberry density. Figures 8 through 11 in Chapter V include
the locations of the reproductive transects. The letter "a"
indicates where the transect began and the letter "b", where
it terminated.
During the investigation, it became apparent that grouping
all reproductives together was less than adequate. The
decision was made to divide the young plants into three sub-
classes, These were seedlings, plants from 2 years old to
1 meter high, and those from 1 meter high to 1% inches diameter
breast high. Seedlings were very numerous but also showed a
high mortality rate. After the first year, the main compe-
tition comes mainly from dense herbaceous and low frutescent
layer growth. Above one meter height, competition is limited

mainly to the tree crowns forming the forest canopy. Data and
discussion in the next chapter demonstrate the value of such
a dividing of the reproductive class.
Phenology
The phenology of the hackberry was studied to a limited
extent. Extensive rains and other conflicts prevented regular
observations of all of the flood plain stands used in the
study. The factors considered were bud break, flowering,
leafing,and fruiting. Observations were made from March
through May of 1969. The set of phenological data is pre-
sented in Chapter V.
Soils
Soil samples were collected with a cylindrical auger.
In preparing to take the sample, surface litter was first
cleared away. The top few inches were sampled as the
layer. About 6 to 10 inches down, the soil texture became
finer and the soil was more compact. Samples at this depth
were considered to be from the layer. In the laboratory,
the samples were dried for at least 24 hours at 110° C.
Fifty-gram samples were mixed with 5 milliliters of 1 normal
sodium hydroxide and 5 milliliters of sodium oxalate solution.
This was allowed to soak for 15 minutes, then the mixture was
blended in a malt blender for 10 minutes. The suspension was
then mixed with distilled water to form a volume of 1 liter.
Density of the solution was measured at 40 seconds, 50
minutes,and 2 hours,with a Bouyoucos hydrometer calibrated in

26
grams of suspended soil particles per liter of suspension.
Bouyoucos (1930) indicated that sands settle out before
40 seconds and that total colloids (clay and fine silt up
to about .008 millimeter particle diameter) remain suspended
after 15 minutes. Only fine clays (.002 millimeter) remain
at 2 hours. Bouyoucos stated that the wilting coefficient
may be obtained by multiplying per cent total colloids by
.2835. Moisture equivalent is derived by multiplying the same
figure by .6515. Data regarding flood plain soil samples are
considered in the next chapter, ,
CHAPTER BIBLIOGRAPHY
Bouyoucos, G. J. 1930. The indirect determination of various soil characteristics by the hydrometer method. Soil Sci. 30:267-272.

CHAPTER V
RESULTS
Statistical Treatment of the Data
Variation was encountered between individual trees,
transects within single stands, stands on the same stream,
and between streams. To accurately attribute variation to
the proper level, the F test was used to indicate whether or
not real differences existed in various parameters of the
populations studied.
Table II summarizes the analysis of variance for balanced
repeated subsampling. This form was adaptable to the design
of the investigation. Denton Creek and Elm Fork, the streams
compared, represented the A class. Small letters in the table
symbolize the number of components in a given class; in this
study, "a" equaled two. The B subclasses within A were the
two stands on each stream. The C sub-subclasses within B
were the three transects per stand. The fifty trees measured
in each transect constituted the basic observations; "y"
symbolizes the value of each observation^ and "r" represents
the number of observations. Explanations of other symbols used
in Table II include the following: DF-— degrees of freedom;
S S — sum of squares; MS — mean square; T — total for a given
class; N—» total number of observations in the experiment;
C m — correction of the mean.
27

28
fxl <
f-4
* o SS M $
CO D t/) Q W < w 111 w c£ Q W 0 1 3 CO Cd O tX4 W 0 § M 1 Ct4 0 w M & ><
1 <
X» cd
a c V
• > ^ JD ^ &
fX4 > cd cd s» • •
a b c A
A
A
£> <tf <0
58 a b •
c •
r A
A
A
A
*o tfl *Q
W II cd i s a
S a II C/3 i a •
o E 01 C
it)
w » O w t *4 E
U 1 <J) 6 o u k *0 a J2 v u c II
^ ^ n4 i CM CM CM cd a
a b c m
CM N H H H CD fcs CM
H
/ %
r4 ^4 *~4 t-l rl H t i l l 1
fc* a b c r & w v-/ cd o
cd *o cd
CO a a <5 « o c o £ CO *rl o •H (U a) d a w •H 4J <D CO «rl «rl Cd 4~> cd & CO «C «Xh ^ U •r-l 4J Cd ^ u r-4 0) k 0) rM »H <D Cd k cdCQ O J 3 01 P k > ,0 0 o < 03 U O H O
E # < 3 E # • • £ N i
A
B
C
R
o
VD ON
* CO CO
m e o u \sa

29
Population Parameters of Density
Densities of the hackberry populations were measured by
the lengths of transects, which contained fifty trees each.
The mean density was assumed to be inversely proportional to
the transect length. Table III lists the lengths of the tran-
sects in the study and the analysis of variance of these data.
TABLE III
LENGTHS OF TRANSECTS CONTAINING FIFTY HACKBERRY TREES
Stand Transect Denton Creek Elm Fork
Lower A 312 m. 263 m.
B 261 234
C 249 195
Upper A 171 349
B 168 340
C 131 287
ANALYSIS OF VARIANCE
Source of Variation
DF SS MS F
Streams 1 11,782 11,782 0.69 n.s.
Stands 2 34,093 17,047 17.5 **
Transects 8 979
!;•'

30
Significance levels in this and other tables aire indicated
in the following ways. If the probability of a real difference
was not at least 95 per cent (Bliss, 1967), the F value was
declared not significant and indicated by "n.s." A 95 per
cent probability of a real difference was accepted as signi-
ficant and indicated by an asterisk (*); a probability ex-
ceeding 99 per cent (highly significant) was indicated by a
double asterisk (**).
Analysis of variance for the data in Table III showed very
little difference attributable to variations between streams.
Transect lengths within stands were more or less uniform.
Highly significant difference existed between stands, however.
Inspection of the data indicates short transect lengths in
the upper Denton Creek stand and long transects in the upper
Elm Fork.
Raw data regarding individual tree location on the tran-
sects were translated into maps. Figures,8 through 11 show
transect locations in stands and where trees occurred along
these transects. Transect data from which the maps were
produced are included in the Appendix, Section A, Locations
were defined to the nearest meter. Distance from the base
and lateral distance from the transect line were recorded for
each tree.
Most transects were characterized by localized variations
of hackberry density. Typical distribution patterns included
two or three main clusters of hackberry trees per transect.

I
• *. • •
k •
• . C V
31
H A
w
* •••J # . . . a i'^Vi
v *
• t k . .
%
•• — C
%
Om. Lmm
SO i 100 mmmJ
Fig. 8 -- Hap showing locations of hackberry trees sampled in the lower Denton Creek stand* Codes for symbols may be found on page 35.

32
Fig. 9 — Map showing locations of hackberry trees sampled in the upper Denton Creek stand. Codes for symbols may be found on page 35.

33
N A
0 * *•
• 1.1 • • * •
• • A • % •# •
«tk • I I ••• •
f •
* » • ? :
• • b « v
n
## • # #
2>P
O m. Lm
Scale SO . I
too — J
• • ' •
Fig. 10 — Map showing locations of hackberry trees sampled in the lower Elm Fork stand. Codes for symbols may be found on page 35.

34
\
Fig. 11 n.m Map showing locations of hackberry trees sampled in the upper Elm Fork stand. Codes for symbols may be found on page 35
35
The clusters were separated by rather distinct sparse zones.
Extremes in clustering are illustrated by maps of upper Denton
Creek transects. Transect B shows a strong clustering pattern
while transect C demonstrates a relatively even pattern of
hackberry tree distribution.
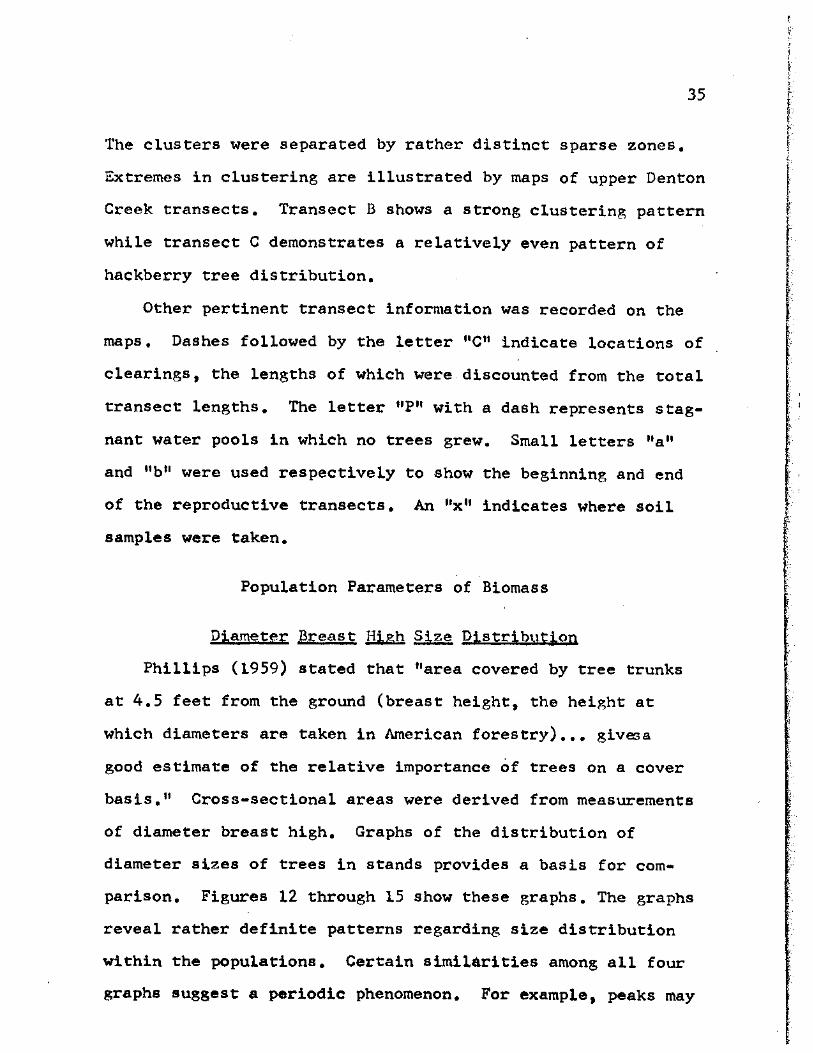
Other pertinent transect information was recorded on the
maps. Dashes followed by the letter "C" indicate locations of
clearings, the lengths of which were discounted from the total
transect lengths. The letter "P" with a dash represents stag-
nant water pools in which no trees grew. Small letters "a"
and MbM were used respectively to show the beginning and end
of the reproductive transects. An "x" indicates where soil
samples were taken.
Population Parameters of Biomass
Diameter Breast High Size Distribution
Phillips (1959) stated that "area covered by tree trunks
at 4.5 feet from the ground (breast height, the height at
which diameters are taken in American forestry)... givesa
good estimate of the relative importance of trees on a cover
basis.1' Cross-sectional areas were derived from measurements
of diameter breast high. Graphs of the distribution of
diameter sizes of trees in stands provides a basis for com-
parison, Figures 12 through 15 show these graphs. The graphs
reveal rather definite patterns regarding size distribution
within the populations. Certain similarities among all four
graphs suggest a periodic phenomenon. For example, peaks may

36
Number of
Trees
Dia- . . . . 5 . . . . 10 . . . . 15 . . . . 20 . . . . 25 - over meter (in.)
Fig. 12 — Size distribution of hackberry trees in lower Denton Creek stand.
Number of
Trees
20
15 _
10 _
0 Dia- . . . . 5 . . . . 1 0 . . . . 1 5
meter (in.) 20 * • • • 25 - over
Fig. 13 — Size distribution of hackberry trees in upper Denton Creek stand.
37
Number of
Trees
Dia- . . . . 5 . . . . 10 . . . . 15 . . . . 20 . . . . 25 - over meter (in.)
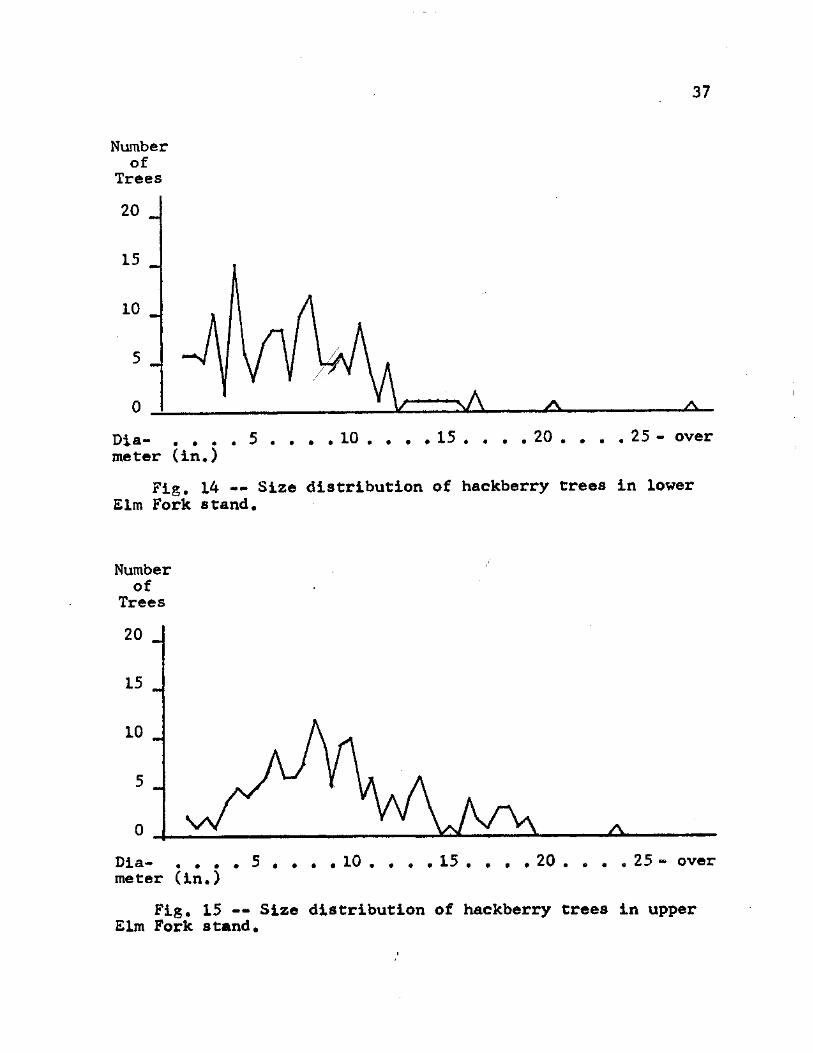
Fig. 14 — Size distribution of hackberry trees in lower Elm Fork stand.
Number of
Trees
Dia- . . . • 5 . . . . 10 meter (in.)
• • 9 # 15 . . . .20 • 4» • 25 - over
Fig. 15 — Size distribution of hackberry trees in upper Elm Fork stand.

38 (s, L
be noted in all of the graphs for the 4- and 6-inch diameter
sizes. If this is accurate, conditions favorable to repro-
ductive establishment occurred somewhat periodically. Such
conditions probably involved sufficient moisture, but with-
out serious flooding.
Observation of general trends in the graphs indicates
what may be important differences among the stands. The
lower Denton Creek graph (Figure 12) illustrates a prepon-
derance of small trees, mostly 6 inches and less in diameter.
The upper Denton Creek hackberry population is dominated by
the 2- to 8-inch size range. The range from 3 to 12 inches
accounts for most of the lower Elm Fork hackberry trees. The
4- to 14-inch range in the upper Elm Fork stand contains the
bulk of the hackberry trees there.
The size distributions noted suggest that succession is
occurring in the Denton County flood plain forests. If the
trends indicated by the graphs are correct for the entire
population in each stand, the conclusion may be drawn that
the lower Denton Creek stand is the ecologically youngest
forest of the four. At the other end of the succession
spectrum is the upper Elm Fork stand, ecologically the closest
to the climax state.
If the vegetation was in a stable phase of succession,
however, Figure 12 indicates that mature trees of the lower
Denton Creek stand were susceptible to some limiting factor
or complex of factors. Such a factor is timber-cutting by
man. The only indication that this may have occurred was

39
the presence of a grown-over, one-lane dirt road which
passed through part of the sampling area. No stumps were
observed, thus indicating that timber had not been cut
recently.
Figure 13 does not show a sharp decrease in tree numbers
until the eight-inch size is reached. This may correspond
with the years around 1930 when butane and gas fuels were
first used in place of wood in Denton County.(Swafford, 1969).
One other important factor may be noted in figure 15.
Over three times as many trees above 15 inches diameter were
found in the upper Elm Fork stand as in all of the other
stands combined. These trees were taller by 20 feet or more
than trees in the other stands. Large diameter size and
height were also noted^for other species such as cedar elm
and burr oak. The only theory postulated to explain this
phenomenon is that this represents a higher level of suc-
cession than that found in the other stands.
An unusually large hackberry tree was intercepted by
transect C in the lower Elm Fork stand. This tree had a
diameter of 31 inches. Laughlin (1947) listed 29.5 inches
as the maximum diameter for C,,. laevigata. A photograph of
the tree is shown in figure 16. Dividing the diameter by
the mean growth rate which was determined for the lower
EUm Fork stand resulted in an age of 262 years — dating
the tree back to 1706,

40
• « : % *
K.xJfEX
mwm ty- H- :.- . V i vvift
H W
'2? J B B K M
Fig. 16 -- View of the largest of all trees sampled - a 31-inch diameter breast high hackberry found in transect C in the lower Elm Fork stand.

41
The next two largest trees encountered in the study were
23.5 inches (upper Elm Fork, transect A) and 20^5 inches
(lower Elm Fork, transect C) in diameter. The largest trees
in the Denton Creek stands were two 15-inch trees, one in
each stand.
To correctly interpret graphs in Figures 12 through 15,
a factor introduced by the sampling method should be con-
sidered. Small trees had small crowns. Therefore they had
to grow somewhat close to the transect line in order to be
included in the sample. Proportionally fewer small trees
Number of
Trees
Dia- . . . . 5 meter (in.)
10 15 20 25 - over
Fig. 17 — Diameter breast high for 600 hackberry trees sampled by intercept transects.

42
than large ones were intercepted. Figure 17 shows the dia-
meter breast high distribution for all 600 hackberry trees
measured.
-- Tfcees in the range from 1% to 3 inches were incurred less
often than had been expected. This is due primarily to the
sampling method. A plot or areal method probably would not
produce this result, especially if it is a real sampling
error. The advantage of the line transect method which
resulted in its use in this study was the short time required
and the facility of covering the sampling area.
Basal Area
As an indicator of biomass, basal area was calculated for
each of the 600 trees sampled. Transect totals for the data
are shown in Table IV along with the analysis of variance.
TABLE IV
HACKBERRY BASAL AREA TOTALS — 50-TREE TRANSECTS
Stand Transect Denton Creek Elm Fork
Lower A 858 in.2 2286 in.2
B 1297 2483
C 1754 3193
Upper A 945 4802
B 1495 3974
C 1918 3515

43
TABLE IV — Continued
•ANALYSIS OF VARIANCE
Source of Variation DF SS MS F
Streams 1 239,454 239*454 7.59 n.s.
Stands 2 63,121 31,561 5.78 *
Transects 8 43,693 5,462 3.29 **
Trees 588 1,952,467 1,660
Total basal area of the sampling on Denton Creek stands
was 8,267 square inches, while that for Elm Fork was 20,252
square inches. Although these values are wide apart, no
difference was demonstrated between streams. This was due
mainly to the low number of degrees of freedom. The F value
indicating difference at the 5 per cent level is 18.5 when
numerator and denominator degrees of freedom are 1 and 2,
respectively. The data were such, however,as to show signi-
ficant difference between stands and highly significant
difference between transects. Further tests would be required
to pinpoint which stands and which transects varied signi-
ficantly from the population bulk.
Basal Area Density
Since hackberry basal area totals were demonstrated not
to be different between streams, the question was asked if
interaction of basal area and density would produce other
results. Such a biomass density would be a better measure

44
of the extent to which conditions allow a species to develop
than individual density would be. Accepted units of square
inches for basal area and meters for transect length resulted
in the unit of square inches per meter for the basal area
density. Table V contains the derived data and the analysis
of variance,
TABLE V
HACKBERRY BASAL AREA DENSITY
Stand Transect Denton Creek Elm Fork
Lower A 2.75 in2/m 8.69 in^/m
B 4.97 10.61
C 7.04 16.37
Upper A 5.53 13.76
B 8.90 11.69
C 14.64 12.25
ANALYSIS OF VARIANCE
Source of Variation
DF SS MS F
Streams 1 72.7 72.7 4.18 n.s.
Stands 2 34.8 17.4 1.63 n.s.
Transects 8 85.9 10.7

45
Although considerable variation appeared to exist, the
diversity of the data allowed no difference at either the
stream or stand level. Therefore, in this case, no bioraass
density variations were clearly evident.
Tree Height
As an added means of measuring biomass, consideration
was given to the parameter of height. Variations were
observed between stands. Average tree height ranged from
27.1 feet in the lower Denton Creek stand to 38.4 feet in
the upper Elm Fork stand. Average tree heights per transect
and the analysis of variance are given in Table VI.
TABLE VI
AVERAGE TREE HEIGHT PER TRANSECT
Stand Transect Denton Creek Elm Fork
Lower A 23.2 ft 29.2 ft
B 26.8 32.5
C 31.2 30.8
Upper A 30.1 38.1
B 32.9 38.2
C 34.2 38.8

46
TABLE VI — Continued
ANALYSIS OF VARIANCE
Source of Variation DF SS MS F
Streams 1 72.6 72.6 1.14 n.s.
Stands 2 126.3 63.2 10.9 **
Transects 8 46.6 5.82
No difference was demonstrated between stream populations,
Variation between stands was sufficient to result in highly
significant difference at this particular level. This may be
understood by noting that very little variation occurred with-
in stands. Thus a very low mean square value resulted at the
transect level. When divided into the mean square between
stands, the F value was highly significant.
An Observation
Before leaving the topic of biomass parameters, a pattern
occurring between stands and repeating within the different
parameters may be noted. Table VII contains the stand totals
for data studied in this section of the thesis. Values in-
crease in the progression from the lower Denton Creek stand
to upper Denton Creek, to lower Elm Fork, and finally to the
upper Elm Fork stand. This is the same progression which was
postulated regarding succession. Only one exception to the
pattern occurred — between the upper Denton Creek and the
lower Elm Fork totals for average tree height. Analysis

47
TABLE VII
STAND TOTALS FOR BIOMASS PARAMETERS -NUMERICAL VALUES ONLY
Parameter LDC Stand
UDC LEF UEF
Basal Area 3,909 4,358 7,962 12,291
Basal Area Density 14.76 29.07 35.67 37.70
Tree Height 81.2 97.2 92.5 115.1
of correlation would be needed to demonstrate the extent of
reliability of the consistency which appears. Such a pro-
cedure was not performed during the course of this study.
Community Parameters
Per Cent of Total Tree Density
Other trees which intercepted the transects were counted
so that percentage of total tree density attributable to
hackberry might be calculated. The values obtained are con-
tained in Table VIII with the analysis of variance. (
The F values indicate no difference between streams for
the factor under consideration. It may be noted, though,
that all values but one among all of the Elm Fork transects
were consistent. Nevertheless, sufficient variation existed
between stands, expecially on Denton Creek, to result in a
significant F for the comparison between stands. Lower Denton
Creek percentages were low because of many cedar elms there.

48
TABLE VIII
PER CENT OF TOTAL TREE DENSITY REPRESENTED BY HACKBERRY
Stand Transect Denton Creek Elm Fork
Lower A
B
C
30.3 %
22.3
29.1
58.1 %
61.7
59.5
Upper A
B
C
34.7
43.9
53.9
57.3
50.5
57.3
A M iLYSIS OF VARIANCE
Source of Variation DF SS MS F
Streams
Stands
Transects
1
2
8
I4I2.7
463.7
259.1
1412.7
231.9
32.4
6.09 n.s.
7.16 *
Per Cent of Total Basal Area
Besides counting th$ trees of other species intercepting
the transects, the diameter breast high was measured to the
nearest inch for each tree. This set of data is recorded in
Section B of the Appendix. From the diameters, basal area was
figured and totaled for each transect. The percentage of

49
total basal area represented by hackberry was calculated.
Table IX contains these percentages and the analysis of
variance of the data.
TABLE IX
PER CENT BASAL AREA ATTRIBUTABLE TO HACKBERRY
Stand Transect Denton Creek Elm Fork
Lower A 13 % 42 %
B 17 41
C 31 42
Upper A 19 39
B 36 41
C 23 31
ANALYSIS OF VARIANCE
Source of Variation DF SS MS F
Streams 1 784 784 19.1 *
Stands 2 31 41 0.84 n.s.
Transects 8 393 49
As the analysis of variance indicates, difference at the
5 per cent level of probability existed between streams.
This means that samplings from a random population would
result in a greater F value in fewer than 5 per cent of all
such cases. This was the only set of data in the investigation

50
which attributed significant difference to the conditions
existing in the flood plain stands between Denton Creek and
Elm Fork.
Observation of the data in Table IX indicates that the
hackberry population in the Elm Fork stands accounts for
about 40 per cent of the total basal area in the stands.
This parallels the conclusion about the stage of succession
which the stands are going through. As a species is being
replaced, individuals of that species grow large, but their
reproduction diminishes. Under this condition the species
retains a considerable portion of the basal area total.
Tree Ring Study
To obtain further information regarding the success of
the hackberry population in different stands, trunk cross-
sections of twenty-four trees were cut. The amounts of
radial growth for the twelve-year period from 1957 through
1968 were measured and compared between trees, stands and
streams. The segment thicknesses for each tree studied are
listed in Table X.
The analysis of variance shows no difference at either
the stream or stand level. Wide variation between trees
probably was the cause of the statistical results. Average
tree-ring width ranged from 0.59 to 4.94 millimeters per
annulus. Mean width for Denton Creek trees sampled is 2.36
millimeters while only 1.34 millimeters for Elm Fork trees.
These values indicate that trees along Denton Creek were

51
TABLE X
TWELVE-YEAR TREE-RING SEGMENT THICKNESS
Stand Tree Thickness Stand Tree Thickness
Lower A- 2 24.2 mm Lower • A- 9 10.2 mm Denton A-14 10.7 Elm A-22 24.3 Creek B- 3 39.7 Fork B-33 7.1
B- 7 19.0 B-38 9.6 C- 3 21.9 C-23 25.7 C-15 34.6 C-38 29.9
Upper A-11 9.9 Upper A-21 13.9 Denton A-24 59.3 Elm A-44 17.1 Creek B- 5 17.0 Fork B-12 10.5
B-17 23.0 B-23 7.4 C-37 46.0 C-10 21.2 C-46 35.7 C-40 26.7
ANALYSIS OF VARIANCE
Source of Variation DF SS MS F
Streams 1 5.46 5.46 10.5 n.s.
Stands 2 1.03 0.52 0.37 n.s.
Trees 20 28.08 1.40
growing at almost double the rate of trees along Elm Fork.
Such a growth rate was unexpected because average Denton Creek
tree size was about half of the average Elm Fork size. An
explanation for this phenomenon is that overstory competition
may have inhibited growth of the sample trees which were from
three to six inches in diameter breast high. Factors of suc-
cession may account for this slow-down in radial growth.

52
Reproductive Study
Data regarding reproductive plant counts and transects
are included in Table XI. Three conclusions can be drawn
from these data. First, the sampling units were too small to
obtain sufficient information, especially regarding post-
seedling reproductives. Secondly, the sampling technique
lacked precision. Finally, a high mortality rate existed
during the seedling stage.
The data for reproductive class III in the lower Denton
Creek stand show wide variation. Reliability of these data
is consequently very low. An increased sampling area would
provide more uniformity among results.
Regarding the precision of the sampling, the techniques
used resulted in a lack of reproducibility. Repetition of
sampling in classes II and III of all upper Elm Fork tran-
sects and of transect C at upper Denton Creek resulted in only
one unchanged datum out of eight. The lack of precision
was due to the inexact manner of laying out the belt transects.
To gain precision in sampling, the limits of the transect
should be accurately defined, and plants should be carefully
counted. These extended efforts, however, would require much
more time than that which was expended.
The number of plants in each reproductive class was
generally lower by about half in the Elm Fork stands than in *
the Denton Creek stands. The numbers of seedlings were
significantly greater than the numbers in the other classes.

53
TABLE XI
HACKBERRY REPRODUCTIVESa
Stand and Date'3 Reproduc tive Classc
IVf 4"*« 45* Q Transect Transect
Date'3
I II III ri£li»UF©S Base®
Lower Denton
A 29 May 30 7 10 22 0 m.
Creek B 29 May 30 7 0 16 70
C 29 May 40 11 2 32 100
Upper Denton
A 30 May 41 9 6 29 0
Creek B 30 May 8 6 10 21 50
C 4 May 508 8 6 35 0
C 30 May 70f 0 8 6 35 0
Lower Elm Fork
A 30 May o h 9 1 17 0 Lower Elm Fork B 30 May 4 301
1 33 0
C 30 May 8 50 2 25 50
Upper Elm
A 23 Apr 83 2 2 13 0
Fork A 31 May 18 6 4 13 0
B 25 Apr 41 / '
4 0 7 50
B 31 May w 7 6 7 50
C 25 Apr 42 7 4 24 187
C 31 May 7 2 1 24 187
a Numbers of young hackberry plants occurring in belt
transects (100 x 1 m.) lying along one side of the intercept tiTwiiniSc trs 0
1969 sampling date.
54
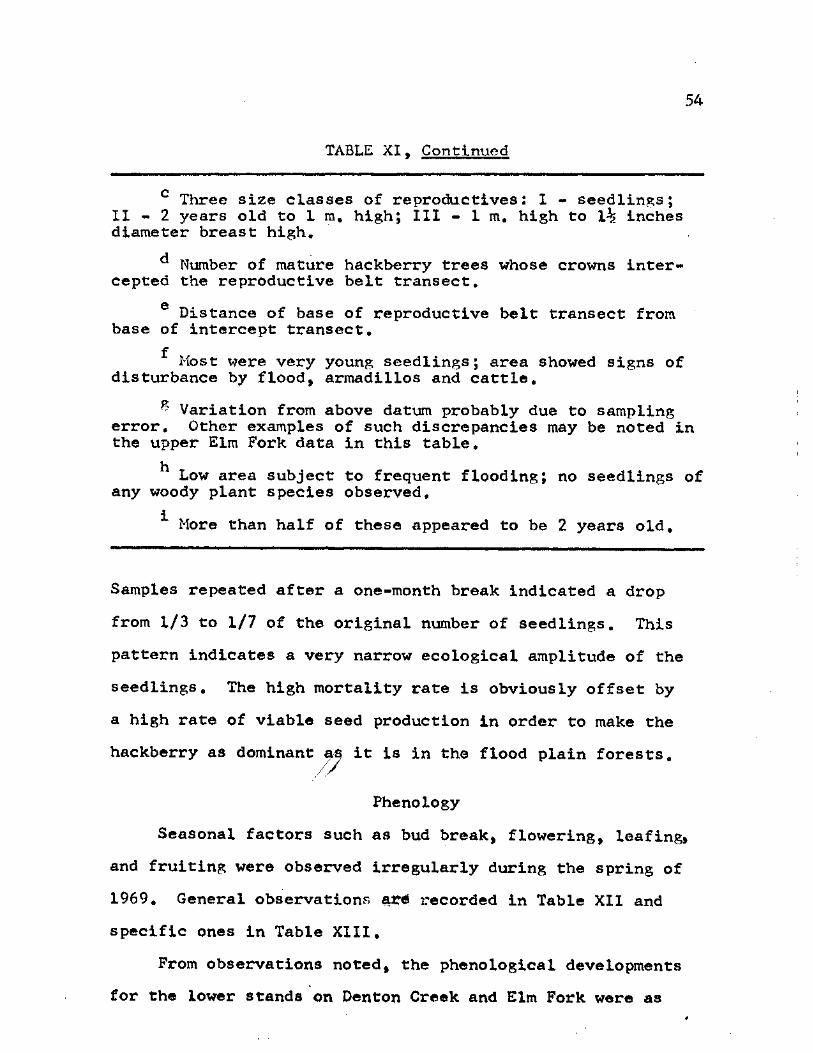
TABLE XI, Continued
c Three size classes of reproductives: I - seedlings; II - 2 years old to 1 m. high; III - 1 m. high to 1% inches diameter breast high.
^ Number of mature hackberry trees whose crowns inter-cepted the reproductive belt transect.
e Distance of base of reproductive belt transect from base of intercept transect.
^ Host were very young seedlings; area showed signs of disturbance by flood, armadillos and cattle.
^ Variation from above dat;um probably due to sampling error. Other examples of such discrepancies may be noted in the upper Elm Fork data in this table.
In Low area subject to frequent flooding; no seedlings of
any woody plant species observed.
* More than half of these appeared to be 2 years old.
Samples repeated after a one-month break indicated a drop
from 1/3 to 1/7 of the original number of seedlings. This
pattern indicates a very narrow ecological amplitude of the
seedlings. The high mortality rate is obviously offset by
a high rate of viable seed production in order to make the
hackberry as dominant^ it is in the flood plain forests.
Phenology
Seasonal factors such as bud break, flowering, leafing,
and fruiting were observed irregularly during the spring of
1969. General observations £r* recorded in Table XII and
specific ones in Table XIII.
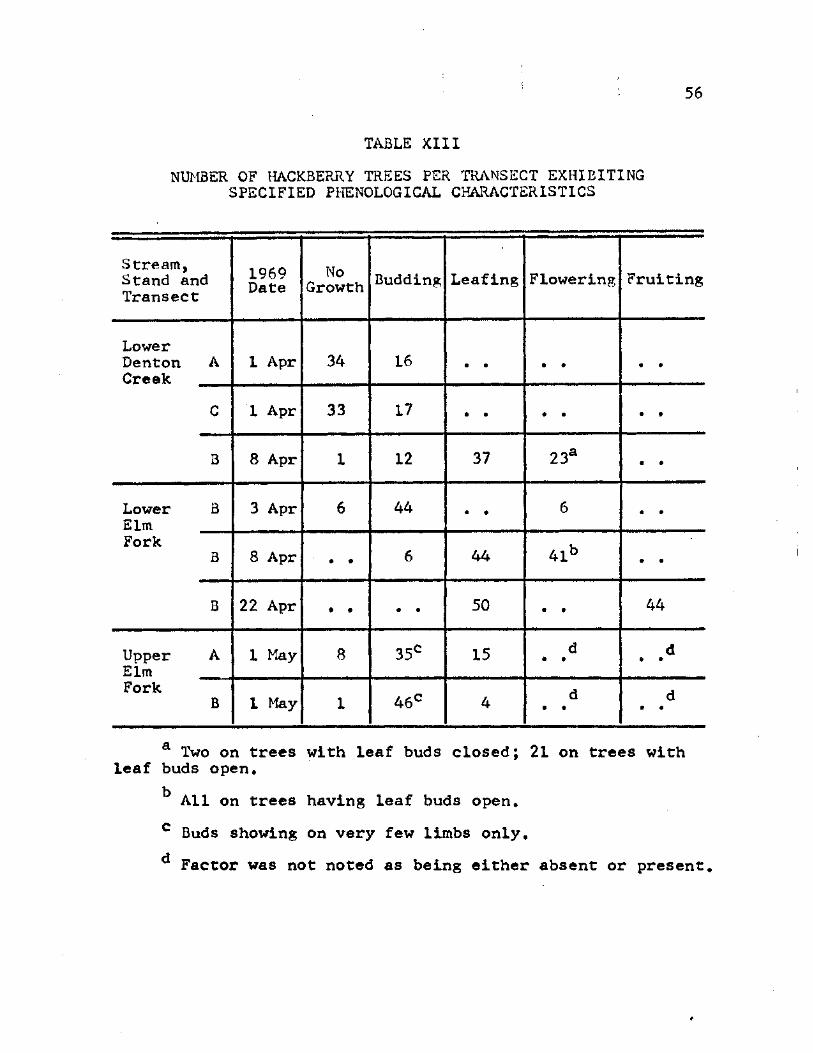
From observations noted, the phenological developments
for the lower stands on Denton Creek and Elm Fork were as

55
TABLE XII
GENERAL OBSERVATIONS REGARDING HACKBERRY PHENOLOGY
Stand 1969 Date
Observation
Lower Elm Fork
18 Mar
20 Mar
Buds slightly swollen in tree tops.
Further bud swelling on exposed limbs.
22 Mar No significant bud break.
27 Mar Buds in most tree tops swollen to one-fourth inch long
Upper Elm Fork
31 May All transect trees in full foliage.
follows: buds broke during the last week of March and the
first week of April; leaves opened during the first week of
April; flowers developed around the end of the first week of
April; fruit development was initiated during the middle of
April, An unexplained phenomenon occurred in the upper Elm
Fork stand. When visited on 1 Hay, 1969, only nineteen trees
out of 150 had any foliage at all. Of these, nine had more
or less normal foliation. One month later (31 May), all of the
sampled trees were in full foliage which was apparently
healthy. No explanation for this delay in phenological
development could be ascertained. Another factor noted during
casual observation was that the flood plain hackberry trees
set little fruit, much less than what is common in isolated
hackberry trees around Denton,
56
TABLE XIII
NUMBER OF HACKBERRY TREES PER TRANSECT EXHIBITING SPECIFIED PENOLOGICAL CHARACTERISTICS
Stream, Stand and Transect
1969 Date
No Growth Budding Leafing Flowering Fruiting
Lower Denton Creek
A 1 Apr 34 16 • • • • • •
C 1 Apr 33 17 • • • • • •
B 8 Apr 1 12 37 23a • #
Lower Elm
B 3 Apr 6 44 • • 6 • •
Fork B 8 Apr # • 6 44 41b
• •
B 22 Apr • • • • 50 • • 44
Upper Elm
A 1 May 8 35° 15 d • •
d 9 •
Fork B 1 Hay 1 46° 4
d • t
d • •
a Two on trees with leaf buds closed; 21 on trees with leaf buds open.
All on trees having leaf buds open.
c Buds showing on very few limbs only,
d Factor was not noted as being either absent or present.

57
Soil Particle Size Analysis
In an effort to locate a cause of variation between
stands and streams, soils were sampled at the A^ and
layers and particle size studied. Indirect measurements
were based upon the differential sedimentation rate of
TABLE XIV
BOUYOUCOS SOIL ANALYSIS - QUANTITY OF A 50-GRAM SAMPLE REMAINING IN SUSPENSION AFTER GIVEN PERIODS OF TIME
Stand and A^ Layer B-j Layer Transect
40 sec. 15 min. 2 hr. 40 sec. 15 min. 2 hr,
Lower A 40 g 29 g 21 8 43 8 35 g 27 j Denton Creek B 39 25 18 44 33 22
C 44 29 20 44 32 23
Upper A 44 35 25 43 33 23 Denton Creek B 43 33 23 38 27 19
C 44 36 27 38 27 21
Lower A 42 30 22 44 35 27 Elm -
Fork B 44 29 21 44 35 25
C 43 27 22 44 31 25
Upper A 44 / 28 19 44 30 23 Elm / /
17 Fork B 41 /v 26 17 39 23 17
C 40 24 16 39 21 15

0 58
various-sized particles from a water suspension. Fifty-
gram soil samples were dispersed according to the method
proposed by Bouyoucos (1930). Grams of the sample remaining
suspended were measured with a Bouyoucos hydrometer at 40
seconds, 15 minutes, and 2 hours after shaking the suspension.
Data obtained are presented in Table XIV.
Characteristics of the B^ layer determined by the 15-
minute readings were stated by Bouyoucos to indicate the
water-holding characteristics of the soil. Analysis of
variance of a comparison of these observations is presented
in Table XV.
TABLE XV
ANALYSIS OF VARIANCE - 15-MINUTE HYDROMETRIC READINGS B^ SOIL LAYER
Source of Variation DF SS MS F
Streams 1 12 12 0.16 n.s.
Stands 2 150 75 7.14 *
Soil Samples 8 84 10.5 •
No difference existed between streams in regards to soil
composition. The F value for between-stands comparisons,
however, did indicate difference significant at the five per
cent level. Little correlation was apparent between this set
of data and that for the hackberry population parameters.

59
Soil particle size was studied as an indication of mois-
ture-holding capacity of the soil. The original assumption
was that variations in soil moisture would affect the hack-
berry populations. Although this assumption is probably true
under other conditions, some pertinent factors were overlooked,
Since the stands occurred in bottomlands, the water table was
probably shallow. The water table was maintained at a
relatively high level because of the proximity of the stream.
These factors would negate the importance of soil particle
size in affecting the water supply available to flood plain
trees.
To complete the Bouyoucos soil study, unfree water and
moisture equivalent percentages were calculated. These values
are shown in Table XVI. According to Bouyoucos (1930), the
TABLE XVI
SOIL MOISTURE FACTORS - BOUYOUCOS DETERMINATION
Data Unfree Water
Moisture Equivalent
Minimum / / 11.9% 27.4%
Mean 17.1 39.2
Maximum 19.8 45.6
percentages of unfree water closely approximate wilting
coefficients. The above values fall in the general range
that is common for clay- and silt-loam soils.

60
CHAPTER BIBLIOGRAPHY
Bliss, C. I. 1967. Statistics in biology, vol. 1. McGraw-Hill Book Co., New York. 558 p.
Bouyoucos, G. J. 1930. The indirect determination of various soil characteristics by the hydrometer method. Soil Sci. 30: 267-272.
Laughlin, K. 1947. Big trees of the midwest. Amer. Midland Nat. 37: 788-793.
Phillips, E. A. 1959. Methods of vegetation study. Holt, Rinehart & Winston, Inc., New York. 107 p.
Swafford, M. L. 1969. Personal interview. 5 Aug. Ponder, Texas,

CHAPTER VI
CONCLUSIONS
Hypothesized difference between Celtis laevigata popu-
lations on two streams in Denton County was found not to
exist to a substantial extent. From F tests of the data
collected, the only significant difference at this level
occurred in the parameter of basal area density. Although
such a difference was found to exist to a significant degree,
variations and patterns of variation were noted.
Variations which were observed between the forests of
Denton Creek and Elm Fork were not definitely explained. Two
causative factors were considered. Soil particle size,
studied as an indication of moisture-holding capacity, was
determined not to be different between streams. No clear
correlation with variations among the hackberry populations
were evident. The anthropeic factors of lumbering and cattle-
grazing were considered, but no strong indication of either
was located. Residents of the localities near the flood plain
stands recollected little pertaining to the study areas
specifically. The only definite information indicated that
fuel wood was obtained from the upper Denton Creek stand prior
to the 1930*s on an irregular and partial basis. Although
evidence is lacking, man*s use of flood plain forests was
believed to be the major cause of existing variations,
61

62
The most significant concept derived from the study is
that the four stands studied may have represented different
phases of flood plain forest succession for the hackberry.
This idea is strongly suggested by the graphs showing size
distribution of the trees in each stand, and it is supported
to varying degrees by the other data. (The stages ranged from
a young, invading type of population in the lower Denton Creek
stand to a maturing population in the upper Elm Fork standj)
Most of the data obtained for various parameters of the
hackberry populations fit into the theory regarding succession.
!|he upper Elm Fork stand sampling had the largest total basal
area, characteristic of a mature tree population. The density
in this stand was low, primarily due to the lack of closely-
growing young trees///The low radial growth rate in the Elm
Fork stands may reflect overstory competition as well as
other factors which no longer favor hackberry tree growth.
Data regarding reproductives indicate the presence of less
favorable conditions for establishment of young hackberry
plants. No explanation was found for the delay in phonological
development of trees in the upper Elm Fork stand. Whatever
factors or conditions caused such a delay may be closely
related to those which resulted in the apparent pattern of
succession.!
In summary, this investigation revealed no major dif-
ferences between flood plain forest populations of the hack-
berry, Celtis laevigata. It did, however, suggest that

63
the stands which were sampled contained hackberry populations
in different stages of succession. As is true of many studies,
this one posed new questions and ideas for continued inves-
tigation.
Further study is needed to determine if the apparent
pattern of succession in the population holds true for the
community as a whole. Whereas these stands which were
studied occur on similar soils, a sandy substrate as on
Clear Creek may produce differences in plant growth. More
evidence should be obtained regarding how the flood plain
forests have been used and to what natural and anthropeic
influences the stands have been exposed. Investigations of
such questions may lead to a more thorough knowledge of
the dynamics of the ecology of the flood plain forest.
0

APPENDIX - SECTION A
DIAMETER BREAST HIGH, HEIGHT AND TRANSECT LOCATION
FOR INDIVIDUAL HACKBERRY TREES
64

65
TABLE I
INTERCEPT TRANSECT A - LOWER DENTON CREEK
Tree Number D B H a Height
Transect Distance*5
Lateral Distance0
1 2 3 4 5 6 7 8 9
10 11 12 13 14 15 16 17 18 19 20 21 22 23 24 25 26 27 28 29 30 31 32 33 34 35 36 37 38 39 40
7
25 ft, 30 30 15 25 30 15 30 18 18 15 25 20 18 35 18 18 20d
40 40 15 18 35 20 30 25 35 30 18 15 18 15 30 20 15 35 18 30 30 25
1 m. 4 14 30 37 41 46 51 51 53 56 56 59 59 63 71 74 78 79 82 85 99 129 147 168 170 171 171 186 198 204 206 216e
216 217 238® 247 247 263 265
1 1 0 1 0 0 0 4 0 1 1 2 1 2 2 2 2 0 1 3 1 1 0 1 1 1 1 0 0 1 0 1 1 1 1 1 1 0 1 3
m. right right
right
right
left right left right right left right left
left left left right
left right left left
left
left right left left left left
right right

66
TABLE I - Continued
Tree Transect Lateral Number D B H Height Distance Distance
41 5 in. 20 ft. 274 m. 1 m. right 42 1% 15 274 2 left 43 2 18 279 2 left 44 2% 20 282 1 right 45 2 18 288 1 left 46 2 15 295 0 47 1% 15 296 1 left 48 4 25 300 2 left 49 2 15 303 1 right 50 10 in. 35 ft. 312 m. 1 m. right
a Diameter breast high.
b Distance from transect base.
c Distance from transect line.
** Trunk was broken several feet above ground.
e Transect interrupted by clearing. Datum corrected accordingly.

67
, TABLE II I
INTERCEPT TRANSECT B - LOWER DENTON CREEK
Tree Transect Lateral Number D B H Height Distance Distance
I 2 in. 18 ft. 1 m. 0 m. 2 ih 12 2 0 3 4 25 10 2 left 4 9% 45 10 3 left 5 1% 15 27 2 right 6 3% 30 30 2 right 7 5 30 39 2 right 8 3 25 39 1 left 9 10% 35 67a 1 right
10 3 h 35 68 1 left 11 % 20 74 2 right 12 % 18 75 1 right 13 4 30 78 2 right 14 3 25 78 2 left 15 5% 35 78 3 left 16 4 25 81 2 right 17 25 86 2 right 18 2 k 18 91 1 left 19 1% 18 92 0 20 3 18 101 3 left 21 6 20 110 2 right 22 2 14 122 1 right 23 5% 30 124 3 right 24 10 40 144 1 right 25 4 30 164 1 left 26 7 35 168 2 left 27 8% 40 172 3 left 28 3% 20 185 1 left 29 8 35 207 1 left 30 4% 30 211 1 right 31 4 25 217 2 left 32 10 40 217 3 left 33 8 30 218 4 left 34 ; 1% 12 224 1 left 35 14 40 228 3 right 36 1% 20 238 0
right
37 1% 12 238 1 left 38 2% 25 239 0 39 2% 30 239 1 right 40 2 15 241 0
right

TABLE II - Continued
68
Tree Number
Transect Lateral D B H Height Distance Distance
1% in. 12 ft. 244 m. 1 m. left 3 25 245 1 right 2% 25 246 1 right 2 18 247 3 left 9% 40 247 4 right 6 40 249 3 right 12 40 249 4 right uk 40 249 3 left
35 251 1 left 2% in. 20 ft. 261 m. 1 m. right
41 42 43 44 45 46 47 48 49 50
a Transect interrupted by clearing. Datum corrected accordingly.
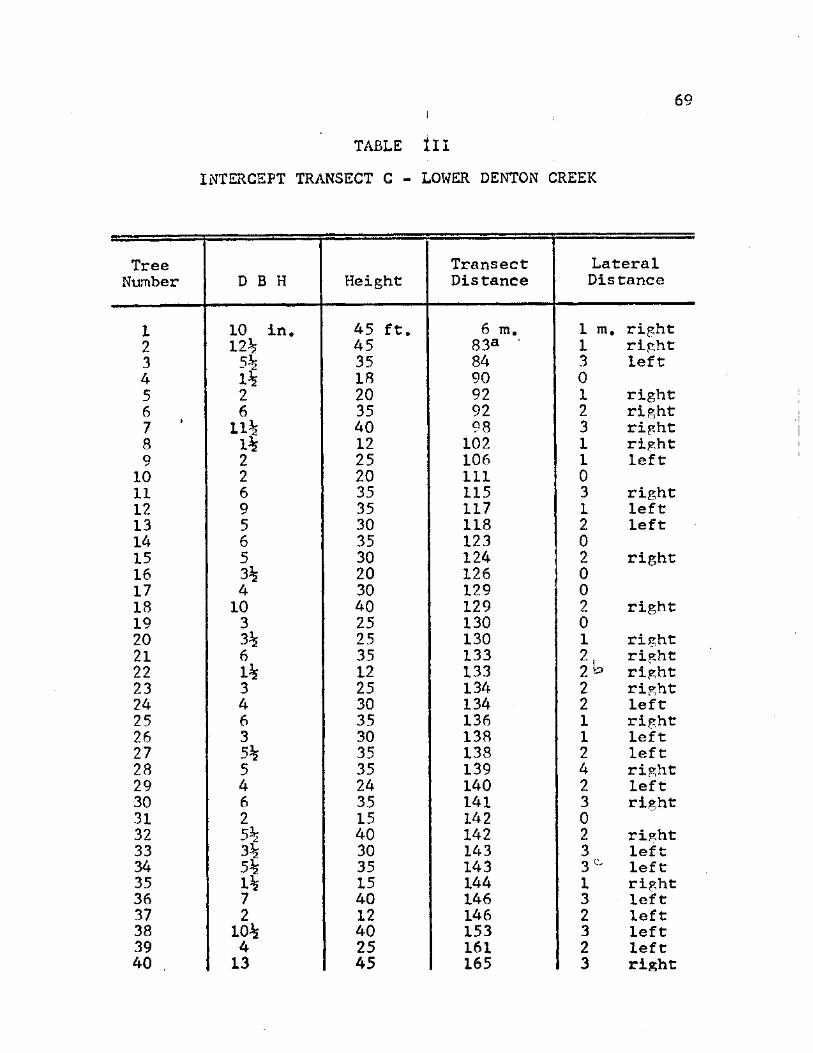
69
; TABLE III
INTERCEPT TRANSECT C - LOWER DENTON CREEK
Tree Transect Lateral Number D B H Height Distance Distance
1 10 in. 45 ft. 6 m. 1 m. right 2 12% 45 83a 1 right 3 5% 35 84 3 left 4 1% 18 90 0 5 2 20 92 1 right 6 6 35 92 2 right 7 ' 11% 40 98 3 right 8 1% 12 102 1 right 9 2 25 106 1 left
10 2 20 111 0 11 6 35 115 3 right 12 9 35 117 1 left 13 5 30 118 2 left 14 6 35 123 0 15 5 30 124 | 2 right 16 3% 20 126 j 0 17 4 30 129 0 18 10 40 129 2 right 19 3 25 130 0 20 3% 25 130 1 right 21 6 35 133 2,
2® right
22 1% 12 133 2, 2® right
23 3 25 134 2 right 24 4 30 134 2 left 25 6 35 136 1 right 26 3 30 138 1 left 27 5% 35 138 2 left 28 5 35 139 4 right 29 4 24 140 2 left 30 6 35 141 3 right 31 2 15 142 0 32 5% 40 142 2 right 33 3% 30 143 3 left 34 5% 35 143 3 c left 35 1% 15 144 1 right 36 7 40 146 3 left 37 2 12 146 2 left 38 10% 40 153 3 left 39 4 25 161 2 left 40 13 45 165 3 right

TABLE III - Continued </
70
Tree Transect Lateral Number D B H Height Distance Distance
41 15 in. 45 ft. 174 m. 4 m. right 42 6 35 210 0 43 6 35 214 1 right 44 3% 30 219 2 right 45 7 40 219 4 right 46 13*? 45 219 5 left 47 4 30 223 1 right 48 3% 30 236 2 right 49 4 30 245 1 left 50 13% in. 50 ft. 249 m. 2 m. left
a Transect interrupted by two clearings. Datum corrected accordingly.
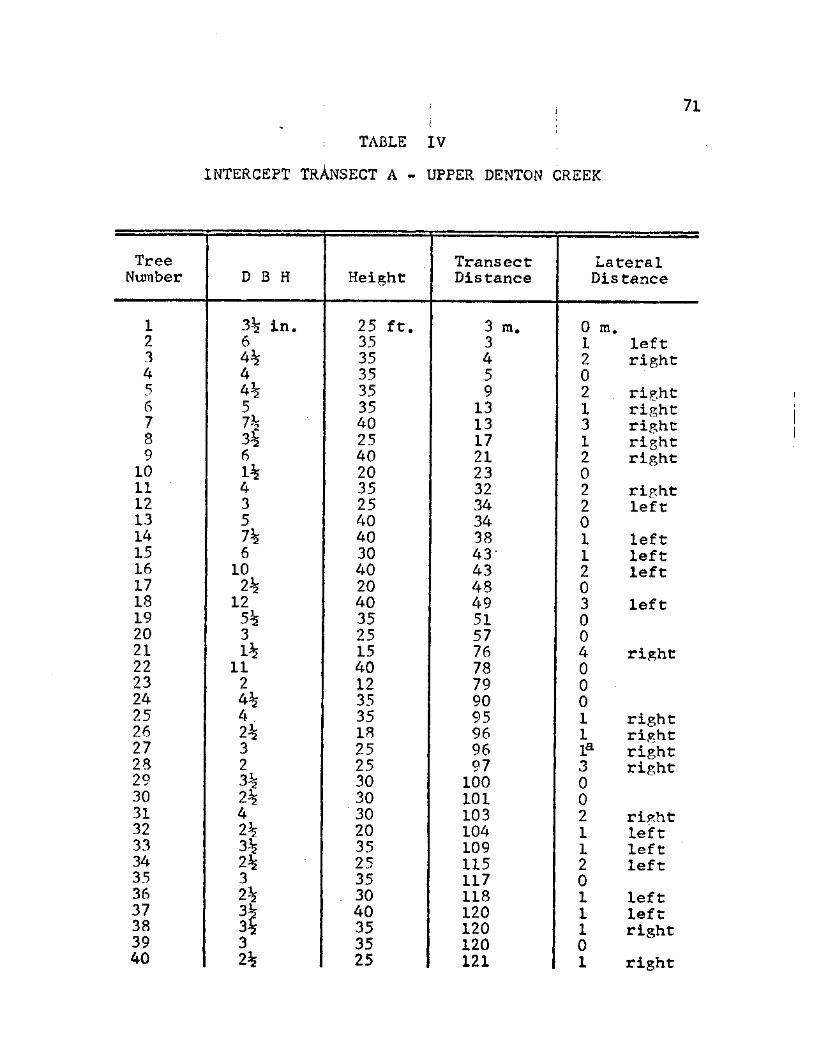
71
; TABLE IV
INTERCEPT TRANSECT A - UPPER DENTON CREEK
Tree Transect Lateral Number D B H Height Distance Distance
1 3% in. 25 ft. 3 m. 0 m. 2 6 35 3 1 left 3 4% 35 4 2 right 4 4 35 5 0
right
5 4% 35 9 2 . right 6 5 35 13 1 right 7 7% 40 13 3 right 8 3% 25 17 1 right 9 6 40 21 2 right
10 1% 20 23 0 right
11 4 35 32 2 right 12 3 25 34 2 left 13 5 40 34 0 14 7% 40 38 1 left 15 6 30 43 1 left 16 10 40 43 2 left 17 2% 20 48 0 18 12 40 49 3 left 19 5% 35 51 0 20 3 25 57 0 21 1% 15 76 4 right 22 11 40 78 0
right
23 2 12 79 0 24 4% 35 90 0 25 4 . 35 95 1 right 26 2% 18 96 1 right 27 3 25 96 la right 28 2 25 97 3 right 29 3% 30 100 0
right
30 2% 30 101 0 31 4 30 103 2 rifcht 32 2% 20 104 1 left 33 35 109 1 left 34 2% 25 115 2 left 35 3 35 117 0 36 2% 30 118 1 left 37 3% 40 120 1 left 38 3% 35 120 1 right 39 3 35 120 0
right
40 2% 25 121 1 right

TABLE IV - Continued
72
Tree Transect Lateral Number D B H Height Distance Distance
41 2 in. 20 ft. 121 m. 1 m, right 42 4 35 122 1 right 43 3 25 131 2 right 44 3 20 131 0 45 5% 40 136 2 left 46 5% 40 136 0 47 9% 40 137 3 left 48 1% 18 140 0 49 4% 35 143 1 left 50 4 in. 25 ft. 171 m. 2 m . right
a Tree 27 was less than one-half meter from tree 26.

73
TABLE V
INTERCEPT TRANSECT B - UPPER' DENTON CREEK
Tree Transect Lateral Number D B H Height Distance Distance
1 9 in. 50 ft. 7 m. 2 m. left 2 2 12 12 2 left 3 2% 20 12 3 left 4 7% 40 12 3 right 5 7k 35 12 4 right 6 3 k 25 14 1 right 7 2 18 19 1 left 8 Ik 45 19 1 a left 9 2 10 19 1 right 10 7\ 40 20 1 right 11 5k 25 23 2 right 12 6% 35 27 4 right 13 6 35 34 2 right 14 10 40 35 2 right 15 7 40 37 0
right
16 2k 18 37 1 right 17 4 35 38 0
right
18 8% 50 45 1 left 19 3 30 55 2 right 20 10% 50 71 1 left 21 ik 25 77 0 22 9k 45 77 4 left 23 4 35 84 1 right 24 5% 35 90 2 left 25 2% 25 91 2 left 26 4 30 95 1 left 27 6 / 40 95 2 left 28 6 y 35 97 2 left 29 2% 7 25 99 2 right 30 2 25 103 0
right
31 4 40 104 0 32 5% 40 105 1 right 33 6 40 107 1 left 34 2 25 107 2 left 35 3 30 108 1 left 36 2 25 112 2 right 37 6% 40 123 < 5 left 38 14% 55 130 0 39 8 30 134 4 right 40 13 35 143 2 right

TABLE V - Continued
74
Tree Transect Lateral Number D B H Height Distance Distance
41 lk in. 18 ft. 153 m. 1 m. left 42 3 30 153 2 right 43 2 25 154 0 44 5k 35 157 0 45 12 45 159 3 left 46 7 35 163 2 right 47 1% 25 165 1 right 48 3 35 166 1 right 49 3 40 167 2 left 50 3 in. 25 ft.
U
168 m. 1 m. left
a Tree 8 was less than one-half meter from tree 7,

75
TABLE VI
INTERCEPT TRANSECT C - UPPER DENTON CREEK
Tree Transect Lateral Number D B H Height Distance Distance
1 2 in. 25 ft. 3 m. 2 m. right 2 5% 35 6 2 right 3 6 35 6 2 right 4 5 35 9 1 left 5 6% 35 20 4 right 6 4% 35 22 1 right 7 9% 35 23 3 left 8 7 35 23 4 right 9 3% 25 30 4 right 10 10% 50 31 6 right 11 7% 35 36 4 left 12 5 40 41 0 13 6 35 42 1 left 14 9 45 44 4 right 15 3 25 44 2 left 16 6 30 54 3 right 17 5% 35 60 0
right
18 6% 35 60 1 right 19 5 30 60 la right 20 12 45 65 4 left 21 8% 40 65 8 right 22 11 45 67 4 left 23 12 40 73 4 right 24 7 35 73 4 right 25 7 35 75 4 left 26 15 45 75 5 left 27 13 40 76 5 left 28 1% 15 81 1 left 29 4 35 90 1 left 30 6% 40 90 0 31 40 91 2 right 32 6% 35 95 1 right 33 6% 35 95 2 right 34 2% 25 99 1 left 35 3 30 100 1 right 36 4% 30 103 2 left 37 5 35 105 0 38 2% 30 110 0 39 3% 30 111 0 40 4 25 113 2 right

TABLE VI - Continued
76
Tree Transect Lateral Number D B H Height Distance Distance
41 7% in. 35 ft. 115 m. 1 m. left 42 9% 35 122 3 left 43 9 45 124 1 left 44 3 20 124 2 left 45 6 35 127 2 left 46 5 30 127 1 left 47 3% 20 129 1 left 48 7 35 129 4 right 49 8 40 131 2 left 50 4 in. 30 ft. 131 m. 1 m. left
& Tree 19 was less than one-half meter from tree 18,

77
TABLE VII
INTERCEPT TRANSECT A - LOWER ELM FORK
Tree Transect Lateral Number. D B H Height Distance Distance
I 10% in. 40 ft. 2 m. 0 m. 2 2% 20 11 1 right 3 8 35 18 3 right 4 6% 35 20 1 left 5 16% 50 20 5 right 6 6 35 24 1 left 7 10% 45 29 1 right 8 15 45 36 5 left 9 4 18 61 4 left
10 9% 35 61 7 left II 12 35 70 3 left 12 9% 40 75 1 left 13 7% 30 87 4 left 14 10% 40 91 8 left 15 14% 45 95 8 left 16 8% 35 98 2 left 17 16% 50 101 3 right 18 6% 35 106 1 right 19 6 35 109 0
right
20 12 40 117 3 left 21 2% 18 118 1 left 22 3 20 127 0 23 3% 25 129 2 left 24 3 25 130 1 right 25 4 25 134 1 left 26 12 135a 0 27 8% 35 138 2 left 28 7% 30 145 3 right 29 1 2h 184 1 right 30 9% 30b 200 2 right 31 3 20 206 2 right 32 1% 12 214 3 right 33 2 18 215 3 right 34 3% 25 217 0
right
35 11 40 220 1 right 36 12 35 223 3 right 37 2 15 228 1 right 38 3 25 234 0
right
39 3 25 234 1 left 40 3 20 247 1 right

78
TABLE VII - Continued.
Tree Transect Lateral Number D B H Height Distance Distance
41 3 in. 25 ft. 249 m. 3 m. right 42 5 30 251 2 right 43 2 18 254 1 left 44 4 25 255 0 45 6 35 256 2 right 46 4 25 257 0 47 4% 25 257 2 right 48 2k 18 258 2 right 49 2 18 260 1 left 50 5 in. 30 ft. 263 m. 2 m. left
a Transect interrupted by a pond. Datum corrected accordingly.
b Tree leaning with trunk at about a 45° angle.

79
TABLE VIII
INTERCEPT TRANSECT B - LOWER ELM FORK
Tree Transect Lateral Number D B H Height Distance Distance
I 7 in. 30 ft. 17 m. 1 m. right 2 14 45 21 0
m. right
3 7% 20 24 1 right 4 10% 35 31 2 left 5 6 25 38 0 6 8 25 38 1 right 7 7 35 43 1 left 8 13% 50 48 1 right 9 12 50 56 0
right
10 12 30 61 1 left II 4 15 64 1 right 12 15% 40 65 5 left 13 8 30 71 5 left 14 10% 45 71 0 15 10% 45 72 , 2 right 16 5 30 75 0
right
17 9 45 77 3 left 18 5% 25 79 1 right 19 6% 35 79 3 left 20 5% 30 83 3 left 21 4% 30 84 1 left 22 4 20 91 3 right 23 11 35 95 1 left 24 9% 35 100 0 25 4 30 101 2 left 26 8 35 101 1 right 27 7 35 103 0
right
28 5% 35 103 2 right 29 7% 35 105 1 left 30 6 35 105 1 right 31 2 10 106 1 right 32 4 30 107 1 right 33 4% 30 108 2 left 34 9 35 114 2 right 35 4 30 116 2 right 36 4% 50 118 3 left 37 8 40 126 2 right 38 4% 25 127 1 left 39 8 35 134 0 40 4 20 139 0

TABLE VIII - Continued
80
Tree Transect Lateral Number D B H Height Distance Distance
41 8 in. 35 ft. 154 m. 0 m. 42 10 35 156 5 left 43 7% 35 157 1 right 44 9% 40 159 2 right 45 9 35 167 1 left 46 8 30 175 2 right 47 6 30 177 4 right 48 Ik 12 178 1 right 49 5k 30 232 0
right
50 6 in. 30 ft. 234 m. 0 m.

81
TABLE IX
INTERCEPT TRANSECT C - LOWER ELM FORK
Tree Transect Lateral Number D B H Height Distance Distance
I 6% in. 25 ft. 13 m. 5 m. right 2 31 45 17 6 right 3 8 35 19 4 left 4 13 45 25 6 left 5 10% 40 28 0 6 11 35 30 1 right 7 11 30a 31 1 right 8 7% 35 37 3 left 9 5? 30 38 3 left 10 10% 40 44 4 right 11 8 25 49 2 left 12 20% 50 51 2 left 13 10 40 57 1 left 14 8 40 58 4 right 15 8% 40 65 3 right 16 10 35 73 1 left 17 7% 35 73 4 right 18 9 40 76 5 right 19 11% 30 81 1 right 20 6% 25 87 2 right 21 3 15 89 1 right 22 2% 15 92 4 right 23 4 30 94 2 left 24 9% 40 99 0 25 9 35 100 2 right 26 7% 35 103 1 right 27 4% 25 108 3 left 28 4 25 110 1, left 29 8 35 113 1 left 30 6% 30 114 2 right 31 10 40 120 0
right
32 8% 40 124 1 right 33 8% 35 131 . 1 left 34 6% 30 131 4 right 35 6 30 132 3 right 36 6% 30 136 1 left 37 2 15 160 1 right 38 3 15 162 1 right 39 5% 18 167 1 right 40 3 18 167 2 left

TABLE IX - Continued
82
Tree Transect Lateral Number D B H Height Distance Distance
41 4 in. 15a ft. 169 m. 1 m. left 42 1% 15 171 1 left 43 5 25 174 0 44 2% 12 175 1 right 45 7k 35 177 5 right 46 1\ 40 179 5 right 47 1§ 12 179 1 left 48 5% 30 186 1 right 49 5 35 195 1 right 50 10% in. 40 ft. 195 m. 0 m.
A Trunk broken several feet above ground.

83
TABLE X
INTERCEPT TRANSECT A - UPPER ELM FORK
Tree Transect Number D B H Height Distance
1 7% in. 35 ft. 11 m. 2 7 / 30 17 3 13 0 50
' 25 36
4 7 / 0 50 ' 25 37
5 8% 40 39 6 7% 35 47 7 12 40 51 8 8% 35 61 9 8 35 73
10 17 60 75 11 8% 40 79 12 12 55 89, 13 8% 45 94 14 6% 25 104 15 8 35 110 16 5% 30 114 17 11% 55 120 18 14 70 120 19 10 40 124 20 10 35 134 21 4 25 142 22 10% 50 146 23 4 18 153 24 7% 30 180 25 7% 30 210 26 10 35 238 27 10% 45 247 28 17% 50 250 29 13 35 255 30 16% 55 261 31 2% 20 266 32 12 40 270 33 23% 50 271 34 5% 30 272 35 18% 40 278 36 9% 35 281 37 7 30 284 38 18 55 292 39 2 12 292 40 8% 40 295
Lateral Distance
3 m, left 3 right 8 left 4 left 3 right 5 right 3 left 5 right 1 right 1 right 4 right 2 left 3 right 3 right 4 right 3 left 2 left 6 left 4 right 0 0 4 left 1 right 2 left 0 0 6 left 9 left 1 left 1 left 3 right 6 left 4 right 1 left 7 left 2 right 2 left 0 3 right 3 left

TABLE X - Continued
84
Tree Transect Lateral Number D B H Height Distance Distance
41 13% in. 45 ft. 299 m. 7 m, left 42 ll£ 40 300 5 right 43 4 40 302 3 right 44 9% 35 304 4 left 45 Ik 35 304 5 right 46 17% 45 311 1 right 47 16 35 326 7 left 48 6 25 332 1 left 49 15 45 337 2 left 50 3% in. 20 ft. 349 m. 1 m, left

85
TABLE XI
INTERCEPT TRANSECT B - UPPER ELM FORK
Tree Transect Number D B H Height Distance
1 13% in. 50 ft. 12 m. 2 10 40 16 . 3 4 30 19 4 10 45 21 5 13% 50 24 6 7 40 24 7 6% 25 30 8 12% 50 35 9 9 40 37
10 8% 40 46 11 7 40 47 12 3% i 15 50 13 8 30 53 14 8 35 55 15 6% 20 65 16 13 45 81 17 6 25 108 18 9 % 35 142 19 11 35 174 20 13 40 184 21 10% 45 191 22 4 30 193 23 4% 30 193 24 11 45 195 25 5 30 196 26 13% 55 200 27 9 40 200 28 3% 20 203 29 8 30 203 30 8 35 209 31 6 40 213 32 10% 40 214 33 13% 55 216 34 9% 40 226 35 8 30 236 36 8 35 238 37 18 50 255 38 10 35 257 39 16% 35 266 40 9 35 279
Lateral Distance
1 m. 1 4 5 1 3 2 0 2 1 4 2 2 2 4 3 4 4 4 7 3 0 2 2 3 1 2 4 2 5 1 0 2 5 2 2 5 4 I 5
right left left right right left right
left right right left left left left right left right left right left
right left right right left right right right right
left right right left left right right left

TABLE XI - Continued
86
Tree Transect Lateral Number D B H Height Distance Distance
41 17% in. 55 ft. 281 m. 7 m. right 42 10 50 285 0 43 12 55 288 4 right 44 19 70 290 10 right 45 9 40 291 3 right 46 14 60 294 7 right 47 6 35 300 2 right 48 1% 15 329 2 right 49 3 25 339 0 50 2% in. 20 ft. 340 m. 1 m. left
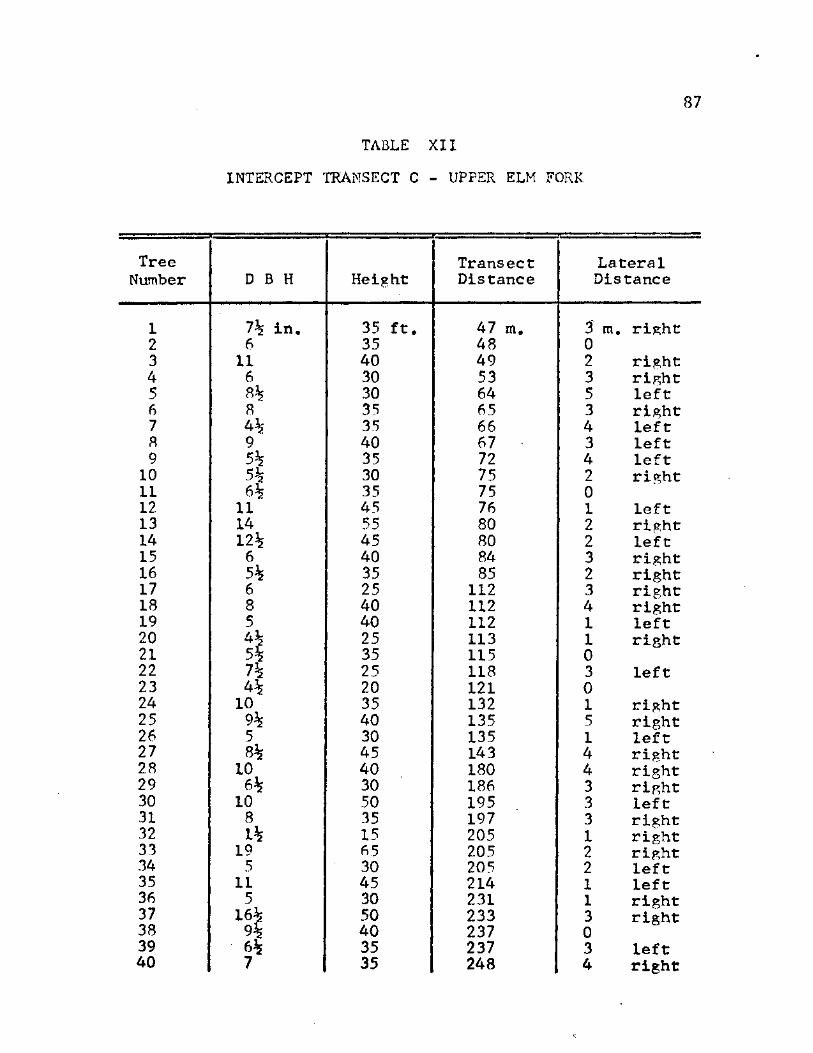
37
TABLE XII
INTERCEPT TRANSECT C - UPPER ELM FORK
Tree Transect Lateral Number D B H Height Distance Distance
I 7% in. 35 ft. 47 m. 3 m. right 2 6 35 48 0 3 11 40 49 2 right 4 6 30 53 3 right 5 8% 30 64 5 left 6 8 35 65 3 right 7 4% 35 66 4 left 8 9 40 67 3 left 9 5% 35 72 4 left 10 5% 30 75 2 right II 6% 35 75 0
right
12 11 45 76 1 left 13 14 55 80 2 right 14 12% 45 80 2 left 15 6 40 84 3 right 16 5% 35 85 2 right 17 6 25 112 3 right 18 8 40 112 4 right 19 5 40 112 1 left 20 4% 25 113 1 right 21 5% 35 115 0
right
22 7% 25 118 3 left 23 4% 20 121 0 24 10 35 132 1 right 25 9% 40 135 5 right 26 5 30 135 1 left 27 8% 45 143 4 right 28 10 40 180 4 right 29 6% 30 186 3 right 30 10 50 195 3 left 31 8 35 197 3 right 32 i % 15 205 1 right 33 19 65 205 2 right 34 5 30 205 2 left 35 11 45 214 1 left 36 5 30 231 1 right 37 16% 50 233 3 right 38 9% 40 237 0
right
39 6% 35 237 3 left 40 7 35 248 4 right
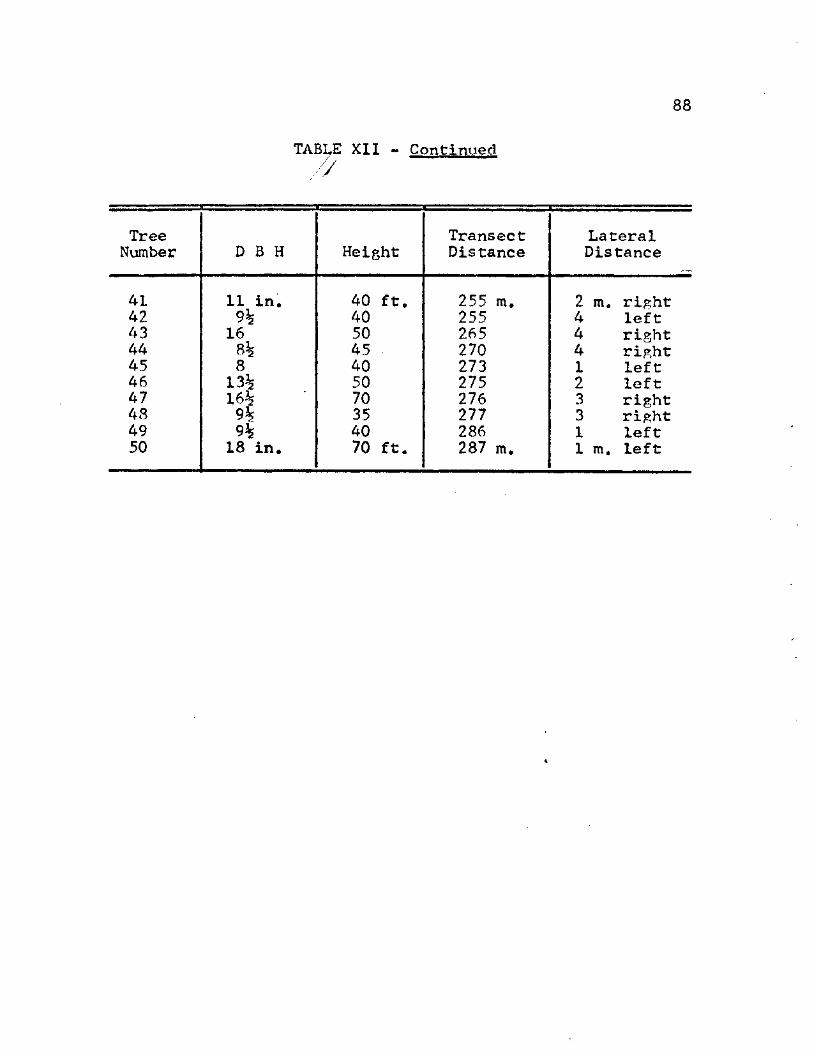
TABLE XII - Continued 7/
88
Tree Transect Lateral Number D B H Height Distance Distance
41 II in. 40 ft. 255 m. 2 m. right 42 9% 40 255 4 left 43 16 50 265 4 right 44 8% 45 270 4 right 45 8 40 273 1 left 46 13% 50 275 2 left 47 16% 70 276 3 right 48 9% 35 277 3 right 49 9% 40 286 1 left 50 18 in. 70 ft. 287 m. 1 m. left

89
APPENDIX - SECTION B
DIAMETER BREAST HIGH OF INDIVIDUAL TREES OF OTHER SPECIES
INTERCEPTING THE 50-HACKBERRY-TREE TRANSECTS

90
m w w B o 2; M H 04 M O al w
M clJ I w H « O 5 w o
H ° *
§ S m H K O
ca
& £-4
5
o
24
• •
•
•
Upper
t®
3,6,
11
v£>
• •
u o f*4
< 11,14
10,20
7,28 •
• • *
6 Hi W o
o CM
• •
2,3,2
2
Lower
CQ •
*
• •
CO
<
12
3,2
4,3,3
4,2,2
o st oo cm co *n <f H H H #n—f CM «* #* <*vD <* •» V0 CM O *<f CM r-J CM CM in CM CM
• •
• •
V
Upper
m
2,3,9
11,12
7,6,4
9
0C CO \D <f r-l A A A «ro v c m w (\J « A A A r-4 CM CM m CM
• •
#-*4 <D <D h O #•*4
< CM CO A Ik Ift CM <f" CO #i * «*o N 00 N f4
OOCMCOCMCMOOvDOO vfCMCM<fCOvCCOCM<t voco^r^cocMLncom
•
•
C 0 U a <D a
u CO «% o CM
co <t in cm m <r cm #
#1 «% «* «% #k •% cMONincM-stcsivDr vOCMOOr COvOCMCM 3
,2,5
Lower
m
6,4,3
14,18
16
<tr r cMin «t is *r-4 A
<t in m *co 0k 0% *CO «M-4 CO CO rv f-l<t r-4
5,3,4
2,3,2
4,4,2
3,4
<
8,3,2
2
3,5,3
2,2,2
2,2,2
3,2,2
2.4.3
2.2.4
3
Stream
Stand
Transect
American elm
Ash
Black haw

91
•o <D 3 £ •r4 -P C o o
tc o M K H W
u o
W
*4 0) a a* D
O & o l-l
a
CO
a
PQ
00 «k
CM A
CO CO
in A A
in CM co A A A
VD co CO
ON
r-4
<t CO CM CO CM
A AH CM O * CM CO in
CM CM
CM CM
A vO O CM CO
O CO
CO CM
A
CM
C O
o < f CM CM
A A
r4 CM
CMOOincMincMOO CM CM *~4 r~4 At—| CM CM <j* A A A A C M A M A A
CO <f VO CO ACM CM O <t r-4 CM r-4 r-4 <t" CM CM CM CM vO C O CO CM < T
r-4 r-4 r-4 CM CM CO
A A A A A A
CM M m < T CM CM
CO *—( r-4 CM CM CM
vO CM CO r-4 O V 0 r~4 CM H CM ArI r-4 r-4 r-4 CM
A A CO A A A A A (*"*•* O CM ACM <f <t r-« m A CMr-tinCMCMCMr-lr-4vO vo o co CM vo in in r-4 r-| A r-4 A r-4 r«) A A
A A0\ ACM A ACO CO C O
O CO Ain AO V D A A A
r-4 t—| fx, r-4 CO r-4 r-4 CM CO <$"
vO<fmcMOOCMCMOO H Af-1 r—J Af~J r4 rHl rHl
A<j" A Ain A A A A M
o * o vo Ain o o o <t rI <j* r-4 *~-4 <f" r-4 r-4 r-4 r~1 r-1 <± »-< m CM m o m co
A r I A r - 4 A»—4 r - 4 H 00 Ain Ain A A A
A I N A O O A < T VO CM
\ O r l C 0 H i n H H H
eq an
£-4
H
a
a CM
A
C O
X o 0) *4 o c o u a 0) p
*4 <D P4 O*
05 in
A
m A
o
*4 4) 5 o >4
CQ
E 0 *4
•O a $
m
in
u u cd •to •o «s «r4 o m
CO 00 r-4 CM
A A A VD CM CM
r-4 C O CM
CO A
m CM
CM
VD <t r-4 A
aCF* co Ain rA m r-4 CM r-4
A<t o * r-4 in
in A
VD
* C M
< T CM
vo co CM co CM
r-l A A A R-4 A
Ain CM in avo oo O <* A r-4 A A
r-4 CM VC <t r-4 00 CO <f ON O O
A r-4 A A r-4 r-4 CM
CM A < F - C O A A A
A C M * A O < F CM
<f CO <j" r-4 r-4 r-4
r-4COCMCOr^CM<fCOininOCO<f r-4 A r-4 A AH r-4 ' A A AP4 A A
Ain A<j- in a Ain co in A<t <$• CO A Q A AQ O •* * * 0 * *
r-4 CO r-4 VO CO r-4 r-4 VD <t" r-4 CO CO <t CO o 00 r-4 A r-4 r-4
A < F A A O O
CM Ar-4 r4 a r-4 VD r-4 r-4 CO
O 00 00 CO <t ^ r-4 A A A A #1
Ain in r**. in co R-4 A A A A «
r-4 CO r*w0 CM
CM CO <t m CM co I A A A A A A r-4 in CM vo
> A A #
0 0 CM CM
N vON A
> A A A CM co in <t t-4
U o
•a r-4 <D § CO
& fd o $ CQ
<T CM co cs co r-4 A A A A r-4
A C M O O CM in * CM A A A A r-4 .t-4 V O in CM <t r-4
e r-4 0
o CM M
CM A 0 ACM <t
o * * r-4 m
CO CO CM CM • A A A A 00 CM VD <fr k A A A A 00 CM <t vo
U
*0 <D U

92
•o o 3 c
•HI P a o
o
« a M t d
I 25
t/5
S H H
3
•
o •
•
a . PQ 04 •
D
^5 <c
O PL| vO
6 i—t w o •
•
<D & PQ •
O i - l •
< • •
o •
O CM <D r—1 r 4 a pq ^ « f s Q* o o *
3 r-1 r*l CO
0) 0) M <
O «i O
£1 0 < t ^ r H c n co l o c o o o vo t n < t c M < f 4 j a a < t VO CO *vO C 0 v C < t C M < f U 0 i n < t < t c •
Q < f c o v c c s i o o r ^ f ^ . < N i n c M v o < t o o c M
r ^ f - i v D r ^ i r x t C N j c M i A C N j c o r ^ ^ ^ c o c N J C M O O <*!•_{ « * •—{ ^ •
CQ \£> * < N O O m C O C O C N j r ^ C O C O C O O O C M v O v D ^ o «*<J" * 0 «fc<f •
t-3 C O r 4 < r m C O C M t n o O \ D C O C ^ < N < t l A < N < t < N r 4 ( N » - 4
< t < f C ^ < N t O r ^ r - < v D m n n H t-4 ^ r l «* •
< i n co * * o 4 * 0 0 m * +r-4 O * < N *C\J •
CO CO N H H CO H I A H
4J a I s
e a> E CO * 0 CO t~f *0 u 0 a £ 0) -$4 <0 ttf 4-> •O U 4J $4 C/5 s/3 H cd 0 a C/5 s/3
• 0 u *H 0 43
o U

93
•o 0) s a •H 4J C o u
m a w H
CQ en C4 fxl H
P
M 0) 04 Pu p
o
M U o En S r-i W a
k 0) I iJi
Q3
CM a CM A
00 CM
CM
t/0 «* CO
CM CM n 00
o f-4 «*0S
r-4 <* r4CM
O
AJ 0) O O c o p £ 0) o
© Cw Pu £>
ixj
ir> ch O vo CM <f * «r| M«-| r-4 <f *VO *
* •CnJ «%O CM COHH
CM 4*
CO «fc vo
CO V0 r. a <t 00 CM
<* «* #k co oo uo
oo
b a & o a
HQ
00 •t CM #» CM
in «% 00 00
Ik «* 00 CM 00 f ^ #* A CM <t * #k f% '
00 <fr
CM CM vO CM CM CM
4* *
CM CM CM «%«%«% CM CM CM
CO
<t #% in oo oo
CM * CM CM
r-l 00 7
e $ 0) k 4-* t/5
•O a «d 4-» CA
P U <D W C CO H
> •O o 0 1 o u u o u
m >% d r-l O a r-l 3 g o
m 43 •rl yt o w €) Q
& CEJ
O a
0) u cd r-l & w o
- € a) a > w
w 3
Sn O C) o C f I i§
a ^ 8 o 9 •H r-l K Pw 2
>*
k 0) £> r-l I

94
*a € 3 C •r< P c o o
EC 0 M w
H $
W
CQ
01 0$ te H
•—i Q
• 4
O &4
&J
o
0? a & p
CO
CO
o
<D &
o >~1
CQ
<£
<r CM
o CO
CM 1 00
N v o m „ m #* **<3" co-r^ oo r~i ^ •% #t #v
a% <t co
vo *
00 * o
<f r-4
CO
<f * o
CM r*4 a «»
<t VD
CM
in
I IT) <
#»
CO * o
CO r~t
00
*in <f «•»1
to <D M CO
d) 60 CO 0 H (0 *4 "0 &
o
cd
o
*D CP 4J a •r4 u 4J (0 <!> k
<D
<D £
CO &
o
t T) a cO
CO -a o §
a o 4J P O Q
M <D O
o
c o 4-> c
p
o in «*
oo
S±S£L
vD #%
CM
co^co
fi) Cb P* D
m
a
CO CM IS «*
CM CM i« *
M CM oo
o HI «*
vO
<t CO A Ik
CM in A *
co in CM
U 8>
I
CM m O oo CM<t CO CM i*»-l «*r4
cq «%csi «*vo * m * ,-1 <*cm * o <*«h n H i n n v D r i m r i H
vD <f CO SO O 0^ CM <f CO <t" r-4 ^ rZ| #% *«~| * «%r-4 rl rl rl «% #ivo in * m *
CM fs. • n<f •» «*C0 1-4 r»4 VQ r-lr-IOOr^CM^DI^r-lf-lr-lr-l
CM CO CO II A A M
CM CM C\1 CM «*«***«*<
CM CM CM CO
CM «*
coco * *
CM CM
CO CM
in
CO CM #1 *
CM CM * #i
CM CM in
A <3*
0) u u
•o a to V W
•M U <D CO c cO k H
C <d o o a.
•d 3 x>
<u
<S> •O Pu <0 o w
* & o
a u o •c -M #24
H U r-1 J3 o -o

BIBLIOGRAPHY
Berry, Brian J. L. 1962. Sampling, coding, and storing flood plain data. U. S. Dept. Agric. Agric. Handbook 239: 1-27.
Blackmore, B. K. 1967. Vegetation survey of Burgner Acres, east-central Illinois. 111. State Acad. Sci. Trans, 60: 72-79.
Bliss, C. I. 1967. Statistics in biology, vol, 1. McGraw-Hill Book Go,, New York, 558 p,
Bonck, J., and W. T, Penfound, 1944. Seasonal growth of twigs of trees in the batture lands of the New Orleans area. Ecology 25: 473-475,
Bouyoucos, G, J, 1930, The indirect determination of various soil characteristics by the hydrometer method. Soil Sci. 30: 267-262.
Buell, M. P., and J. E. Cantlon. 1950. A study of two com-munities of the New Jersey pine barrens and a comparison of methods. Ecology 31: 567-568.
Carter, W. T., and M. W, Beck, 1922. Soil Survey of Denton County, Texas. U. S. Dept. of Agric. Govt. Printing Office, Washington. 58p.
Cowling, M. J. 1936. Geography of Denton County. Banks Upshaw and Co., Dallas. 132 p.
Denton County Courthouse Records. 1969. Denton County Land Ownerships. Denton, Texas.
Eggler, W. A. 1955. Radial growth in nine species of trees in southern Louisiana. Ecology 36: 130-136.
Heath, Laura. 1969. Personal interview. 5 Aug. Roanoke, Texas.
Hulbert, L. C. 1963. Gates' phenological records of 132 plants at Manhatten, Kansas. 1926-1955. Kansas Acad, Sci, Trans, 66: 82-106,
Lamb, G, N, 1915. A calendar of the leafing, flowering and seeding of the common trees for the eastern United States. Monthly Weather Rev, Supp. No. 2: 5-19.
95

96
Lau^hlin, K, 1947. Bi* trees of the midwest. Amer. Midland Nat. 37: 788-793.
Lee, Mordie B. 1945. An ecological study of the flood-plain forest along the White River system in Indiana. Butler Univ. Bot. Stud. 7: 155-175.
Lindsey, Alton A. 1962. Analysis of an original forest of the lower Wabash floodplain and upland. Indiana Acad. Sci. Proc. 72: 282-287.
Lindsey, A. A., J. D. Barton, and S. R. Miles. 1958. Field efficiencies of forest sampling methods. Ecology 39: 428,444.
Lindsey, A. A., R. 0. Petty, D. K. Sterling, and W. Van Asdall. 1961. Vegetation and environment along the Wabash and Tippecanoe Rivers. Ecol. Monogr. 31: 105-156.
Penfound, W. T. 1948. An analysis of an elm-ash floodplain community near Norman, Oklahoma, Okla. Acad. Sci, Proc, 28: 56-60,
Phillips, E. A. 1959. Methods of vegetation study. Holt, Rinehart and Winston, Inc., New York, .107 p.
Putnam, J. A., and H. Bull. 1932. The trees of the bottom-lands of the Mississippi River delta region. Southern Forest Expt. Sta., Occ. Paper 27: 1-207,
The Secretary of Agriculture, 1942, Survey report of the Trinity River watershed. Seventy-seventh Congress, Second Session. House Doc, No. 708: 66 p . .
Shelford, V. E, 1954, Some lower Mississippi valley flood plain biotic communities; their age and elevation. Ecology 35: 126-142,
Swafford, M, L. 1969, Personal interview. 5 Aug, Ponder, Texas,
Tharp, B, C, 1926. Structure of Texas vegetation east of the 98tj2 meridian, Univ. Tex. Bull. No, 2606, 97 p,
Wright, Hubert, 1969, Personal interview, 5 Aug, Roanoke, Texas.