Embed Size (px)
Citation preview

Chapter 5
The Australian Grain System

CONTENTSPage
Overview of Marketing and Production .109Exports . . . . . . . . . . . . . . . . . . . . . ......112p r o d u c t i v i t y . . . . . . . . . . . . . . . . . . . . . . . 1 1 5Q u a l i t y . . . . . . . . . . . . . . . . . . . . . . . . . . . 1 1 6Farm Sector. . . . . . . . . . . . . . . . . . . . . ..116
The Australian Wheat Board . . . . . . . . . .117Historical Background and Current
O b j e c t i v e s . . . . . . . . . . . . . . . . . . . . . . . 1 1 7Quality Control by AWB . . . . . . . . . . . .118producer Pricing and Policy .. ... ...l23E x p o r t M a r k e t i n g . . . . . . . . . . . . . . . . . . 1 2 5Industries Assistance Commission. ...126
Grain Handling in Australia. . . . . . . . . . .127Bulk Handling Authorities. . . . . . . . . . .128Transportation . . . . . . . . . . . . . . . . . . . . .129Storage Types, Capacities,
and Design . . . . . . . . . . . . . . . . . . . . . .130Infestation Policies and Practices ....136Royal Commission into Grain Storage,
Handling, and Transportation. .. ...138Variety Development and Release . . . ...139
R o l e o f A W B . . . . . . . . . . . . . . . . . . . . . . 1 3 9Procedures for Release. . . . . . . . . . ....140
Findings and Conclusions. . . . . . . . . . . . .141C h a p t e r 5 R e f e r e n c e s . . . . . . . . . . . . . . . . . 1 4 2
FiguresFigure No. Page
5-1. Wheat-Growing Regions ofAustralia. . . . . . . . . . . . . . . . . . . . . ...110
5-2. Wheat Supply and DisappearanceI
5-3
5-4
5-5
f o r A u s t r a l i a . . . . . . . . . . . . . . . . . . . . . 1 1 1Market Share of Wheat Exports byM a j o r E x p o r t e r s . . . . . . . . . . . . . . . . . 1 1 4Wheat Yield by Major Exporters inT o n s / H e c t a r e . . . . . . . . . . . . . . . . . . . . 1 1 5Australian Wheat MarketingS y s t e m . . . . . . . . . . . . . . . . . . . . . . . . . . 1 2 8
Table5-1.5-2.
5-3,
5-4,
5-5.
5-6,
5-7,
5-8,
5-9!
5-10,
5-11,
5-12.
5-13.
5-14.
5-15.5-16.5-17.
5-18.
TabIesNo. PageProduction of Wheat in Australia. .110Australia Wheat Supplies andDisappearance for 1961/62 to1 9 8 7 / 8 8 . . . . . . . . . . . . . . . . . . . . . . . . 1 1 2Domestic Uses of Wheat by Typeof Flour, Australia, 1982-87. . . . . . .112Wheat Exports as Percent ofProduction for Major Exporters ...113Total Wheat Exports by MajorExporters . . . . . . . . . . . . . . . . . . . . ..113Percentage of Wheat Receivals byClass and State Averages,A u s t r a l i a . . . . . . . . . . . . . . . . . . . . . . . 1 1 6Typical Analysis for the AustralianMi l l ing Wheat Classes . . . . . . . . . . . 117Principal Class and Grade-Determining Factors forAustralian Wheat, 1987/88. . . . . . . .120New South Wales, VarietalDiscount List , 1988/89 . . . . . . . . . . .122Guaranteed Minimum Prices forWheat in Australia, 1976/77t o 1 9 8 7 / 8 8 . . . . . . . . . . . . . . . . . . . . . 1 2 4Derivation of Final GuaranteedMinimum Prices for Wheat inAust ra l ia , 1986/87 . . . . . . . . . . . . . . . 124Authorized Handlers of Wheat inEach State . . . . . . . . . . . . . . . . . . . . .128Handling, Transport, and OtherDeduct ions , 1986/87 . . . . . . . . . . . . . 129Principal Growers’ Deductions forHandling, Storage, and Freight. ...130Total Storage Capacity . . . . . . .. ...131Country and Port Storage Profile ..131On-Farm Storage Capacity,1 9 8 4 - 8 5 . . . . . . . . . . . . . . . . . . . . . . . . 1 3 2Quality Guidelines for WheatBreeders, 1976, and Proposedfor 1987 . . . . . . . . . . . . . . . . . . . . . . . .140

Chapter 5
The Australian Grain System
Australia is the fourth largest wheat exporter,following the United States, Canada, and theEuropean Community. Australia’s market sharein recent years has ranged between 11 and 18percent. production is quite volatile comparedto other exporters. Of particular importance isthat a large proportion of Australian wheat isexported—up to 80 or 90 percent in recentyears.
The wheat produced in Australia is exclu-sively white. It is generally considered a weakerwheat, with protein in the area of 9 to 11 per-cent, although some regions are capable of pro-ducing wheat with 14 to 15 percent protein.Wheat in Australia has a reputation for beingvery dry, with harvest moisture about 9.5 per-cent, and for having relatively superior “hy-giene, ” in terms of overall cleanliness and lackof infestation. Levels of impurities are gener-
ally less than 0.4 percent, and insect problemshave been virtually eliminated despite a climatevery conducive to insect proliferation.
A number of institutions and institutionalrelationships influence the quality of wheatproduced, marketed, and exported in Austra-lia. These include the Australian Wheat Board(AWB), monopoly grain handling authoritiesin each state, variety release and control pro-cedures, and a set of receival standards appliedat the point of first sale. These interrelated in-fluences have important impacts on the qual-ity of wheat exported.1
IThis chapter draws on the OTA paper “A Comparison ofQuality Factors of the Australian and United States Grain Sys-terns, ” based on the findings of an OTA study team consistingof Dr. William W. Wilson, Mr. David M. Orr, Mr. Robert A. Zort-man, and Dr. Michael J. Phillips that traveled to Australia in1987. Dr. Wilson integrated the findings of the team into the OTApaper,
OVERVIEW OF MARKETING AND PRODUCTION
Wheat production in Australia is limited tothe south and east coasts and to Western Aus-tralia (figure 5-1). The largest wheat-producingstate is New South Wales, followed by West-ern Australia, Victoria, South Australia, andQueensland (table 5-1). Over the past 10 yearsproduction shares across the four largest wheat-producing states were: New South Wales, 35percent; Western Australia, 29 percent; Victo-ria, 16 percent; and South Australia, 11 percent.The distribution of wheat production acrossstates is relatively constant.
Production has been on a slightly increasingtrend over the past 20 years (figure 5-2). How-ever, of particular importance is that produc-tion is quite volatile through time. Substantialreductions in production were observed at leastfour times in the past 25 years, and several ofthese are directly attributable to drought con-ditions (e.g., in 1982/83). In each case these werefollowed by above-normal production in sub-sequent years.
The area planted in Australia has been in-creasing since the early 1960s. There was asharp reduction in 1970, but since then it hasincreased gradually. After peaking at 12.9 mil-lion hectares in 1983, the area planted droppedto an estimated 10.0 million hectares in 1987,This reduction has occurred because of the de-creasing relative profitability of wheat—causedby the simultaneous occurrence of lower wheatprices and a rapid escalation in Wool prices,with pasture and sheep production providingan alternative use of the land.
In recent years domestic use has accountedfor only about 15 percent of total demand, adecline from earlier years (table 5-2). The prin-cipal source of domestic demand is for humanconsumption. Wheat used for feed ranged from35 to 48 percent of domestic use in 1979/80 to1982/83, but declined to 9 percent in 1985/86(4). Bread bakers use 45 percent of the flourproduced in the domestic industry and thestarch/gluten manufacturers use 22 percent
109

110
Figure 5=1.—Wheat-Growing Regions of Australia
I I 1I I
● Each dot represents 500,000 metric tons.
SOURCE: Adapted from U.S. Department of Agriculture, Major World Crop Areas and C/imat/c Profiles, Agriculture Handbook 664, 19S7.
Table 5-1.-Production of Wheat in Australia (thousand metric tons)
New South South WesternSeason a Wales b Victoria Australia Australia Queensland Tasmania Australia
1976-77 . . . . . . . . . . . . . . . . . . 5,142 1,789 832 3,249 794 4 11,8001977-78 . . . . . . . . . . . . . . . . . . 3,946 1,497 511 2,945 569 2 9,3701978-79 . . . . . . . . . . . . . . . . . . 6,640 2,998 2,086 4,400 1,962 3 18,0901979-80 . . . . . . . . . . . . . . . . . . 6,001 3,250 2,349 3,739 846 4 16,1881980-81 . . . . . . . . . . . . . . . . . . 2,865 2,538 1,650 3,315 485 3 10,8561981-82 . . . . . . . . . . . . . . . . . . 5,910 2,467 1,695 4,803 1,482 3 16,3601982-83 . . . . . . . . . . . . . . . . . . 1,500 692 5,534 755 8,8761983-84 . . . . . . . . . . . . . . . . . . 8,981 3 , % 2,843 4,316 1,922 3 22,0161984-85 . . . . . . . . . . . . . . . . . . 5,805 2,666 2,031 6,580 1,579 4 18,6661985-86 . . . . . . . . . . . . . . . . . . 5,911 2,225 1,879 4,377 1,730 4 16,127Ten-season average . . . . . . . 5,258 2,380 1,657 4,326 1,212 3 14,835%tober 1 to Septembar 30.blncluding A.C.T.SOURCE: Australian Wheat Board, Annual Repoti WS5@3.

111
Figure 5-2. -Wheat Supply and Disappearance for Auatralia
1961/62 1964/65 1969/70 1974/75 1979/60 1964/65 1987/66
SOURCE: International Wheat Council, World Wheat Statistics (London: various issues).
(table 5-3). Australia is a major manufacturerand exporter of gluten.
Exports reached a peak of 16.1 million met-ric tons (MMT) in 1985/86, but declined to aprojected 11.0 MMT in 1987/88 as productiondropped. In the mid-1980s, 80 to 90 percent ofthe wheat produced in Australia was exported.This is very high compared with other exporters(table 5-4), again indicating the relative impor-tance of wheat exports in Australia. The de-cline in the recent year is largely due to the re-duced production.
Traditionally, Australia carried minimalstocks between crop years. Beginning in thelate 1970s, however, ending stocks began to in-crease. In the mid-1970s ending stocks wereabout 14 to 22 percent of production, but thepercentage increased to 47 percent in 1984/85,reaching 8.6 MMT. Carryover stocks droppedthereafter, to less than 4 MMT in 1987/88. Com-pared with the United States and, traditionally,Canada, ending stocks as a percent of produc-tion are lower. This suggests that despite thevariability in production, Australia is less will-ing or able to hold over stocks between years.

112
Table 5-2.—Australia Wheat Supplies and Disappearance for 1961162 to 1987188 (million metric tons)
supply Disappearance End-of-yearYear Beginning stocks Production Total Domestic Exports Total carryover
1961/62 . . . . . . . . .1962/63 . . . . . . . . .1963/64 . . . . . . . . .1964/65 . . . . . . . . .1965/66 . . . . . . . . .1966/67 . . . . . . . . .1967168 . . . . . . . . .1968/69 . . . . . . . . .1969/70 . . . . . . . . .1970/71 . . . . . . . . .1971/72 . . . . . . . . .1972173 . . . . . . . . .1973/74 . . . . . . . . .1974/75 . . . . . . . . .1975/76 . . . . . . . . .1976177 . . . . . . . . .1977178 . . . . . . . . .1978/79 . . . . . . . . .1979/80 . . . . . . . . .1980181 . . . . . . . . .1981/82 . . . . . . . . .1982/83 . . . . . . . . .
I 1983184 . . . . . . . . .1984/85 . . . . . . . . .1985/86 . . . . . . . . .1986/87 . . . . . . . . .1987/88 . . . . . . . . .
0.70.50.60.60.70.52.21.47.37.23.41.50.51.91.72.72.10.84.64.32.04.92.3
7.67.36.6
6.78.48.9
10.07.1
12.77.5
14.810.57.98.66.6
12.011.412.011.89.4
18.116.210.916.38.8
22.018.316.616,812.4
7.49.6
10.67.7
13.29.7
16.217.815.112.08.0
12.513.213.614.511.518.920.815.118.413.824.325.925.124.119.0
2.12.02.12.72.52.42.72.32.42.72.83.43.23.02.72.62.62.53.43.52.44.22.62.62.92.72.7
4.86.26.97.34.88.55.76.78.29.07.84.17.48.58.29.88.1
11.713.29.6
11.07.3
14.215.116.114.812.2
6.98.29.09.97.3
11.08.38.9
10.611.710.67.6
10.611.611.012.310.714.216.613.113.411.516.717.317.917.514.9
0.50.60.60.70.52.21.47.37.23.41.50.51.91.72.72.10.84.64.32.04.92.37.68.67.36.64.1
NOTE: 1987/88 data are preliminary.
SOURCE: fWJl~ to IS851496: World Wheat S~aMlcs (Lcmim: various years); 7S8M?7 ● nd W87M8: IWC Market Report; and U.S. Department of Agriculture, ForeignAgricultural Service, “World Grain Situation Outlook,” FG 9-88, Washington, DC.
Table 5.3.—Domestic Uses of Wheat by Type of Flour, Australia, 1982-87a (in percent)
Uses 1982 1983 1984 1985 1986 1987
Industrial:I Starch/gluten manufacture . . . . 20.1 18.6 20.6 22.7 24.0 22.3
I Other . . . . . . . . . . . . . . . . . . . . . . 1.3 0.8 0.3 0.2 0.1 0.2Human consumption:
Bread bakers. . . . . . . . . . . . . . . . 54.3 55.0 48.6 47.4 45.8 44.8Pasta cooks . . . . . . . . . . . . . . . . NA NA 9.1 8.8 7.8 7.5Biscuit . . . . . . . . . . . . . . . . . . . . . 7.0 7.3 6.7 16.4 6.7 7.1Pasta . . . . . . . . . . . . . . . . . . . . . . 3.3 3.1 3.3 3.1 3.3 3.4Packeted flour and mixes. ., ., 8.8 8.3 6.5 7.4 6.4 6.8Food . . . . . . . . . . . . . . . . . . . . . . . 4.2 5.8 5.0 4.0 5.9 7.9
Total (000 MT). . . . . . . . . . . . . . . . . 1,043 1,036 1,123 1,139 1,144 1,208Export (000 MT) . . . . . . . . . . . . . . . 102 91 63 61 61 73Grand total (MMT) , . . . . . . . . . . . . 1,145 1,126 1,187 1,200 1,205 1,281acrop year ending June w.
SOURCE: Survey conducted by Bread Research Institute, Sydney, 1987.
Exports creased U.S. exports (table 5-5). The marketshare for Australia was in the area of 10 to 12
Australia typically produces between 2.5 and percent in the late 1970s, and reached 18.5 per-4.0 percent of the world’s wheat. Argentina and cent in 1985/86 (figure 5-3). Again, it was pri-Australia are the principal exporters that re- marily the market shares of Australia and Ar-duced exports in the past 2 years, offsetting in- gentina that fell since 1986.

113
Table 5-4.—Wheat Exports as Percent of Production for Major Exporters
Year EC10a United States Canada Australia Argentina
1961/62 . . . . . . . . . . . . . . . . .1962/63 . . . . . . . . . . . . . . . . .1963/64 . . . . . . . . . . . . . . . . .1964/65 . . . . . . . . . . . . . . . . .1965/66 . . . . . . . . . . . . . . . . .1966/67 . . . . . . . . . . . . . . . . .1967/68 . . . . . . . . . . . . . . . . .1968/69 . . . . . . . . . . . . . . . . .1969/70 . . . . . . . . . . . . . . . . .1970/71 . . . . . . . . . . . . . . . . .1971/72 . . . . . . . . . . . . . . . . .1972/73 . . . . . . . . . . . . . . . . .1973/74 . . . . . . . . . . . . . . . . .1974/75 . . . . . . . . . . . . . . . . .1975/76 . . . . . . . . . . . . . . . . .1976177 . . . . . . . . . . . . . . . . .1977/78 . . . . . . . . . . . . . . . . .1978/79 . . . . . . . . . . . . . . . . .1979180 . . . . . . . . . . . . . . . . .1980/81 . . . . . . . . . . . . . . . . .1981/82 . . . . . . . . . . . . . . . . .1982183 . . . . . . . . . . . . . . . . .1983/84 . . . . . . . . . . . . . . . . .1984185 . . . . . . . . . . . . . . . . .1985/86 . . . . . . . . . . . . . . . . .1986/87 . . . . . . . . . . . . . . . . .1987188 . . . . . . . . . . . . . . . . .
13.713.515.419.419.116.915.315.820.510.313.216.413.017.525.212.414.719.023.627.429.125.427.724.724.123.422.3
58.458.874.756.565.957.050.535.042.054.639.176.667.457.955.344.454.967.264.463.663.654.659.054.937.548.176.0
126.358.682.266.690.162.356.747.151.6
131,395.1
108.170.681.072.257.080.861.992.484.374.479.982.182.775.366.291.0
72.074.577.372.467.367.175.045.277.7
114.790.262.861.975.368.782.786.464.681.588.667.482.564.382.597.393.398.0
47.732.639.056.991.135.230.743.132.617.228.539.222.828.736.153.031.649.358.345.045.865.359.768.450.650.642.0
aggregated for first Iomembersofthe European Community. It excludes spain and poffu9al.
SOURCE: lntemationai Wheat Council, Wor/d WheatStatisf/cs (London: various issues~ 1988/87 from U.S. Depatiment ofAgricul-ture, Foreign Agricultural Service, FG-9-88) Washington, DC.
Table 5-5.—Total Wheat Exports by Major Exporters (million metric tons)
Year ECa United States Canada Australia Argentina Total1963/64. . . . . . .1964/65. . . . . . .1965/66. . . . . . .1966/67. . . . . . .1967/68. . . . . . .1968/69. . . . . . .1969/70. .....1970/71 . . . . . . .1971/72. . . . . . .1972/73. . . . . . .1973/74. . . . . . .1974175. ..,...1975/76. . . . . . .1976/77. . . . . . .1977178. . . . . . .1978179. . . . . . .1979/80. . . . . . .1980/81 . . . . . . .1981/82. . . . . . .1982/83. . . . . . .1983/84. . . . . . .1984/85. . . . . . .1985186. . . . . . .1986187. . . . . . .
3.85.45.54.24.45.0
3.14.76.55.57.1
3.94.57.4
10.312.714.014.114.917.215.015.0
23.119.623.420.020.214.716.519.816.932.031.128.331.526.431.532.436.642.149.339.338.338.225.127.3
15.111.914.814.88.98.79.0
11.613.715.611.711.212.112.915.913.515.017.017.821.121.219.117.620.8
7.86.55.77.07.05.47.39.58.75.65.58.08.18.4
11.17.2
15.411.111.48.5
11.615.116.114.9
2.84 . 4
7.93.11.42.82.11.71.33.51.12.23.15.62.73.34.73.94.37.59.68.06.34.3
55.850.562.055.851.245.750.754.352.568.363.163.466.561.872.471.786.094.0
100.796.1
100.3104.187.090.1
1987188. . . . . . . 16.0 43.4 23.6 12.2 3.8 95.8aEUrOpaarlcOrnrnUfllty comprised oforlglnal membarstatesto 1987188, 9membarstates to 1980/81, lomemberstatesto De-
cember 1985, thereafter 12 members.
SOURCE: international Wheat Council, Wor/d bWreat Statistics (London: various issues~ 1988/87 from U.S. DepartmentofAgriculture, Foreign Agricultural Service, FG-9-88, Washington, DC.

114
Figure 5-3. Market Share of Wheat Exports by Major Exporters
—
—
— A u s t r a l i a- - - - - E Ca
– – – U n i t e d S t a t e s— C a n a d a-- - A r g e n t i n a
1964/65 1969/70 1974/75 1979/80 1984/85 1987/88
%x original member states in 19S7/SS, 9 member atates in 19S0/S1, 10 member States in Decembai 1985, thereafter 12 members
SOURCE: International Wheat Council, World Wheat Statistics (London: various issues).
The largest six importers of Australia are theU. S. S. R., Egypt, China, Japan, Iran, and Bang-ladesh (in approximate rank over the past threemarket years). In 1985/86 these countriesbought 70 percent of the wheat exported. TheU.S.S.R. is now the single largest importer, pur-chasing 20 percent of Australia’s wheat in 1985/86. This is a fairly recent change, with substan-tial Soviet increases in wheat purchases begin-ning in 1979/80.
Australia has the dominant position in twomarkets—Iran and Malaysia. However, in sev-
eral markets Australian market shares have de-creased substantially. In China, it dropped from48.3 percent in 1969/70 to 19.6 percent in1984/85. Decreases in market shares have alsobeen observed in Egypt, in Indonesia since1979/80, and in Malaysia since the mid-1970s.Market shares in the remaining countries donot illustrate trends, but are sporadic. Austra-lia and the United States compete in most mar-kets, with the exception of Iran. They are theprincipal competitors (defined as the largesttwo suppliers) in a number of markets, includ-ing China, Egypt, Iraq, and Indonesia.
115
Australia exports are exclusively white wheatgenerally of medium protein level. Thus, itmainly competes with U.S. white and Hard RedWinter (HRW) wheats.
Productivity
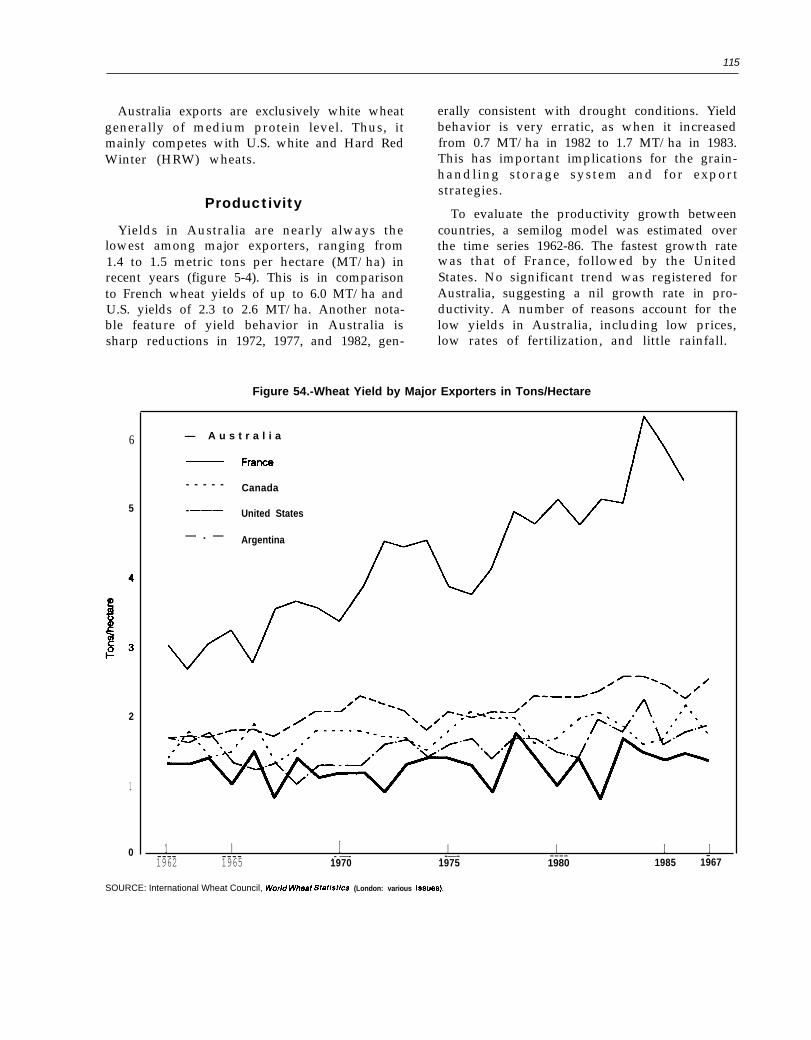
Yields in Australia are nearly always thelowest among major exporters, ranging from1.4 to 1.5 metric tons per hectare (MT/ha) inrecent years (figure 5-4). This is in comparisonto French wheat yields of up to 6.0 MT/ha andU.S. yields of 2.3 to 2.6 MT/ha. Another nota-ble feature of yield behavior in Australia issharp reductions in 1972, 1977, and 1982, gen-
erally consistent with drought conditions. Yieldbehavior is very erratic, as when it increasedfrom 0.7 MT/ha in 1982 to 1.7 MT/ha in 1983.This has important implications for the grain-handling storage system and for exportstrategies.
To evaluate the productivity growth betweencountries, a semilog model was estimated overthe time series 1962-86. The fastest growth ratewas that of France, followed by the UnitedStates. No significant trend was registered forAustralia, suggesting a nil growth rate in pro-ductivity. A number of reasons account for thelow yields in Australia, including low prices,low rates of fertilization, and little rainfall.
Figure 54.-Wheat Yield by Major Exporters in Tons/Hectare
6
5
2
1
0
— A u s t r a l i a
- - - - - Canada
-——— United States
— . — Argentina
1 I I I I I I---- ---- .- —- . -—- ---- - 1962 1965 1970 1975 1980 1985 1967
SOURCE: International Wheat Council, World Wheat StatLstlcs (London: various Issuea).

116
QualitySeven classes of wheat are produced and mar-
keted in Australia: Prime Hard (APH), Hard(AH), Australian Standard White (ASW), Soft,Durum, General Purpose (GP), and Feed. Eachto some extent is further segregated by proteinlevel or by level of nonmillable materials. TheAustralian Wheat Board publishes crop qual-ity data for wheat entering the marketing sys-tem for APH, AH, ASW, and GP.
Generally, about 68 percent of the wheat re-ceived is classed as ASW, 15 percent as AH,and the remainder split between the other twoclasses (table 5-6). In 1983/84 and 1985/86, theproportion classed as GP jumped. The mag-nitude of the increases would suggest a trendtoward GP wheat, but this conclusion wouldbe preliminary given only 2 years of data. Inboth 1983/84 and 1985/86 crop quality problemsdeveloped because of rains during harvest, re-sulting in an increase in weather damage. Alsoof interest is the apparent decrease in recentyears of both APH and AH wheat,
The principal quality difference betweenclasses is the protein level and the end-use per-formance associated with protein (e.g., waterabsorption) (table 5-7). ASW protein levels are
generally about 10 percent. Compared with U.S.Hard Red Winter and Western White (WW),Australian wheats have higher test weight andextraction rates. Protein levels for HRW aresimilar to AH, and those of white are similarto ASW. Water absorption for AH is similar toHRW, but WW is substantially less absorptivethan ASW.
Farm Sector
The farm sector in Australia, like that in mostexporting countries, is going through a transi-tion. The most important structural shift istoward fewer total farms. In addition, the num-ber smaller than 500 hectares is dropping, whilethose greater than 500 hectares are increasing.
Wheat farming in Australia involves extendedrotations with clover and sheep. The studyteam’s casual conversations with producers in-dicated they used to plant 4 years of wheat and2 years of pasture. Due to reduced wheat pricesand increased sheep/wool prices, however, theyare now following a 2-year rotation of wheatand 4 years pasture. One objective is to increasethe soil nitrogen. Fertilizer use has droppedsharply since the peak in 1981/82, both in totaland per hectare of cropland.
I
1 Table 5=6.—Percentage of Wheat Receivals by Class and State Averages, AustraliatII Australia AustraliaII prime hard Australia hard standard whitea General purposeb
Years (APH) (AH) (ASW) (GP)
1976/77 . . . . . . . . . . . . . . . . . . . . . . . . . 8.7 18.4 64.5 8.41977178 . . . . . . . . . . . . . . . . . . . . . . . . . 14.2 17.2 62.8 5.81978179 . . . . . . . . . . . . . . . . . . . . . . . . . 4.3 15.6 69.2 10.91979180 . . . . . . . . . . . . . . . . . . . . . . . . . 4.7 16.1 74.3 4.91980181 . . . . . . . . . . . . . . . . . . . . . . . . . 3.8 14.5 77.6 4.11981182 . . . . . . . . . . . . . . . . . . . . . . . . . 7.7 19.9 68.1 4.31982183 . . . . . . . . . . . . . . . . . . . . . . . . . 10.1 13.8 72.3 3.81983184 . . . . . . . . . . . . . . . . . . . . . . . . . 6.6 12.4 51.5 29.51984185 . . . . . . . . . . . . . . . . . . . . . . . . . 6.4 13.0 77.5 3.11985186 . . . . . . . . . . . . . . . . . . . . . . . . . 4.5 13.0 64.7 17.8
Averages over 10 years:Australia . . . . . . . . . . . . . . . . . . . . . . . . 7.1 15.4 68.3 9.2New South Wales . . . . . . . . . . . . . . . . 15.9 25,7 45.2 13.2Victoria . . . . . . . . . . . . . . . . . . . . . . . . . — 90.7South Australia . . . . . . . . . . . . . . . . . . — 24.1 72.7 3.2Western Australia . . . . . . . . . . . . . . . . — 5.1 87,3 7.6Queensland . . . . . . . . . . . . . . . . . . . . . 28.6 29.9 26.0 15.5Tasmania. . . . . . . . . . . . . . . . . . . . . . . . — — — —
alnclude$ minor quantities of Durum and soft wheat.bjncludes Australian feed wheat.
SOURCE: Australian Wheat Board, Annual Repofls.

117
Table 5-7.—Typical Analysis for the Australian Milling Wheat Classes
Australian Australianprime hard 14°/0 Australian hard standard white Australian soft
Wheat:Test weight (kg/hl). . . . . . . . . . . . . . . .1000 kernel weight (g). . . . . . . . . . . . .Grain hardness (P. S. I.) . . . . . . . . . . . .Protein (11 0/0 moisture). . . . . . . . . . . .Ash 0/0 . . . . . . . . . . . . . . . . . . . . . . . . . .Falling number (see) . . . . . . . . . . . . . .Flour extraction 0/0 . . . . . . . . . . . . . . .
79.435.21514.21.50
49475
80.0 80.5 78.037.2 35.2 34.814 17 2712.2 10.8 8.51.50 1.38 1.38
460 422 32574 75 74
Screenings:Total screenings 0/0 (2mm screen) . .
Flour:Protein (3.50/0 moisture) . . . . . . . . . . .Wet gluten 0/0 . . . . . . . . . . . . . . . . . . . .Diastatic activity (mg) . . . . . . . . . . . . .Ash 0/0 . . . . . . . . . . . . . . . . . . . . . . . . . .
Farinogram:Water absorption% . . . . . . . . . . . . . .
Development time (rein) . . . . . . . . . . .
Extensograph:Extensibility (cm). . . . . . . . . . . . . . . . .Maximum height (B. U.) . . . . . . . . . . . .Area (cmb) . . . . . . . . . . . . . . . . . . . . . . .
2.5
13.140.0
1920.50
65.66.0
23.2460140
2.6 3.1 3.2
11.0 9.6 7.533.7 28.8 2.2
237 195 1160.48 0.47 0.45
65.8 60.8 52.44.7 3.4 1.9
22.8 20.1 19.6365 320 190112 95 43
SOURCE: Australian Wheat Board, Australian Wheat Industry Guide
THE AUSTRALIAN
The single most important institution in theAustralian wheat industry is the AustralianWheat Board. The AWB is involved in varietycontrol, the establishment of grade standards,administration of producer price policy, anddomestic and export sales. In addition, it hasestablished procedures for resolving many po-tential problems associated with quality. Oneimportant function is setting receival standards,which essentially form the basis of the gradingsystem in Australia. Government producerprice policies (described in a subsequent sec-tion) are administered by the AWB.
Historical Background andCurrent Objectives
The AWB began in 1939 as a wartime defenseorganization. Prior to that wheat marketing wasconducted by private traders and exporters. The1939 legislation gave the AWB the authority toreceive, handle, and market Australia’s wheatcrop. It became the sole buyer and seller of Aus-tralian wheat; storage, handling, and transpor-
WHEAT BOARD
tation were provided by each state’s bulk han-dling authority (BHA).
Operation of the current AWB stems from1948 legislation. From then on the AWB wassubject to legislation with a sunset clause every5 years. AWB performance was reviewed every5 years. Legislation was under the auspices ofthe Wheat Industry Stabilization Acts of 1954,1958,1963, 1968 and 1974, and the Wheat Mar-keting Acts of 1979 and 1984. The current leg-islation expires with the 1988/89 crop market-ing year. An Industries Assistance Commission(IAC) is currently investigating the performanceof the wheat industry. A new wheat marketingact will have to be passed prior to the 1989/90marketing year. Complementary legislation ineach state is also required for the AWB to oper-ate nationally.
The current AWB has a broad objective anda number of statutory functions (AWB submis-sion to IAC). The broad objective is to “performits functions with the object of securing, de-veloping, and maintaining markets for Aus-

118
tralian wheat and maximizing the return togrowers from the marketing of Australianwheat.” This objective should be attained inconsultation with the Grains Council of Aus-tralia (an organization representing growers).Specific statutory functions of AWB are:
1. to control:—the marketing of Australian wheat within
the States and Territories,—the interstate marketing of Australian
wheat,—the overseas marketing of Australian
wheat, and—the export of wheat from Australia;
2. in appropriate circumstances, to importand market overseas wheat within Aus-tralia;
3. to encourage and promote the sale and useof Australian wheat, both within Austra-lia and overseas;
4. to cooperate, consult and enter into agree-ments with, and make recommendationsto, the Bulk Handling Authorities (BHAs)authorized to receive wheat on behalf ofthe AWB;
5. after consulting the BHAs, to determinestandards:—for the receival and classification into
grades of wheat delivered to the AWB,—for categories of wheat containing one
or more classes and grades of wheat, and–for the condition and quality of wheat
outturned to buyers by the BHAs;6. to encourage, fund, and arrange the con-
duct of research relevant to the marketingof wheat; and
7. to provide advice and recommendationsto the Commonwealth and States relatingto the marketing of wheat.
In meeting the above objective and functionsthe AWB has a number of powers. Selectedpowers of interest include:
1. to enter into tripartite barter arrangements;2. to arrange for third parties to provide fi-
nance to wheat buyers;3. to contract for or charter vessels for the
carriage of wheat by sea;4. to arrange for or establish, maintain, and
operate facilities for overseas storage andhandling of wheat;
5. subject to the approval of the Minister, bor-
6row to raise moneys; andsubject to the guidelines determined by theMinister—enter into a deal with corn -andwheat commodity futures contracts, cur-rency futures contracts, forward exchangecontracts, interest swaps and combinedcurrency and interest swaps, for hedgingpurposes.
The Board consists of a full-time chairman, apart-time Commonwealth Government repre-sentative, five wheat growers, and four special-ists (one of whom is a wheat grower). As firstindicated, the AWB has the statutory objectiveto maximize returns for growers, the Board it-self is controlled by growers, important func-tions are given to the AWB for purpose of meet-ing the objective, and a number of powers aregiven the AWB to facilitate its operation.
Operationally the AWB virtually controls allaspects of wheat marketing. With the excep-tion of domestic stockfeed sales, all wheat mustbe delivered by growers to the AWB. The AWBauthorizes a sole Bulk Handling Authority ineach state for purposes of handling and stor-age, and negotiates rail rates. The BHAs essen-tially provide the physical functions of storageand handling at country and export terminalsfor the AWB. The AWB is the sole seller ofwheat to both the processing industry (non-stockfeed), and to exporters. Most exports aremade directly by the AWB, but in some yearsup to 30 percent maybe made to private tradersfor re-export. The AWB also operates a pricepool to facilitate purchasing from producers.
Quality Control by AWB
One of the important functions of AWB isthe establishment of standards for receival andclassification of wheat into grades. Through thereceival standards, variety control, and mar-keting arrangements, AWB virtually controlsthe quality of wheat throughout the marketingsystem. This control has an influence on vari-ety development, release, and selection. Indeed,Australia has developed a reputation for wheat

119
that is dry, clean, insect-free, and uniform, andpromotion materials exploit these points.
Although receival standards can be revised,in recent years there has been minimal change.Beyond the five dominant classes of wheat al-ready described, Durum and soft wheats aregrown, but due to limited production and ex-port are not discussed further here. APH andAH are bread-making wheats segregated pri-marily by protein level—APH is 13 to 15 per-cent, and AH is 11 to 14 percent, dependingon variety. ASW is a multipurpose wheat withintermediate hardness and protein—normally9 to 11.5 percent. GP includes the same vari-eties as the other classes but is inadequate interms of test weight, weather damage, or un-tillable material. GP wheats can be used aslower-grade milling wheats. Feed wheat is a de-fault class and is only suited for feed purposes.In addition to classes, locations (by state) canbe specified to account for the fact that the sameclass produced in different states may havedifferent performance characteristics.
Receival Standards
The receival standard essentially equals whatmay be referred to as grade standards in othercountries. A slight difference is that all wheatis inspected and an official grade determinedat the point of first sale, which forms the basisof the financial transaction between the AWBand grower. The underlying rationale is thatif tight standards are applied at the first sale,most problems associated with quality are mit-igated. Having rigid untillable material stand-ards at the point of first sale, for example, givesproducers an incentive to harvest clean wheatand precludes problems further downstreamin the marketing system.
The same receival standards apply to allstates, but end-use performance of a class mayvary by point of export. Thus, the state maybereferenced as a quality descriptor in exporttransactions. The receival standards for 1987/88are shown in table 5-8. There are two catego-ries each for AH and GP, depending on pro-tein level, falling number, and level of defects.It is of interest to note, however, that the toler-
ance level for some factors are the same acrossclasses. For example, the level of millable ma-terial is the same for the top four grades. Thetolerances for moisture, insects, and contami-nants match across all classes and categories.Important grade-determinin g factors includeprotein, variety, and the extent of damage (e.g.,falling number or defects). In general, wheatwith excessive damage is classed as GP or Feed.Given the classes listed in table 5-8, wheat isfurther segregated by protein within the classAPH and AH (and there is a proposal to do sowithin ASW). These segregations include 13,14, and 15 percent protein in APH, and 12 and13 percent in AH.
A load of wheat that does not meet thesestandards cannot enter the marketing system.As a result, combined with wide price differen-tials, farmers have a tremendous incentive tominimize at least the level of untillable mate-rial. It is not uncommon for growers to havea “second” screen installed on their combinesequal to that of the receival standards (2 mil-limeters) to avoid excessive levels of nonmilla-ble materials.
The AWB has the ability and responsibility
to make changes in the standards through timeas deemed necessary by production and mar-
Photo credit: OTA Australia Study Team
Production technology used in Australia is very similarto that used in the United States. Emphasis, however,is placed on wheat being free of untillable materials.Australian farmers commonly install a second screen
on their combines to avoid excessive levelsof nonmillable materials.

120
Table 5-8.-Principal Class and Grade-Determining Factors for Australian Wheat, 1987/88
Hard General purpose
Factors (APH) No. 1 No. 2 ASW No. 1 No. 2 Feed
Test weight (kg/hi). . . . . . . . . . . . . . . .Moisture content (max. 0/0) . . . . . . . .Protein minimum (11 0/0 moisture
basis) . . . . . . . . . . . . . . . . . . . . . . .Falling number minimum . . . . . . . . . .
Untillable materiala (max 0/0):Total. . . . . . . . . . . . . . . . . . . . . . . . . .
Below screen . . . . . . . . . . . . . . . .Small foreign seeds belowscreen . . . . . . . . . . . . . . . . . . . . . .
Growth defects:Sprouted grains (max. %) . . . . . . .
Fungal strained grains (max. 0/0). .of which fuoarium . . . . . . . . . . . .
Dry green, sappy green, andfrost affected grainsaffected by diseaseor drying . . . . . . . . . . . . . . . .
Heat damage . . . . . . . . . . . . . . . . . .Ball smut . . . . . . . . . . . . . . . . . . . . .Insect damage . . . . . . . . . . . . . . . . .
Grain contaminantsSticks, stones, earth and sand . . .
live insects . . . . . . . . . . . . . . . . . .Dead insects (max. per 1/2 Iitre) . .
7412
7412
7412
7412
7112
6812
6212
12.8350
11.5300
11.0250
——
—300
——
75
75
1510
2515
5030
75
75
1 1 1 5 10 201
252
252
510
2
nil52
nil10
5
150
5
—50
5
1 1 2 1 10 20 —nil nil nil nil nil nil —
nil nil nil nil nil nil —
1 1 1 1 2 2 4
nil nil nil nil nil nil nilnil nil nil nil nil nil nil
5 5 5 5 5 5 5Dashes indicate not applicable.aMaterial~ pa~~ing through a 2.millimeter screen and/or material other than wheat kernels remaining on top Of Screen after Sieving.~Other units exist specifically for chemicals, ergots, and seed.
SOURCE: Office of Technology Assessment, 19S9.
ket conditions. Traditionally the ASW class wassold as FAQ (Fair Average Quality) in the early1970s. Since then the grading system hasevolved to reflect increased segregation. A num-ber of changes have occurred in recent years.First, the list of approved varieties changes toreflect availability and experience with mar-keting particular varieties. Indeed, a varietymay change classes between years. Severaldifferences existed in the administration of thestandards in 1984/85 and 1985/86. Discountswere then built directly into the standards forexcessive millable material and for foreign seed,ergot, and sprout damage. But, these discountsonly applied to the GP class.
Price Differentials
The receival standards facilitate segregationinto relatively homogeneous categories, andtherefore aid the AWB in its sales and market-ing programs. An important quality control toolis the use of price differentials for different
classes and categories of wheat. This is themechanism used to send market signals to pro-ducers. (A detailed description of the pricingmechanism is provided later in the chapter.)Of particular importance is the differentials be-tween classes. The interim advance payments(90 percent of the Preliminary GuaranteedPrice) for the different classes in 1987/88 are:
Percentage$/A of ASW
APH ., ... , . . . . . . . . . 137.87 113AH No. 1 . . . . . . . . . . . 126.15 104
No. 2 . . . . . . . . . . . 121.59 100ASW . . . . . . . . . . . . . . . 121.59 100GP No. 1. .., . . . . . . . . 115.07 95
No. 2. ....., . . . . . 92.93 76Feed . . . ., . . . . . . . . . . 89.03 73
These prices are received by producers at thetime of first sale. Final payments, and paymentsfor protein within APH and AH, are a resultof pooling (discussed in the following section).The point is that there are premiums for quali-ties above ASW, and fairly substantial discounts
121
for grades below ASW. This is ultimately theAWB mechanism that reflects incentives forimproving quality, or that precludes quality de-terioration.
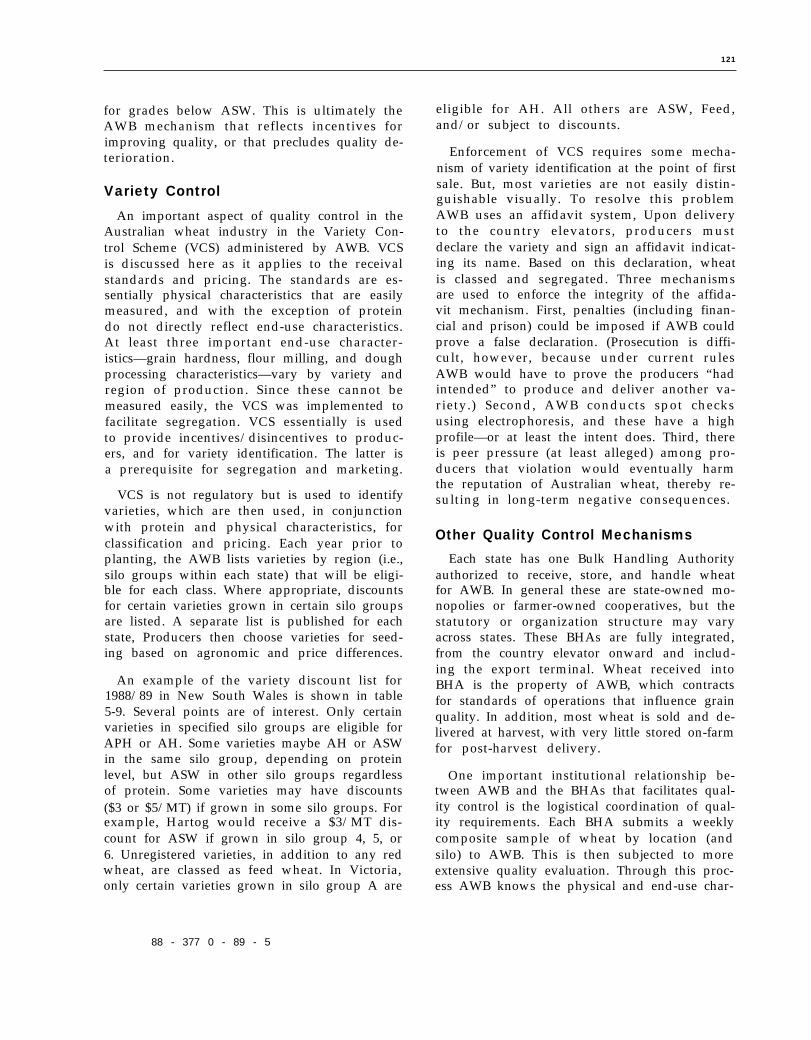
Variety Control
An important aspect of quality control in theAustralian wheat industry in the Variety Con-trol Scheme (VCS) administered by AWB. VCSis discussed here as it applies to the receivalstandards and pricing. The standards are es-sentially physical characteristics that are easilymeasured, and with the exception of proteindo not directly reflect end-use characteristics.At least three important end-use character-istics—grain hardness, flour milling, and doughprocessing characteristics—vary by variety andregion of production. Since these cannot bemeasured easily, the VCS was implemented tofacilitate segregation. VCS essentially is usedto provide incentives/disincentives to produc-ers, and for variety identification. The latter isa prerequisite for segregation and marketing.
VCS is not regulatory but is used to identifyvarieties, which are then used, in conjunctionwith protein and physical characteristics, forclassification and pricing. Each year prior toplanting, the AWB lists varieties by region (i.e.,silo groups within each state) that will be eligi-ble for each class. Where appropriate, discountsfor certain varieties grown in certain silo groupsare listed. A separate list is published for eachstate, Producers then choose varieties for seed-ing based on agronomic and price differences.
An example of the variety discount list for1988/89 in New South Wales is shown in table5-9. Several points are of interest. Only certainvarieties in specified silo groups are eligible forAPH or AH. Some varieties maybe AH or ASWin the same silo group, depending on proteinlevel, but ASW in other silo groups regardlessof protein. Some varieties may have discounts($3 or $5/MT) if grown in some silo groups. Forexample, Hartog would receive a $3/MT dis-count for ASW if grown in silo group 4, 5, or6. Unregistered varieties, in addition to any redwheat, are classed as feed wheat. In Victoria,only certain varieties grown in silo group A are
eligible for AH. All others are ASW, Feed,and/or subject to discounts.
Enforcement of VCS requires some mecha-nism of variety identification at the point of firstsale. But, most varieties are not easily distin-guishable visually. To resolve this problemAWB uses an affidavit system, Upon deliveryto the country elevators, producers mustdeclare the variety and sign an affidavit indicat-ing its name. Based on this declaration, wheatis classed and segregated. Three mechanismsare used to enforce the integrity of the affida-vit mechanism. First, penalties (including finan-cial and prison) could be imposed if AWB couldprove a false declaration. (Prosecution is diffi-cult, however, because under current rulesAWB would have to prove the producers “hadintended” to produce and deliver another va-riety.) Second, AWB conducts spot checksusing electrophoresis, and these have a highprofile—or at least the intent does. Third, thereis peer pressure (at least alleged) among pro-ducers that violation would eventually harmthe reputation of Australian wheat, thereby re-sulting in long-term negative consequences.
Other Quality Control Mechanisms
Each state has one Bulk Handling Authorityauthorized to receive, store, and handle wheatfor AWB. In general these are state-owned mo-nopolies or farmer-owned cooperatives, but thestatutory or organization structure may varyacross states. These BHAs are fully integrated,from the country elevator onward and includ-ing the export terminal. Wheat received intoBHA is the property of AWB, which contractsfor standards of operations that influence grainquality. In addition, most wheat is sold and de-livered at harvest, with very little stored on-farmfor post-harvest delivery.
One important institutional relationship be-tween AWB and the BHAs that facilitates qual-ity control is the logistical coordination of qual-ity requirements. Each BHA submits a weeklycomposite sample of wheat by location (andsilo) to AWB. This is then subjected to moreextensive quality evaluation. Through this proc-ess AWB knows the physical and end-use char-
88 - 377 0 - 89 - 5

122
Table 5.9.–New South Wales, Varietal Discount List, 1988/89
Silo groupWheat variety 1&2 3 4 5 6
Banks . . . . . . . . . . . . . . . . . . . . .Comet . . . . . . . . . . . . . . . . . . . . .Condor . . . . . . . . . . . . . . . . . . . .Corella . . . . . . . . . . . . . . . . . . . .Dial . . . . . . . . . . . . . . . . . . . . . . .Eagle . . . . . . . . . . . . . . . . . . . . . .Egret . . . . . . . . . . . . . . . . . . . . . .Gather . . . . . . . . . . . . . . . . . . . .Grebe . . . . . . . . . . . . . . . . . . . . .Harrier . . . . . . . . . . . . . . . . . . . . .Hartog . . . . . . . . . . . . . . . . . . . . .Kamilaroi . . . . . . . . . . . . . . . . . .Kite . . . . . . . . . . . . . . . . . . . . . . .Millewa . . . . . . . . . . . . . . . . . . . .Olympic . . . . . . . . . . . . . . . . . . .Osprey . . . . . . . . . . . . . . . . . . . .Quarrion . . . . . . . . . . . . . . . . . . .Rosella . . . . . . . . . . . . . . . . . . . .Skua . . . . . . . . . . . . . . . . . . . . . .Sunbird . . . . . . . . . . . . . . . . . . . .Bunco . . . . . . . . . . . . . . . . . . . . .Sunder . . . . . . . . . . . . . . . . . . . .Seneca . . . . . . . . . . . . . . . . . . . .Suneig . . . . . . . . . . . . . . . . . . . .Sunkota . . . . . . . . . . . . . . . . . . .Sunstar . . . . . . . . . . . . . . . . . . . .Takari . . . . . . . . . . . . . . . . . . . . .Vasco . . . . . . . . . . . . . . . . . . . . .Vulcan . . . . . . . . . . . . . . . . . . . .
PH/AH/ASWAH/ASWAH/ASW
$3AH/ASW
.$3$5
PH/AH/ASWG P 2
AH/ASWPH/AH/ASW
DR/FEEDAH/ASW
$3$3
AH/ASW$3$3
AH/ASWASW
PH/AH/ASWAIH/ASW
PH/AH/ASWAH/ASW
PH/AH/ASWPH/AH/ASW
AH/ASWAH/ASWAH/ASW
PH/AH/ASWAH/ASWAH/ASW
$3AH/ASW
$5PH/AH/ASW
G P 2AH/ASW
PH/AH/ASWFEED
AH/ASW$3
ASWAH/ASW
ASWASW
AH/ASWAH/ASW
PH/AH/ASWAH/ASW
PH/AH/ASWAH/ASW
PH/AH/ASWPH/AH/ASW
AH/ASWAH/ASWAH/ASW
AH/ASWASW
AH/ASWASWASW
$5AH/ASW
GP2AH/ASW
$3FEED
AH/ASWASWASW
AH/ASWASWASW
AH/ASWAH/ASWAH/ASWAH/ASWAH/ASWAH/ASWAH/ASWAH/ASWAH/ASW
ASWAH/ASW
AH/ASWASW
AH/ASWASWASW
$5
AH/ASWGP2
AH/ASW$3
FEEDAH/ASW
ASWASW
AH/ASWASWASW
AH/ASWAH/ASWAH/ASWAH/ASWAH/ASWAH/ASWAH/ASWAH/ASWAH/ASW
ASWAH/ASW
AH/ASWASW
AH/ASWASWASW
$5AH/ASW
GP2AH/ASW
$3FEED
AH/ASWASWASW
AH/ASWASWASW
AH/ASWAH/ASWAH/ASWAH/ASWAH/ASWAH/ASWAH/ASWAH/ASWAH/ASW
ASWAH/ASW
NOTE:l. Varieties marked in bold italics are those approved by the New South Wales Standing Advisory Committee on Wheat for sowing in each particular Silo Group. For
detailed information on approved varieties, including the diseaae resistance of varieties, growers should consult the Department of Agriculture.2. All deliveries are subject to normal receival standards. Varieties discounted at $3and S5pertonnewiiibe received into theASW Ciaes, ifthe sampie satisfies the
ASW standard.3. Oniy varieties iistedfor Prime Hard (PHh Australian Hard (AH)and Durum(DR)wiii be received into these classes.4. Registered varieties are those which are entered in aregister maintained by the Registrar of Cereai Cuitivars in Australia.
Enquiries regarding the status ofvarfeties not iistedaboveshouid be directed tothe Board’s State Manager or growers may consuit aMaster Variety List attheirnormal receivai point.
SOURCE: Australian Wheat Board, “Chairman’sLettec” No. 46, October 1987.
acteristics of wheat throughout the marketingsystem. In addition, at least for the principalbuyers, AWB knows the quality requirements,so it can coordinate shipping and loadingorders to meet buyer specification. At the ex-treme this could entail segregation within aclass for particular buyer needs.
Essentially only two transactions are madein the Australian wheat market—one betweenthe grower and AWB, and the other betweenAWB and the importer. In the middle is AWB,which, through coordination with the BHAs,has tremendous control over quality. As a re-suit the benefits of restrictive quality controlcan be directly captured. Thus blending be-tween grades is generally limited, as is loading
to factor limits, as would be the case if therewere multiple transactions, each of which re-quired quality evaluation subject to grade limits.
AWB irresponsive to market needs inset-ting receival standards and relative prices. Asan example, the Board is currently in the proc-ess of experimenting with further segregation.ASW received by AWB has not in the past beensegregated on the basis of protein. Conse-quently, producers received essentially an aver-age price, masking any implicit values associ-ated with protein and providing a disincentiveto maintain or increase protein levels. In addi-tion, lack of protein segregation created prob-lems in marketing. During the same time aver-age protein levels in ASW have declines, while
123
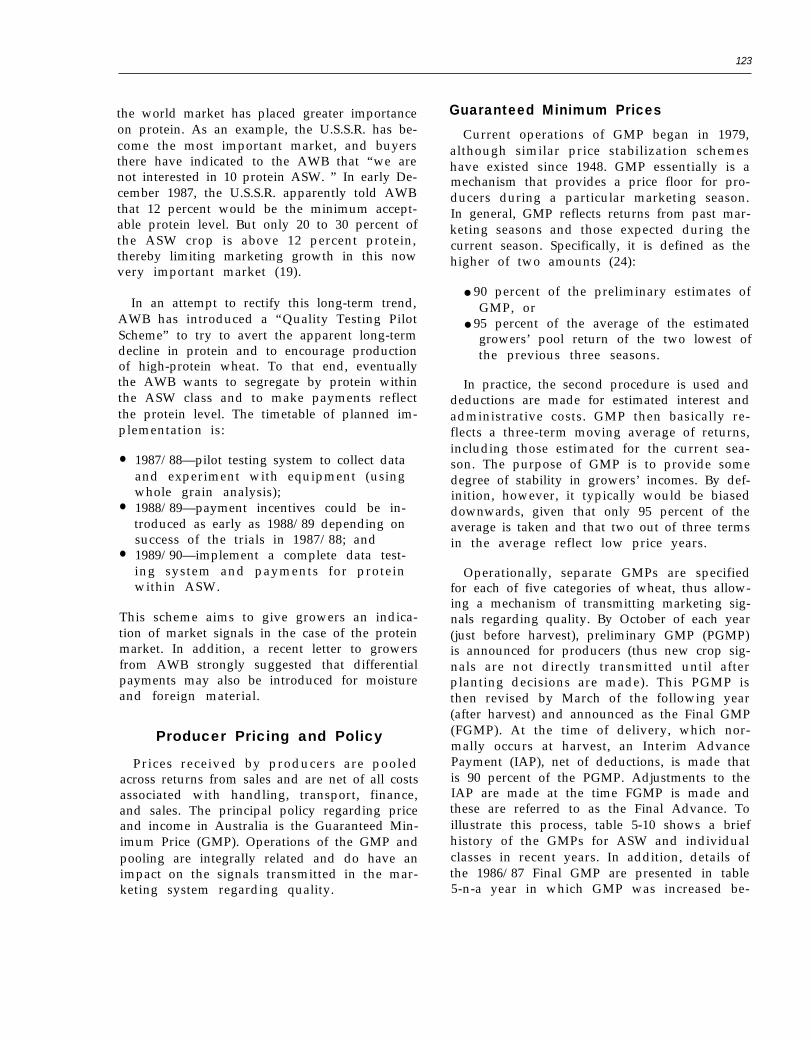
the world market has placed greater importanceon protein. As an example, the U.S.S.R. has be-come the most important market, and buyersthere have indicated to the AWB that “we arenot interested in 10 protein ASW. ” In early De-cember 1987, the U.S.S.R. apparently told AWBthat 12 percent would be the minimum accept-able protein level. But only 20 to 30 percent ofthe ASW crop is above 12 percent protein,thereby limiting marketing growth in this nowvery important market (19).
In an attempt to rectify this long-term trend,AWB has introduced a “Quality Testing PilotScheme” to try to avert the apparent long-termdecline in protein and to encourage productionof high-protein wheat. To that end, eventuallythe AWB wants to segregate by protein withinthe ASW class and to make payments reflectthe protein level. The timetable of planned im-plementation is:
●
●
●
1987/88—pilot testing system to collect dataand experiment with equipment (usingwhole grain analysis);1988/89—payment incentives could be in-troduced as early as 1988/89 depending onsuccess of the trials in 1987/88; and1989/90—implement a complete data test-ing system and payments for proteinwithin ASW.
This scheme aims to give growers an indica-tion of market signals in the case of the proteinmarket. In addition, a recent letter to growersfrom AWB strongly suggested that differentialpayments may also be introduced for moistureand foreign material.
Producer Pricing and Policy
Prices received by producers are pooledacross returns from sales and are net of all costsassociated with handling, transport, finance,and sales. The principal policy regarding priceand income in Australia is the Guaranteed Min-imum Price (GMP). Operations of the GMP andpooling are integrally related and do have animpact on the signals transmitted in the mar-keting system regarding quality.
Guaranteed Minimum Prices
Current operations of GMP began in 1979,although similar price stabilization schemeshave existed since 1948. GMP essentially is amechanism that provides a price floor for pro-ducers during a particular marketing season.In general, GMP reflects returns from past mar-keting seasons and those expected during thecurrent season. Specifically, it is defined as thehigher of two amounts (24):
● 90 percent of the preliminary estimates ofGMP, or
● 95 percent of the average of the estimatedgrowers’ pool return of the two lowest ofthe previous three seasons.
In practice, the second procedure is used anddeductions are made for estimated interest andadministrative costs. GMP then basically re-flects a three-term moving average of returns,including those estimated for the current sea-son. The purpose of GMP is to provide somedegree of stability in growers’ incomes. By def-inition, however, it typically would be biaseddownwards, given that only 95 percent of theaverage is taken and that two out of three termsin the average reflect low price years.
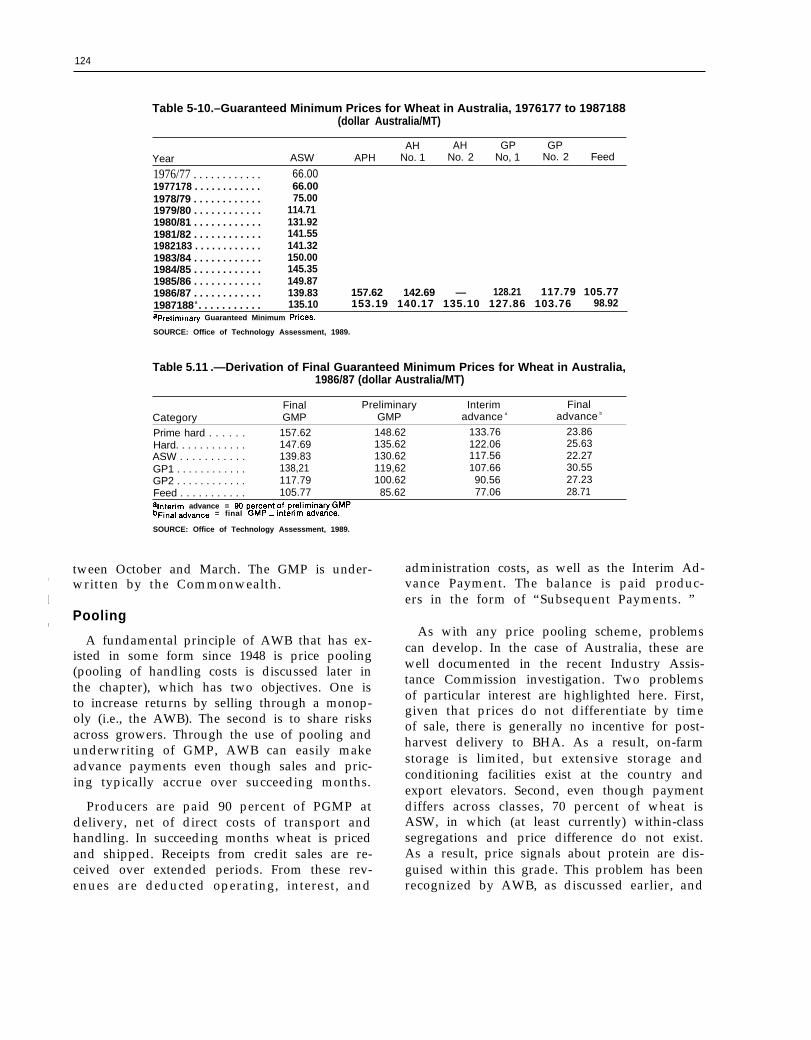
Operationally, separate GMPs are specifiedfor each of five categories of wheat, thus allow-ing a mechanism of transmitting marketing sig-nals regarding quality. By October of each year(just before harvest), preliminary GMP (PGMP)is announced for producers (thus new crop sig-nals are not directly transmitted until afterplanting decisions are made). This PGMP isthen revised by March of the following year(after harvest) and announced as the Final GMP(FGMP). At the time of delivery, which nor-mally occurs at harvest, an Interim AdvancePayment (IAP), net of deductions, is made thatis 90 percent of the PGMP. Adjustments to theIAP are made at the time FGMP is made andthese are referred to as the Final Advance. Toillustrate this process, table 5-10 shows a briefhistory of the GMPs for ASW and individualclasses in recent years. In addition, details ofthe 1986/87 Final GMP are presented in table5-n-a year in which GMP was increased be-
—
124
Table 5-10.–Guaranteed Minimum Prices for Wheat in Australia, 1976177 to 1987188(dollar Australia/MT)
AH AH GP GPYear ASW APH No. 1 No. 2 No, 1 No. 2 Feed
1976/77 . . . . . . . . . . . . 66.001977178 . . . . . . . . . . . . 66.001978/79 . . . . . . . . . . . . 75.001979/80 . . . . . . . . . . . . 114.711980/81 . . . . . . . . . . . . 131.921981/82 . . . . . . . . . . . . 141.551982183 . . . . . . . . . . . . 141.321983/84 . . . . . . . . . . . . 150.001984/85 . . . . . . . . . . . . 145.351985/86 . . . . . . . . . . . . 149.871986/87 . . . . . . . . . . . . 139.83 157.62 142.69 — 128.21 117.79 105.771987188 a . . . . . . . . . . . 135.10 153.19 140.17 135.10 127.86 103.76 98.92apreliminary Guaranteed Minimum pflces.
SOURCE: Office of Technology Assessment, 1989.
Table 5.11 .—Derivation of Final Guaranteed Minimum Prices for Wheat in Australia,1986/87 (dollar Australia/MT)
Final Preliminary Interim FinalCategory GMP GMP advance a advance b
Prime hard . . . . . . 157.62 148.62 133.76 23.86Hard. . . . . . . . . . . . 147.69 135.62 122.06 25.63ASW . . . . . . . . . . . 139.83 130.62 117.56 22.27GP1 . . . . . . . . . . . . 138,21 119,62 107.66 30.55GP2 . . . . . . . . . . . . 117.79 100.62 90.56 27.23Feed . . . . . . . . . . . 105.77 85.62 77.06 28.71alntedm advance = Wpercento fpreliminary GMp.bFinal advance = final GMp – inte~madvance,
SOURCE: Office of Technology Assessment, 1989.
tween October and March. The GMP is under-,written by the Commonwealth.
IPooling
I
A fundamental principle of AWB that has ex-isted in some form since 1948 is price pooling(pooling of handling costs is discussed later inthe chapter), which has two objectives. One isto increase returns by selling through a monop-oly (i.e., the AWB). The second is to share risksacross growers. Through the use of pooling andunderwriting of GMP, AWB can easily makeadvance payments even though sales and pric-ing typically accrue over succeeding months.
Producers are paid 90 percent of PGMP atdelivery, net of direct costs of transport andhandling. In succeeding months wheat is pricedand shipped. Receipts from credit sales are re-ceived over extended periods. From these rev-enues are deducted operating, interest, and
administration costs, as well as the Interim Ad-vance Payment. The balance is paid produc-ers in the form of “Subsequent Payments. ”
As with any price pooling scheme, problemscan develop. In the case of Australia, these arewell documented in the recent Industry Assis-tance Commission investigation. Two problemsof particular interest are highlighted here. First,given that prices do not differentiate by timeof sale, there is generally no incentive for post-harvest delivery to BHA. As a result, on-farmstorage is limited, but extensive storage andconditioning facilities exist at the country andexport elevators. Second, even though paymentdiffers across classes, 70 percent of wheat isASW, in which (at least currently) within-classsegregations and price difference do not exist.As a result, price signals about protein are dis-guised within this grade. This problem has beenrecognized by AWB, as discussed earlier, and

125
AWB is in the process of initiating proceduresto resolve it.
Producer Marketing Alternatives
Producers basically have four marketing al-ternatives: immediate delivery to BHA, de-ferred delivery to BHA, on-farm use for stock-feed, and grower-to-buyer sale to domesticstockfeed. By far the most common alternativeis immediate delivery to BHA, normally con-current with harvest. In this case extensive on-farm storage is not required and payment is re-ceived normally within 3 weeks. One constraintto this option is that of waiting time at receivalpoints, which if excessive may justify at leastminimal use of temporary on-farm or fieldstorage.
The deferred delivery option was introducedto facilitate the needs of producers who do notdeliver immediately at harvest. Under thisscheme delivery can occur between 2 and 14weeks after a prescribed date for various de-livery points. These dates may be as far forwardas May of the marketing season. Accrued in-terest on the Initial Advance Payment is paidproducers, but storage and other opportunitycosts are not. Producers may store wheat on-farm to use as feed. An alternative is to bypassAWB and the BHAs and make direct grower-to-buyer sales to the domestic stockfeed indus-try. This market is essentially a nonboard mar-ket and often is facilitated by private traders.
These four options are general but they doillustrate alternatives for growers. To put theseinto perspective, though growers may store forfeed or may sell directly for domestic feed, theseare extremely small markets. The dispositionof the crop is ultimately determined by under-lying economics, which encompasses quality,and by storage cost and availability. Given thatproducers are implicitly charged a storage costby BHA, regardless of time of delivery, deliv-ery at harvest is inevitably preferable unless spe-cial circumstances hold. As a result, relativelittle on-farm storage capacity has developedin Australia compared with other countries. Inturn, extensive storage takes place primarily
at country elevators and to a lesser extent atexport elevators.
Export Marketing
AWB is responsible for marketing all wheatfrom Australia with the exception of domesticstock feed. As noted, sales can be made directlyby AWB or by private trade. Most, however,are direct cash sales negotiated by AWB, anda number of institutional relationships (strate-gic tools) are used as part of the marketing mix.
AWB maintains an integrated sales and mar-keting strategy. For each customer this encom-passes pre-sales, sales, and post-sales service.These are promotional as well as technical, andemphasize the quality advantage of Australianwheat. A 5-year marketing plan concurrentwith AWB legislation is maintained with 40countries, which are categorized with respectto quality needs, price, etc.
Export quality specifications generally coin-cide with the class structure of the receivalstandards. As recently as the mid-1970s, how-ever, an FAQ system was used. Since then, in-creased class specificity has allowed greaterspecification with respect to quality. A s t and -ard A W B contract is used, typically with refer-ence to classes and grades. In addition, mini-mum protein levels are specified for APH, AH,and at least half the A S W contracts. The port,or state, is also specified/negotiated in manycases to account for transport cost differentials,availability of quantity and quality, and inher-ent quality differences at each port. Though ca-pable of doing so, AWB is reluctant to exporton specifications other than those typically in-cluded in the receival standards. In practice,AWB knows the quality and quantity of wheatby location. In addition, it knows the qualityneeds of specific larger buyers. Thus, coordi-nation of shipments is intended to match qual-ity needs of buyer. (Indeed, export terminalstend to receive and bin wheat according to par-ticular quality needs of specific buyers.)
Most wheat is sold and negotiated directlyby AWB. This is normally done on a free-on-board basis, but periodic cost and freight sales
126
t
,,
I
are made. Prices are negotiated either as flatfigures or as basis contracts. AWB normallyreserves certain larger important markets foritself—typically ones with Government buyingagencies or when end use is for nonfeed pur-poses. These markets include the U. S. S. R.,China, Egypt, Iran, Iraq, and those in whichlong-term agreements (LTAs) are maintained.
The alternative means of direct sales isthrough private trade. Typically up to 30 per-cent of total exports are bought by private mul-tinationals. But the combination of a reducedcrop in 1987/88, the preferred AWB markets,and LTAs means that only 10 to 12 percent wereexported this way in 1988. Thus, the privatesessentially service the residual. A large propor-tion of the residual is taken by Japan—all ofwhich is bought directly from AWB by Japa-nese trading companies for resale to the Japa-nese Food Agency. As production in Australiadecreases, and/or as the number of “preferred”customers increases, trading opportunities forprivate exporters diminish.
AWB sells directly to private traders for re-sale to a third country. The procedure is initi-ated by the trader, who negotiates with AWBon price, quality, shipping period, and market(either declared as a specific third-country mar-ket, or to exclude certain market(s)). These mar-kets potentially include all those that are notAustralia’s preferred customers. In practicethey typically include South America, privateimporters of Southeast Asia (e.g., Malaysia, In-donesia, Thailand, the Republic of Korea, SriLanka, and Yemen), New Zealand, and Fiji. Ingeneral, to the extent possible, AWB has soughtto limit exporter competition in the same third-country market on the idea that competitionwould reduce returns to sales.
industries Assistance Commission
Currently two investigations of the grain mar-keting system in Australia are in progress. Onedirectly relates to export marketing and is re-ferred to as the Industries Assistance Commis-sion (IAC) mentioned earlier. The other is theRoyal Commission into Grain Storage, Handling,and Transportation (discussed in a later sec-
tion). The IAC is a product of the sunset clausementioned earlier, in which new legislation isrequired every 5 years to continue operatingthe AWB. This process requires analysis andhearings by IAC. Selected highlights of the proc-ess, particularly as they relate to quality, arediscussed here. At this time submissions havebeen made by AWB and the Australian GrainExporters Association (AGEA), and interim rec-ommendations have been made by IAC.
While IAC encompasses many broad issuesrelated to wheat marketing and AWB, a num-ber of crucial issues are specifically related towheat quality. AWB cites a number of advan-tages of a single seller (5,7,8), including bargain-ing power associated with direct negotiation,coordination of logistics, and research. In addi-tion, specific mention is made that Australiahas a reputation for “high quality wheat andmeeting exacting quality specification. ” Fur-ther, at least implicitly, this reputation has beengarnered and preserved only because qualitycontrol procedures described in the previoussection are administered by a single seller. Ci-tation, of course, has been made to U.S. qual-ity problems, which are in part attributed toa private trading system. Allegedly, centralizedcontrol over varieties and hygiene is essentialfor long-term advantages, whereas a frag-mented approach could lead to short-term trad-ing profits.
Private traders under the auspices of AGEAhave prescribed a 5-year plan for deregulationof the wheat trading industry. The export feedwheat market and domestic milling marketswould be deregulated to start with, and in sub-sequent years the export wheat market wouldbe deregulated. AGEA did indicate that currentquality standards would be inadequate in acompetitive trading environment:
Other changes would also need to take placeto provide for the maintenance of strict qual-ity control. This could be administered by theDPI [Department of Privacy Industries] in asimilar fashion as occurs currently with othergrains. However, we believe that, for example,a more specific grading system for wheat wouldneed to be introduced as the current arrange-ments are considered to be too subjective and

1 2 7
unprecise for the maintenance of a strict qual-ity control in a deregulated export and domes-tic market (1),
Most exporters recognize the hygiene repu-tation of wheat but generally claim these aremarket phenomena and that premiums can andshould be market-determined. As the AWB hasnot specifically pursued Feed wheat marketsin longer term plans (including variety devel-opment), development of these markets has al-legedly been precluded.
The challenge put forth by IAC in their in-terim proposals was premised on the suspicionthat AWB is unlikely to be able to extractpremiums. Also, if disbanded, many functionsof AWB would merely be absorbed by wheatboards at the state level. IAC has placed lesssignificance on the prerequisite of a single sellerto control grain cleanliness and hygiene.Selected specific proposals in the interim re-port of IAC are (24):
● AWB sell wheat to private traders for ex-port to any market, other than a small num-ber of specified markets reserved for AWB;
●
●
●
the permit system for sales of Feed wheatbe extended to cover wheat for any domes-tic end use;consideration be given to the further dis-aggregation of revenues and associatedcosts currently covered by AWB’s poolingarrangements, to enable payments to grow-ers to reflect more closely actual marketreturns and costs; andthe price underwriting arrangement be ter-minated.
In addition, the IAC has sought comment onalternatives to the advance payment system, cri-teria for determining which markets should bereserved for the AWB, and all aspects of vari-ety control (24). Though these recommenda-tions may appear bold, they may be merely in-terpreted as challenges to participants (e.g.,AWB and AGEA) in the next stage of submis-sions and hearings. To put IAC into perspec-tive, these are merely proposed recommenda-tions and do not constitute policy. The next stepin the process is political. In previous IAC in-quiries, only minimal recommendations havebeen accepted in the political process.
GRAIN HANDLING IN AUSTRALIA
A number of unique attributes in the grainhandling and transport system affect the qual-ity of wheat exported. These include:
1.
2.
3.
The
limited on-farm storage, but extensive stor-age throughout the market system;state monopolies generally in both grainhandling and transportation; andownership by AWB from the point of firstsale until the point of export.
organizational operating practices of thegrain handling and transport industries are dis-cussed in this section, with particular attentionto attributes that have an impact on quality.
Though possible in theory, there is limitedtrade or transportation between states. This isprimarily due to tradition, geography, andlogistical constraints. As a result , wheatproduced in each state is generally destined tobe handled by the state BHA and marketed by
AWB. With limited on-farm storage, BHAs havebuilt extensive handling capacity to meet har-vest peak demands. Also, considerable storagecapacity has been developed throughout thehandling system compared with other export-ers. Given that, for the most part, storage is pro-vided by handlers allegedly more experiencedand knowledgeable about grain storage, wheatis less likely to deteriorate or be subjected toinfestation.
The wheat marketing system in Australia isdescribed in figure 5-5. The marketing systemis very simple and typically comprised of har-vest sales by growers to the AWB, storagewithin the handling system, and delivery byBHA on behalf of AWB to the customer. Of par-ticular importance here is the role of AWB andthe fact that it takes ownership at the point offirst sale, and retains it throughout. AWB hascontrol over quality evaluations, preservation,

128
Figure 5-5.—Australian Wheat Marketing System
SeaboardFarm Local silo Sub-terminal terminal To customer
Property ofgrower
SOURCE: Office of Technology Assessment, 1989.
and enhancement, which is exercised throughstate BHAs. This applies specifically in the caseof infestation, but also to other parameters ofquality (e.g., segregation and cleanliness). Animportant fundamental characteristic of wheatmarketing which underlies the system is thatof applying stringent quality requirements atthe point of first sale. This generally precludesproblems further in the marketing system. Andbecause there are only two financial trans-actions in the marketing system, each of whichrequires sampling and inspection, there is lim-ited incentive for blending to meet specifica-tions or limits. In contrast, the U.S. marketingsystem is characterized by a number of finan-cial transactions within the marketing system.Each requires a contract specification and gen-erally incentives exist to blend to contractlimits.
Bulk Handling Authorities (BHAs)
As mentioned earlier, in each state a mo-nopoly exists which is authorized to handlewheat on behalf of AWB. Table 5-12 shows theauthorized handlers in each state. BHAs arein general charged with the responsibility ofreceival, handling, and storage. In these activ-ities, they are responsible for sampling and in-spection and application of receival standardsat the country elevator, as well as preservingquality. An extensive storage and handlingagreement exists between each individual BHA
Table 5-12.—Authorized Handlers of Wheatin Each State
State Organization
Queensland. . . . . . . . . . . State Wheat BoardNew South Wales . . . . . Grain Handling AuthorityVictoria . . . . . . . . . . . . . . Grain Elevator BoardSouth Australia . . . . . . . South Australian Cooperative
Bulk Handling Board Ltd.Western Australia . . . . . Cooperative Bulk Handling
Ltd.SOURCE: Australian Wheat Board, Wheat Industry Grade, 1987.
and AWB. This agreement provides detail re-garding services provided and remuneration.
A responsibility of BHA is to preserve thecondition of the wheat, and if problems arisepenalties may be applied. Thus, an importantactivity and cost of BHAs is related to condi-tioning which will be discussed later.
In general each BHA operates a centralizedsystem and logistics are closely coordinatedwith AWB. The system is centralized in thesense that laboratories and quality evaluationas well as logistical planning is closely coordi-nated with AWB.
Cost of Handling and Storage Services
Costs for handling and storage of wheat areessentially determined by the cost structure ofstate BHAs. Formally, the Grain Storage andHandling Agreement is the document whichspecifies the price charged for these services.

129
On an annual basis the BHA for each state as-sesses its costs and anticipated output and de-termines a price for handling and storage. Pre-sumably, the AWB does not or cannot negotiatethese fees and strictly relies on cost migrationof the BHA (32).
The agreement allows for differential pric-ing of services to growers but in practice therehave only been a few attempts to do so (39).BHAs usually pool their costs and charge anequal rate to each grower. As a result there islimited incentive for participants to necessarilychoose the most efficient services (e. g., deliv-ery location and time). This has likely resultedin excessive handling and storage throughoutthe system. Indeed, cost pooling is a principalissue in the Royal Commission and a potentialsolution to rationalization of the system.
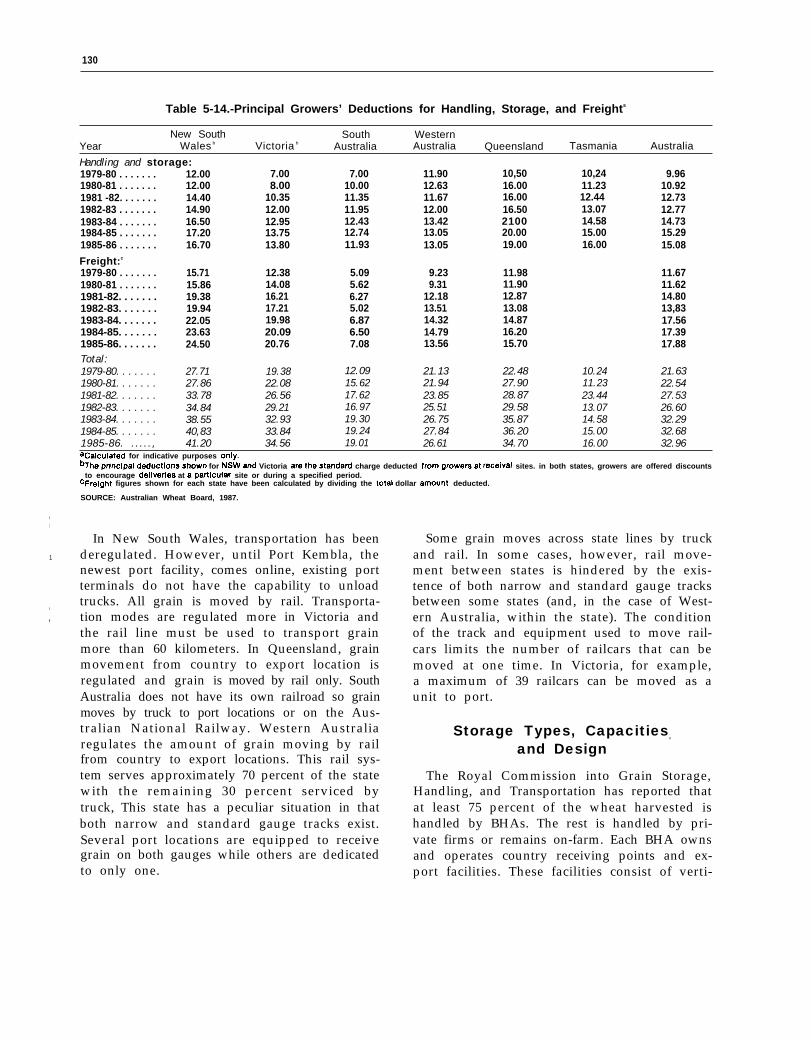
The various components of handling andstorage costs for 1986-87 are shown in table 5-13. Besides “handling and storage” there area number of other costs deducted in determinat-ing producer prices. Of interest here is the costof handling and storage which varies from$12.44/MT in South Australia to $17/MT inQueensland. (For comparison this converts to23.7 to 32.4 ¢/bushel.) The costs of handling andtransport have increased substantially throughtime (table 5-14). Between 1979/80 and 1985/86,these costs increased by 51 percent in nominalterms.
The issue of handling and storage costs arecritical to the Royal Commission. In fact at leastpart of the impetus for the Royal Commissionwas the apparent high costs of handling andtransportation in Australia. Several submis-sions to the Royal Commission (refs. 1,2,39)have attempted to make comparisons to other
exporters. Any international comparisons arequestionable for a number of reasons, particu-larly because handling and storage systemsserve different purposes indifferent countries.In the case of Australia more extensive stor-age is required and the cost of conditioning (e.g.,infestation) would exceed that of other export-ing countries. Nevertheless, submissions haveraised the issue that costs of handling and stor-age in Australia exceeds costs in other export-ing countries, and the rate of increase in han-dling and storage costs have also exceededthose of other exporters. Spriggs et al. showsthat these costs increased 11 percent in realterms in Australia in the past 10 years, comparedto a 7-percent decrease in Canada. Whetherthese cost levels are due to lack of competition,or peculiar handling tasks in Australia is cen-tral to the Royal Commission. The point is thatit appears the Australian marketing system hasbeen unresponsive to market fundamentals andinternational competition.
Transportation
Grain is delivered from the farmer by truckto country receiving points, subterminal, orcentral receiving points, and in some casesdirectly to export terminals. Each state andBHA has established a grain flow to their ex-port terminals. In some cases, grain is movedby rail from the country receiving point to asubterminal, unloaded and stored, and thenreloaded into railcars for shipment to port. Inother cases, grain is loaded into railcars at thecountry receiving point, and railcars from sev-eral locations are sent to a central point for ship-ment as a unit to port. Each state regulatestransportation modes between country and ex-port points within it.
Table 5.13.—Handling, Transport, and Other Deductions, 1986/87 (dollar/tonne)
New South Wales Victoria South Australia Western Australia QueenslandHandling and storage. . . . . . . . 16.70 14.63 12.44 13.05 17.00Freight . . . . . . . . . . . . . . . . . . . . 24.44 21.71 6.69 14.37 15.70Wharfage . . . . . . . . . . . . . . . . . . 1.76 0.88 1.05 0.50 1.40Carryover . . . . . . . . . . . . . . . . . . 0.82 0.85 1.27 1.50 0.61Two port loading. . . . . . . . . . . . 0.47 1.11 0.30Other levies . . . . . . . . . . . . . . . . 0.50 0.50 1.59 2.34 2-00
Total . . . . . . . . . . . . . . . . . . . . 44.22 39.04 24.15 32.06 36.71SOURCE: Australian Wheat Board, 1987.
- t
130
Table 5-14.-Principal Growers’ Deductions for Handling, Storage, and Freights
I
I
1
I
I
New South South WesternYear Wales b Victoria b Australia Australia Queensland Tasmania Australia
Handling and storage:1979-80 . . . . . . . 12.00 7.00 7.00 11.90 10,50 10,24 9.961980-81 . . . . . . . 12.00 8.00 10.00 12.63 16.00 11.23 10.921981 -82. . . . . . . 14.40 10.35 11.35 11.67 16.00 12.44 12.731982-83 . . . . . . . 14.90 12.00 11.95 12.00 16.50 13.07 12.771983-84 . . . . . . . 16.50 12.95 12.43 13.42 2100 14.58 14.731984-85 . . . . . . . 17.20 13.75 12.74 13.05 20.00 15.00 15.291985-86 . . . . . . . 16.70 13.80 11.93 13.05 19.00 16.00 15.08
Freight:c
1979-80 . . . . . . . 15.71 12.38 5.09 9.23 11.98 11.671980-81 . . . . . . . 15.86 14.08 5.62 9.31 11.90 11.621981-82. . . . . . . 19.38 16.21 6.27 12.18 12.87 14.801982-83. . . . . . . 19.94 17.21 5.02 13.51 13.08 13,831983-84. . . . . . . 22.05 19.98 6.87 14.32 14.87 17.561984-85. . . . . . . 23.63 20.09 6.50 14.79 16.20 17.391985-86. . . . . . . 24.50 20.76 7.08 13.56 15.70 17.88Total:1979-80. . . . . . . 27.71 19.38 12.09 21.13 22.48 10.24 21.631980-81. . . . . . . 27.86 22.08 15.62 21.94 27.90 11.23 22.541981-82. . . . . . . 33.78 26.56 17.62 23.85 28.87 23.44 27.531982-83. . . . . . . 34.84 29.21 16.97 25.51 29.58 13.07 26.601983-84. . . . . . . 38.55 32.93 19.30 26.75 35.87 14.58 32.291984-85. . . . . . . 40,83 33.84 19.24 27.84 36.20 15.00 32.681985-86. ....., 41.20 34.56 19.01 26.61 34.70 16.00 32.96acaculated for indicative purposes ordy.%heprlncipaldeductlonsshown for NSWand Victoria arethestandard charge deducted fromgrowersat receival sites. in both states, growers are offered discounts
to encourage deilverles at apartlcular site or during a specified period.cFreight figures shown for each state have been calculated by dividing the total dollar amOUnt deducted.
SOURCE: Australian Wheat Board, 1987.
In New South Wales, transportation has beenderegulated. However, until Port Kembla, thenewest port facility, comes online, existing portterminals do not have the capability to unloadtrucks. All grain is moved by rail. Transporta-tion modes are regulated more in Victoria andthe rail line must be used to transport grainmore than 60 kilometers. In Queensland, grainmovement from country to export location isregulated and grain is moved by rail only. SouthAustralia does not have its own railroad so grainmoves by truck to port locations or on the Aus-tralian National Railway. Western Australiaregulates the amount of grain moving by railfrom country to export locations. This rail sys-tem serves approximately 70 percent of the statewith the remaining 30 percent serviced bytruck, This state has a peculiar situation in thatboth narrow and standard gauge tracks exist.Several port locations are equipped to receivegrain on both gauges while others are dedicatedto only one.
Some grain moves across state lines by truckand rail. In some cases, however, rail move-ment between states is hindered by the exis-tence of both narrow and standard gauge tracksbetween some states (and, in the case of West-ern Australia, within the state). The conditionof the track and equipment used to move rail-cars limits the number of railcars that can bemoved at one time. In Victoria, for example,a maximum of 39 railcars can be moved as aunit to port.
Storage Types, Capacities,
and Design
The Royal Commission into Grain Storage,Handling, and Transportation has reported thatat least 75 percent of the wheat harvested ishandled by BHAs. The rest is handled by pri-vate firms or remains on-farm. Each BHA ownsand operates country receiving points and ex-port facilities. These facilities consist of verti-

131
?4Photo credit: OTA Australia Study Team
Railroads are primarily used to transport grain fromcountry terminals to port facilities in most states. Grainrarely moves across state lines due in part to theexistence of different gauge tracks between states.
cal concrete or metal silos, flat (horizontal)warehouses, and bunkers. Any one particularfacility may have a combination of these stor-age types. These facilities are linked togetherto one or more export facilities within the stateby road and rail.
The type of capacities of storage, vertical,horizontal, and/or bunker, varies by state (ta-bles 5-I5 and 5-16). Several states have signifi-cant amounts of storage at their port locations.Port storage ranges from approximately 7 per-cent of total storage in Queensland to 50 per-cent in South Australia. It is interesting to notethe differences in storage types. For example,in Western Australia the bulk of storage is hori-zontal while in South Australia vertical stor-age predominates. This fact produces distinctlydifferent handling and storage problems foreach BHA and results in differing strategies forsimilar problems, i.e., fumigation practices.
On-farm storage is increasing. Table 5-17 out-lines on-farm capacities as of 1984-85. Thesefigures represent wheat, barley, oats, and sor-ghum, but provide an indication of the extentof on-farm storage. On-farm storage in West-ern Australia is regulated in that only sealed,
Table 5-15.—Total Storage Capacitya (000 MT)
Country SeaboardState storages storages TotalNew South Wales. . . 5,887 309 6,196Victoria. , . . . . . . . . . . 3,027 991 4,018South Australia . . . . . 2,379 1,976 4,355Western Australia. . . 4,724 2,064 6,788Queensland . . . . . . . . 1,586 266 1,852Tasmania . . . . . . . . . . 11 20 31Australia. . . . . . . . . . . 17,614 5,626 23,240aAt Sept. 30, 1988; excludes bunker and open bulkhead stores.
SOURCE: Australian Wheat Board, 1987.
Table 5.16.–Country and Port Storage Profile (000 MT)
Vertical Horizontal Bunker Total
QueenslandPort . . . . . . . 265 – —Country. . . . 895 629 2,020
Total . . . . 1,160 629 2,020New South Wales
Port . . . . . . . 297 –Country. . . . 2,007 3,799 –5,848
Total . . . . 2,304 3,799 5,848Victoria
Port . . . . . . . 290 720 –Country, . . . 1,983 922 1,652
Total . . . . 2,273 1,642 1,652South Australia
port . . . . . . . 1,581 320 478Country. . . . 1,915 464 —
Total . . . . 3,496 784 478
Western AustraliaPort . . . . . . . 587 1,123 106Country. . . . 242 5,296 2,458
Total . . . . 829 6,419 2,564Australia (total)
port . . . . . . . 3,020 2,163 584Country. . . . 7,042 11,110 11,978
Total . ...10,062 13,273 12,562SOURCE: Office of Technology Assessment, 1989,
2653,544
3,809
29711,654
11,951
1,0104,557
5,567
2,3792,379
4,758
1,8167,996
9,812
5,76730,130
35,897
metal upright silos can be installed. These silosare usually 5 MT capacities that can be pres-sure tested prior to fumigation.
There is a move to require that all on-farmsilos be painted white. Those interviewed be-lieve this helps deflect heat build up and reducesthe incidence of infestation. In Victoria andNew South Wales, white on-farm silos are vol-untarily being installed, and OTA’s study teamwas told that regulations covering these sealedmetal silos are anticipated.

I
I
132
Table 5-17.–On-Farm Storage Capacity, 1984-85
New South Western SouthWales Victoria Queensland Australia Australia Australia
Average tonnes per farm. . . . . 292 167 251 186 81 209Number of farms . . . . . . . . . . . 15,886 8,556 5,750 8,157 7,739 46,088Estimated total on-farm
storage (ret) . . . . . . . . . . . . . . 4.64 1.43 1.44 1.52 0.63 9.66Storage capacity as a
percentage of harvestedwinter cereal and sorghumproduction . . . . . . . . . . . . . . . 59 37 46 17 17 35
Increase in storage capacitysince 1978-79 (percent). . . . . 24 56 97 39 64 40
SOURCE: P. Howard and M. Lawrence, “Australian Grain Storage Capacity,” Quality Review of the Rural Economy S(4): 330-334, AGPS, Canberra, 1986.
Use of on-farm storage is increasing. Regulations areanticipated indicating that only sealed, metal, upright,pressure-tested silos, as shown here, can be used.
The mixture of storage and handling facil-ities is linked to increased production. Initiallyseveral upright concrete silos with one leg, oneunloading pit for trucks using belts to feed theleg, and a rail and sometimes truck loadout ca-pabilities were constructed. This configurationis similar to country elevators in the UnitedStates. In Victoria and New South Wales, thesecountry receiving points were positioned alongrail lines at approximately 5-kilometer intervals.As production increased, large flat warehouseswere integrated into these facilities.
Warehouses are fed from an inbound leg toan overhead belt in the warehouse. At the ware-houses visited, several channels with augers inthe floor ran the length of the warehouse. Aer-ation ducts installed on the floors running
Photo credit: OTA Australia -Study Team
Initially concrete upright silos, similar to those builtin the United States, were constructed in the countryalong rail lines. As production increased, large flat
warehouses were integrated into the facilities.
across the width of the warehouse were alsoinstalled. Unloading takes place by the augersin the channels feeding belts that in turn feeda leg. In some locations, incline belts were in-stalled to connect the warehouse with existingstructures. Front-end loaders are used to pushthe grain pile into channels on the floor.
With further production, bunker type stor-age was introduced. These plastic-coveredbunkers provide large-volume storage at rea-sonable cost. A bunker consists of three retain-ing walls lined with a plastic sheet, filled withgrain, and then covered with plastic. They arealigned so that length runs north to south. Thisprevents one side of the cover from deteriorat-ing faster. The bunkers are filled by unloadingtrucks at the bunker opening and then auger-ing the grain into a pile. Special augering equip-ment with directional chutes is designed to aid
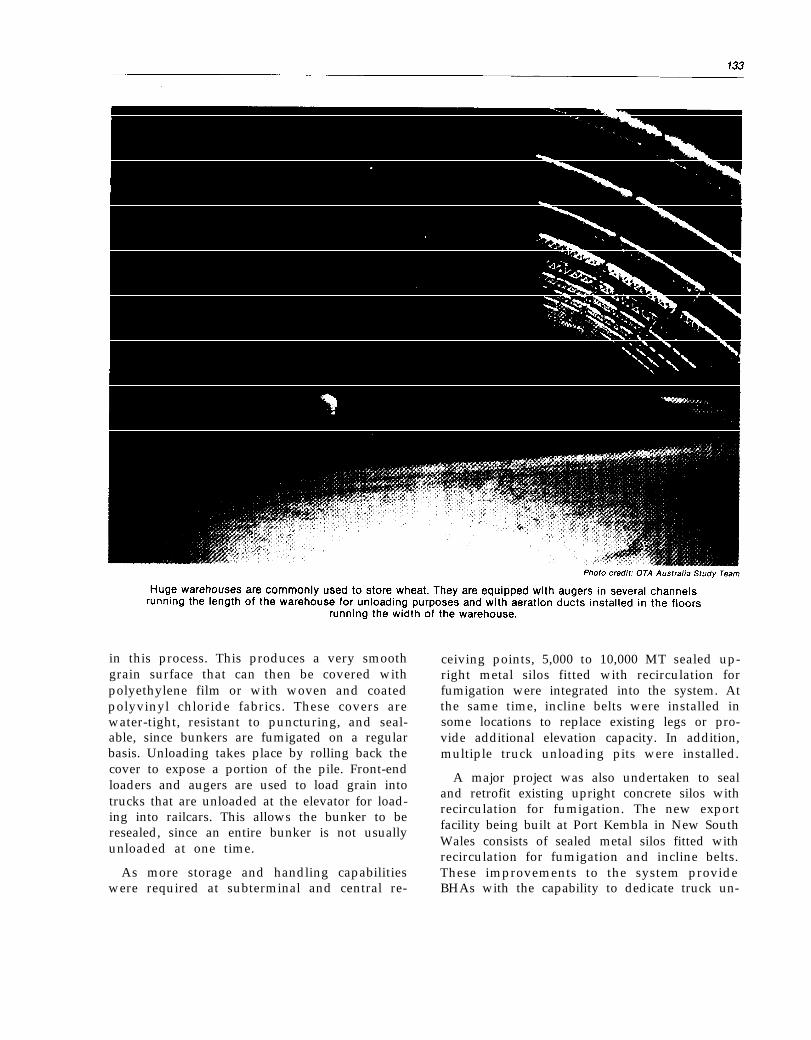
in this process. This produces a very smoothgrain surface that can then be covered withpolyethylene film or with woven and coatedpolyvinyl chloride fabrics. These covers arewater-tight, resistant to puncturing, and seal-able, since bunkers are fumigated on a regularbasis. Unloading takes place by rolling back thecover to expose a portion of the pile. Front-endloaders and augers are used to load grain intotrucks that are unloaded at the elevator for load-ing into railcars. This allows the bunker to beresealed, since an entire bunker is not usuallyunloaded at one time.
As more storage and handling capabilitieswere required at subterminal and central re-
ceiving points, 5,000 to 10,000 MT sealed up-right metal silos fitted with recirculation forfumigation were integrated into the system. Atthe same time, incline belts were installed insome locations to replace existing legs or pro-vide additional elevation capacity. In addition,multiple truck unloading pits were installed.
A major project was also undertaken to sealand retrofit existing upright concrete silos withrecirculation for fumigation. The new exportfacility being built at Port Kembla in New SouthWales consists of sealed metal silos fitted withrecirculation for fumigation and incline belts.These improvements to the system provideBHAs with the capability to dedicate truck un-
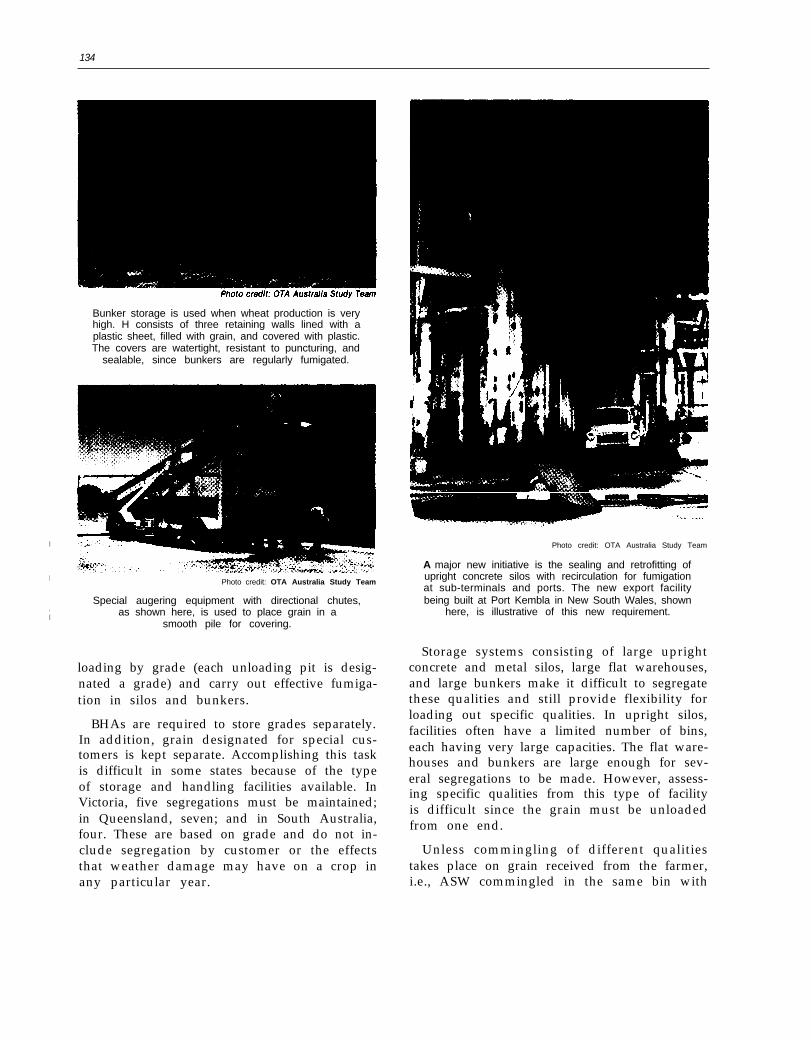
134
I
I
,I
Bunker storage is used when wheat production is veryhigh. H consists of three retaining walls lined with aplastic sheet, filled with grain, and covered with plastic.The covers are watertight, resistant to puncturing, and
sealable, since bunkers are regularly fumigated.
Photo credit: OTA Australia Study Team
Photo credit: OTA Australia Study Team
Special augering equipment with directional chutes,as shown here, is used to place grain in a
smooth pile for covering.
loading by grade (each unloading pit is desig-nated a grade) and carry out effective fumiga-tion in silos and bunkers.
BHAs are required to store grades separately.In addition, grain designated for special cus-tomers is kept separate. Accomplishing this taskis difficult in some states because of the typeof storage and handling facilities available. InVictoria, five segregations must be maintained;in Queensland, seven; and in South Australia,four. These are based on grade and do not in-clude segregation by customer or the effectsthat weather damage may have on a crop inany particular year.
A major new initiative is the sealing and retrofitting ofupright concrete silos with recirculation for fumigationat sub-terminals and ports. The new export facilitybeing built at Port Kembla in New South Wales, shown
here, is illustrative of this new requirement.
Storage systems consisting of large uprightconcrete and metal silos, large flat warehouses,and large bunkers make it difficult to segregatethese qualities and still provide flexibility forloading out specific qualities. In upright silos,facilities often have a limited number of bins,each having very large capacities. The flat ware-houses and bunkers are large enough for sev-eral segregations to be made. However, assess-ing specific qualities from this type of facilityis difficult since the grain must be unloadedfrom one end.
Unless commingling of different qualitiestakes place on grain received from the farmer,i.e., ASW commingled in the same bin with

135
General Purpose, blending of differing quali-ties at the country and subterminal level forshipment to a port is difficult. Facility designat the subterminal facilities visited is such thatgrain can be drawn from multiple bins for load-ing into railcars. However, blending grain fromflat warehouses and bunkers with grain beingdrawn from bins would be nearly impossible.In the case of the export facilities visited, Portof Sydney and Geelong, blending of differingqualities can and is done to some degree.
These port facilities contain a number ofsmaller bins and are basically of a design simi-lar to the older export facilities in the UnitedStates. The one main difference is that each fa-cility is divided in distinctly separate sectionsbased on the number of load-out spouts. Bothfacilities have four separate delivery systemsfed from four separate sets of bins. Grain fromeach delivery system is loaded into a separatehold of the vessel.
In the case of Port Sydney, there is no wayfor one delivery system to cross over to another
Photo credit: OTA Australia Study Team
Port facilities are of a similar design to older exportfacilities in the United States. One difference is thatAustralian facilities are divided into distinctly separatesections based on the number of load-out spouts.Grain from each section is loaded into a separate
hold of the vessel limiting the amount ofblending that can take place.
so blending can only take place within each sys-tem. There is a section in both facilities thatcan be used for holding out-of-condition grainand then reconditioning it for transport toanother part of the facility for shipment. At Gee-long each delivery system feeds into 18 smallshipping bins. These shipping bins are, to alimited degree, dedicated to a particular deliv-ery system but can be directed across systemsat this point.
Facility managers at both locations indicatedthat they do blend on a continuing basis. How-ever, blending is limited to a very few factorsdrawn from only a couple of bins and is notundertaken to the degree found in the UnitedStates.
Grain cleaners and grain dryers are not main-tained at BHA facilities. Grain that is out ofspecification on either factor is rejected. Com-mercial grain cleaning is available and mustbe used before acceptance by BHA. The exportelevators and subterminal visited by the studyteam all had dust removal equipment. Dust isnot reintroduced into the grain stream. It is col-lected and trucked to landfill sites. Each facil-ity had installed equipment for applying pro-testants to the grain at the time of receiving.In the facilities visited, this equipment was lo-cated on the inbound belts running from theunloading pit to the inbound leg.
Facility cleanliness is a major concern, as ismaintaining grain free of infestation. Emptystorage space is swept out and sprayed withan insecticide prior to receipt of grain. Dustaccumulation and grain spills are cleaned ona continuing basis since the Department of Pri-mary Industry (DOPI) inspects each facilityyearly and conducts random unannounced in-spections. During these spot checks DOPI re-views the physical structures as well as therecords kept by each facility on their cleaningprogram. Every month grain in storage is in-spected for the presence of infestation. In fa-cilities where bins can be turned, a portion ofthe bin is unloaded (cored), sampled for thepresence of insects, re-elevated, and placed intothe same bin. In flat warehouses and bunkers,the grain is probe sampled. If it is infested, it

I
,
,
I
136
must be fumigated. In addition to general day-to-day housekeeping, every 2 months residualinsecticide is applied to all handling equipment.
Infestation Policies and Practices
In the early 1960s Australia stood to losemajor wheat-exporting markets due to the highincidence of insect infestation in export ship-ments. In response, the Australian wheat in-dustry requested the Government to enact leg-islation that would ensure continued access tothese markets. Export grain regulations promul-gated in 1963 require that wheat, barley, oats,and sorghum be free from live infestation andotherwise fit for export.
Department of Primary Industry
The Export Control Act provides DOPI withinspection authority for a wide range of agri-cultural products. The Export Inspection Serv-ice (EIS) of DOPI is the single entity responsi-ble for checking meat, fish, dairy products, eggs,honey, grain, fresh and processed fruits andvegetables, and other horticultural and plantcrops.
EIS’s primary role is to ensure exports meetacceptable quality and hygiene standards andare correctly described in trade materials. EISinterprets the terms “free from” and “practi-cally free from” pests to mean nil. In otherwords, the tolerance for live insects and pestsis zero. The service also has zero tolerance forrodent carcasses and excreta and for particu-lar weed seeds and other pests subject toquarantine by importing countries.
The basis for EIS policies is outlined in a 1981report by the Working Party on Infestation inGrain set up by the Standing Committee onAgriculture to examine alternative pest controlstrategies and provide recommendations so thatAustralia could continue providing insect-freegrain. The Working Party concluded that Aus-tralia should not issue phytosanitary certificateson grain known to contain live insects. Thisconclusion was based on the percent of ship-ments requiring phytosanitary certification anda statistical analysis of their sampling systems.
This analysis determined that, even when noinsects are found, a high probability exists thatshipments actually contain insects. The Work-ing Party felt that in order to comply with theterms “free from” and “practically free,” asspelled out by the International Plant Protec-tion Convention, a zero tolerance had to bemaintained.
The Working Party’s goal in 1981 was to rec-ommend actions that could be taken to ensureinsect-free grain. Any recommendation was totake into account the elimination of chemicalsfor insect control due to insect resistance and

137
the problem of pesticide residue. The WorkingParty’s recommendation was to “institute a pro-gram to modify three quarters of the countrystorage system to methods of pest control whichdo not rely in any way on the use of chemicalprotestants. Until the program of modifyingstorages is complete all State Authorities shouldcontinue to develop strategies aimed at extend-ing the useful life of protestants. ” This recom-mended program was to begin in 1982 and becompleted in 10 years.
All indications are that this recommendationwas adopted. Research began at the Govern-ment research agency (Commonwealth Scien-tific and Industrial Research Organization, orCSIRO) on technologies for sealing uprightsilos, flatware houses, and bunkers so theycould be fumigated. This technology was de-veloped and implemented at facilities suitablefor sealing. Upright silos were fitted with recir-culation for methyl bromide fumigation. Metalsilos that are gas-tight, fitted with recirculation,and pressure-tested prior to fumigation havebeen constructed and installed. Modified at-mosphere technology was refined and imple-mented in some locations. Research continueson other technologies for controlling infes-tation.
Insecticide, Fumigation, and OtherInsect Control Measures
All chemicals used to treat infested grainmust be approved by the Australian Govern-ment. In addition, each state has control overthe chemicals and labeling requirements withinits boundaries. Furthermore, AWB providesguidelines on chemical usage and applicationrates. This resulted in some chemicals beingapproved for use on a national level while be-ing banned in some states. In other instances,such as phosphine, each state has approved thechemical but they may have different labelingrequirements. Fumigation in transit, either invessels or railcars, is prohibited.
The BHAs require that empty storage spacesbe cleaned and sprayed with a contact insecti-cide prior to the receipt of grain. Grain that willbe in storage more than a certain period must
The AWB provides strict instructions on chemical useand application rates to treat infested wheat. Signs,such as the one shown here, are found at every major
collection point in the system.
be treated with an insecticide upon receipt. InNew South Wales, this period is 4 weeks. In-secticides have been approved for use on spe-cific insect species in some states.
Residue Testing
Australians are quite concerned about pesti-cide residue levels in grain. These concernsstem from the continued use and dependenceon protestant-type chemicals that leave a resi-due and from public, as well as importing coun-tries’, concern regarding these residues. Greatemphasis is being placed on marketing grainthat meets importing countries specific residue

138
level requirements and the requirementsadopted by the Codex Alimentarius Commission.
Two groups continually monitor grain for thepresence of pesticide residue: the Australian Gov-ernment Analytical Laboratory of EIS and theAWB Laboratory. Samples from each exportcargo are collected by EIS and BHA inspectorsand forwarded to respective laboratories for res-idue testing. As part of BHAs’ ongoing infesta-tion inspections, samples examined at countryterminals are sent to the AWB laboratory for res-idue testing. In addition, AWB has developed arandom survey procedure for further identifyingpotential problems. Both laboratories use gaschromatography technology for testing residue,and they test for residues from all approved chem-icals as well as for ethylene dibromide and car-bon tetrachloride. The AWB Laboratory told thestudy team that approximately 17,000 residuetests were performed in 1986.
Research Areas
The Stored Grain Research Laboratoryfunded by CSIRO, AWB, and the BHAs carriesout research and development work aimed atensuring that Australian grain is free frompests. Currently two major research areas areunder investigation: flow-through phosphinefumigation and fluidized bed heating.
Flow-through phosphine fumigation is beingexamined for use in silos and warehouses thatcannot be sealed and made gas-tight. This re-search involves using aluminum phosphinegenerators to provide constant low-level phos-phine concentrations to unsealed silos or ware-houses. According to CSIRO scientists, thistechnology has been tested in several unsealedsilos and warehouses with great success. Workis continuing on this technology, with the hopeof full acceptance shortly.
Fluidized bed heating involves rapid heatingof the grain to kill insects, followed by rapidcooling to safe storage levels. The thrust of thisresearch is to develop continuous-flow in-linesystems compatible with handling rates for in-tegration into existing facilities. A pilot plantdesigned for a 100-MT/hour capacity has beenbuilt and tested with good results. CSIRO sci-
entists stated that in trials this plant was ableto handle 200 MT/hour. According to literatureprovided by CSIRO, a 50()-MT/hour unit is theminimum capacity required for successful in-tegration. The literature published in 1984 in-dicated it would cost $1 million (U. S.) to con-struct such a unit.
Royal Commission intoGrain Storage, Handling,
and Transportation
A commission was established in light of thecurrent problems in the grain handling andtransport system in Australia. The impetus be-hind the Royal Commission was concerns aboutthe efficiency and cost-effectiveness of the ex-isting grain distribution network, This is thefirst comprehensive examination of this systemin at least 50 years, despite 5-year reviews ofthe AWB by the Industries Assistance Com-mission.
Four issues are generally raised about thehandling and storage industry: the increaseduse of on-farm storage (including private stor-age), grain insect control, the cost of storage,and handling and segregation. Underlyingthese are various perceptions related to grainquality and insect control. First, AWB placessignificant emphasis on cleanliness and hy-giene standards (which refers to both cleanli-ness and the insect control program) in mar-keting, which may be jeopardized in a morecommercial environment. It is commonly be-lieved that increased use of on-farm storagewould result in more infestation and/or pesti-cide residues. Also, deregulation of the mar-keting system would add difficulties in control-ling insects.
Second, a perception exists that a monopolyhandler who does not take ownership of thegrain is needed to administer the hygiene stand-ards traditionally practiced in Australia, Pri-vate handlers would have less incentive to ex-ercise control and more incentive to blend tofactor limits. Private traders contend that bynot blending to limits, AWB is in fact “givingaway” a quality factor and not receiving a

139
premium; the AWB contends it sometimes in-tentionally ships more of a preferred qualityattribute for purposes of reputation. A third per-ception is that segregation of wheat into manycategories assists the AWB in marketing efforts.Indeed, recent efforts may result in increasedsegregation. This has the potential effect of re-quiring more extensive storage facilities, andlikely underutilized capacity throughout thesystem.
Many people maintain that current hygienestandards are appropriate in Australia. Thus,a major problem for the Royal Commission ishow to get the benefits of increased competi-tion (i.e., lower handling costs) without jeop-ardizing grain quality. Extensive modeling wasconducted to analyze the impacts of alternativecompetitive environments. Results indicated
that elimination of the state monopoly BHAsand transport as well as pooling of port servicecosts would lower the average costs of distri-bution from $58/MT to $50/MT, a 14-percentdecrease. An issue haunting the Royal Com-mission, however, is whether sufficient com-petition would exist to realize these savings.Underlying any evaluation of the alternativesis that increased competition or increased useof farm storage would result in a deteriorationin the quality of wheat. In recognition of thesesavings and potential costs of increased infesta-tion and pesticide residues, the Royal Commis-sion made several points. In general, it indi-cated that alternatives exist for administeringcurrent hygiene standards and that the costsof doing so are likely below the benefits of in-creased competition (38).
VARIETY DEVELOPMENT AND RELEASE
Wheat is planted in Australia during winter(May to July), grows during the spring, and isharvested from September and October to Jan-uary. The varieties are spring type—in the NorthAmerican sense, varieties that are plantedduring the winter. All the wheat is white, andany red varieties are classed as feed. All vari-eties have to meet certain milling criteria andthere is no active program to develop feed va-rieties. The GP and Feed grades are simply mill-ing varieties, typically with excessive weatherdamage.
The plant breeding industry is predominantlypublic. Each state’s Department of Agricultureincludes public expenditures on breeding. Pro-ducers pay a checkoff (40 cents/MT) that ismatched by the Commonwealth and distributedon a competitive basis. Cargill is one of the fewprivate breeders, or perhaps the only one, andit recently released a hybrid that has gained 30percent of the sales in New South Wales. Pro-ducers typically buy a new variety when re-leased and use it for many years before replac-ing it with another one.
Role Of AWB
AWB has two important roles to play in thedevelopment, release, and production of vari-eties. First, it administers the Variety ControlScheme, as discussed earlier, which comple-ments the activities of variety release. The VCSis used for classification and segregation at thecountry elevator level. In addition, through VCSand explicit premiums for APH and AH, or dis-counts for ASW, AWB essentially provides theincentives/disincentives for production of cer-tain varieties in particular locations (silogroups). Producers are not regulated in mar-keting varieties they produce, nor are breedersformally regulated in release. But if a varietyis not prescribed it may be subjected to discountfrom ASW, or may be classified as Feed, whichentails a substantial discount.
The second role of AWB is that it is a votingmember on the quality evaluation committeein the release process of each state. These areimportant committees that conduct quality testson advanced lines.

I,
I
I
,
I
140
To guide wheat breeders on quality, AWBprovided a broad set of guidelines in 1976.These are general guidelines regarding qual-ity but each variety must stand on its own inthe review process. The underlying rationaleis that all varieties conform to certain physicalcriteria, as reflected in the receival standards.These guidelines relate to milling criteria foreach grade and are intended to provide uni-formity with respect to end-use criteria. Theyare designed to reflect the values customers feelare appropriate for each grade, given pricedifferentials and minimum end-use require-ments. There were slight changes in the guide-lines proposed in 1987, generally reflecting in-creased uniformity (table 5-18). Further, minorrequirements were also proposed with respectto measurement standards. These guidelinesare implemented by AWB (presumably) in itsrole on the quality committee discussed in thenext section.
Procedures for Release
Release of varieties ultimately is at the dis-cretion of each state. While each has a slightlydifferent committee structure, the general pro-cedures are similar, and those for New SouthWales are described here. Conformity with thereview process is essential for endorsement ofa variety by the committee and AWB. Threecommittees are involved in the variety releasedecision in this state: the Uniform Quality Test-
ing (UQT) Committee, State Wheat Improve-ment Committee (SWIC), and Standing Advi-sory Committee on Wheat (SACW).
UQT is a quality evaluation committee. Vot-ing members include the AWB, end-users, theBread Research Institute, and State AgricultureDepartment Laboratories. In addition, observ-ers may attend meetings. Extensive analysesof end-use performance are conducted at mul-tiple laboratories on advanced lines that havebeen submitted. Tests include, but are not lim-ited to, test weight, particle size index, flouryield, grain protein, falling number, color, loafscore and volume, and measures from the fa-rinograph, extensograph, resistograph, andvisograh. Results are compared with controlvarieties that vary with respect to the criteria.
SWIC evaluates the agronomic characteris-tics of submitted varieties. Tests included areprimarily for yield and disease resistance butalso include other production-related criteria.Though not specific, a variety is expected tohave a yield greater than or equal to the vari-ety it intends to replace.
The Standing Advisory Committee on Wheatreceives data and recommendations from UQTand SWIC committees. Members include rep-resentatives from the state farm associations,the registered seed growers association, and,in the case of New South Wales, the Hard andSoft Wheat Growers Association and the Prime
Table 5-18.–Quality Guidelines for Wheat Breeders, 1976, and Proposed for 1987
Extensogram
Protein a Hardness Height Extensibility Viscographpercent PSl BU CM BU
1976 Guidelines:soft . . . . . . . . . . . . . . . . . . . . . . .
ASW . . . . . . . . . . . . . . . . . . . .AH . . . . . . . . . . . . . . . . . . . . . .APH . . . . . . . . . . . . . . . . . . . . .
1967 Guidelines:soft . . . . . . . . . . . . . . . . . . . . .ASW
Soft grained. . . . . . . . . . . .Hard grained . . . . . . . . . . .
AH . . . . . . . . . . . . . . . . . . . . . .APH . . . . . . . . . . . . . . . . . . . . .
less than 109.5-12.011.5-13.0+12.5+
Below 9.5
9.5-11.010.0-11.511.5-13.0+13.0+
Over 2216-2410-1710-14
Over 22
20-2416-2014-1714-16
200 * 50350 * 50450 * 50550 * 50
200 * 50
350 * 50350 * 50450 * 50550 * 50
Over 17Over 18Over 20Over 22
Over 17
Over 18Over 19Over 20Over 22
———
480+
450+450+450+450+
a1987 proposal to measure protein on Ii-percent moisture basis.
SOURCE: Australian Wheat Board, 1967.

141
wheat Association. Formally, this committeeevaluates the information and makes a recom-mendation to the State Minister of Agriculture,who in turn makes the off icial decision onwhether a variety is released. In evaluating theinformation SACW is much more judgmentalthan the other two committees. The criteria arenot completely rigid and are somewhat respon-sive to the perceived needs of the market. Inrecent years, for example, more emphasis hasbeen placed on quality, particularly the proteinlevel, in response to apparently declining levelsof protein.
Given the recommendations of SACW, theMinister of Agriculture in each state formallyreleases a variety. In particular, the Ministerprescribes a variety that, if produced in a speci-fied silo group, would not be subject to varietaldiscounts by AWB. If produced in nonspecifiedsilo groups, it would be subjected to possiblediscounts. Thus, the State Minister of Agricul-ture can override the intents of varietal dis-counts applied by AWB.
FINDINGS AND CONCLUSIONS
The single most important institution affect- Wheat in Australia is noted for its high stand-ing the marketing system and quality of wheat ard of “hygiene, “ i.e., cleanliness and lack ofin Australia is the Australian Wheat Board. It infestations. This degree of cleanliness is as-is the sole buyer of wheat, with exception of sured by the combined effects of the receivalthat used for stock feed. AWB is also virtually standards, the substantial price differentials,the sole seller to both domestic milling and ex- and harvesting technology that has adapted toport markets. the former.
A number of mechanisms used or adminis-tered by AWB influence the quality of wheatproduced in Australia and exported. First is thedevelopment and adminis trat ion of receivalstandards. Wheat must meet these standardsat the point of first receival; if not, it is precludedand destined to the feed market. An importantunderlying concept of the marketing system isthat applying stringent standards at the pointof first sale generally mitigates problems later.
Second, price differentials for class andgrade, and for variety in some cases, are estab-lished by AWB. This is the key mechanism usedby AWB to provide incentives to improve ormaintain wheat quality.
The Variety Control Scheme is administeredto facilitate segregation by classes, and to pro-vide incentives via price differentials. VCS isnot regulatory but is used to identify varietyat the point of delivery, which then is used forsegregation into classes. Administration of VCSdepends on producers declaring variety at de-livery.
Due to pricing policies and tradition, Aus-tralia has relatively little on-farm storage. How-ever, extensive storage and handling capacityexists within the marketing system. Blendingis very limited at the country elevator due tolack of incentive and possibly to infrastructure.Export elevators do blend, but the process islimited to a few factors.
In sum, the quality of wheat exported fromAustralia is the result of a multi-faceted ap-proach to marketing and regulations. The im-portant influences include:
1. controlled variety development and release;2. variety identification in marketing;3. stringent receival standards administered
at first point of sale;4. administered price differentials, to provide
quality incentives;5. an institutional relationship that allows
ownership of wheat to be divorced fromhandl ing;
6. no tolerance for insects throughout the sys-tem; and
7. limited on-farm storage.

142
CHAPTER 5 REFERENCES
I
1
I
!
,
I
1. Australian Grain Exporters Associations, Sub-mission to the Royal Commission on Grain Han-dling and Transport, Submission No. 184, July1987.
2. Australian Grain Exporters Associations, Sub-mission to the Industries Assistance Commis-sion into the Wheat Industry, November 1987.
3. Australian Wheat Board, Australian Wheat In-dustry Guide.
4. Australian Wheat Board, Annual Report (vari-ous issues).
5. Australian Wheat Board, “Criteria for the Re-lease of Wheat Varieties,” July 1987.
6. Australian Wheat Board “Chairmen’s Letter”(various issues).
7. Australian Wheat Board, Submission to Indus-tries Assistance Commission Inquiry into theWheat Industry, July 1987.
8. Australian Wheat Board, Response to IndustriesAssistance Commission Draft Report on theWheat Industry, November 1987.
9. Bureau of Agricultural Economics, InstitutionalArguments in the Wheat Distribution System,occasional Paper 99, Canberra, 1987.
10. Bureau of Agricultural Economics, Situationand Outlook 1985: Farm Inputs.
11. Bureau of Agricultural Economics, QuarterlyReview of the Rural Economy, December 1987.
12. Bureau of Agricultural Economics, Wheat Mar-keting and Assistance (submission to the IAC),August 1987.
13. Bureau of Agricultural Economics, Farm Sur-vey Reports: Financial Performance of Austra-lia Farms, March 1987.
14. Commonwealth of Australia, Grain, Plants, andPlant Products Order, 1984.
15. CSIRO, Division of Entomology, Flow-throughPhosphine Fumigation—A New Technique,Stored Grain Protestant Conference, 1983.
16. CSIRO, Division of Entomology, Large ScaleEvaluation of Fluid-Bed Heating as a Means ofDisinfesting Grain, Proc. 3rd Working Confer-ence Stored-Products, Entomological, Manhat-tan, 1983.
17. Department of Agriculture New South Wales,Implications of Pest Control for Grain Handling,Report to the New South Wales Grain HandlingEnquiry, 1981.
18. Department of Primary Industry, Field CropsInspection Manual and Handbook, AustralianGovernment Publishing Service, 1986.
19. Financial Review, Dec. 7, 1987,20. Howard, P., and Lawrence, M., “Australian
21.
22.
23.
Grain Storage Capacity,” Quarterly Review ofthe Rural Economy, 8(4): 330-334, AGPS, Can-berra, 1986.Grain Handling Authority of NSW, Bulk Wheat(various issues).Grain Handling Authority of NSW, “An Histori-cal View of NSW Variety Identification,” BulkWheat, vol. 19, 1985, pp. 64-66.Grain Handling Authority of NSW, “How Vari-ety Decisions Are Made,” Bulk Wheat, vol. 21,1987, p. 17.
24. Industries Assistance Commission, Draft Reporton the Wheat Industry, October 1987.
25. International Wheat Council, “World Wheat
26.
27.
28,
29.
30.
Statistics,” various issues.Johnston, J., “On-Farm Storage–Its Role in theEvolving Grain Handling, September to the Year2000,” Division of Marketing and EconomicServices, NSW Dept. of Agr., P.O. Box K220,Haymarket 2000, April 1986.Knoll, R. F., “Wheat Varieties for the 1988 Sea-son,” Bulk Wheat, vol. 21, 1987, p. 78.NSW Farmers, Response to Industries Assis-tance Commission’s Draft Report on the WheatIndustry, November 1987.NSW Farmers, Submission to the IndustriesAssistance Commission on the Wheat Industry,July 1987.Report of SCA Working Party on Infestation inGrain, 1981.
31. Royal Commission into Grain Storage, Han-dling, and Transportation, “Overview of Exist-ing System, ” Working Paper No. 1.
32. Royal Commission into Grain Storage, Han-dling, and Transportation, “Institutional Argu-ments,” Working Paper No. 2.
33. Royal Commission into Grain Storage, Han-dling, and Transportation, “Cost Structures,”Working Paper No. 3.
34. Royal Commission into Grain Storage, Han-dling, and Transportation, “Competition andContestability,” Working Paper No. 4.
35. Royal Commission into Grain Storage, Han-dling, and Transportation, “Pricing Practices,”Working Paper No. 5.
36. Royal Commission into Grain Storage, Han-
37
38
dling, and Transportation, “Evaluation-of Alter-native Systems, ” Working Paper No. 7.Royal Commission into Grain Storage, Han-dling, and Transportation, “Issues for the RoyalCommission Inquiry.”Royal Commission into Grain Storage, Han-dling, and Transportation, “Preliminary Find-

143
ings and Options,” Discussion Paper No. 5, Can- Bureau of Agricultural Economics, Australianberra, 1987. Government Publishing Service, Canberra, 1987,
39. Spriggs, J., Geldard, J., Gerardi, W., and Tread- 40. Stored Grain Research Laboratory, CSIRO, R&Dwell, R., Institutional Arguments in the Wheat Support for the Grain Export Industry, undated.Distribution System, Occasional Paper No. 99,