Embed Size (px)
Citation preview

The Aussie Economy: Good Timesor Stormy Waters?
BTalk’s Phil Dobbie and Steve Keen, Associate Professor, University of Western Sydney

Steve KeenUni Western Sydney
Aussie Economy: Good Times or Stormy Waters?
• Associate Professor – University of Western Sydney• Author of Debunking Economics• Maintains debt-deflation blog
www.debtdeflation.com/blogs

Aren’t good times here again?

Aren’t good times here again?

Growing debt necessary in a growing economy…
“If income is to grow, the financial markets … must generate an aggregate demand that, aside from brief intervals, is ever rising.
For real aggregate demand to be increasing, … it is necessary that current spending plans, summed over all sectors, be greater than
current received incomeand that some market technique exist by which aggregate spending
in excess of aggregate anticipated income can be financed.It follows that over a period during which economic growth takes
place, at least some sectors finance a part of their spending by emitting debt or selling assets.” (Minsky 1982, p. 6; emphasis added)
But not when it finances speculation rather than investment…

1870 1880 1890 1900 1910 1920 1930 1940 1950 1960 1970 1980 1990 2000 2010 20200
25
50
75
100
125
150
175
200
225
250
275
300
USAAustralia
Private debt to GDP ratios
Flow of Funds Table L1+Census Data; RBA Table D02
Yea
rs (
perc
ent o
f G
DP
)
68
175
This is the biggest debt bubble in history

20 21 22 23 24 25 26 27 28 29 30 31 32 33 34 35 36 37 38 39 4050000
60000
70000
80000
90000
100000
110000
120000
130000
140000
150000
160000
170000
180000
DebtGDP
US Private Debt and GDP 1920-1940
Year
$ m
illi
on
Debt and GDP
Rising debt winds the economy upFalling debt winds it down…Spending = sum of GDP plus change in debtIllustration: 1920-1940

20 21 22 23 24 25 26 27 28 29 30 31 32 33 34 35 36 37 38 39 4040000
50000
60000
70000
80000
90000
100000
110000
120000
GDP aloneGDP+Change in Debt
US Aggregate Demand GDP 1920-1940
Year
$ m
illio
nAggregate Demand

20 22 24 26 28 30 32 34 36 38 4010
987654321012345678 0
3432302826242220181614121086420
Change in Debt (lagged one year)Unemployment
Correlation of change in private debt and unemployment
Year
Per
cent
cha
nge
p.a.
Per
cent
une
mpl
oyed
(in
vert
ed)
R2=-0.938
Aggregate Demand and unemployment 1920-1940

10 9 8 7 6 5 4 3 2 1 0 1 2 3 4 5 6 7 8 9 10 115 10
6
1 107
1.5 107
2 107
2.5 107
3 107
3.5 107
4 107
4.5 107
5 107
DebtGDP
US Private Debt and GDP 1990-2010
Years since 2000
$ m
illio
n
Debt and GDP
Same exercise for 1990-2010:

10 9 8 7 6 5 4 3 2 1 0 1 2 3 4 5 6 7 8 9 10 114 10
6
6 106
8 106
1 107
1.2 107
1.4 107
1.6 107
1.8 107
2 107
GDP aloneGDP+Change in Debt
US Aggregate Demand GDP 1990-2010
Years since 2000
$ m
illio
n
Aggregate Demand

10 9 8 7 6 5 4 3 2 1 0 1 2 3 4 5 6 7 8 9 10 11109876543210123456789
101112131415 0
1211.51110.5109.598.587.576.565.554.543.532.521.510.50
Private onlyInc. GovUnemployment
Correlation of change in private debt and unemployment
Years since 2000
Per
cent ch
ange
p.a
.
Per
cent unem
plo
yed
(in
ver
ted)
R2=-0.955
Aggregate Demand and unemployment 1990-2010

Debt-financed fraction of aggregate demand is... Debt
GDP Debt
0 1 2 3 4 5 6 7 8 9 10 11 12 1325
20
15
10
5
0
5
10
15
20
25
Great Depressionincluding GovernmentGreat Recessionincluding Government
Debt-financed demand percent of aggregate demand
Years since peak rate of growth of debt (mid-1928 & Dec. 2007 resp.)
Per
cen
t
0
Scale of government responseScale of downturn 2.25 years in
1930s
1930s2000s
2000s

Australia is doing better because of less deleveraging
0 0.5 1 1.5 2 2.5 325
20
15
10
5
0
5
10
15
20
25
30
35
40
USAIncluding GovernmentAustraliaIncluding Government
US vs Australia Debt-financed aggregate demand
Years since peak rate of growth of debt (Dec. 2007 & Feb 2008 resp.)
Per
cent
0
USA
Aus
P r i v a t e S e c t o r
Aus
G o v e r n m e n t
USA

10 9 8 7 6 5 4 3 2 1 0 1 2 3 4 5 6 7 8 9 10 11543210123456789
1011121314151617181920 0
1211.51110.5109.598.587.576.565.554.543.532.521.510.50
Private onlyInc. GovUnemployment
Australia Correlation Debt-financed Demand & unemployment
Years since 2000
Per
cent
cha
nge
p.a.
Per
cent
une
mpl
oyed
(in
vert
ed)
0
Debt financed demand & unemployment, Australia
Less deleveraging here but same change in debt—unemployment correlation

How deleveraging works
• It’s a second order thing…• If demand = GDP + change in debt• The growth in demand is
– Change in GDP + change in change in debt– Not just debt, or the rate of growth of debt– But how rapidly that rate of growth is changing…

How deleveraging works
• A numerical example– In “dream world” where GDP growth unaffected…
Variable/Year Year 1 Year 2 Year 3 Year 4 Year 5 Year 6
Nominal GDP 1,000 1,100 1,210 1,331 1,464 1,611
Growth rate of Nominal GDP 10% 10% 10% 10% 10% 10%
Real growth rate 5% 5% 5% 5% 5% 5%
Inflation Rate 5% 5% 5% 5% 5% 5%
Private Debt 1,250 1,500 1,650 1,650 1,485 1,411
Growth rate of Private Debt 20% 10% 0% -10% -5% 0%
Change in Private Debt 250 150 0 -165 -74 0
Nominal Aggregate demand (GDP + Change in Debt) 1,250 1,250 1,210 1,166 1,390 1,611
Change in Aggregate Demand 0 -40 -44 224 221
Change in Aggregate Demand Percent 0% -3% -4% 16% 14%

Variable\Year 1929 1930 1931 1932 1933 1934 1935
GDP 103,600 91,200 76,500 58,700 56,400 66,000 73,300
Change in Nominal GDP % 6.0% -12.0% -16.1% -23.3% -3.9% 17.0% 11.1%
Inflation Rate % -1.2% 0.0% -7.0% -10.1% -9.8% 2.3% 3.0%
Private Debt 161,800 161,100 148,400 137,100 127,900 125,300 124,500
Debt Growth Rate % 3.7% -0.4% -7.9% -7.6% -6.7% -2.0% -0.6%
Change in Debt 5,700 -700 -12,700 -11,300 -9,200 -2,600 -800
GDP + Change in Private Debt 109,300 90,500 63,800 47,400 47,200 63,400 72,500
Change in Private Aggregate Demand % 0.0% -17.2% -29.5% -25.7% -0.4% 34.3% 14.4%
Government Debt 30,100 31,200 34,500 37,900 40,600 46,300 50,500
Change in Government Debt -100 1,100 3,300 3,400 2,700 5,700 4,200
GDP + Change in Total Debt 109,200 91,600 67,100 50,800 49,900 69,100 76,700
Change in Total Aggregate Demand % 0 -17,600 -24,500 -16,300 -900 19,200 7,600
Change in Total Aggregate Demand % 0.0% -16.1% -26.7% -24.3% -1.8% 38.5% 11.0%
USA then…

Variable\Year 2006 2007 2008 2009 2010
GDP 12,915,600 13,611,500 14,291,300 14,191,200 14,277,300
Change in Nominal GDP % 6.3% 5.4% 5.0% -0.7% 0.6%
Change in Real GDP % 2.7% 2.4% 2.3% -2.8% 0.2%
Inflation Rate % 4.0% 2.1% 4.3% 0.0% 2.6%
Private Debt 33,196,817 36,553,385 40,596,586 42,045,481 40,185,976
Debt Growth Rate % 9.6% 10.1% 11.1% 3.6% -4.4%
Change in Debt 2,914,187 3,356,568 4,043,201 1,448,895 -1,859,505
GDP + Change in Private Debt 15,829,787 16,968,068 18,334,501 15,640,095 12,417,795
Change in Private Aggregate Demand % 0.0% 7.2% 8.1% -14.7% -20.6%
Government Debt 6,556,391 6,893,467 7,321,592 8,615,051 10,167,585
Change in Government Debt % 478,851 337,076 428,125 1,293,459 1,552,534
GDP + Change in Total Debt 16,308,638 17,305,144 18,762,626 16,933,554 13,970,329
Change in Total Aggregate Demand 0 996,506 1,457,482 -1,829,072 -2,963,225
Change in Total Aggregate Demand % 0.0% 6.1% 8.4% -9.7% -17.5%
Mortgage Debt 10,042,429 11,157,757 11,954,054 11,903,391 11,683,114
Change in Mortgage Debt 1,179,274 1,115,328 796,297 -50,663 -220,277
USA now.
Slowdown in debtcan cause crisis

Variable\Year 2006 2007 2008 2009 2010
GDP 966,032 1,039,953 1,134,431 1,237,884 1,257,016
Change in Nominal GDP % 8.1% 7.7% 9.1% 9.1% 1.5%
Change in Real GDP % 3.2% 2.6% 4.8% 2.3% 1.3%
Inflation Rate % 2.8% 3.3% 3.0% 3.7% 2.1%
Private Debt 1,321,900 1,510,600 1,770,149 1,904,640 1,915,384
Debt Growth Rate % 13.5% 14.3% 17.2% 7.6% 0.6%
Change in Debt 157,420 188,700 259,549 134,491 10,744
GDP + Change in Private Debt 1,123,452 1,228,653 1,393,980 1,372,375 1,267,760
Change in Private Aggregate Demand % 0.0% 9.4% 13.5% -1.5% -7.6%
Government Debt 14,973 17,174 20,871 32,140 69,749
Change in Government Debt % -5,553 2,201 3,697 11,269 37,609
GDP + Change in Total Debt 1,117,899 1,230,854 1,397,677 1,383,644 1,305,369
Change in Total Aggregate Demand % 0.0% 10.1% 13.6% -1.0% -5.7%
Mortgage Debt 722,844 819,095 916,897 998,628 1,076,425
Change in Mortgage Debt 81,618 96,251 97,802 81,731 77,797
Australia now.
Australia still not deleveraging

Booming…?
2002 2003 2004 2005 2006 2007 2008 2009 2010 2011100
200
300
400
500
600
SydneyMelbourneBrisbanePerthAdelaideCanberraHobartDarwin
Median Prices
Year
$'00
0
What about house prices?

• Far higher than US, Japan
What about house prices?
1985 1990 1995 2000 2005 2010 20150
25
50
75
100
125
150
175
200
225
250
275
300
USAJapanAustralia
Inflation-Adjusted House Prices
Year
Inde
x 19
80 =
100
• But only because their price bubbles have already crashed
• Notice our prices below USA 2005-08

• Can population pressure justify high prices?...
1955 1960 1965 1970 1975 1980 1985 1990 1995 2000 2005 2010 20150
1
2
3
4
5
PopulationDwellings
Population and Dwelling Growth
Year
Per
cent
per
yea
r
What about house prices?
• Dwelling growth exceeded population growth every year except 2007-10

• And Chinese demand?
2007 2008 2009 2010 201140
20
0
20
40
60
80
NSWVicQldSAWATas
Change in Unemployment rate versus Australian average
Year
Sm
ooth
er p
erce
nt c
hang
e p.
a.
0
What about house prices?
• We beat GFC because of Victoria and housing
• Chinese growth only kicked in mid-2010

IndustryGrowth March 2009-May 2010
Growth Rate
Agriculture 20,503 5.7%Mining 20,659 13.0%Electricity -7,923 -5.5%Construction 29,935 3.0%Wholesale 11,759 3.0%Retail -32,859 -2.7%Accommodation &Food 49,279 6.9%Transport -2,513 -0.4%Information Technology -7,753 -3.5%Finance -1,982 -0.5%Real Estate 23,287 13.4%Professional 78,640 10.4%Administration 15,609 4.4%Education 28,853 3.6%Health 47,060 4.0%Arts -13,156 -6.2%Other Services 17,641 4.0%Total Victoria 109,894 4.1%Total Australia 158,710 2.1%
• Biggest growth industries stimulus and FHVB driven
Chinese-driven demand a late arrival
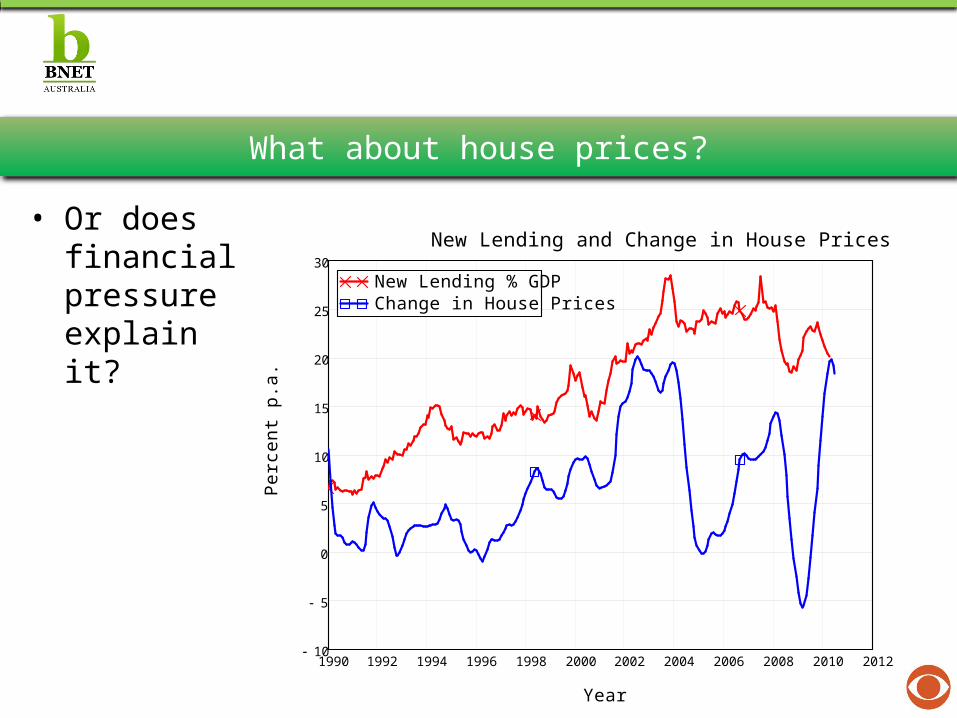
• Or does financial pressure explain it?
1990 1992 1994 1996 1998 2000 2002 2004 2006 2008 2010 201210
5
0
5
10
15
20
25
30
New Lending % GDPChange in House Prices
New Lending and Change in House Prices
Year
Per
cent
p.a
.
What about house prices?

1975 1980 1985 1990 1995 2000 2005 2010 20150
10
20
30
40
50
60
70
80
90
100
AustraliaUSA
Household Debt to GDP Ratios
Year
Per
cent
of
GD
P
What about house prices?
• Just like the USA…
• Australian households now more indebted than USA
• Debt servicing costs 1.5 times as high here as in USA

• And government manipulation of the market?
• Prices bubbled when FHOG introduced or doubled…
• No trend in real prices prior to 1st First Home Owners Scheme (1983)
1950 1955 1960 1965 1970 1975 1980 1985 1990 1995 2000 2005 2010 201580
90
100
110
120
130
140
150
Index+3 St. Dev.19831988200020012008
House Price Index to GDP Per Head
June
198
6=10
0
What about house prices?

• But what about “underlying demand”?• Legitimate measurement of social need• Illegitimate measure of demand pressure on house prices:• (National Housing Supply Council 2010, p. 66)
– “2008 gap size =– additional private rental dwellings required in 2008 to increase the number
of vacant private rental dwellings to 3 per cent of the total private rental stock
– + dwellings required to accommodate people who are homeless and sleeping rough or staying with friends and relatives
– + dwellings required to house marginal residents of caravan parks.”
What about house prices?

• Past 40 years of economic history driven by leveraging up– Sustained false boom since 1987 Stock Market Crash
• Foreseeable future driven by deleveraging– Private sector now debt-saturated
• There has never been a post-WWII recovery without rising debt– Sign of inherently sick economy– But absence of rising debt now means little likelihood of sustained economic “recovery”
• Ultimately have to confront excessive debt– “Debts that can’t be repaid, won’t be repaid” (Michael Hudson)– Debt moratoria better than honouring debt that should never have been issued
• Structural problems (excessive financial sector, trade imbalance) remain even if debt problems confronted
Summary

31
• Complete the questionnaire
Steve Keen
Thanks Steve!
Any questions?

32
• Complete the questionnaire
Phil Dobbie Steve Keen
In the draw to receive a FREE copy of Debunking Economics
Complete the Questionnaire

33
• Complete the questionnaire Queries
1960 1964 1968 1972 1976 1980 1984 1988 1992 1996 2000 2004 2008 201280
90
100
110
120
130
140
150
160
170
180
190
200
Index+3 St. Dev19831988200020012008
House Price Index to HDI Per Head
Year
June
196
0=10
0
“Those convincing us that housing is not in a bubble, among other measures use household income to show that prices are still reasonable, rather then an individual income. Women's participation rate is at the historic high. Does that make the housing market more stable, considering also high divorce rate?”