Embed Size (px)
Citation preview

The University of Maine The University of Maine
DigitalCommons@UMaine DigitalCommons@UMaine
General University of Maine Publications University of Maine Publications
10-1974
The Audience for Public Broadcasting in Maine: Report Prepared The Audience for Public Broadcasting in Maine: Report Prepared
for the Maine Public Broadcasting Network by the Social Science for the Maine Public Broadcasting Network by the Social Science
Research Institute Research Institute
University of Maine Social Science Research Institute
Follow this and additional works at: https://digitalcommons.library.umaine.edu/univ_publications
Part of the Higher Education Commons, History Commons, Radio Commons, and the Television
Commons
Repository Citation Repository Citation University of Maine Social Science Research Institute, "The Audience for Public Broadcasting in Maine: Report Prepared for the Maine Public Broadcasting Network by the Social Science Research Institute" (1974). General University of Maine Publications. 275. https://digitalcommons.library.umaine.edu/univ_publications/275
This Report is brought to you for free and open access by DigitalCommons@UMaine. It has been accepted for inclusion in General University of Maine Publications by an authorized administrator of DigitalCommons@UMaine. For more information, please contact [email protected].


THE AUDIENCE FOR PUBLIC BROADCASTING IN MAINE
Report Prepared For
The Maine Public Broadcasting Network
By
The Social Science Research Institute
University of Maine Orono, Maine 04473
Report 7B
October, 1974

TABLE OF CONTENTS
LIST OF CHARTS AND TABLES..................................... ii
CHAPTER 1 MAINE PUBLIC BROADCASTING: AN OVERVIEW.......... 1
Introduction ................................... 1The Sample Selection ........................... 4
CHAPTER 2 THE MAINE PUBLIC BROADCASTING AUDIENCE ........... 7
Media Source Most Trusted....................... 7
Television News................................. 9Favorite Type of Commercial Television Program . 11
Additional Programming 11
Number and Type of Television Sets Owned . . . . 14Television Viewing Times ...................... 21
Rating the Quality of Broadcasting in Maine. . . 21
Supervision and Censorship ..................... 25
Re-Runs......................................... 28
Foreign Language Programs...................... 33
CHAPTER 3 PUBLIC TELEVISION IN MAINE ....................... 36
Favorite Programs on Public Television ........ 40
Preferences for Specific Public Television Programs..................................... 43
Viewing Times for Public Television............ 45Sources of Information about Public Television
Programs..................................... 45
Maine News and Comment......................... 45Financing Public Television in Maine .......... 50
CHAPTER 4 PUBLIC RADIO ..................................... 54
Ownership of FM Radios......................... 54
Who Listens to Public Radio.................... 56
APPENDIX QUESTIONS USED FOR SURVEY......................... 59
Page

8
1 0
1 2
15
18
19
20
22
23
24
26
27
29
30
31
-ii-
LIST OF CHARTS AND TABLES
CHAPTER 2
CHART 2-1
TABLE 2-1
TABLE 2-2
TABLE 2-3
TABLE 2-4
TABLE 2-5
TABLE 2-6
TABLE 2-7
TABLE 2-8
TABLE 2-9
TABLE 2-10
TABLE 2-11
TABLE 2-12
TABLE 2-13
TABLE 2-14
Most Trusted Source of News................
Media Source Most Trusted by Age, Sex,Income and Education ....................
Favorite Type Commercial TV Programs by Age, Sex, Income, Occupation and Education.................................
Additional Kinds of Television Programs Desired by Various Demographic Groupings.................................
Number of TV Sets Owned by Age, Income, and Education.............................
Color TV Ownership by Age, Income, Education, and County ........................
Whether Respondent Subscribes to Cable TV by Income and County..................
Time of Day Television is Turned on by Sex, Income, Number of Children and Education.................................
How Late Television is Watched by Age,Sex, Income and Education................
Quality Rating of Broadcasting in Maine by Age, Income and Education ............
Quality Rating of Local Broadcasting: Comparison of National and Maine Samples. . .
Comments for Broadcasting Decision-Makers by Age, Sex, Income and Education........
Should Parents Supervise Children's TV Viewing by Income, Number of Children and Education.............................
Whether Respondent Favors Rating of Television Programs by Age, Sex, Income,Number of Children and Education ........
Frequency of Turning on Television and Finding a Rerun: Comparison of National and Maine Samples ..............

- i i i -
LIST OF CHARTS AND TABLES (Continued)
Page
TABLE 2-15 Frequency of Wanting to See a Program a Second Time: Comparison of Maine and Nationwide Samples.................... 32
TABLE 2-16 Frequency of Missing a Program andWishing it would be Rerun: Comparisonof Maine and Nationwide Samples .......... 34
TABLE 2-17 Whether Respondent Wants Programs in a Foreign Language by County and Origin of Ancestry.......................... 35
CHAPTER 3
CHART 3-1 Who Watches Public Television.............. 37
CHART 3-2 Kinds of Television Programs MostEnjoyed............ 41
TABLE 3-1 Whether Respondent Watches Public Televisionby Various Demographic Groupings........... 38
TABLE 3-2 Favorite Kinds of PTV Programs by Age,Sex, Income and Education................ 42
TABLE 3-3 Expressed Preferences of the Maine Public Television Audience for Specific Types of PTV Programming.......... .............. 44
TABLE 3-4 Time of Day Most Likely to Watch Public TV by Age, Sex, Income, Number of Children, and Education............................. 46
TABLE 3-5 How Late Public TV is Watched by Age, Sex,Income and Education....................... 47
TABLE 3-6 Source of Information about Public TV Programs by Age, Sex, Income and Education . . 48
TABLE 3-7 Whether Respondent Watches Maine News andComment by Age, Income and Education. . . . 49
TABLE 3-8 How Closely Respondent Thinks Public Broadcasting is Tied to University of Maine by County................................. 51
TABLE 3-9 Feelings About Asking for Contributions on the Air by Age, Income, Education and County..................................... 53

-IV-
LIST OF CHARTS AND TABLES (Continued)
Page
CHAPTER 4
TABLE 4-1 FM Car Radio Ownership by Age, Income,and Education............................. 55
TABLE 4-2 Whether Respondent is Regular Listener to Public Radio by Age, Sex, Income,Education, and County.................... 57
TABLE 4-3 Additional Types of Programs Desired on Public Radio by Age, Sex, Income and Education............................. 58

CHAPTER 1
MAINE PUBLIC BROADCASTING: AN OVERVIEW
Introduction
Late in 1973 the Maine Public Broadcasting Network (MPBN) contracted
the Social Science Research Institute to gather data on Maine resi
dents relevant to television viewership--especially public television
viewership: MPBN wanted to know which Maine citizens watched their
programming; but they also wanted to know what kinds of programs are
most popular, what kinds of programs people would like to see more of,
how viewing habits for commercial and public television differ, and
what viewers' perceptions are of how public television is financed.
The public radio audience--both actual and potential--was another
concern of MPBN. Public radio, however, was not available to many
Maine citizens and, therefore, could not be a major topic on a state
wide survey. Consequently, only a few questions about public radio
and about FM radio ownership were incorporated into the interview.
The instrument selected for data collection was a telephone sur
vey of a random sample of adult residents of Maine. Over a period
of seven weeks, the Social Science Research Institute interviewed
789 Maine citizens as respondents to its regular Maine Omnibus Sur
vey: questions about public broadcasting constituted a large part
of the omnibus interview for that period. The survey procedures em
ployed are briefly discussed below.

-2-
Responses to the more than 60 questions asked about public broad
casting were analyzed by cross-tabulation with the demographic variables
collected, such as age, sex, education, income, and family size. The
resulting tables, comments on the data, and comparisons with national
samples form the body of this report.
The first question asked pertained to media trust. Forty percent
of the respondents indicated that if various news media gave conflicting
stories, they would believe television. Newspapers were cited as most
believable by 19 percent, magazines by 8 percent, and radio by 6 per
cent. None of the media would be believed by 7 percent and a com
bination of sources would be believed by 5 percent. These figures are
quite similar to nationwide data collected by the Television Informa
tion Office. Comparison with the national sample on questions about
re-runs also showed a high degree of similarity between Maine and the
nation as a whole.
Most respondents (54 percent) said that broadcasting in Maine is
doing a good job. Here the Maine sample differed slightly from the
national data which showed that 60 percent of respondents felt their
local broadcasters were doing an excellent or good job.
An interesting series of questions pointed out concern about
violence and sex on television among Maine adults. Over 60 percent
of the respondents feel programs should be rated as movies are, and
over 80 percent feel that parents should supervise their children's
television viewing and should protect their children from television
programs dealing with sex or violence in a shocking way.

-3-
Detailed results on the topics of media trust, television owner
ship and viewing habits, re-runs, broadcasting quality, and television
viewing supervision or censorship are presented in Chapter 2, "The
Maine Broadcasting Audience."
The survey found that a substantial majority of Maine families
watch public television. Sixty-two percent of the respondents re
plied affirmatively when asked if they or members of their families
ever watch programs on public television. The audience for public
television appears to be greatest among better educated, upper income
people. County of residence is also a factor in the likelihood of
watching PTV.
Respondents most often mentioned drama as their favorite type
of program on both commercial and public television. Comedy was
frequently named as a favorite on commercial television, but not on
public television. News was preferred by similar proportions of the
sample for both commercial and public television. The same was true
for documentaries. Viewers also mentioned instructional shows, talk
shows, and music as favorite programs on public television, but these
responses were rarely given for commercial television.
Two-thirds of the respondents who watch public television said
they would like to see more documentaries on PTV. Large percentages
also want more music and drama broadcasts. However, the percentage
of respondents who would like less election coverage is larger than
the percentage who would like more. More sports and less sports
are desired by almost equal numbers, although University of Maine
sports specifically are more popular.
-4-
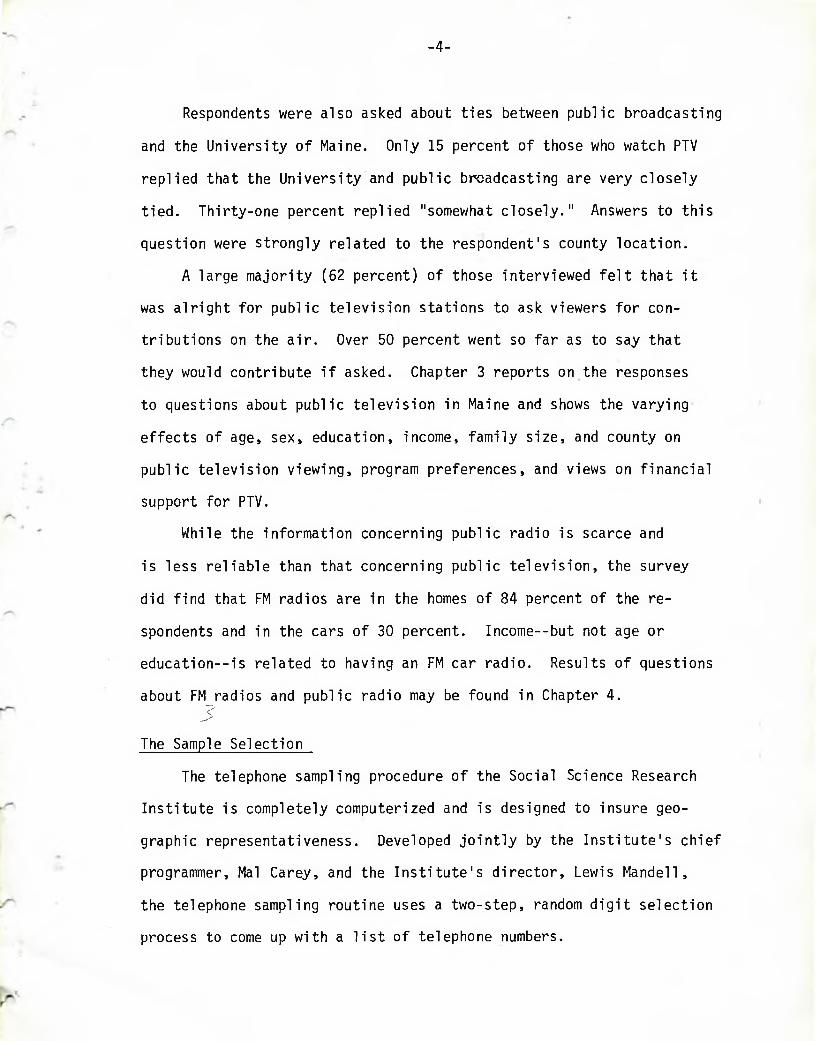
Respondents were also asked about ties between public broadcasting
and the University of Maine. Only 15 percent of those who watch PTV
replied that the University and public broadcasting are very closely
tied. Thirty-one percent replied "somewhat closely." Answers to this
question were strongly related to the respondent's county location.
A large majority (62 percent) of those interviewed felt that it
was alright for public television stations to ask viewers for con
tributions on the air. Over 50 percent went so far as to say that
they would contribute if asked. Chapter 3 reports on the responses
to questions about public television in Maine and shows the varying
effects of age, sex, education, income, family size, and county on
public television viewing, program preferences, and views on financial
support for PTV.
While the information concerning public radio is scarce and
is less reliable than that concerning public television, the survey
did find that FM radios are in the homes of 84 percent of the re
spondents and in the cars of 30 percent. Income--but not age or
education--is related to having an FM car radio. Results of questions
about FM radios and public radio may be found in Chapter 4.3
The Sample Selection
The telephone sampling procedure of the Social Science Research
Institute is completely computerized and is designed to insure geo
graphic representativeness. Developed jointly by the Institute's chief
programmer, Mai Carey, and the Institute's director, Lewis Mandell,
the telephone sampling routine uses a two-step, random digit selection
process to come up with a list of telephone numbers.

-5-
During the first stage, three-digit Maine exchanges are selected
in proportion to the population that they cover. This guarantees rep
resentation based upon population rather than upon the number of tele
phones owned in any community. During the second stage, the remaining
four digits of a selected number are chosen by the random generator
of the computer. In the event that a city has more than one exchange,
as in the case of Portland, a third stage is used to randomly select
which exchange or exchanges will be used in the sampling process.
The random digit sampling program is far superior to other tele
phone sampling routines which utilize telephone directories. The rea
son for this is that the random digit process does not exclude un
listed numbers, nor is it dependent upon persons who have lived at an
address long enough to have a number listed in the phone book. It
must be conceded, however, that all telephone selection processes
have the drawback of excluding non-telephone-owning families. In
the case of Maine, this includes some 14 percent of the year-round
population.
Since a random telephone number may not be a working number, or
alternatively, may be a non-elegible respondent such as a commercial
or governmental establishment, certain replacement procedures were
used. If a non-elegible respondent was reached, the same exchange
number was retained but a new four-digit number was chosen by the
computer as a replacement. A similar procedure was used in the case
of non-working numbers.
Most interviewing was done after 5:00 P.M. during weekdays, be
tween 9:30 A.M. and 9:30 P.M. on Saturday, and between 1:30 P.M. and
9:30 P.M. on Sunday. These hours were chosen in an attempt to get

-6-
an even balance between male and female respondents. It is well
established in survey research that survey calls or visits made
during weekday hours tend to underrepresent adult males.
In the event that there was no response from a working number,
up to five calls were made to a sampled household within the space
of seven days. Calls were made not only during the evening hours of
weekdays and during daytime and evening hours of the weekends, but
also during daytime hours of the weekdays in order to establish
whether or not a number was that of an inelegible respondent, such
as a commercial establishment. Numbers that were busy were recalled
within the hour, and in many cases where a respondent was unable
to answer questions at the time of the call, an appointment was
made to call later on. All told, the response rate on the survey
was 74 percent. Of the 26 percent of sampled numbers for which an
interview was not obtained, 19 percent consisted of terminations or
refusals.

-7-
THE MAINE BROADCASTING AUDIENCE
In order to fully evaluate the impact of Public Broadcasting in
the State of Maine, survey respondents were asked a large number of
questions relating to their television viewing habits in general, as
well as their preferences, levels of satisfaction, and confidence in
broadcasting in Maine. This chapter summarizes the results of these
questions.
Media Source Most Trusted
To start off, respondents were asked which media source they had
the most confidence in, in the event that conflicting stories were
given--radio, television, magazines, or newspapers. Chart 2-1 sum
marizes the results of this question. Throughout the State of Maine,
television was overwhelmingly chosen as the source that most people
would be likely to believe. Forty percent of our sample mentioned tele
vision as opposed to the 19 percent in the next largest category--
newspapers. Only 8 percent mentioned magazines, and 6 percent radio.
These responses may be contrasted with a national sample conducted
in 1972 where each media source came up with a higher level of confidence
than in the State of Maine. Nationwide, 48 percent most trusted tele
vision as compared with 40 percent in Maine, 21 percent trusted news
papers as compared with 19 percent in Maine, 10 percent trusted magazines
as compared to 8 percent in Maine, and 8 percent trusted radio as com
pared to 6 percent in Maine. The difference is made up of two additional
CHAPTER 2

CHART 2-1
MOST TRUSTED SOURCE OF NEWS
1974 Maine Sample 1972 National Sample

-9-
responses in Maine--the "none" category with 7 percent and the "combination"
category with 5 percent. Were it not for these categories, (which may not
have been allowable answers on the national survey) the Maine proportions
would have corresponded very closely to national proportions showing
confidence in the media.
Table 2-1 shows that trust in television is particularly frequent
among young people aged 18 to 24 and is least pronounced among people
over the age of 55. In addition, females have slightly more confidence
in television than do males. And, while there isn't much difference as
the result of income, persons with higher education ( at least some
college) have less confidence in television than do their less-well-
educated counterparts. The better educated people, as opposed to other
subgroups, seem to be far more dependent upon magazines for reliable
sources of news.
Television News
Maine residents were also asked which television networks they
watched for national news. Throughout the state, by far and away, the
most popular network for national news was CBS which claimed 50 percent
of the audience. This was followed by NBC with 31 percent and ABC
with 8 percent. Only one percent of the responding families had no tele
vision sets, and only two more percent said that they did not watch
national news.
Respondents were also asked which television station they generally
watched for local or state news. For purposes of comparison, the sta
tions that they reported were transformed by the Social Science Research
Institute coders into networks and the response was very similar to

-10-
TABLE 2-1
MEDIA SOURCE MOST TRUSTED BY AGE, SEX, INCOME AND EDUCATION
Radio TV Magazine Newspaper
None Combination
Other NA DKa
Total Nb
All Respondents 6% 40% 8% 19% 7% 5% 1% 14% 100% 789
A. AGE 18 - 24 9 55 5 16 6 3 1 5 100 11025 - 34 5 47 7 20 7 4 * 10 100 19535 - 44 7 33 9 24 7 4 3 13 100 13945 - 54 6 40 10 15 6 6 2 15 100 10855 - 64 4 30 7 17 9 10 2 21 100 11265 or over 7 34 7 19 7 6 1 19 100 115
B. SEX Male 6 36 5 20 7 6 2 18 100 307Female 7 41 9 18 7 5 1 12 100 448
C. FAMILY INCOME Less than $5,000 9 39 3 19 6 7 2 15 100 151$5,000-$10,000 6 43 6 19 5 5 1 15 100 292$10,000-$15,000 3 36 11 22 11 7 * 10 100 185More than $15,000 10 39 12 16 8 2 4 9 100 110
D. EDUCATION K - 8 11 44 2 15 5 4 * 19 100 989 - 1 2 6 44 5 19 7 5 1 13 100 423College 6 32 14 19 9 6 2 12 100 256
* Less than 0.5% a Not Ascertained or Don't Know b Number of Interviews

-11-
that for national news. Forty-seven percent watched CBS, 37 percent
watched NBC, 7 percent watched ABC, and 3 percent watched Public Tele
vision.
Favorite Type of Commercial Television Program
Respondents were asked the programs, or types of programs, they
most enjoyed on commercial television. The most popular type of
program was in the drama/fiction category with 24 percent, followed
closely by comedy with 20 percent. Table 2-2 shows the breakdown among
various demographic groups. In the 18 to 24 year old age group, 32
percent listed the drama/fiction category as their favorite type of
commercial programming as compared with 24 percent overall. Although
news was the favorite type of programming of only 9 percent of all re
spondents, it jumped to 17 percent for those aged 65 and over. Among
middle aged groups, age 35-54, comedy programs surpassed drama/fiction.
Although sports programs were the favorite of some 7 percent of
the population, there was, as expected, a great difference between
sexes. Fourteen percent of males listed sports as their favorite type
of program as opposed to only 2 percent of females. Sports was also
more popular among higher income families as was news.
Additional Programming
Respondents were asked what kinds of television programs, in ad
dition to those offered now, they would like to see on the air. In re
sponse to this question, most respondents seemed to indicate a general
level of satisfaction with the kinds of programs that were offered.
Fourteen percent of respondents said that there were no additional pro
grams they would like to see offered, and an additional 39 percent could

TABLE 2-2
FAVORITE TYPE COMMERCIAL TV PROGRAMS BY AGE, SEX, INCOME, OCCUPATION AND EDUCATION
News Sports Drama Documentary Movies Comedy Variety Other NA/DKa Total Nb
All Respondents 9% 7% 24% 11% 10% 20% 4% 10% 5% 100% 778
A. AGE18 - 24 4 6 32 8 15 17 2 6 10 100 10725 - 34 6 6 25 15 14 20 3 8 3 100 19335 - 44 13 11 17 11 10 19 3 11 5 100 13945 - 54 9 4 21 12 10 27 5 8 4 100 10655 - 64 6 8 26 8 9 21 5 12 5 100 11165 or over 17 3 25 8 3 18 5 13 8 100 114
B. SEXMale 9 14 24 12 8 16 3 9 5 100 304Female 9 2 22 11 12 23 4 11 6 100 440
C. FAMILY INCOMELess than $5,000 10 3 23 9 8 19 4 16 8 100 150$5,000-$10,000 7 7 26 9 10 23 4 9 5 100 289$10,000-$15,000 8 8 24 14 13 18 4 7 4 100 182More than $15,000 15 10 20 14 9 17 2 8 5 100 108
D. EDUCATIONK - 8 8 6 35 7 9 13 2 11 9 100 989 - 12 6 6 25 10 11 24 4 9 5 100 422College 15 8 17 14 10 17 4 11 4 100 246

TABLE 2-2 (continued)
FAVORITE TYPE COMMERCIAL TV PROGRAMS BY AGE, SEX, INCOME, OCCUPATION AND EDUCATION
News Sports Drama Documentary Movies Comedy Variety Other NA/DKa Total Nb
E. OCCUPATION Retired 15 3 23 11 6 20 5 12 5 100 148Professional 18 10 17 16 10 15 2 10 2 100 96Manager 11 11 26 17 11 9 4 9 2 100 54Self-Employed 12 4 21 8 21 16 8 6 4 100 51Clerical 10 2 19 9 17 19 3 16 5 100 58Craftsman 1 10 25 10 6 34 2 4 8 100 80Operative * 8 30 9 8 29 6 8 2 100 64Laborer 5 7 27 9 10 20 2 11 9 100 152Farmer * * 20 10 10 20 * 30 10 100 10Miscellaneous 8 6 26 11 12 20 1 8 8 100 65
* Less than 0.5%a Not Ascertained or Don't Knowb Number of Interviews
-14-
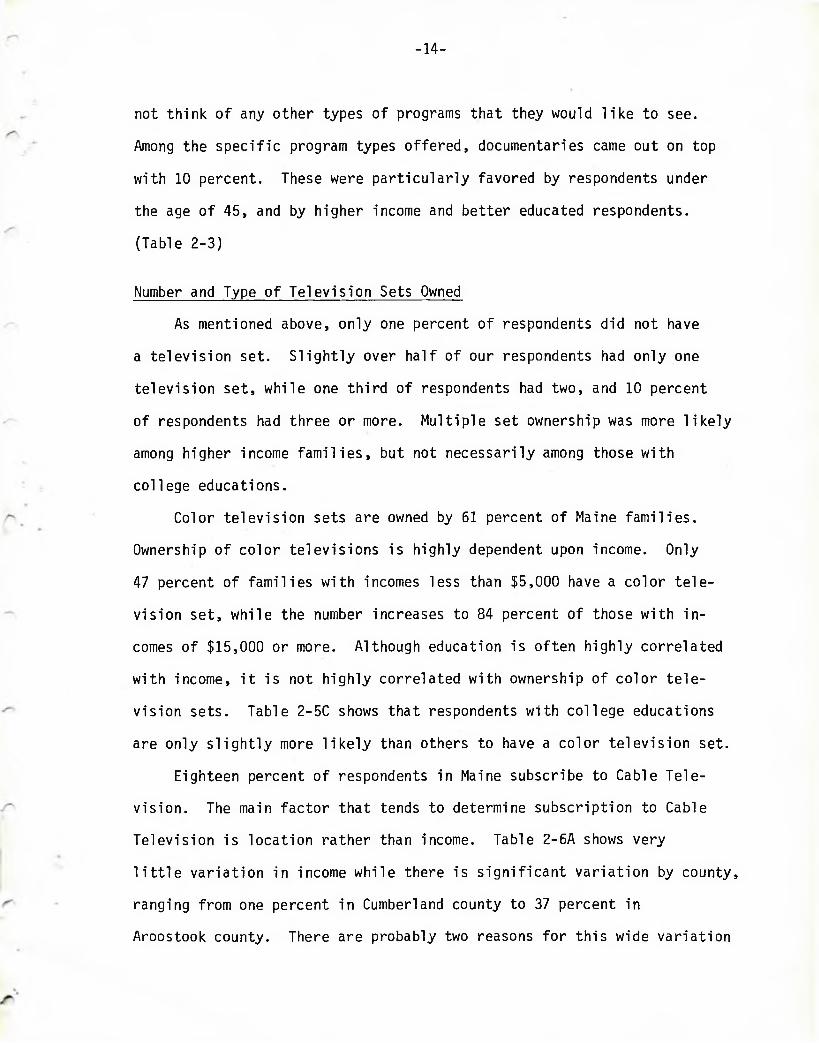
not think of any other types of programs that they would like to see.
Among the specific program types offered, documentaries came out on top
with 10 percent. These were particularly favored by respondents under
the age of 45, and by higher income and better educated respondents.
(Table 2-3)
Number and Type of Television Sets Owned
As mentioned above, only one percent of respondents did not have
a television set. Slightly over half of our respondents had only one
television set, while one third of respondents had two, and 10 percent
of respondents had three or more. Multiple set ownership was more likely
among higher income families, but not necessarily among those with
college educations.
Color television sets are owned by 61 percent of Maine families.
Ownership of color televisions is highly dependent upon income. Only
47 percent of families with incomes less than $5,000 have a color tele
vision set, while the number increases to 84 percent of those with in
comes of $15,000 or more. Although education is often highly correlated
with income, it is not highly correlated with ownership of color tele
vision sets. Table 2-5C shows that respondents with college educations
are only slightly more likely than others to have a color television set.
Eighteen percent of respondents in Maine subscribe to Cable Tele
vision. The main factor that tends to determine subscription to Cable
Television is location rather than income. Table 2-6A shows very
little variation in income while there is significant variation by county,
ranging from one percent in Cumberland county to 37 percent in
Aroostook county. There are probably two reasons for this wide variation

TABLE 2-3
ADDITIONAL KINDS OF TELEVISION PROGRAMS DESIRED BY VARIOUS DEMOGRAPHIC GROUPINGS
None Wild-Life
Doc. Musical Family Sports OlderMovies
Other NA/DKa
Total Nb
All Respondents 14% 4% 10% 5% 8% 2% 3% 15% 39% 100% 779
A. AGE18 - 24 15 4 12 1 5 1 3 19 40 100 10725 - 34 11 3 14 3 9 3 1 20 36 100 19335 - 44 15 3 13 4 11 4 4 12 34 100 13945 - 54 19 8 3 7 7 3 6 10 37 100 10655 - 64 11 3 7 10 5 1 3 13 47 100 11265 or over 17 3 4 8 8 3 3 14 40 100 114
B. SEXMale 14 6 12 3 4 4 4 16 37 100 304Female 14 2 8 7 10 2 2 15 40 100 441
C. FAMILY INCOMELess than $5,000 13 2 5 7 12 1 5 17 38 100 150$5,000-$10,000 15 4 9 4 8 2 3 14 41 100 290$10,000-$15,000 15 5 12 6 5 5 3 18 31 100 182More than $15,000 13 4 16 4 4 3 2 10 44 100 108
D. CHILDREN AT HOMENone 14 4 8 8 6 3 2 16 39 100 304One 12 5 8 2 12 4 3 10 44 100 128Two 14 1 13 4 7 3 4 17 37 100 136Three or more 16 4 12 4 8 2 4 14 36 100 211

ADDITIONAL KINDS OF TELEVISION PROGRAMS DESIRED BY VARIOUS DEMOGRAPHIC GROUPINGS
TABLE 2-3 (continued)
None Wild-Life
Doc. Musical Family Sports OlderMovies
Other NA/DKa
Total Nb
E. EDUCATIONK - 8 18 2 2 4 7 3 6 15 43 100 989 - 1 2 15 5 8 5 8 3 3 12 41 100 422College 13 3 15 6 7 2 2 19 33 100 247
F. OCCUPATIONRetired 16 1 7 7 9 2 4 14 40 100 149Professional 11 4 14 7 5 3 1 24 31 100 96Manager 17 2 9 7 6 2 * 18 39 100 54Clerical 9 5 9 3 7 * * 21 46 100 58Craftsman 15 7 11 1 10 4 3 10 39 100 80Laborer 15 6 6 2 10 3 5 15 38 100 152
G. YEARS IN MAINELess than 5 14 2 9 8 10 4 1 19 33 100 835 - 9 10 8 8 * * 3 3 14 54 100 3710 - 20 18 3 12 6 4 * 1 21 35 100 7320 or more 14 4 10 5 8 3 3 14 39 100 567
H. MARITAL STATUSMarried 14 4 10 5 7 3 3 15 39 100 582Widowed 20 * 4 13 10 * 6 12 35 100 69Divorced 5 9 7 7 19 2 5 14 32 100 43Single 13 4 15 1 3 1 3 18 42 100 72

Nb
8076
1384069814798203496
7 \
TABLE 2-3 (continued)
ADDITIONAL KINDS OF TELEVISION PROGRAMS DESIRED BY VARIOUS DEMOGRAPHIC GROUPINGS
None Wild- Doc. Musical Family Sports Older Other NA/ Life Movies DKa
COUNTYAndroscoggin 13 * 11 4 10 1 5 16 40Aroostook 18 1 7 8 9 1 4 12 40Cumberland 13 4 11 6 7 1 4 17 37Franklin/Oxford 15 3 10 5 5 2 * 15 45Hanc./Waldo/Wash. 13 7 9 4 9 4 1 18 35Kennebec 15 2 9 3 7 4 * 17 43Knox/Linc./Saga. 21 6 13 * 9 * 2 17 32Penobscot 12 6 12 5 5 3 4 15 38Piscataquis 20 5 5 5 5 * * 25 35Somerset 6 3 6 12 12 3 6 8 44York 15 5 10 6 6 6 3 9 40
Less than 0.5%Not Ascertained or Don't Know Number of Interviews

-18-
TABLE 2-4
NUMBER OF TV SETS OWNED BY AGE, INCOME, AND EDUCATION
One Two Three Four or None NA/DKa Total More
Nb
All Respondents 55% 34% 9% 1% * 1% 100% 780
A. AGE18 - 24 55 25 11 6 2 1 100 10725 - 34 59 36 3 2 * * 100 19335 - 44 45 40 15 * * * 100 13945 - 54 50 34 12 2 * 2 100 10755 - 64 53 36 10 1 * * 100 11265 or over 63 30 4 1 * 2 100 114
B. FAMILY INCOME Less than $5,000 66 24 6 1 1 2 100 150$5,000-$10,000 61 31 5 1 1 1 100 290$10,000-$15,000 45 43 10 2 * * 100 182More than $15,000 39 39 16 6 * * 100 109
C. EDUCATION K - 8 69 21 9 1 * * 100 989 - 1 2 53 36 8 2 * 1 100 422College 51 35 10 2 1 1 100 248
*ab
Less than 0.5%Not Ascertained or Don't KnowNumber of Interviews

-19-
COLOR TV OWNERSHIP BY AGE, INCOME, EDUCATION AND COUNTY
TABLE 2-5
Yes No NA/DKa Total Nb
All Respondents 61% 38% 1% 100% 779
A. AGE18 - 24 52 47 1 100 10525 - 34 60 40 * 100 19335 - 44 69 30 1 100 13945 - 54 72 26 2 100 10755 - 64 60 39 1 100 11265 or over 55 44 1 100 115
B. INCOMELess than $5,000 47 52 1 100 149$5,000-$10,000 62 37 1 100 289$10,000-$15,000 62 37 1 100 183More than $15,000 84 16 * 100 109
C. EDUCATIONK - 8 61 39 * 100 989 - 1 2 61 38 1 100 422College 63 36 1 100 247
D. COUNTYAndro. 59 40 1 100 80Aroos./Pisca. 51 48 1 100 96Cumberland 62 36 2 100 138Frank./Somer. 52 48 * 100 44Hanc./Waldo 60 39 1 100 47Kennebec 76 24 * 100 82Knox/Linc./Saga. 60 40 * 100 47Penobscot 63 36 1 100 98Washington 45 55 * 100 22York 72 28 * 100 95Oxford 57 43 * 100 30
* Less than 0.5%Not Ascertained or Don't KnowNumber of Interviews

-20-
WHETHER RESPONDENT SUBSCRIBES TO CABLE TV BY INCOME ANn COUNTY
TABLE 2-6
Yes No NA/DKa Total Nb
All Respondents 18% 82% * 100% 777
A. INCOMELess than $5,000 19 80 1 100 150$5,000-$10,000 17 82 1 100 288$10,000-$15,000 18 82 * 100 181More than $15,000 20 80 * 100 109
B. COUNTYAndroscoggin 23 77 * 100 80Aroostook 37 62 1 100 76Cumberland 1 99 * 100 138Franklin/Oxford 30 70 * 100 40Hanc./Waldo/Wash. 7 91 2 100 69Kennebec 33 67 * 100 82Knox/Line./Saga. 6 94 * 100 47Penobscot 15 85 1 100 97Piscataquis 5 95 * 100 19Somerset 27 73 * 100 34York 20 80 1 100 95
* Less than 0.5%a Not Ascertained or Don't Knowk Number of Interviews

-21-
between counties. First, Cable Television is not yet available in all
parts of the state. Cumberland county is one area where it is not.
Also, the quality of television reception varies with geographic location.
Cable Television would, then, be expected to have higher subscription
rates in areas where it could greatly improve reception quality.
Television Viewing Times
Survey respondents were asked when they turned their television sets
on and off during the day. Table 2-7 shows that the greatest proportion
of families, 28 percent, turn on their television sets between six and
seven P.M., probably to catch the news. However, some 39 percent of
families turn their television set on before that time, and daytime
viewers are more likely to be females, particularly those who are home
with children.
According to Table 2-8, three-quarters of Maine families turn off
their television sets between 10 P.M. and midnight. Most of these, in
fact, turn off their sets after 11 P.M. which indicates that they pro
bably try to catch at least part of the late news. The time of turning
off the television set does not vary substantially by income, education,
or age, although males are more likely than females to stay up watching
television after 11.
Rating the Quality of Broadcasting in Maine
Survey respondents were asked the following question: "Would you
say that broadcasting in Maine is doing a good job, an average job, or
a poor job?" Basically, most Maine people feel that broadcasting in
Maine is doing a good job. According to Table 2-9, 54 percent feel that
it is doing a good job, 40 percent an average job, and only 3 percent

TABLE 2-7
TIME Of DAY TELEVISION IS TURNED ON BY SEX, INCOME, NUMBER OF CHILDREN AND EDUCATION
Morning 12:00-3:59PM
4:00- 5:59PM
6:00-6:59PM
7:00-7:59PM
8:00-8:59PM
9:00 or later
NA/DKa
Total Nb
All Respondents 13% 10% 16% 28% 10% 12% 2% 9% 100% 355
A. SEXMale 10 5 16 34 8 16 3 8 100 134Female 15 12 14 26 12 9 1 11 100 199
B. FAMILY INCOMELess than $5,000 16 16 11 20 13 9 4 11 100 45$5,000-$10,000 15 9 15 25 10 14 1 11 100 38$10,000-$15,000 12 11 18 31 8 10 1 9 100 91More than $15,000 13
C. NUMBER OF CHILDREN
2 15 37 12 12 4 5 100 60
AT HOMENone 12 5 14 30 13 15 2 9 100 137One 20 10 22 20 14 10 2 2 100 59Two 8 15 16 31 5 7 * 18 100 61Three or more 13 12 14 30 8 12 4 7 100 98
D. EDUCATIONK - 8 23 14 9 27 9 18 * * 100 229 - 1 2 15 13 18 24 10 8 1 11 100 185College 10 5 14 35 12 15 2 7 100 145
* Less than 0.5% a Not Ascertained or Don't Know b Number of Interviews
-22-

TABLE 2-8
HOW LATE TELEVISION IS WATCHED BY AGE, SEX, INCOME AND EDUCATION
Turnsbefore
off TV 9:00 PM
9-9:59 10-10:59 11-11:59 After 12 NA/DKa Total Nb
All Respondents 4% 8% 32% 43% 7% 6% 100% 361
A. AGE18 - 24 * 9 28 49 6 8 100 4725 - 34 5 9 27 42 11 6 100 10135 - 44 5 * 37 40 8 10 100 6045 - 54 * 8 39 45 6 2 100 4955 - 64 8 11 32 41 5 3 100 6265 or over * 11 35 46 3 5 100 37
B. SEXMale 4 7 24 48 12 5 100 137Female 4 8 36 40 5 7 100 202
C. FAMILY INCOME Less than $5,000 2 11 34 40 9 4 100 47$5,000-$10,000 3 8 36 40 9 4 100 141$10,000-$15,000 5 7 26 48 5 9 100 92More than $15,000 5 5 30 44 8 8 100 60
D. EDUCATIONK - 8 5 14 14 57 10 * 100 219 - 1 2 4 8 36 40 9 3 100 192College 3 6 28 46 5 12 100 145
a Not Ascertained or Don't Know b Number of Interviews

-24-
TABLE 2-9
QUALITY RATING OF BROADCASTING IN MAINE BY AGE, INCOME AND EDUCATION
Good Job Average Job Poor Job NA/DKa Total Nb
All Respondents 54% 40% 3% 3% 100% 789
A. AGE 18 - 24 37 53 6 4 100 11025 - 34 49 43 6 2 100 19535 - 44 52 43 4 1 100 13945 - 54 59 37 * 4 100 10855 - 64 62 34 1 3 100 11265 or over 64 30 2 4 100 115
B. FAMILY INCOME Less than $5,000 58 35 3 4 100 151$5,000-$10,000 51 45 2 2 100 292$10,000-$15,000 53 39 5 3 100 185More than $15,000 55 37 4 4 100 110
C. EDUCATION K - 8 62 32 2 4 100 989 - 1 2 54 41 3 2 100 423College 48 43 5 4 100 256
*
ab
Less than 0.5%Not Ascertained or Don't Know Number of Interviews

-25-
a poor job. These figures may be compared with the results of a
national sample taken in 1972 and contained in Table 2-10. Nationally,
some 60 percent said that their local broadcasting was doing an ex
cellent or good job as compared with 54 percent in Maine. Although the
data sources are not strictly comparable, there is an indication that
Maine viewers may be slightly less satisfied with the quality of their
broadcasting than people in other states.
Respondents were also asked what they would tell the people who
control television and radio in Maine. While 35 percent could not
think of anything that they would tell them, the greatest specific re
sponse, with 11 percent, mentioned more variety while 9 percent mentioned
special types of programs, fewer commercials, or nothing at all.
Supervision and Censorship
Censorship and rating of television programs has become a contro
versial issue in many communities across the United States. Consequently,
Maine residents were asked several questions relating to their views on
these matters. When asked whether parents should supervise the kinds
of programs that their children watch on television, an overwhelming
85 percent said yes, whereas only 10 percent said no. Table 2-11 shows
that there was little variation in this response among various demo
graphic categories. Again, when respondents were asked whether they
think that a parent ought to protect children from television programs
that deal with violence or sex in a shocking way, 82 percent responded
yes and only 13 percent said no.
Respondents were then asked the following question: "Do you think
that programs on television should be rated as are movies with letters

-26-
TABLE 2-10
QUALITY RATING OF LOCAL BROADCASTING:COMPARISON OF NATIONAL AND MAINE SAMPLES
Nationwide Sample 1972
Maine Sample 1974
Excellent or Good 60% 54%
Average, Fair, Poor 36 43
NA/DK 4 3
The Maine sample was asked to evaluate "broadcasting in Maine"; the nationwide sample was asked to evaluate their "local television stations".
b Not Ascertained or Don’t Know

TABLE 2-11
COMMENTS FOR BROADCASTING DECISION MAKERS BY AGE, SEX, INCOME AND EDUCATION
MoreVariety
LessViolence
MSTPC FewerCommercials
Nothing DoingGoodJob
Clean Up Sex §"Trash"
Other NA/DKa Total Nb
All Respondents 11% 6% 9% 9% 9% 3% 6% 12% 35% 100% 789
A. AGE18 - 24 15 3 9 11 7 3 6 9 37 100 11025 - 34 12 3 11 5 11 5 4 15 34 100 19535 - 44 10 6 7 13 9 3 6 18 28 100 13945 - 54 13 7 7 12 8 2 4 14 33 100 10855 - 64 6 11 12 9 5 4 5 6 42 100 11265 or over 10 10 6 4 11 4 10 7 38 100 115
B. SEXMale 13 2 7 9 9 4 4 13 39 100 307Female 10 9 9 9 9 4 7 11 32 100 448
C. FAMILY INCOMELess than $5,000 12 9 5 4 12 2 6 11 39 100 151$5,000-$10,000 9 4 10 12 9 5 6 9 36 100 292$10,000-$15,000 15 6 7 7 8 3 5 14 35 100 185More than $15,000 9 6 10 14 6 4 6 24 21 100 110
D.EDUCATIONK - 8 4 4 4 4 16 3 5 12 48 100 989 - 12 12 7 8 9 9 3 7 8 37 100 423College 12 7 12 10 7 4 5 18 25 100 256
abc
Not Ascertained or Don't KnowNumber of InterviewsMore of a Specific Type of Program

-28-
such as GP, R, or X?" Here, 62 percent of the sample said yes and 29
percent said no, while 8 percent were undecided. Most likely to favor
such ratings were families with children at home and those with higher
amounts of education. A higher proportion of females than males favored
these ratings.
Re-Runs
With most of commercial television on a 26 week season, re-runs are
an issue of some contention. Maine respondents were therefore asked how
frequently they turned on television and found a re-run. Fifty percent
said quite often, 15 percent said sometimes, 18 percent said rarely, and
2 percent said never. Table 2-14 compares the responses of the Maine
audience to a national sample conducted in 1972. Although the coding
of the question makes it difficult to have exact comparisons, responses
indicate that about half of each finds re-runs a frequent occurrence on
television.
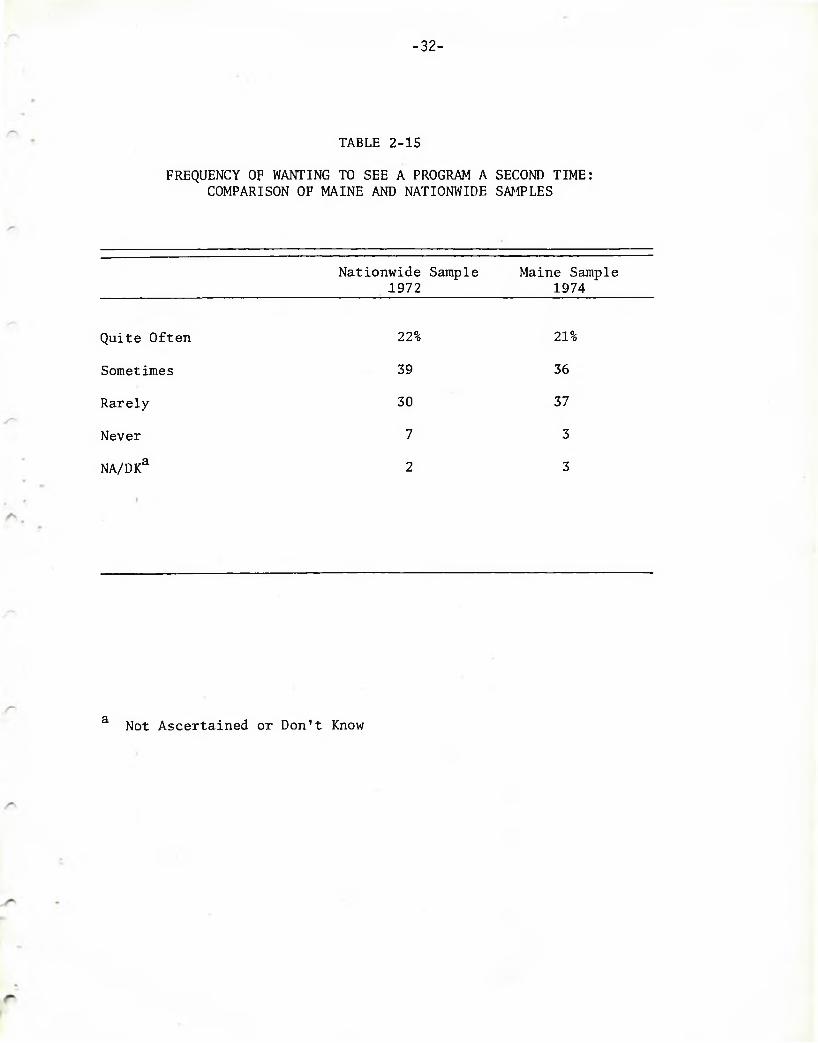
While re-runs are a burden to some, they may be a source of satis
faction to others. Consequently, respondents were asked how often they
have seen a program that they liked and wished it could be re-run so
that they could see it a second time. Table 2-15 shows that responses to
this question in Maine are extremely close to those nationally. In
Maine, 21 percent said that they quite often wished to see a program
re-run as opposed to 22 percent nationwide and 36 percent of Maine re
spondents said they sometimes hoped that would occur as opposed to 39
percent of the national sample.
A third question relating to re-runs asked how frequently they
missed a television program and wished that it would be run again. Here

-29-
SHOULD PARENTS SUPERVISE CHILDREN'S TV VIEWING BY INCOME, NUMBER OF CHILDREN AND EDUCATION
TABLE 2-12
Yes Undecided No NA/DKa Total Nb
All Respondents 85% 4% 10% 1% 100% 780
A. FAMILY INCOMELess than $5,000 87 7 5 1 100 149$5,000-$10,000 88 3 9 * 100 290$10,000-$15,000 80 5 14 1 100 183More than $15,000 87 1 12 * 100 109
B. NUMBER OF CHILDREN AT HOMENone 86 5 8 1 100 304One 82 5 13 * 100 129Two 90 2 8 * 100 136Three or more 83 3 13 1 100 211
C. EDUCATIONK - 8 77 8 14 1 100 989 - 1 2 85 4 10 1 100 421College 88 2 9 1 100 249
L
* Less than 0.5% a Not Ascertained or Don't Know b Number of Interviews

-30-
WHETHER RESPONDENT FAVORS RATING OF TELEVISION PROGRAMS BY AGE, SEX, INCOME, NUMBER OF CHILDREN AND EDUCATION
TABLE 2-13
Yes Undecided No NA/DKa Total Nb
All Respondents 62% 8% 29% 1% 100% 781
A. AGE18 - 24 55 6 39 * 100 10725 - 34 63 4 32 1 100 19335 - 44 66 1 32 1 100 13945 - 54 62 9 27 2 100 10755 - 64 65 12 21 2 100 11265 or over 60 22 16 2 100 115
B. SEXMale 58 8 33 1 100 304Female 66 9 24 1 100 443
C. FAMILY INCOMELess than $5,000 54 20 25 1 100 150$5,000-$10,000 67 5 27 1 100 290$10,000-$15,000 62 6 31 1 100 183More than $15,000 68 2 30 * 100 109
D. NUMBER OF CHILDREN AT HOMENone 59 14 25 2 100 305One 60 6 33 1 100 129Two 61 2 36 1 100 136Three or more 67 6 26 1 100 211
E. EDUCATIONK - 8 52 18 27 3 100 989 - 1 2 63 8 28 1 100 422College 64 5 30 1 100 249
* Less than 0.5% a Not Ascertained or Don't Know b Number of Interviews

-31-
TABLE 2-14
FREQUENCY OF TURNING ON TELEVISION AND FINDING A RERUN;COMPARISON OF NATIONAL AND MAINE SAMPLES
Nationwide Sample 1972
Maine Sample 1974
Quite Often 44% 50%
Sometimes 35 15
Rarely 17 18
Never 2 2
NA/DKa 2 4
Depends on Season b 11
a Not Ascertained or Don't Knowb This category was not included in the coding of the nationwide
responses. It is not known how responses of this type were coded in the nationwide survey.
-32-
TABLE 2-15
FREQUENCY OF WANTING TO SEE A PROGRAM A SECOND TIME:COMPARISON OF MAINE AND NATIONWIDE SAMPLES
Nationwide Sample 1972
Maine Sample 1974
Quite Often 22% 21%
Sometimes 39 36
Rarely 30 37
Never 7 3
NA/DKa 2 3
a Not Ascertained or Don't Know

-33-
again, as Table 2-16 shows, the responses of the Maine audience and the
national audience are very similar. Twelve percent of the Maine sample
and 14 percent of the national sample said this happened quite often,
while 35 percent of the Maine sample and 36 percent of the national sam
ple said that it sometimes happened. The major difference occurred in
the "never" category. Only 6 percent of Maine residents said that they
never wished to see a missed program re-run as opposed to 14 percent
of the national sample.
Foreign Language Programs
Survey respondents were asked whether they would be interested in
programs broadcast in a foreign language. Eighteen percent of the sample
said yes, and the language most frequently preferred was French by two-
thirds of respondents preferring a foreign language program. Table 2-17
relates preference for a foreign language program to county of residence.
Preference for foreign language was most prevalent in Androscoggin
county with 31 percent who would like to see such programs. This was
followed by 25 percent of residents in both Hancock and Piscataquis
counties.

TABLE 2-16
FREQUENCY OF MISSING A PROGRAM AND WISHING IT WOULDBE RERUN: COMPARISON OF MAINE AND
NATIONWIDE SAMPLES
Nationwide Survey 1972
Maine Survey 1974
Quite Often 14% 12%
Sometimes 36 35
Rarely 35 44
Never 14 6
NA/DKa 1 3
a Not Ascertained or Don't Know

-35-
WHETHER RESPONDENT WANTS PROGRAMS IN A FOREIGN LANGUAGE BY COUNTY AND ORIGIN OF ANCESTRY
TABLE 2-17
Yes No NA/DKa Total Nb
All Respondents 18%
A. COUNTYAndroscoggin 31Aroostook 21Cumberland 20Franklin/Somerset 7Hancock 25Kennebec 11Knox/Linc./Saga. 13Penobscot/Waldo 16Piscataquis 25Washington 18York 17Oxford 17
B. ANCESTRYU.S.A. 15France 25Canada 26England 12Scandanavia/W.Europe 21 E. Europe 22Other 50
81% 1% 100% 779
66 3 100 8076 3 100 7680 * 100 13893 * 100 4475 • 100 3286 3 100 8187 * 100 4783 1 100 11375 * 100 2082 * 100 2282 1 100 9683 * 100 30
84 1 100 6272 3 100 6473 1 100 15887 1 100 38478 1 100 23378 * 100 2350 * 100 8
* Less than 0.5% a Not Ascertained or Don't Knowb The Sum of the row totals exceeds the total number of respondents
as a respondent could mention two areas from which his/her ancesters came.

-36-
CHAPTER 3
PUBLIC TELEVISION IN MAINE
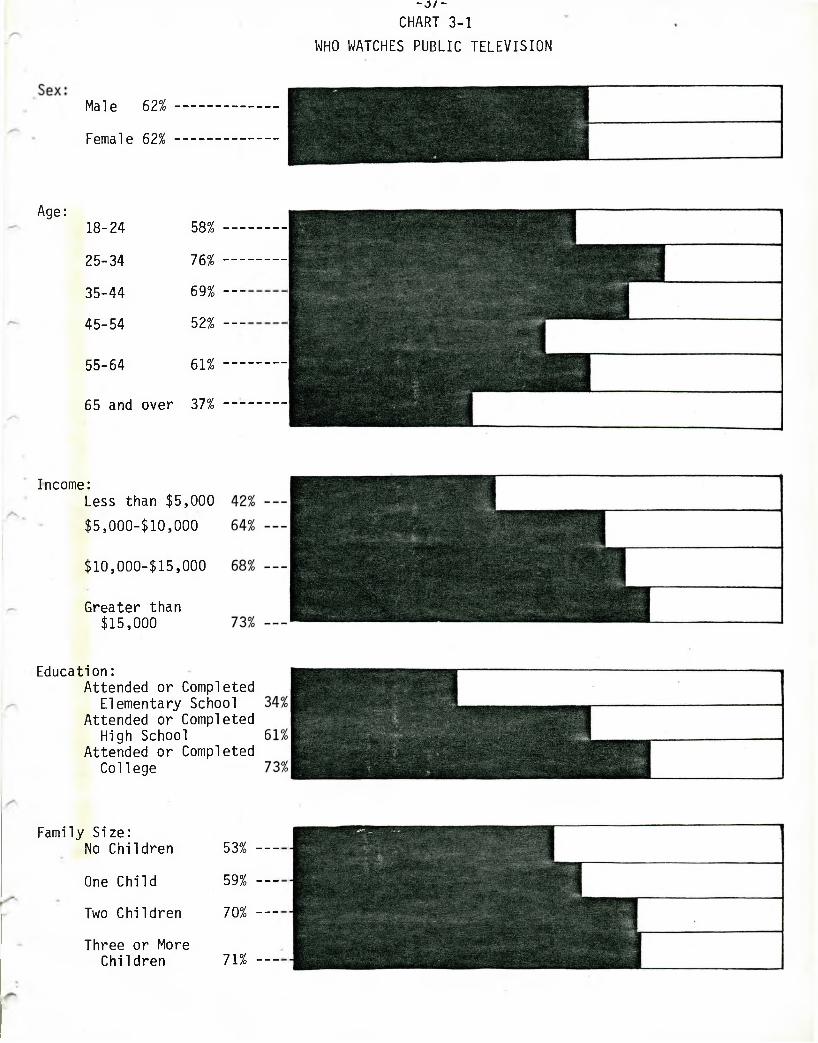
An overwhelming majority of Maine families watch public television.
In response to the question, "Do you or anyone in your family ever
watch a program on Public Television? By Public Television I am re
ferring to non-commercial, educational television," 62 percent of sur
vey respondents said "yes." Chart 3-1 summarizes the audience for public
broadcasting in the State of Maine. First, it is equally distributed
between males and females. In terms of age, the audience tends to be
concentrated among persons age 25 to 44 and falls off greatly among the
elderly. Higher income and better educated persons are also more likely
than others to watch public television. While only 42 percent of those
with incomes below $5,000 watch public television, this increases to 73
percent of those with incomes greater than $15,000.
Education is an even better determinant of public television viewer-
ship. Only about a third of those with elementary school educations
watch public television, while nearly three-quarters of those with at
least some college do so. Another important determinant of public tele
vision viewership is the existence of children in a household. Families
with no children or only one child are less likely than families with
more than one child to watch public television. Table 3-1 breaks down
the audience for public television by several demographic groups. In
addition to those already mentioned, county of residence also tends to
be somewhat important. Most likely to view public television are resi
dents of Cumberland county where 72 percent constitute the audience.
- 3 7 -
CHART 3-1
WHO WATCHES PUBLIC TELEVISION
Male 62%
Female 62%
Age:18-24 58% —
25-34 76% —
35-44 69% —
45-54 52% —
55-64 61% —
65 and over 37% —
Income:Less than $5,000
$5,000-$10,000
$10,000-$15,000
Greater than $15,000
Education:Attended or Completed
Elementary School Attended or Completed
High School Attended or Completed
College
Family Size:No Children 53% —
One Child 59% —
Two Children 70% —
Three or More Children 71% —

-38-
TABLE 3-1
WHETHER RESPONDENT WATCHES PUBLIC TELEVISION BY VARIOUS DEMOGRAPHIC GROUPINGS
Yes No NA/DKa Total Nb
All Respondents 62% 38% * 100% 778
A. AGE18 - 24 60 40 * 100 10725 - 34 77 23 * 100 19335 - 44 69 30 1 100 13945 - 54 53 47 * 100 10555 - 64 61 39 * 100 11265 or over 37 63 * 100 114
B. SEXMale 61 39 * 100 304Female 62 38 * 100 440
C. FAMILY INCOMELess than $5,000 42 58 * 100 150$5,000-$10,000 65 35 * 100 289$10,000-$15,000 69 30 1 100 182More than $15,000 74
D. NUMBER OF CHILDREN
26 * 100 108
AT HOMENone 54 46 * 100 303One 59 41 * 100 128Two 70 30 * 100 136Three or more 71 29 * 100 211
E. EDUCATIONK - 8 34 66 * 100 989 - 1 2 61 39 * 100 422College 76 24 * 100 246
F. OCCUPATIONRetired 47 53 * 100 149Professional 81 19 * 100 96Manager 76 24 * 100. 54Self-Employed 77 23 * 100 51Clerical 74 26 * 100 58Craftsman 54 46 * 100 80Operative 58 42 * 100 64Laborer 62 38 * 100 151Farmer 30 70 * 100 10Miscellaneous 50 50 * 100 65

-39-
TABLE 3-1 (continued)
WHETHER RESPONDENT WATCHES PUBLIC TELEVISION BY VARIOUS DEMOGRAPHIC GROUPINGS
Yes No NA/DKa Total Nb
G. YEARS IN MAINELess than 5 73 27 * 100 835 - 9 70 30 * 100 3710 - 20 70 30 * 100 7320 or more 58 42 * 100 566
H. MARITAL STATUSMarried 66 34 * 100 582Widowed 35 65 * 100 69Divorced 50 50 * 100 42Single 56 44 * 100 72
I. COUNTYAndroscoggin 54 46 * 100 79Aroostook 59 41 * 100 76Cumberland 72 27 1 100 138Franklin/Oxford 55 45 * 100 40Hanc./Waldo/Wash. 59 41 * 100 69Kennebec 65 35 * 100 81Knox/Linc./Saga. 68 22 * 100 47Penobscot 63 37 * 100 98Piscataquis 60 40 * 100 20Somerset 50 50 * 100 34York 55 45 * 100 96
* Less than 0.5% a Not Ascertained or Don't Know b Number of Interviews

-40-
Least likely to view public television are those in Somerset county
where only half of the population watches.
Favorite Programs on Public Television
Survey respondents who replied that they did watch public television
were asked the program or kinds of programs they most enjoyed on public
television. Chart 3-2 contains the response and shows the contrast with
commercial television. The most popular type of public television show
was drama with 18 percent. This was also most popular in commercial
television, although the type of drama offered is somewhat different.
Fourteen percent of public broadcasting viewers mentioned documentaries
as their favorite type of public television program, while only eleven
percent of the sample mentioned documentaries as their favorite type of
commercial television program. Closely matched were the percentages of
viewers who preferred news programs: 12 percent named news as their
public television favorite and 9 percent named news as their commercial
television favorite.
Commercial television shows up higher in terms of comedy which
claims 20 percent of the audience. Few, if any, of the public tele
vision viewers mentioned this as their favorite category. Sports pro
grams were more popular on commercial television than on public television
as were movies and variety shows. On the other hand, 8 percent of the
public television audience mentioned instructional shows, 9 percent
mentioned talk shows, and 8 percent mentioned music as their favorite
programs on public television. None of these categories obtained size
able responses as favorite programs on commercial television.
Table 3-2 shows some significant differences in favorite programs
among the public television audience. Drama shows are somewhat more popular

V . S
CHART 3-2
KINDS OF TELEVISION PROGRAMS MOST ENJOYED
Commercial Television Public Television

TABLE 3-2
FAVORITE KINDS OF PTV PROGRAMS BY AGE, SEX, INCOME AND EDUCATION
Radio Documentary
Drama Sports How To Talk Show Music Other NA/DKa
Total Nb
All Respondents 12% 14% 18% 4% 8% 9% 8% 17% 10% 100% 360
A. Age 18-24 15 11 21 6 2 2 6 24 13 100 4725-34 7 19 16 2 6 6 6 32 6 100 10035-44 15 14 20 5 15 7 5 10 9 100 5945-54 10 12 19 12 8 12 4 10 13 100 4955-64 16 11 17 * 8 19 13 5 11 100 6365 or over 11 16 19 * 8 11 11 13 11 100 37
B. SexMale 16 18 16 6 6 9 5 15 9 100 137Female 10 11 21 1 9 10 10 18 10 100 201
C. Family IncomeLess than $5,000 13 11 15 2 4 11 11 20 13 100 47$5,000-$10,000 11 15 16 6 9 10 8 17 8 100 141$10,000-$15,000 12 20 20 1 9 9 5 16 8 100 91More than $15,000 15 13 22 5 7 8 8 17 5 100 60
D. EducationK - 8 24 24 5 * 9 5 5 24 4 100 219 - 12 13 13 10 5 8 10 6 22 13 100 192College 9 15 30 4 8 8 11 9 6 100 144
* Less than 0.5% a Not Ascertained or Don't Know b Number of Interviews
-42-

-43-
among females than males, and more popular among higher income than lower
income families. The most significant difference, however, is by edu
cation level. Among public television viewers with grade school education,
only five percent found the drama shows to be their favorite on public
television. This increased to 10 percent of those with 9 to 12 years
of education and jumped to 30 percent for those with some college edu
cation. Females also prefer music programs, whereas males, as expected,
are six times as likely to prefer sports programs on public broadcasting.
Preferences for Specific Public Television Programs
Respondents were given a list of programs available on public tele
vision and were asked to tell whether they would like to see more, the
same or less of each type of program. Table 3-3 summarizes these results.
The type of program in greatest demand appears to be documentaries such
as the Public Power Phone-In which was mentioned specifically in the
question. Sixty-seven percent of the public broadcasting audience pre
ferred more of such programs and only 9 percent preferred less. Also
popular with the audience were music programs--62 percent preferred more--
and drama programs--58 percent preferred more. Other programs that a
majority of viewers preferred to see increased included state news and
talk programs.
Least popular among public television offerings was election coverage.
Here, only 27 percent preferred more while 31 percent preferred less of
this type of programming. Sports programs were not extremely popular
since almost as many preferred less as more. It is interesting to note
that University of Maine sports programs were rated somewhat higher than
sports programs in general, and the reason for this appears to relate to

-44-
EXPRESSED PREFERENCES OF THE MAINE PUBLIC TELEVISION AUDIENCE FOR SPECIFIC TYPES OF P.T.V. PROGRAMMING
TABLE 3-3
Type of Programming PrefersMore
Prefers the Same
PrefersLess
NA/DKa
Total
Children's programs 48% 32% 12 8% 100%
State news 53 32 7 8 100
Election Coverage 27 36 31 6 100
Drama programs 58 25 13 4 100
Music programs 62 22 9 7 100
Documentaries 67 19 9 5 100
Sports programs 34 31 31 4 100
Univ. Maine Sports programs 41 31 20 8 100
Talk programs 51 26 18 5 100
a Not Ascertained or Don't Know

-45-
the loyalty of University of Maine alumni and family and friends of Uni
versity of Maine students and alumni throughout the state.
Viewing Times for Public Television
The majority of public television viewers tend to turn on public
television between 4 and 9 P.M. Table 3-4 shows that viewing time pat
terns for public television are similar to those for commercial television,
which were given in Table 2-7 of the last chapter.
A major difference is noted when comparing the turn-off times of
public and commercial television. Some 18 percent of the public tele
vision audience turns off public television before 9 P.M. as opposed to
4 percent of commercial television viewers.
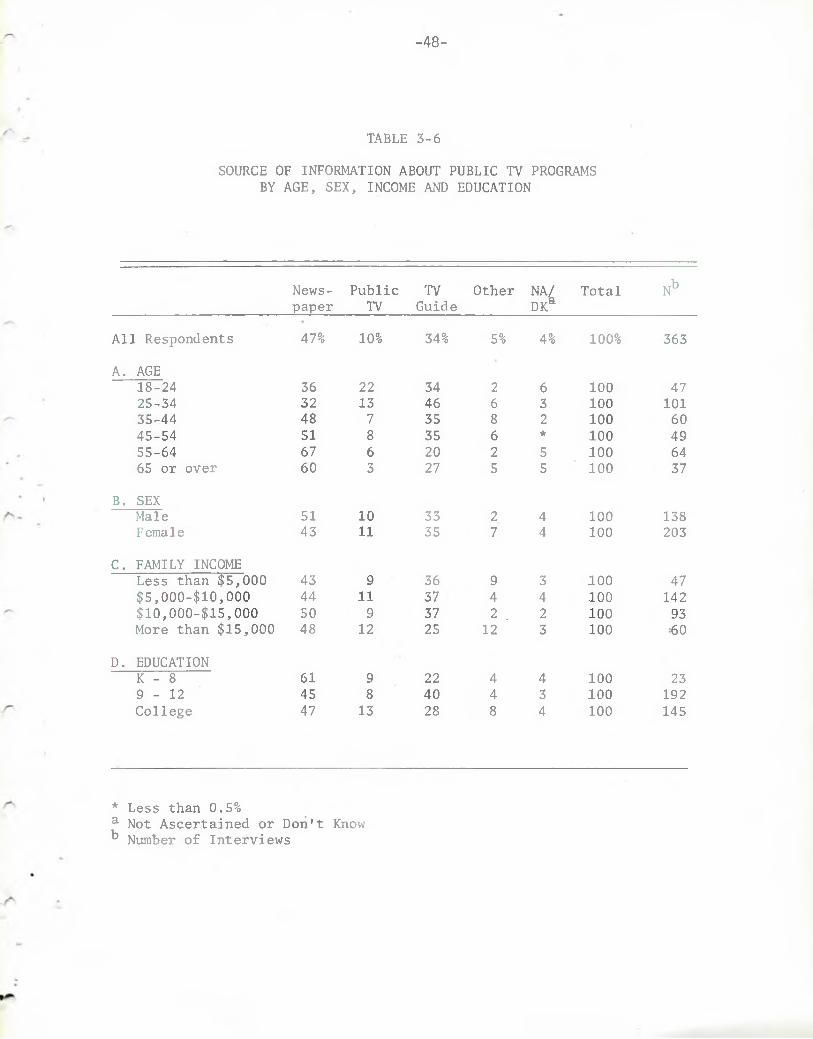
Sources of Information about Public Television Programs
Public television viewers tend to rely primarily upon newspapers
and TV Guide to find out what is appearing on public television. Close
to half of all respondents get this information from the newspaper and
this is more frequently the case among older persons. Better than a
third of the audience for public television finds out about programs
from TV Guide, but this proportion falls off substantially among older
persons.
Maine News and Comment
Among families that constitute the audience for public television in
Maine, some 62 percent watch the program "Maine News and Comment." A
major finding in Table 3-7 is that better educated people are less likely
to watch it than are others. Although there are very small differences
by income, only 56 percent of the college educated audience for public

-46-
table 3-4
TIME OF DAY MOST LIKELY TO WATCH PUBLIC TV BY AGE, SEX, INCOME, NUMBER OF CHILDREN, AND EDUCATION
Morn- 12- 4- ing 3:59 5:59
All Respondents 8% 10% 17%
A. Age18-24 11 11 1925-34 11 12 2835-44 7 17 2045-54 8 4 1155-64 5 6 865 or over 8 3 5
B. SexMale 5 4 15Female 10 13 18
C. Family IncomeLess than $5,000 $5,000-$10,000 $10,000-$15,000 More than $15,000
D. Number of Children
61192
99
1012
13181917
at HomeNone 4 3 8One 9 13 22Two 11 10 29Three or more 14 16 18
E. EducationK - 8 18 9 99 - 1 2 9 12 18College 6 6 17
6-6:59
7- 8- 9- After 7:59 8:59 9:59 10
NA/DKa
Total Nb
19% 12% 15% 3% 2% 14% 100% 361
15 13 15 * 2 14 100 4719 6 8 2 2 12 100 10123 10 13 5 2 3 100 6023 10 21 2 4 17 100 4816 24 19 5 2 15 100 6316 14 24 3 3 24 100 37
20 12 20 6 4 14 100 13720 12 11 1 1 14 100 202
15 11 21 2 2 21 100 4718 12 12 3 2 15 100 14124 10 11 2 2 13 100 9217 15 18 5 5 9 100 60
22 17 24 4 1 17 100 13923 10 8 * 7 8 100 6016 3 11 2 * 19 100 6313 12 11 2 3 11 100 99
5 14 32 * * 13 100 2218 10 13 3 3 14 100 19123 14 17 3 2 12 100 145
* Less than 0.5% a Not Ascertained or Don't Know b Number of Interviews

-47-
HOW LATE PUBLIC TV IS WATCHED BY AGE, SEX, INCOME, AND EDUCATION
TABLE 3-5
Turns off before 9:00 pm
9-9:59
10-10-59
11-11:59
After12
NA/Dk Total Nb
All Respondents 18% 9% 25% 22% 3% 23% 100% 361
A. AGE18-24 32 11 17 17 * 23 100 4725-34 27 6 20 18 3 26 100 10135-44 10 5 27 23 5 30 100 6045-54 11 10 40 23 2 14 100 4855-64 8 11 32 29 3 17 100 6365 or over 5 14 22 32 8 19 100 37
B. SEXMale 14 9 21 26 4 26 100 137Female 19 9 28 20 3 21 100 203
C. FAMILY INCOMELess than $5,000 15 15 21 21 11 17 100 47$5,000-$10,000 20 8 26 21 2 23 100 142$10,000-$15,000 16 8 27 17 2 30 100 92More than $15,000 13 7 27 32 3 18 100 60
D. EDUCATIONK - 8 22 14 23 23 4 14 100 229 - 1 2 20 8 25 21 4 22 100 191College 11 9 27 23 3 27 100 145
* Less than 0.5% a Not Ascertained or Don't Know b Number of Interviews
-48-
SOURCE OF INFORMATION ABOUT PUBLIC TV PROGRAMS BY AGE, SEX, INCOME AND EDUCATION
TABLE 3-6
Newspaper
PublicTV
TVGuide
Other NA/DKa
Total Nb
All Respondents 47% 10% 34% 5% 4% 100% 363
A. AGE18-24 36 22 34 2 6 100 4725-34 32 13 46 6 3 100 10135-44 48 7 35 8 2 100 6045-54 51 8 35 6 * 100 4955-64 67 6 20 2 5 100 6465 or over 60 3 27 5 5 100 37
B. SEXMale 51 10 33 2 4 100 138Female 43 11 35 7 4 100 203
C. FAMILY INCOMELess than $5,000 43 9 36 9 3 100 47$5,000-$10,000 44 11 37 4 4 100 142$10,000-$15,000 50 9 37 2 . 2 100 93More than $15,000 48 12 25 12 3 100 60
D. EDUCATIONK - 8 61 9 22 4 4 100 239 - 1 2 45 8 40 4 3 100 192College 47 13 28 8 4 100 145
* Less than 0.5%Not Ascertained or Don't Know Number of Interviews

-49-
WHETHER RESPONDENT WATCHES MAINE NEWS AND COMMENT BY AGE, INCOME AND EDUCATION
TABLE 3-7
Yes No NA/DKa Total Nb
All Respondents 62% 35% 3% 100% 363
A. AGE18 - 24 53 38 9 100 4725 - 34 56 43 1 100 10135 - 44 65 33 2 100 6045 - 54 59 41 * 100 4955 - 64 72 23 5 100 6465 or over 70 22 8 100 37
B. FAMILY INCOMELess than $5,000 66 26 8 100 47$5,000-$10,000 63 35 2 100 142$10,000-$15,000 54 43 3 100 93More than $15,000 65 30 5 100 60
C. EDUCATIONK - 8 78 18 4 100 239 - 1 2 64 32 4 100 192College 56 41 3 100 145
* Less than 0.5% a Not Ascertained or Don't Know b Number of Interviews

-50-
broadcasting watches "Maine News and Comment," as opposed to 64 percent
with high school education and 78 percent with only a grade school
education. The program is also substantially more popular among
older persons than among the young, which may explain a good deal about
the inverse relationship to education.
It should be noted, however, that the results on this question
may be somewhat misleading. It is possible that some respondents under
stood "Maine News and Comment" to be a type of program rather than
recognizing it as the title of a specific program. In light of the
surprising results that less educated people more often said they watch
"Maine News and Comment," it would be desirable to test the finding's
validity through further survey research designed to avoid the possible
misunderstanding.
Financing Public Television in Maine
Respondents who watch public television were asked how closely they
felt public broadcasting in the state was tied to the University of
Maine. Only 15 percent said "very closely," 31 percent replied" somewhat
closely," and 21 percent said that it was "not closely tied at all." Those
who replied that it was "not closely tied at all" were asked to whom,
in their opinion, public broadcasting was closely tied. Here, 7 percent
said the State of Maine, 3 percent answered Colby, Bates or Bowdoin
College, 2 percent mentioned foundations or the Corporations for Public
Broadcasting, and 9 percent gave other answers. Table 3-8 shows that
perception of the tie between Public Broadcasting and the University of
Maine is highly dependent upon the respondent's location. For example,
25 percent of respondents in Penobscot and Piscataquis counties say that
there is a "close tie," and an additional 36 percent say that

-51-
HOW CLOSELY RESPONDENT THINKS PUBLIC BROADCASTING IS TIED TO UNIVERSITY OF MAINE BY COUNTY
TABLE 3-8
Closely SomewhatClosely
NotClosely
NA/DKa Total Nb
All Respondents 15% 31% 21% 33% 100% 362
A. COUNTYPenobscot/Piscataquis 25 36 16 23 100 56Hancock/Waldo/Washington 17 27 23 33 100 30Aroostook 21 52 14 13 100 29Cumberland 8 25 28 39 100 77York 10 31 21 38 100 39Knox/Kennebec 10 31 26 33 100 51Somerset/Franklin/Oxford 21 29 18 32 100 28Androscoggin/Saga. / Lincoln 15 25 17 43 100 52
ab
Not Ascertained or Don't Know Number of Interviews

-52-
"the tie is somewhat close." This compares with Cumberland county
where only 8 percent said that "the tie is close" and 25 percent said
that it is "somewhat close."
In a related question, all respondents were asked who they felt pays
the major cost of public television in the state. The greatest proportion,
21 percent, felt that private contributions paid the major part of the
cost. An additional 15 percent said that it was state funds, 6 percent
said the sponsors of shows, and only 3 percent said that it was the
University of Maine.
All respondents were asked whether they felt that it was alright for
public television stations to ask their viewers for contributions on the
air. Sixty-two percent of respondents said that they thought this was
a good thing whereas 22 percent that it was bad. Most likely to feel
positively about such solicitation for funds were higher income fami
lies and better educated respondents. Responses also differed by county.
In Cumberland county, where public television stations do, in fact, soli
cit contributions on the air, 75 percent of respondents said that this
was a good idea. In Penobscot county, where such contributions are not
solicited, this proportion dropped down to 56 percent.
When respondents were asked if people like themselves would con
tribute money to public television if asked, more than half said that
they would and only 32 percent definitely said that they would not.
Those who said that they would contribute were asked the reasons for
their contribution, and the most frequent response, mentioned by 40 per
cent of these persons, was that public television was worthwhile. An
additional 25 percent said that they enjoyed public television.

-53-
FEELINGS ABOUT ASKING FOR CONTRIBUTIONS ON THE AIR BY AGE, INCOME, EDUCATION AND COUNTY
TABLE 3-9
Good Bad Other NA/DKa Total Nb
All Respondents 62% 22% 2% 14% 100% 780
A. AGE18 - 24 66 21 1 12 100 10725 - 34 77 12 2 9 100 19335 - 44 65 22 4 9 100 13945 - 54 55 22 3 20 100 10755 - 64 50 29 2 19 100 11165 or over 47 29 3 21 100 115
B. FAMILY INCOMELess than $5,000 54 26 2 18 100 149$5,000-$10,000 61 23 1 15 100 290$10,000-$15,000 67 17 3 13 100 183More than $15,000 72 20 3 5 100 109
C. EDUCATIONK - 8 45 28 2 25 100 989 - 1 2 61 23 2 14 100 421College 70 16 3 11 100 249
D. COUNTYAndroscoggin 68 19 1 12 100 80Aroostook 45 30 3 22 100 76Cumberland 75 14 2 9 100 139Franklin/Oxford 65 15 * 20 100 40Hanc./Waldo/Wash. 58 24 1 17 100 69Kennebec 68 15 5 12 100 82Knox/Linc./Saga. 53 21 7 19 100 47Penobscot 56 29 2 13 100 97Piscataquis 50 35 5 10 100 20Somerset 50 35 * 15 100 34York 65 20 1 14 100 96
* Less than 0.5% a Not Ascertained or Don't Know b Number of Interviews

-54-
CHAPTER 4
PUBLIC RADIO
In the survey that the Social Science Research Institute conducted
for the Maine Public Broadcasting Newtwork, a few questions were included
on public radio. The responses received to these questions are not con
sidered to be as reliable as those received for public television. This
is so for two reasons: First, at the time the survey was conducted, a
major part of the state's population either did not receive the signal
of public radio in the state of Maine or were in areas that were just
beginning to receive the signal. The second reason, which may be closely
related to the first, is that the identity of public radio is not very
well established, and many respondents did not understand what the term
"public radio" meant.
Ownership of FM Radios
In order to ascertain the ultimate size of the audience for public
radio in the State of Maine, all respondents were asked whether they
had an FM radio in their home and in their car. Eighty-four percent
of respondents replied that they had an FM radio in their home, indi
cating that ownership of this appliance is widespread in the State of
Maine. Only 30 percent, on the other hand, said that they had an FM
radio in their automobile.
Table 4-1 shows the distribution of FM car radios in the State of
Maine. The ownership of an FM car radio is somewhat more prevalent
among families earning at least $15,000 a year, but does not seem to
be greatly influenced by the level of education or by age.

N^
764
110193136105108102
137285185107
93408251
-55-
FM CAR RADIO OWNERSHIP BY AGE, INCOME AND EDUCATION
TABLE 4-1
Yes No NA/DKa Total
All Respondents 30%
A. AGE18 - 24 2725 - 34 3035 - 44 3345 - 54 3755 - 64 2765 or over 28
B. FAMILY INCOMELess than $5,000 22$5,000-$10,000 31$10,000-$15,000 32More than $15,000 38
C. EDUCATIONK - 8 309 - 1 2 30College 32
67% 3% 100%
72 1 10069 1 10067 * 10058 5 10071 2 10064 8 100
74 4 10066 3 10068 * 10061 1 100
63 7 10067 3 10068 * 100
* Less than 0.5%Not Ascertained or Don't Know Number of Interviews

-56-
Who Listens to Public Radio
All told, 28 percent of survey respondents claim that they are a
regular or frequent listener to public radio. Those with higher incomes
were more likely to be frequent listeners, but strangely, education
appeared to make very little difference. A major difference was found
by county as shown in Table 4-2D. Forty-six percent of respondents from
Aroostook county appeared to listen to public radio as contrasted with
only 21 percent of residents of Franklin, Somerset, Oxford and York
counties. When listeners to public radio were asked which programs they
have listened to recently, 35 percent specifically mentioned music
programs and 8 percent mentioned Maineline.
Public radio listeners were asked which additional programs they
would like to hear on public radio. Most frequently mentioned was
music with 26 percent of the total. Nearly half of the total could
think of no additional programs that they would like to hear. Table
4-3 shows few striking differences among public radio audience sub
groups in terms of additional programs they would like to hear.

-57-
WHETHER RESPONDENT IS REGULAR LISTENER TO PUBLIC RADIO BY AGE, SEX, INCOME, EDUCATION AND COUNTY
TABLE 4-2
Yes No NA/DKa Total Nb
All Respondents 28% 68% 4% 100% 717
A. AGE18 - 24 34 64 2 100 10725 - 34 24 73 3 100 18935 - 44 29 69 2 100 13445 - 54 34 61 5 100 9755 - 64 30 67 3 100 9465 or over 18 73 9 100 88
B. SEXMale 28 70 2 100 288Female 26 70 4 100 398
C. FAMILY INCOMELess than $5,000 28 64 8 100 128$5,000-$10,000 25 72 3 100 263$10,000-$15,000 27 71 2 100 177More than $15,000 35 62 3 100 107
D. EDUCATIONK - 8 27 67 6 100 859 - 1 2 28 68 4 100 385College 28 70 2 100 236
E. COUNTYAndroscoggin 38 59 3 100 76Aroostook 46 51 3 100 63Cumberland 24 73 3 100 129Fran./Som./Oxford 21 76 3 100 68Hanc./Waldo/Wash. 22 73 5 100 62Kennebec 29 64 7 100 76Knox/Line./Saga. 30 68 2 100 44Penob./Pisca. 26 69 5 100 108York 21 77 2 100 91
ab
Not Ascertained or Don't Know Number of Interviews

TABLE 4-3
ADDITIONAL TYPES OF PROGRAMS DESIRED ON PUBLIC RADIO BY AGE, SEX, INCOME AND EDUCATION
No Extra Sports Music NewsDocument .
Lectures Other NA/DKa Total Nb
All Respondents 8% 3% 26% 4% * 2% 9% 48% 100% 230
A. AGE18 - 24 * 3 20 2 * 2 5 68 100 4125 - 34 15 2 29 2 * * 16 36 100 5235 - 44 9 5 20 2 * 5 11 48 100 4445 - 54 5 * 36 8 3 * 5 43 100 3955 - 64 10 3 39 3 * 3 10 32 100 3165 or over 9 9 9 9 * 5 * 59 100 22
B. SEXMale 3 3 20 6 1 2 7 58 100 90Female 11 3 29 3 * 1 10 43 100 121
C. FAMILY INCOMELess than $5,000 5 5 26 2 * 2 9 51 100 43$5,000-$10,000 8 4 26 4 * 1 9 48 100 77$10,000-$15,000 13 2 25 6 ★ 4 8 42 100 53More than $15,000 7 * 28 5 * * 10 50 100 42
D. EDUCATIONK - 8 * 3 21 4 4 * 11 57 100 289 - 12 9 2 27 4 * 3 10 45 100 121College 10 4 24 4 * 3 6 49 100 78
* Less than 0.5% a Not Ascertained or Don't Know b Number of Interviews

-59-
APPENDIX
QUESTIONS USED FOR SURVEY

-60-
C.
PUBLIC BROADCASTING
Cl. If you got conflicting or different reports on the seme news story fromradio, television, magazines and the newspapers, which of the four versions would you be most inclined to believe- the one on radio, television, magazines or newspaper's?
Radio |2. Television 3. Magazine 4. Newspaper
5. Other (Specify)
C2. What television network to you generally watch for national news--CBS,NBC or ABC?
1. CBS 2. NBC 3 ABC 4. Don' t watch 5. No TV--(Go to Q. C51,P. C6)national news
C3. What television station do you g e n e r a l l y watch for local or state news? Is it CBS, NBC, ABC, the Maine Public Broadcasting Station, or what?
1. CBS; 2. NBC: 3. ABC 4. Public Television
5. Other (Specify)
C4. How often do you turn on a television program and find that it is a repeat or a re-run of a program you have already seen--quite often, sometimes, or rarely?
1. Quite Often; |2. Sometimes: 3. Rarely 4. Never;
3. Depends on season; 6. Don't know
C5. How often have you seen a program that you liked and wished it would bere-run so that you could see it a second time? Often, sometimes, or rarely?
__Often; 2. Sometimes 3. Rarely 4. Never;
C6. How often have you missed television programs you wanted to see and wished they would be run again so that you could see them? Quite often, sometimes, rarely?
1. Often; 2. Sometimes 3J___Rarely 4. Other
C7. What programs or kinds of programs do you most enjoy on commercial television?

-61-
C-2
C8. Do you or anyone in your family ever watch a program on Public Television?By Public Television I am referring to non-commercial educational television.
l. Yes 5. No -- (Go to Q. C39, P. C-4)
C9. On an average day, about how long do you personally spend watching Public Television?
C1O. (If never) Who in your home does watch Public Television?
l. Other adult only 2. Other adult & children 3. Children only(Go to Q. C39, P.C-4)' (Go to Q. C34, P. C-4) (G0 to Q. C34, P. C-4)
Cll. What programs or kinds of programs do you most enjoy on Public Television?
Cl 2. What other programs or kinds of programs do you watch regularly or occasionally on Public Television?
C13. In your opinion, what is it that Public Television offers you that is not available on commercial television?
Would you like to see more or less of these programs on Public Television?
C14. Children's programs? 1 . 3. 5.
C15. How about state news? l. 3.\
5.
C16. How about election coverage? 1 . 3.i
5.
C17. How about drama programs? 1 . 3. 5.
C18. How about music programs? i. 3. 5.
C19. How about documentaries, such as public power phone-in?
i1 . 3.
i
5.
C20. How about sports programs? 3. 5.
1. More 3. The Same 5. Less

C-3
-62-
1. More 3. The Same 5. Less
C21. How about University of Maine sports programs? 1 . 3. 5.
C22. How about talk programs, such as Buckley and Susskind? l. 3. 5.
C23. Do you think that overall Public Television leans too much to the left politically, or too much to the right politically, or that on the whole there is a proper balance between them.
l. Left politically 3. Proper balance 5. Right politically
C24. In your mind, how closely is Public Broadcasting in the state tied to the University of Maine?
1. Very closely 3. Somewhat closely, 5. Not close at all(Go to Q. C26)
C25. Who, in your opinion, is Public Broadcasting closely tied to?
C26. What times of the day would you be most likely to turn on your television?
C27. What times of the day would you be most likely to turn on the Public Television Station?
C28. Generally, how late in the evening do you watch television?
C29. How late do you watch Public Television? _________________
C30. Do you watch Maine News and Comment?
l. Yes 5. No!

-63-
C-4
C31. How do you find out about what is appearing on Public Television?-- Newspaper, Public Television, TV Guide, Other.
l. Newspaper! 2. public television 3. TV Guide 4 .________Other (Specify)
(Go to Q. C33)
C32. Which newspaper? ___ _____________________________
C33. If you happen to remember, please tell me the name of programs viewed by anyone in your household within the last week on Public Television.(list in order mentioned)
C34. Do you have children living at home who watch Public Television?
l. Yes 5.No -- (Go to Q. C39)
C35. How often do your children watch Public Television?--Quite often, sometimes,
rarely, never? _________________ _____________ ____________11. Quite often 2. Sometimes 3. Rarely 4. Never, -- (Go to Q. C39)
C36. Do you recall any of the Public Television programs that they watch?
l. Sesame Street [2. Zoom, 3. Electric Company 4. Mr. Rogers
5. Other (Specify) _______________________________
C37. Do you watch any of these programs with the children?
,1. Yes 5. No
C38. Would you like to see children's television on Saturday or Sunday
programsmorning?
such as Sesame Street put on
Yes 3. Undecided 5 .
C39. Do you feel that parents should children watch on television?
supervise the kinds of programs their
1. Yes; ,3. Undecided |5 • No

C-5
-64-
C40. Do you think a parent ought to protect children from television programs that deal with violence or sex in a shocking way?
1. Yes 3. Undecided 5. No
C41 . Do you think with letters
thatsuch
programs on television as GP, R or X?
should be rated as are movies
1. Yes; 3. Undecided i5. No
C42. As you may know, some public television stations ask their viewers for contributions on the air. Do you think this is a good thing, a bad thing, or what?
1. A good thing; 3. A bad thing 5. Other (Specify);
C43. Do you think that people like yourself would contribute money to Public Television if asked?
1. Yes; 3 . Undecided 5. No (Go to Q. C44)
Note: if contributed, please check
C43a. What are the reasons that you would contribute? ____
C44. By the way, who do you feel pays the major cost of Public Television in this state?
C45. Would you be interested in programs broadcasted in a foreign language?
1. Yes 5. No -- (Go to Q. C47)
C46. What language would you most like?
1. French 3. German 5. Spanish 6. Other (Specify)
C47. What kinds of television programs, in addition to those offered now, would you like to see on the air?
-65-
C-6
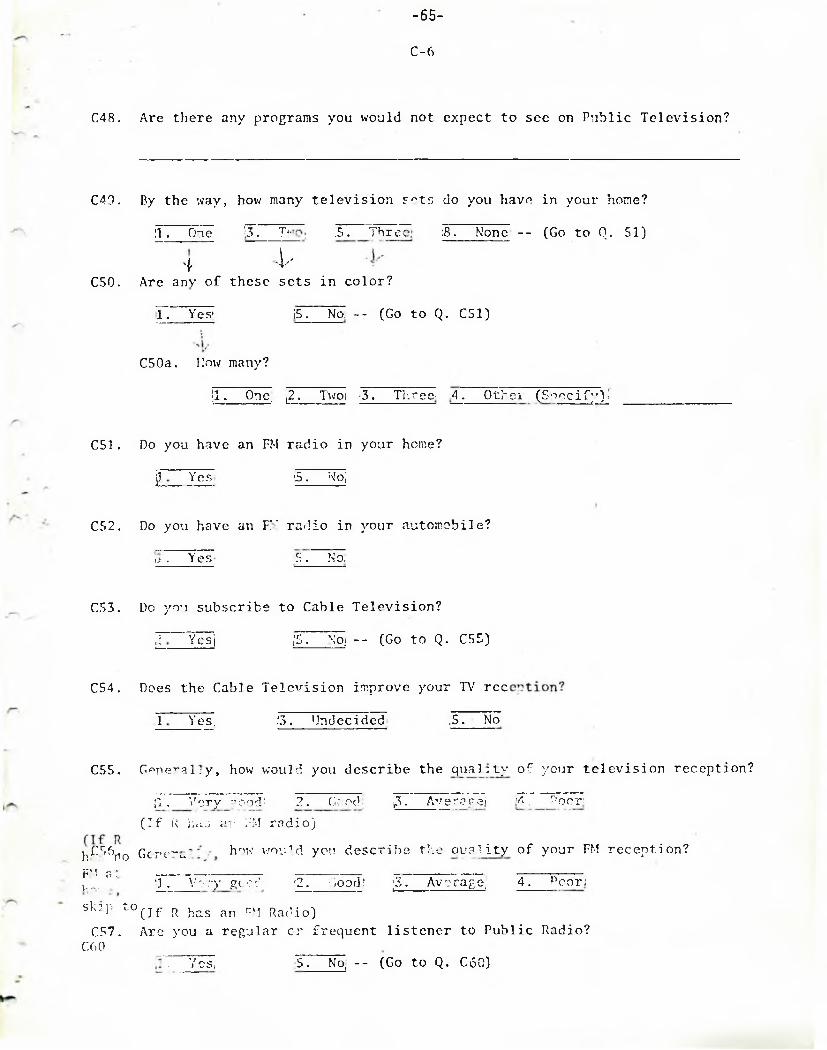
C48. Are there any programs you would not expect to see on Public Television?
C40. By the way, how many television sets do you have in your home?
l. One 3. Two 5. Three :8. None -- (Go to Q 51)
C50. Are any of these sets in color?
1. Yes 5. NO: -- (Go to Q. C51)
C50a. How many?
l. One. 2. Two 3. Three :4. Other (Specify)
C51 . Do you have an FM radio in your heme?
Yes 5. No
C52. Do you have an FX radio in your automobile?
1 . Yes 5. No
C53. Do yon subscribe to Cable Television?
1 Yes 5. No -- (Go to Q. C55)
C54. Does the Cable Television improve your TV rec
1 Yes, ?3. Undecided ,5. No
C55. Generally, how would you describe the quality of your television reception?
|1 . Very good 2. Good 3. Average|(If R has an FM radio)
RC56p0 Generallyhow would you describe the quality of your FM reception?FM : — ----------------------- --------------- -------- 1. Very good ;2. Good 3. Average 4. Poor
skip to(If R has an FM Radio)C57. Are you a regular or frequent listener to Public Radio?
C60. Yes, 5. No, -- (Go to Q. C60)

C58. What programs have you listened to recently?
C 5 9 .
C60.
C61.
What programs would you like to hear on Public Radio?
If you could influence directly the people who make decisions regarding television and radio programs, what would yOU like to tell them?
Would you say that broadcasting in Maine is doing a good job, an average job, or a poor job?
,1. Good j o b 2 . Average J o b 4. Poor jo b