Embed Size (px)
Citation preview
Paper ID #10969
The Attitudes of Elementary Teachers towards Elementary Engineering (re-search to practice)
Dr. Cathy P. Lachapelle, Museum of Science
Dr. Cathy Lachapelle is the director of research and evaluation for EiE. She leads the assessment effortsfor the EiE curriculum, designing assessment instruments, pilot and field testing them, and conductingresearch on how children use the EiE materials. She has worked on a number of research and evaluationprojects related to K-16 STEM education, including the Women’s Experiences in College Engineering(WECE) study of factors influencing the persistence of undergraduate women in engineering schools.She is particularly interested in how students learn science, engineering, and mathematics through collab-orative interaction and through scaffolded experiences engaging in disciplinary practices. Cathy receivedher S.B. in cognitive science from MIT, and her Ph.D. in psychological studies in education from StanfordUniversity.
Jonathan D Hertel, Engineering is Elementary, Museum of Science, BostonMr. Muhammad Faiz Shams, Museum of Science - EiE
Muhammad Shams is a research and evaluation associate, working for the Engineering is Elementary(EiE) curriculum development group based in the Boston Museum of Science. He graduated from theUniversity of Massachusetts, Dartmouth with a B.S. in mathematics. Prior to joining EiE, he worked as aresearch assistant in the field of numerical analysis, focusing on computational mathematics topics suchas Improving Fourier Transform approximations and Radial Basis Function (RBF) interpolation. With theEiE team, Muhammad is responsible for data collection, data analysis, and reporting research.
Mr. Chris San Antonio, Museum of Science, Boston
Chris is a Senior Research & Evaluation Associate at Engineering is Elementary (EiE), located within theMuseum of Science, Boston. Before joining the research team, he worked in the school districts of NewHampshire and Vermont as a teen drop-out prevention specialist. He also brings experience in focus groupfacilitation, survey design, and data analysis. At EiE, he supports the development of research initiativesdesigned to improve our understanding of how elementary students best learn science and engineering.He received his BA in Psychology from Saint Michael’s College and his Ed.M. in Education Researchfrom the Harvard Graduate School of Education.
Dr. Christine M Cunningham, Museum of Science
c©American Society for Engineering Education, 2014
Page 24.1188.1
The Attitudes of Elementary Teachers towards
Engineering
This material is based upon work supported by the National Science Foundation under Grant No. 1220305. Any opinions, findings, and conclusions or recommendations expressed in this material are those of the author(s) and do not necessarily reflect the views of the National Science Foundation.
Page 24.1188.2
Introduction
With the new Next Generation Science Standards (NGSS) [1], elementary teachers are called for the first time to teach engineering to their students. For the teachers themselves, as well as those working to provide curriculum and professional development to elementary school teachers in engineering, this is both an opportunity and a challenge. Adoption of engineering curricula and pedagogies, although necessary to meet the new standards, will be affected by teachers’ attitudes towards the new, unfamiliar subject area.
Examining teachers’ attitudes about engineering education would provide invaluable background information. For groups offering curricula and professional development aligned with the NGSS, this information would help develop interventions specifically designed to address challenges arising from teachers’ attitudes about the newly required subject area. One other instrument currently exists to measure teachers’ attitudes towards engineering; we drew from this instrument but also added questions focusing on pedagogy and enjoyment of teaching engineering. Our goal is, in particular, to detect changes in attitudes due to a curriculum and professional development intervention. Thus, in this paper we ask:
1. How can we design an instrument to measure teachers’ attitudes about engineering? 2. What are the psychometrics and scales for this instrument? 3. What elementary school teacher attitudes about engineering education are revealed by
this instrument? 4. Can this instrument show changes in attitudes due to an intervention?
Literature Review
We reviewed and used several existing instruments looking at teacher attitudes towards science and/or engineering to create the Teacher Attitudes Survey instrument tested and discussed in this paper. We found only one instrument designed to examine teachers’ attitudes towards engineering [2]. This instrument was designed to look at trends in attitudes in the teacher population towards teaching Design, Engineering, and Technology (DET), and is referred to as the DET Teacher Survey. The authors found that elementary teachers were less interested in teaching DET than teachers of upper grades, that less experienced teachers were less interested in teaching DET, and that women saw DET as more valuable to their students than men. A later re-evaluation of the DET instrument with a new sample of teachers suggested a new interpretation of factors but was largely consistent with the original instrument [3].
An additional 2011 research study using the DET Teacher Survey sampled only elementary school teachers. With a sample of 192 teachers drawn from teachers who volunteered to participate in DET professional development, they administered the DET Teacher Survey before teachers engaged in the professional development workshops. In contrast to the results cited earlier, they did not find effects of experience or gender [4]. This may be due to their contrasting
Page 24.1188.3
sample of teachers who had already expressed interested in learning to teach DET in their classrooms.
A second instrument was created in 2002, and was designed to measure the attitudes of pre-service teachers towards science and mathematics, as well as their beliefs about those subjects [5]. This instrument was used to contrast the attitudes of pre-service student teachers in a special program with those of student teachers not in that program; it was also used to examine how attitudes and beliefs of the teachers within the program changed over time.
The third instrument from which we drew heavily in the development of our Teacher Attitude Survey (TAS) was designed to diagnose negative attitudes towards science among elementary school teachers, with the theory that teachers with more negative attitudes may have a negative influence upon their students’ interest, and possibly achievement, in science. This research found that elementary school teachers sampled did not hold negative attitudes towards science, though their attitudes were not always aligned either with those expressed in popular culture or in science education literature [6].
Methodology
Instrument Development
For the development of the TAS instrument, we drew from instruments published and available in the literature [2], [5], [6]. The purpose was to expand upon existing instruments, so as to create an instrument particularly suited for gauging changes in elementary teacher attitudes that may result from participation in professional development designed to increase their capacity to teach engineering. We began with a theory of how teachers would respond to questions, and therefore, after testing for reliability of our scales, we chose to use Structural Equations Modeling (SEM) to confirm the underlying constructs we had theorized.
SEM is a form of factor analysis used to confirm a supposed model. SEM is used to measure unobserved (latent) variables, using observed (manifest) variables and the covariance structure of their interactions. SEM combines path analysis, used to lay out structure, with the analysis of covariance, for determining factor loading and model fit [7]. The end result of a SEM analysis is a statistical model that can support the hypothesis of a priori scale construction. The purpose of carrying out SEM was to gain a cohesive look at the structure of the TAS instrument, to assess its validity and its usefulness.
The data gathered by the TAS instrument is measured on a 5 point Likert scale, questions ranging from Strongly Disagree to Strongly Agree. Likert data is categorical and thus cannot be assumed to be normally distributed. SEM operates under the assumption that data is normal or roughly normal. However, the Weighted Least Squares Estimator (WLSMV) Method of the
Page 24.1188.4
Mplus statistical program is used to alleviate this violation of normality [8]. More information on our use of this method is given in the subsequent Procedure section.
Analysis
To characterize our teacher populations before and after professional development, we analyzed the scales using t-tests. Some items were of interest on their own—not as part of a scale—and were therefore analyzed separately, again with t-tests.
Procedure
Instrument Development
Development of the Teacher Attitude Survey (TAS) was an iterative process. We began with a literature review and discovered few teacher attitudes instruments dealing with engineering education. Existing attitudes instruments were, with the exception of the DET, focused primarily on teacher attitudes toward science or math. After verifying the internal consistency of identified instruments, we decided to use questions and scales from these instruments, changing the referents to engineering, on the initial draft of our survey [2], [5], [6]. We also included some items from an Engineering is Elementary (EiE) student attitudes survey [9]. Finally, we included items from an EiE workshop evaluation survey which was designed to collect attitudes data from teachers involved in EiE professional development. This workshop evaluation survey was developed for Engineering is Elementary by Horizon Research, Inc. (HRI).
Items pulled from preexisting instruments were altered to fit our purposes. The most common modification to an item involved replacing individual words like “math” or “science” with “engineering.” This allowed us to use an item designed to gather data on attitudes towards science or mathematics for our purposes of measuring attitudes towards engineering. While pulling items from various sources, we paid special attention to the Cronbach’s alpha reliability score, which is a measure of the statistical reliability of a scale, and the content validity of the scale in which that item functioned. For scales with high reliability and content validity, we borrowed the entire scale. For those with lower reliability and/or content validity, we borrowed items and added new items in order to form newer, more reliable and valid scales. After we compiled a bank of possible items to use, we organized them into constructs. We grouped items by considering both how they functioned previously in a scale, but also how they fit into a particular construct. Items that did not fit into the constructs that we devised for our instrument were eventually omitted. The constructs listed in Table 1 framed our early versions of the TAS. P
age 24.1188.5
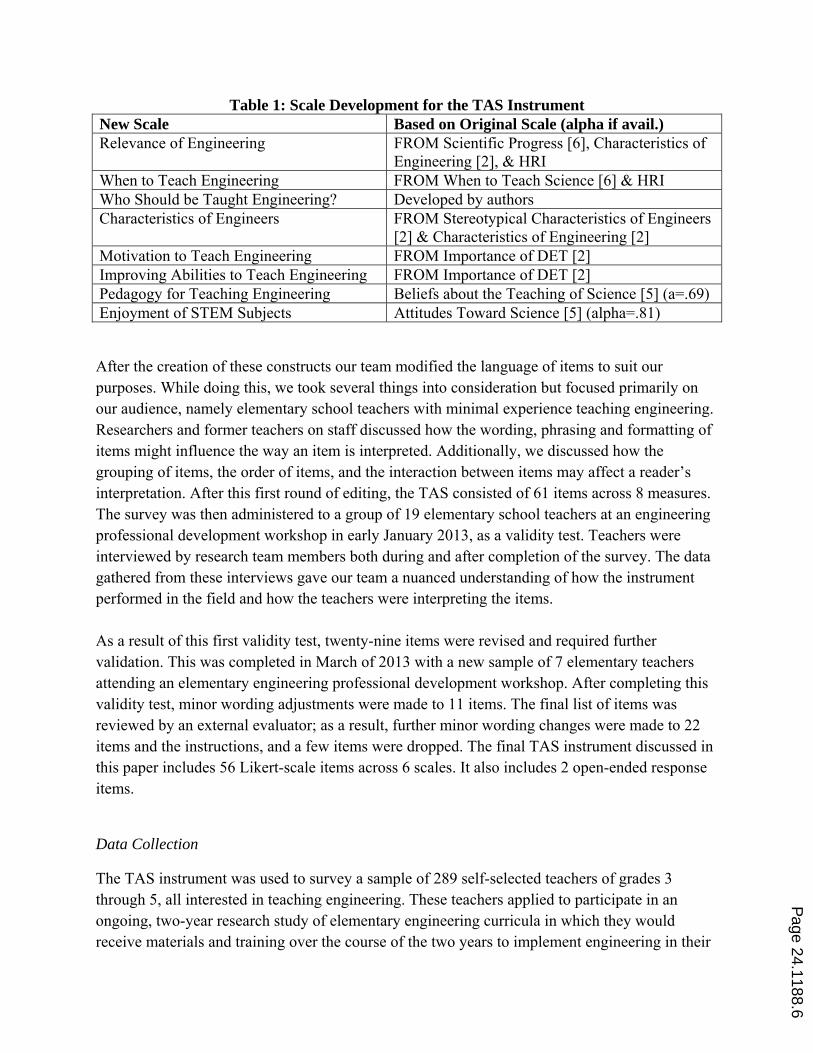
Table 1: Scale Development for the TAS Instrument New Scale Based on Original Scale (alpha if avail.) Relevance of Engineering FROM Scientific Progress [6], Characteristics of
Engineering [2], & HRI When to Teach Engineering FROM When to Teach Science [6] & HRI Who Should be Taught Engineering? Developed by authors Characteristics of Engineers FROM Stereotypical Characteristics of Engineers
[2] & Characteristics of Engineering [2] Motivation to Teach Engineering FROM Importance of DET [2] Improving Abilities to Teach Engineering FROM Importance of DET [2] Pedagogy for Teaching Engineering Beliefs about the Teaching of Science [5] (a=.69) Enjoyment of STEM Subjects Attitudes Toward Science [5] (alpha=.81)
After the creation of these constructs our team modified the language of items to suit our purposes. While doing this, we took several things into consideration but focused primarily on our audience, namely elementary school teachers with minimal experience teaching engineering. Researchers and former teachers on staff discussed how the wording, phrasing and formatting of items might influence the way an item is interpreted. Additionally, we discussed how the grouping of items, the order of items, and the interaction between items may affect a reader’s interpretation. After this first round of editing, the TAS consisted of 61 items across 8 measures. The survey was then administered to a group of 19 elementary school teachers at an engineering professional development workshop in early January 2013, as a validity test. Teachers were interviewed by research team members both during and after completion of the survey. The data gathered from these interviews gave our team a nuanced understanding of how the instrument performed in the field and how the teachers were interpreting the items. As a result of this first validity test, twenty-nine items were revised and required further validation. This was completed in March of 2013 with a new sample of 7 elementary teachers attending an elementary engineering professional development workshop. After completing this validity test, minor wording adjustments were made to 11 items. The final list of items was reviewed by an external evaluator; as a result, further minor wording changes were made to 22 items and the instructions, and a few items were dropped. The final TAS instrument discussed in this paper includes 56 Likert-scale items across 6 scales. It also includes 2 open-ended response items.
Data Collection
The TAS instrument was used to survey a sample of 289 self-selected teachers of grades 3 through 5, all interested in teaching engineering. These teachers applied to participate in an ongoing, two-year research study of elementary engineering curricula in which they would receive materials and training over the course of the two years to implement engineering in their
Page 24.1188.6
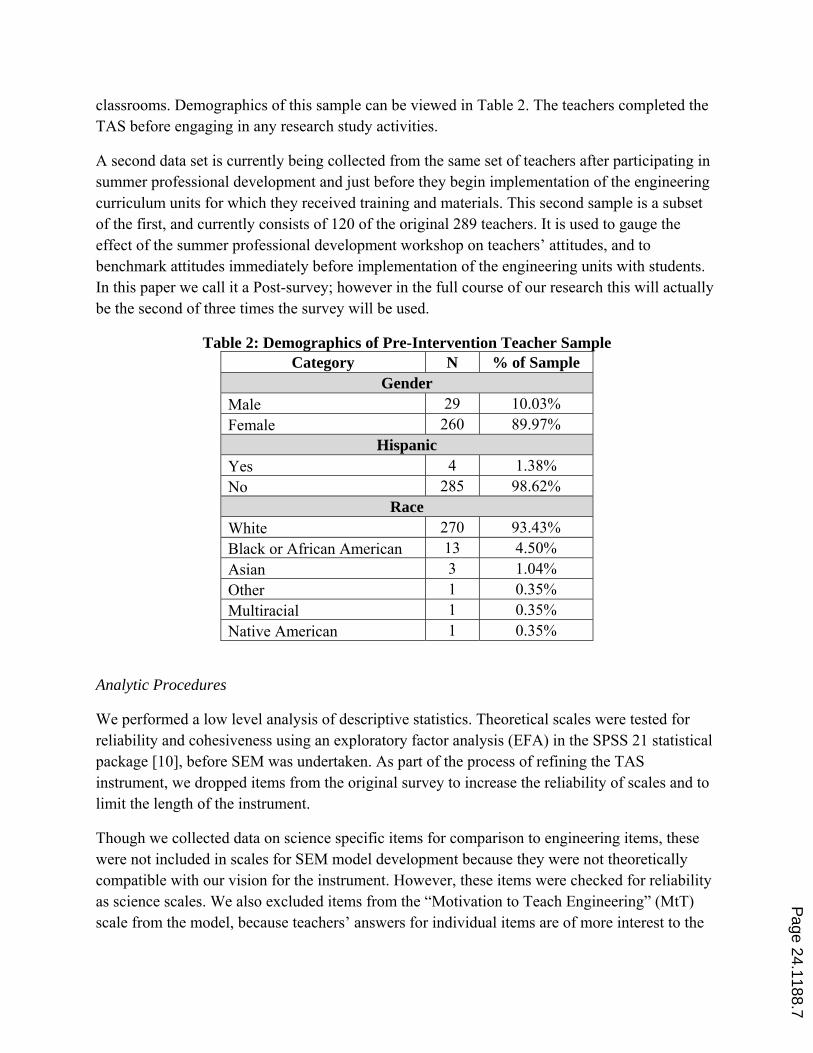
classrooms. Demographics of this sample can be viewed in Table 2. The teachers completed the TAS before engaging in any research study activities.
A second data set is currently being collected from the same set of teachers after participating in summer professional development and just before they begin implementation of the engineering curriculum units for which they received training and materials. This second sample is a subset of the first, and currently consists of 120 of the original 289 teachers. It is used to gauge the effect of the summer professional development workshop on teachers’ attitudes, and to benchmark attitudes immediately before implementation of the engineering units with students. In this paper we call it a Post-survey; however in the full course of our research this will actually be the second of three times the survey will be used.
Table 2: Demographics of Pre-Intervention Teacher Sample Category N % of Sample
Gender Male 29 10.03% Female 260 89.97%
Hispanic Yes 4 1.38% No 285 98.62%
Race White 270 93.43% Black or African American 13 4.50% Asian 3 1.04% Other 1 0.35% Multiracial 1 0.35% Native American 1 0.35%
Analytic Procedures
We performed a low level analysis of descriptive statistics. Theoretical scales were tested for reliability and cohesiveness using an exploratory factor analysis (EFA) in the SPSS 21 statistical package [10], before SEM was undertaken. As part of the process of refining the TAS instrument, we dropped items from the original survey to increase the reliability of scales and to limit the length of the instrument.
Though we collected data on science specific items for comparison to engineering items, these were not included in scales for SEM model development because they were not theoretically compatible with our vision for the instrument. However, these items were checked for reliability as science scales. We also excluded items from the “Motivation to Teach Engineering” (MtT) scale from the model, because teachers’ answers for individual items are of more interest to the
Page 24.1188.7

research project, especially in comparison to items relating to “Motivation to Teach Science”, than the combined score of their answers on a composite scale.
The model of the TAS instrument was constructed in Mplus [11] for Confirmatory Factor Analysis with SEM. Scales used in the final model are shown in EFA confirmed that each
theoretically identified scale formed a cohesive unit of a single factor, and that internal reliability, measured by Cronbach’s alpha, was acceptable or good (alpha >.7 is considered good). Alphas are reported in Table 3. Characteristics of items loading onto each scale are
described in
Table 4.
Table 3, with items for those scales listed in
Table 4.
Findings
The Instrument
EFA confirmed that each theoretically identified scale formed a cohesive unit of a single factor, and that internal reliability, measured by Cronbach’s alpha, was acceptable or good (alpha >.7 is
considered good). Alphas are reported in Table 3. Characteristics of items loading onto each scale are described in
Table 4.
Table 3: TAS Scales and Their Characteristics Scale
Abbrev. Scale Name
N of Items
Cronbach’s Alpha
RoE Relevance of Engineering 4 .695 Ped Pedagogy for Teaching Engineering 4 .793 Enj Enjoyment of STEM Subjects 4 .733
WtTsE When to Teach Engineering 6 .764 SoE Characteristics of Engineers 6 .732
IAtTE Improving Abilities to Teach Engineering 6 .903
Before assessing fit statistics it is important to verify whether the items themselves strongly reflect the underlying concepts in question. Although a model may be statistically suitable with high goodness of fit, it must also be rooted solidly in the theory of the claims being tested by the research question. To assess the strength of the model, we look at the factor loadings of each item. Standardized factor loadings between 0 and 0.4 explain a small amount of variance.
Page 24.1188.8

Between 0.4 and 0.7 they are well loaded, explaining up to fifty percent of the variance. Between 0.7 and 1 they explain a large amount of variance.
Page 24.1188.9
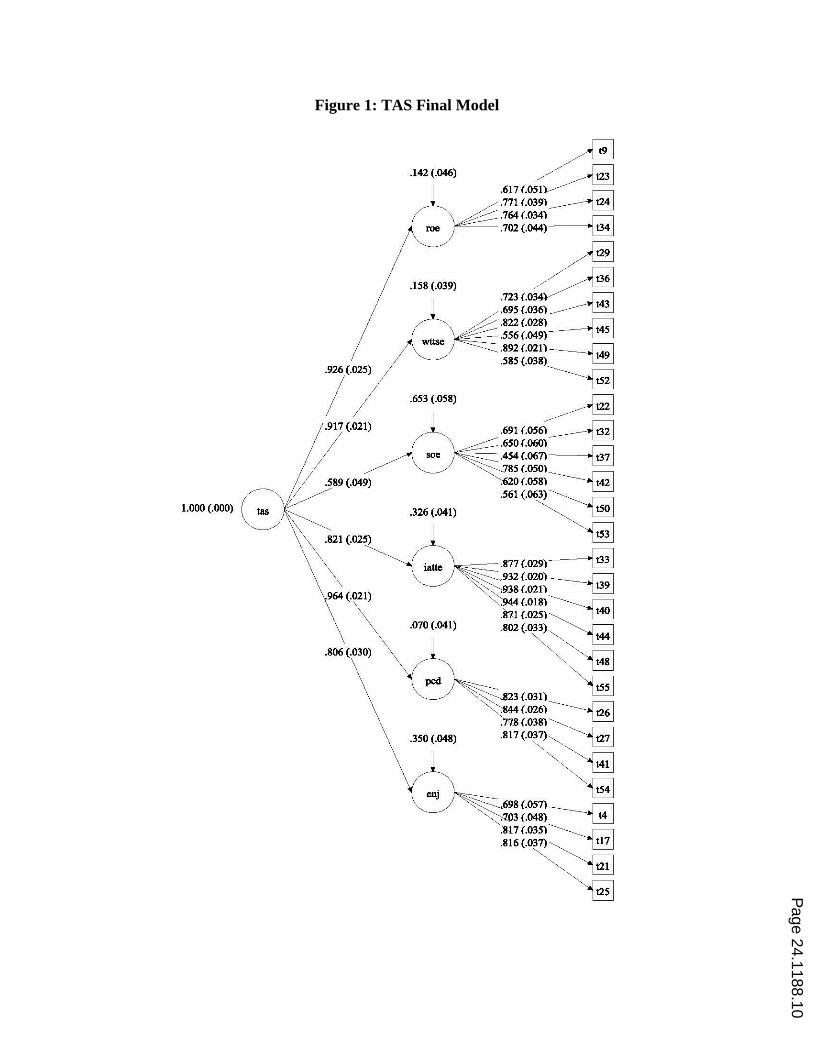
Figure 1: TAS Final Model
Page 24.1188.10
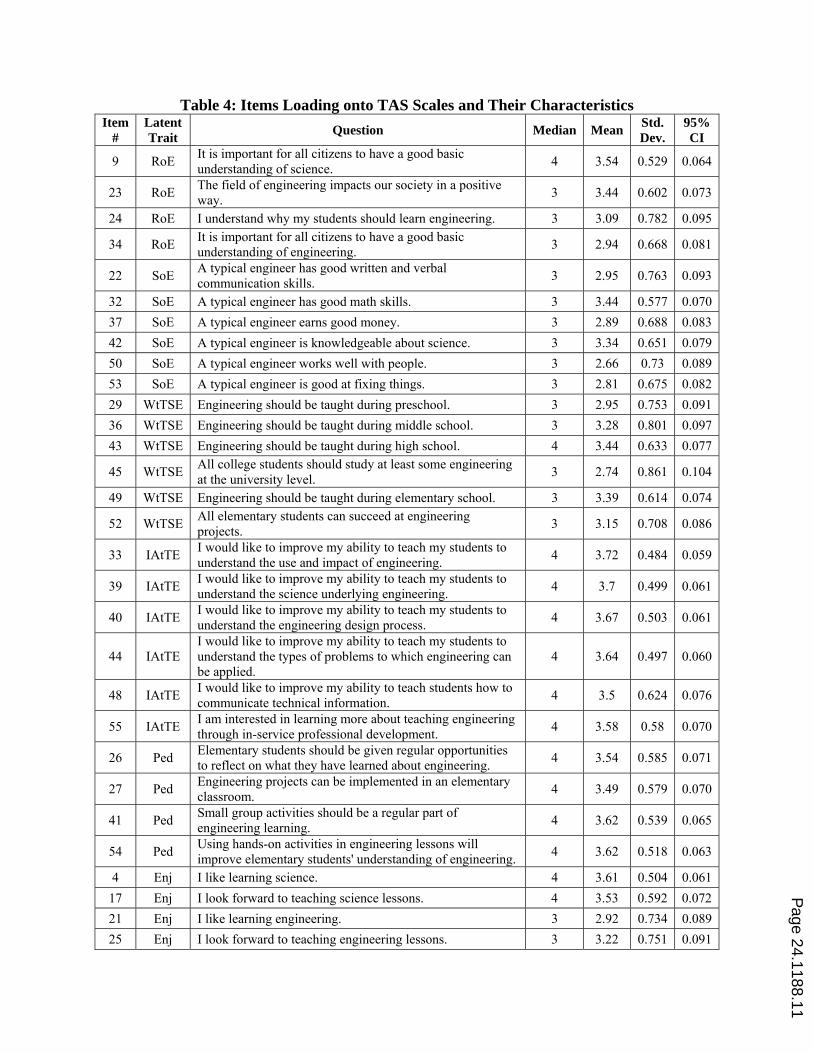
Table 4: Items Loading onto TAS Scales and Their Characteristics Item
# Latent Trait
Question Median Mean Std. Dev.
95% CI
9 RoE It is important for all citizens to have a good basic understanding of science.
4 3.54 0.529 0.064
23 RoE The field of engineering impacts our society in a positive way.
3 3.44 0.602 0.073
24 RoE I understand why my students should learn engineering. 3 3.09 0.782 0.095
34 RoE It is important for all citizens to have a good basic understanding of engineering.
3 2.94 0.668 0.081
22 SoE A typical engineer has good written and verbal communication skills.
3 2.95 0.763 0.093
32 SoE A typical engineer has good math skills. 3 3.44 0.577 0.070
37 SoE A typical engineer earns good money. 3 2.89 0.688 0.083
42 SoE A typical engineer is knowledgeable about science. 3 3.34 0.651 0.079
50 SoE A typical engineer works well with people. 3 2.66 0.73 0.089
53 SoE A typical engineer is good at fixing things. 3 2.81 0.675 0.082
29 WtTSE Engineering should be taught during preschool. 3 2.95 0.753 0.091
36 WtTSE Engineering should be taught during middle school. 3 3.28 0.801 0.097
43 WtTSE Engineering should be taught during high school. 4 3.44 0.633 0.077
45 WtTSE All college students should study at least some engineering at the university level.
3 2.74 0.861 0.104
49 WtTSE Engineering should be taught during elementary school. 3 3.39 0.614 0.074
52 WtTSE All elementary students can succeed at engineering projects.
3 3.15 0.708 0.086
33 IAtTE I would like to improve my ability to teach my students to understand the use and impact of engineering.
4 3.72 0.484 0.059
39 IAtTE I would like to improve my ability to teach my students to understand the science underlying engineering.
4 3.7 0.499 0.061
40 IAtTE I would like to improve my ability to teach my students to understand the engineering design process.
4 3.67 0.503 0.061
44 IAtTE I would like to improve my ability to teach my students to understand the types of problems to which engineering can be applied.
4 3.64 0.497 0.060
48 IAtTE I would like to improve my ability to teach students how to communicate technical information.
4 3.5 0.624 0.076
55 IAtTE I am interested in learning more about teaching engineering through in-service professional development.
4 3.58 0.58 0.070
26 Ped Elementary students should be given regular opportunities to reflect on what they have learned about engineering.
4 3.54 0.585 0.071
27 Ped Engineering projects can be implemented in an elementary classroom.
4 3.49 0.579 0.070
41 Ped Small group activities should be a regular part of engineering learning.
4 3.62 0.539 0.065
54 Ped Using hands-on activities in engineering lessons will improve elementary students' understanding of engineering.
4 3.62 0.518 0.063
4 Enj I like learning science. 4 3.61 0.504 0.061
17 Enj I look forward to teaching science lessons. 4 3.53 0.592 0.072
21 Enj I like learning engineering. 3 2.92 0.734 0.089
25 Enj I look forward to teaching engineering lessons. 3 3.22 0.751 0.091
Page 24.1188.11

Standardized loadings of the TAS model ranged from .454 to .944, with only one item in the 0.4 range (see Figure 1). A high amount of covariance between scales hinted at a unifying second order latent trait, that being “Teacher Attitudes on Teaching Engineering”. All first order latent traits loaded very well onto the second order latent, with the exception of SoE. This latent had a loading of .589, which still shows a strong relationship. This is unsurprising, considering the SoE scale is slightly different than the rest. The other items focus on engineering practices and attitudes, whereas the SoE items represent conceptions about engineering as a career. The standardized loading for this latent, however, is within an acceptable range.
The model generated by Mplus was found to be sufficiently close to well-fitting. The literature recommends a number of fit measures to report [12]; these are summarized in Table 5. The Chi Square value measures overall fit. The value is 812 with 399 degrees of freedom and p-value < 0.001. These scores are acceptable (p-value <= 0.05). However, the Chi Square value may not accurately reflect the fit to the model when the sample size is large, the data is not normal, or there are a large number of items. These issues result in the inflation of the Chi Square value and the over-rejection of the null hypothesis. The WLSMV estimator of Mplus for categorical data adjusts the Chi Square value but there tends to be inflation regardless. To alleviate this sensitivity other fit measures are employed to gain a wider perspective on model fit.
The next fit measure suggested to report is the Root Mean Square Error of Approximation (RMSEA). The RMSEA is another measure of overall fit but some of the limitations of the Chi Square value are not present. An acceptable value is 0.05 or lower. The confidence interval (CI) and probability that RMSEA is <= 0.05 are also reported. The TAS instrument has an RMSEA value of 0.063, CI of 0.057 to 0.069, and probability of < 0.001. This RMSEA value is less than ideal, although still fair. RMSEA is sensitive to model parsimony; a less parsimonious model will have a worse RMSEA. In the case of the TAS instrument the large number of parameters could potentially be the cause of the skewed result.
The Comparative Fit Index (CFI) and the Tucker Lewis Index (TLI) are two incremental fit indices that should be reported. Incremental fit indices are measures of the model fit (Chi Square) as compared to the baseline model fit (Chi Square). In the case of the CFI and TLI sample size is taken into account. The CFI is on a scale of 0 to 1 with a value >= 0.95 being acceptable. The TLI is not normalized so values above 1 are possible, but otherwise follows the same fit assessment as the CFI. In the case of TAS instrument, the values are 0.958 and 0.954 respectively. Both of these values designate an effective model.
Page 24.1188.12

Table 5: Fit Statistics for the TAS Model Chi Square 812
Degrees of Freedom 399 p-value < 0.001
RMSEA 0.063 Confidence Interval 0.057 to 0.069 Probability RMSEA <= 0.05 < 0.001
CFI 0.958 TLI 0.954 Power* 0.937
*Power calculated using the RMSEA, degrees of freedom, sample size and alpha level of 0.05.
This model will be cross-validated with our second, post-workshop round of data collection, once we have a sufficiently large sample size (N>200). This analysis will be run in June 2014.
Teacher Attitudes
Analysis shows an overall positive attitude towards teaching engineering (see *IAtTe did not show a significant difference from pre- to post-sampling.
, Error! Reference source not found., and Figure 3). IAtTE in particular showed very positive results. Over 40% of the sample scored the maximum of the scale and almost 90% scored 75% or more of the maximum. This shows a strong desire by the sample population to improve their engineering teaching skills, which is not unexpected, since these teachers applied to participate in a research study where they would receive training and materials to implement engineering lessons.
Table 6: Pre-Survey Results for TAS Scales Latents Mean Std. Dev. Maximum Std. Error 95% CI
RoE 13.012 1.884 16 0.117 0.229 Ped 14.268 1.747 16 0.108 0.212 Enj 13.272 1.947 16 0.121 0.236
WtTsE 18.946 2.983 24 0.185 0.362 SoE 18.088 2.680 24 0.166 0.325
IAtTe 21.812 2.627 24 0.163 0.319
Table 7: Post-Survey Results for the TAS Scales
Latents Mean Std. Dev. Maximum Std. Error Mean
Increase 95% CI
RoE 13.867 1.645 16 0.150 0.742 0.342
Ped 14.950 1.483 16 0.135 0.708 0.308
Enj 14.400 1.642 16 0.150 0.817 0.341
WtTsE 20.417 2.690 24 0.246 1.258 0.559
Page 24.1188.13
SoE 19.192 2.594 24 0.237 1.183 0.539
IAtTe 21.567 2.585 24 0.236 - 0.375 0.537
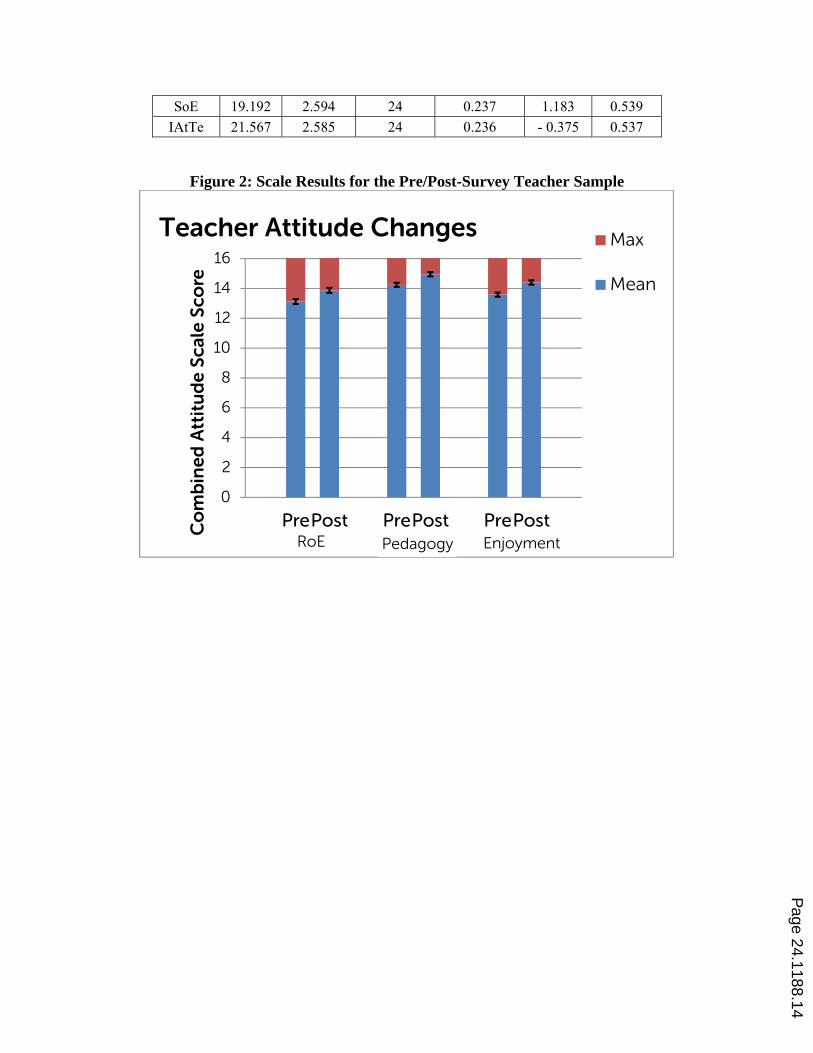
Figure 2: Scale Results for the Pre/Post-Survey Teacher Sample
0
2
4
6
8
10
12
14
16
PrePost PrePost PrePostCo
mb
ined
Att
itu
de
Scal
e Sc
ore
Max
Mean
Teacher Attitude Changes
RoE Pedagogy Enjoyment
Page 24.1188.14

Figure 3: Scale Results for the Pre/Post-Survey Teacher Sample
*IAtTe did not show a significant difference from pre- to post-sampling.
The data from the second sample reinforced the points made by the first data set (see Figure 2, Error! Reference source not found., and Table 7). There appeared to be slight improvements in a number of the scales. These improvements are expected as the participants would have had training to use the engineering curriculum prior to the second submission of the TAS instrument; only slight improvement is possible due to the high starting attitudes of the sample. The attitudes in IAtTE saw a slight negative change, although this was not found to be a significant effect. Ultimately, there wasn’t a large difference between the second sampling of data and the first. Complete results of all item t-tests and combined scales t-tests can be found in appendices 1 and 2.
From the pre-survey, we have found that elementary teachers are more positive about the benefits of teaching science than about the benefits of teaching engineering (see Table 8 for item wording and Figure 4 for a chart of results). They more strongly agree that science, rather than engineering, should be taught to “promote an understanding of how science/engineering affects society”, “to educate future scientists, engineers, and technologists for industry”, “to prepare young people for their future career options”, “to help my students develop an understanding of the natural/human-made world”, and “to promote an enjoyment of learning”. The lack of overlapping 95% confidence intervals indicates the strength of the differences between science and engineering responses.
0
4
8
12
16
20
24
PrePost PrePost PrePost
Co
mb
ined
Att
itu
de
Scal
e Sc
ore
Max
Mean
WtTE SoE
Teacher Attitude Changes
IAtTE*
Page 24.1188.15
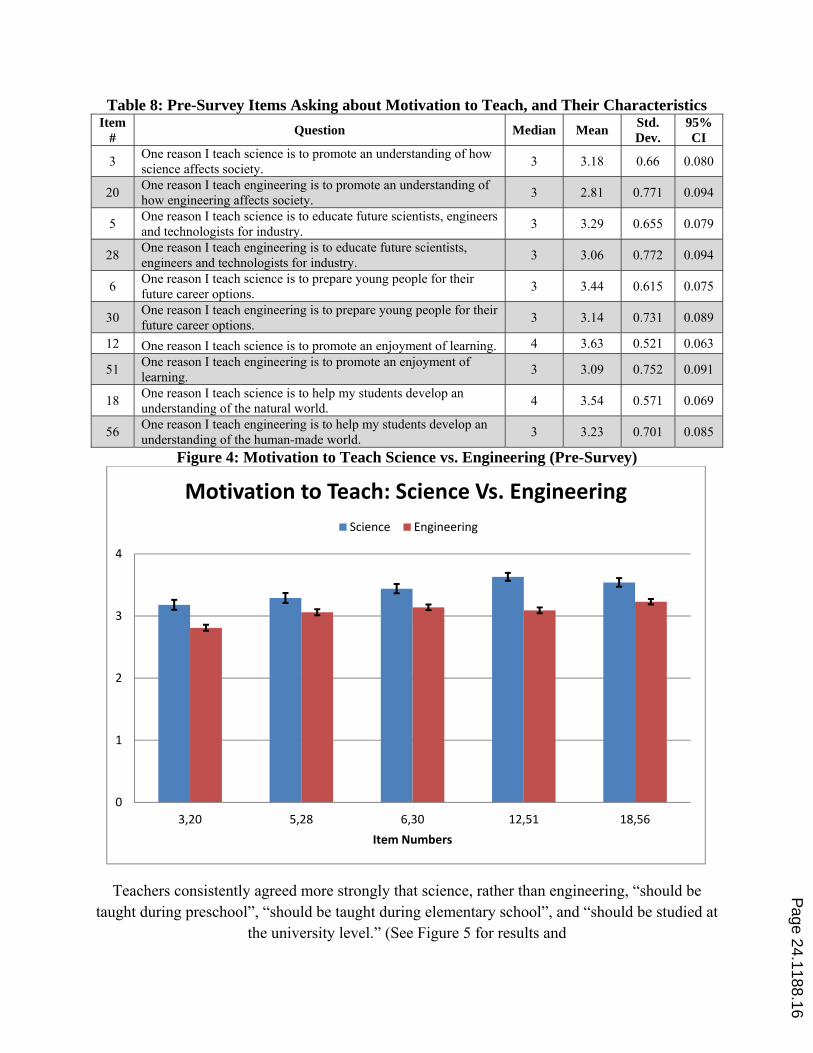
Table 8: Pre-Survey Items Asking about Motivation to Teach, and Their Characteristics Item
# Question Median Mean
Std. Dev.
95% CI
3 One reason I teach science is to promote an understanding of how science affects society.
3 3.18 0.66 0.080
20 One reason I teach engineering is to promote an understanding of how engineering affects society.
3 2.81 0.771 0.094
5 One reason I teach science is to educate future scientists, engineers and technologists for industry.
3 3.29 0.655 0.079
28 One reason I teach engineering is to educate future scientists, engineers and technologists for industry.
3 3.06 0.772 0.094
6 One reason I teach science is to prepare young people for their future career options.
3 3.44 0.615 0.075
30 One reason I teach engineering is to prepare young people for their future career options.
3 3.14 0.731 0.089
12 One reason I teach science is to promote an enjoyment of learning. 4 3.63 0.521 0.063
51 One reason I teach engineering is to promote an enjoyment of learning.
3 3.09 0.752 0.091
18 One reason I teach science is to help my students develop an understanding of the natural world.
4 3.54 0.571 0.069
56 One reason I teach engineering is to help my students develop an understanding of the human-made world.
3 3.23 0.701 0.085
Figure 4: Motivation to Teach Science vs. Engineering (Pre-Survey)
Teachers consistently agreed more strongly that science, rather than engineering, “should be taught during preschool”, “should be taught during elementary school”, and “should be studied at
the university level.” (See Figure 5 for results and
0
1
2
3
4
3,20 5,28 6,30 12,51 18,56
Item Numbers
Motivation to Teach: Science Vs. Engineering
Science Engineering
Page 24.1188.16
Table 4 for item wording.) Their answers indicated that they believed science is more important than engineering for citizens to understand.
In addition, teachers on average agreed more strongly with statements that students should reflect on science learning, and that hands-on activities would help students to understand science, than with similar statements about engineering. However, these differences were much smaller than earlier highlighted differences, and teachers answered similarly about the value of small group activities and hands-on work before vocabulary for both fields. (See Figure 6 for results and
Table 4 for item wording.)
Page 24.1188.17

Figure 5: Questions on the Pre-Survey: When to Teach Science vs. Engineering
Figure 6: Questions on the Pre-Survey: Pedagogy for Science vs. Engineering
0
1
2
3
4
8,29 13,49 16,45
Item Numbers
When to Teach Science Vs. Engineering
Science Engineering
0
1
2
3
4
2,26 7,31 11,41 19,54
Item Numbers
Pedagogy Science Vs. Engineering
Science Engineering
Page 24.1188.18
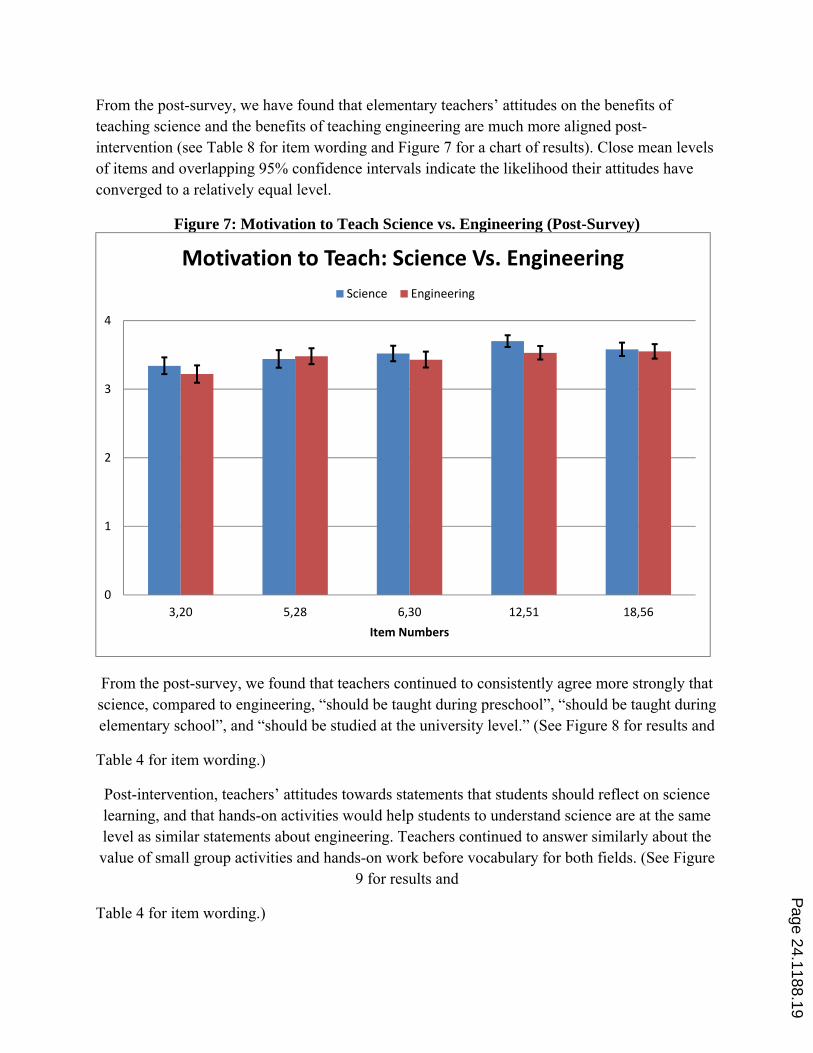
From the post-survey, we have found that elementary teachers’ attitudes on the benefits of teaching science and the benefits of teaching engineering are much more aligned post-intervention (see Table 8 for item wording and Figure 7 for a chart of results). Close mean levels of items and overlapping 95% confidence intervals indicate the likelihood their attitudes have converged to a relatively equal level.
Figure 7: Motivation to Teach Science vs. Engineering (Post-Survey)
From the post-survey, we found that teachers continued to consistently agree more strongly that science, compared to engineering, “should be taught during preschool”, “should be taught during elementary school”, and “should be studied at the university level.” (See Figure 8 for results and
Table 4 for item wording.)
Post-intervention, teachers’ attitudes towards statements that students should reflect on science learning, and that hands-on activities would help students to understand science are at the same level as similar statements about engineering. Teachers continued to answer similarly about the value of small group activities and hands-on work before vocabulary for both fields. (See Figure
9 for results and
Table 4 for item wording.)
0
1
2
3
4
3,20 5,28 6,30 12,51 18,56
Item Numbers
Motivation to Teach: Science Vs. Engineering
Science Engineering
Page 24.1188.19
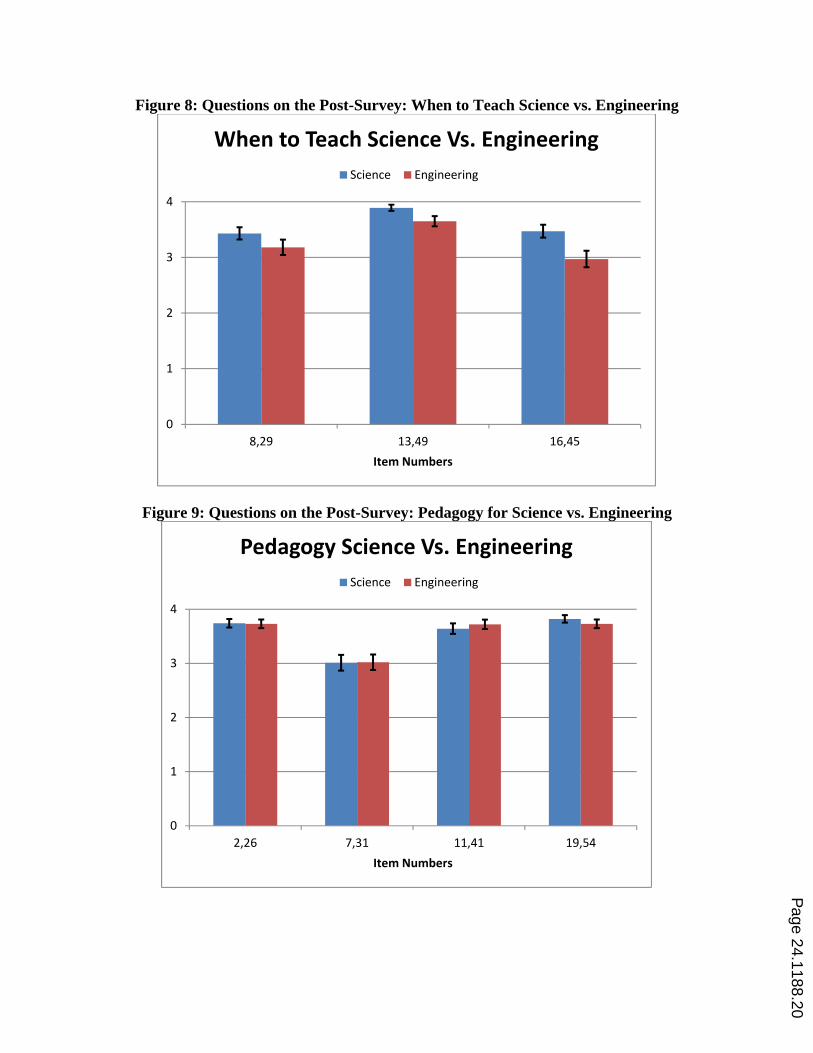
Figure 8: Questions on the Post-Survey: When to Teach Science vs. Engineering
Figure 9: Questions on the Post-Survey: Pedagogy for Science vs. Engineering
0
1
2
3
4
8,29 13,49 16,45
Item Numbers
When to Teach Science Vs. Engineering
Science Engineering
0
1
2
3
4
2,26 7,31 11,41 19,54
Item Numbers
Pedagogy Science Vs. Engineering
Science Engineering
Page 24.1188.20
Conclusions
We found that for elementary school teachers volunteering to implement engineering curricula, attitudes towards engineering are fairly positive, but not as positive as their attitudes towards science. We have seen evidence of increasingly positive attitudes towards engineering after participation in our intervention. Attitudes towards implementation of engineering curricula rival that of science curricula post-intervention.
We have touched on the research question regarding what changes we see in attitudes towards and interest in teaching engineering after our intervention, and have found that our instrument appears promising in its ability to distinguish change over time with our population of teachers; however the strongly positive attitudes of our sample on the pre-survey leave limited room for growth in the post-survey. We expect the instrument to perform better with a randomly-chosen sample of teachers, rather than a sample self-selected for engineering professional development.
Our analysis of the TAS model demonstrates that there is, in all likelihood, an underlying trait that the survey, in its completed form, is measuring. This second order trait represents Teacher Attitudes towards Teaching Engineering. Our model goes on to show that the six interrelated scales that we have designed to measure this underlying trait are in fact themselves reliable underlying traits, all related to the second order trait. Each of our six scales can be accurately measured by a composition of 4 or 6 Likert scale items. The range of item factor loadings shows us that each item reliably contributes to measurement of the scale in question.
Next Steps
At this point, our model fit statistics are promising; however another data set should be modeled to cross-validate the results. We intend to carry out this cross-validation in late spring of 2014.
The sample of teachers described in this paper is participating in a two year study that will allow the authors to implement the TAS at key points during the study. In addition to the data described in this paper collected prior to the study, teachers will also be surveyed prior to implementing an engineering curriculum in each of two consecutive years and, finally, following the end of the study.
By looking at the data longitudinally, we can explore how elementary school teachers’ attitudes about engineering education are affected by both professional development and by experience teaching engineering in the classroom. These repeated samples will also allow us to further refine the instrument. As the data from repeated administrations of the survey is entered and analyzed, we will also be able to answer questions about how teachers’ attitudes change due to their participation in the engineering education professional development and curriculum implementation.
Page 24.1188.21

References
[1] NGSS Lead States, Next Generation Science Standards: For States, By States. Washington, DC: The National Academies Press, 2013.
[2] Ş. Yaşar, D. Baker, S. Robinson-Kurpius, S. Krause, and C. Roberts, “Development of a survey to assess K-12 teachers’ perceptions of engineers and familiarity with teaching design, engineering, and technology,” J. Eng. Educ., vol. 95, no. 3, pp. 205–216, 2006.
[3] T. Hong, Şe. Purzer, and M. E. Cardella, “A Psychometric Re‐Evaluation of the Design, Engineering and Technology (DET) Survey,” J. Eng. Educ., vol. 100, no. 4, pp. 800–818, 2011.
[4] M.-C. Hsu, S. Purzer, and M. E. Cardella, “Elementary teachers’ views about teaching design, engineering, and technology,” J. Pre-Coll. Eng. Educ. Res. J-PEER, vol. 1, no. 2, p. 5, 2011.
[5] J. R. McGinnis, S. Kramer, G. Shama, A. O. Graeber, C. A. Parker, and T. Watanabe, “Undergraduates’ attitudes and beliefs about subject matter and pedagogy measured periodically in a reform-based mathematics and science teacher preparation program,” J. Res. Sci. Teach., vol. 39, no. 8, pp. 713–737, 2002.
[6] W. W. Cobern and C. C. Loving, “Investigation of preservice elementary teachers’ thinking about science,” J. Res. Sci. Teach., vol. 39, no. 10, pp. 1016–1031, 2002.
[7] W. Chin, “Issues and Opinions on Structural Equations Modeling,” Manag. Inf. Syst. Q., vol. 22, no. 1, p. 14, Mar. 1998.
[8] S. J. Finney and C. DiStefano, “Non-Normal and Categorical Data in Structural Equation Modeling,” in Structural Equation Modeling: A Second Course, United States of America: Information Age Publishing, Inc., 2006, pp. 269 – 314.
[9] C. M. Cunningham and C. P. Lachapelle, “The impact of Engineering is Elementary (EiE) on students’ attitudes toward engineering and science,” in ASEE Annual Conference and Exposition, Louisville, KY, 2010.
[10] IBM Corporation, IBM SPSS Statistics for Windows. Armonk, NY: IBM Corporation, 2012. [11] L. K. Muthén and B. O. Muthen, Mplus. Los Angeles, CA: Muthén & Muthén, 2012. [12] D. Hooper, J. Coughlan, and M. R. Mullen, “Structural Equation Modelling: Guidelines for Determining Model
Fit,” Electron. J. Bus. Res. Methods, vol. 6, no. 1, pp. 53–60, 2008.
Page 24.1188.22

Appendix 1: Pre-/ Post- T-Test Results All Items
Paired Differences
t df Sig. (2-tailed) Mean
Std. Deviation
Std. Error Mean
95% Confidence Interval of the
Difference
Lower Upper PTAS_4 - TAS_4** -0.042 0.525 0.048 -0.137 0.053 -0.870 119 0.386
PTAS_7 - TAS_7** -0.058 0.833 0.076 -0.209 0.092 -0.767 119 0.445
PTAS_9 - TAS_9** -0.042 0.571 0.052 -0.145 0.062 -0.799 119 0.426
PTAS_17 - TAS_17** 0.017 0.518 0.047 -0.077 0.110 0.352 119 0.725
PTAS_20 - TAS_20 0.408 0.855 0.078 0.254 0.563 5.232 119 < 0.001
PTAS_21 - TAS_21 0.450 0.732 0.067 0.318 0.582 6.738 119 < 0.001
PTAS_22 - TAS_22 0.300 0.836 0.076 0.149 0.451 3.930 119 < 0.001
PTAS_23 - TAS_23 0.167 0.626 0.057 0.053 0.280 2.915 119 0.004
PTAS_24 - TAS_24 0.450 0.897 0.082 0.288 0.612 5.497 119 < 0.001
PTAS_25 - TAS_25 0.392 0.690 0.063 0.267 0.516 6.222 119 < 0.001
PTAS_26 - TAS_26 0.217 0.597 0.054 0.109 0.325 3.978 119 < 0.001
PTAS_28 - TAS_28 0.442 0.797 0.073 0.298 0.586 6.070 119 < 0.001
PTAS_29 - TAS_29 0.217 0.758 0.069 0.080 0.354 3.131 119 0.002
PTAS_30 - TAS_30 0.317 0.850 0.078 0.163 0.470 4.081 119 < 0.001
PTAS_31 - TAS_31** 0.042 0.947 0.086 -0.130 0.213 0.482 119 0.631
PTAS_32 - TAS_32** 0.017 0.698 0.064 -0.109 0.143 0.262 119 0.794
PTAS_33 - TAS_33** -0.067 0.546 0.050 -0.165 0.032 -1.338 119 0.184
PTAS_34 - TAS_34 0.167 0.653 0.060 0.049 0.285 2.798 119 0.006
PTAS_36 - TAS_36 0.208 0.839 0.077 0.057 0.360 2.720 119 0.008
PTAS_37 - TAS_37 0.142 0.665 0.061 0.022 0.262 2.334 119 0.021
PTAS_39 - TAS_39 -0.092 0.518 0.047 -0.185 0.002 -1.937 119 0.055
PTAS_40 - TAS_40 -0.133 0.579 0.053 -0.238 -0.029 -2.523 119 0.013
PTAS_41 - TAS_41 0.083 0.478 0.044 -0.003 0.170 1.911 119 0.058
PTAS_42 - TAS_42 0.242 0.635 0.058 0.127 0.356 4.169 119 < 0.001
PTAS_43 - TAS_43 0.175 0.644 0.059 0.059 0.291 2.978 119 0.004
PTAS_44 - TAS_44** -0.050 0.563 0.051 -0.152 0.052 -0.973 119 0.332
PTAS_45 - TAS_45 0.158 0.907 0.083 -0.006 0.322 1.911 119 0.058
PTAS_48 - TAS_48** 0.025 0.654 0.060 -0.093 0.143 0.419 119 0.676
PTAS_49 - TAS_49 0.225 0.586 0.054 0.119 0.331 4.203 119 < 0.001
PTAS_50 - TAS_50 0.367 0.755 0.069 0.230 0.503 5.319 119 < 0.001
PTAS_51 - TAS_51 0.458 0.798 0.073 0.314 0.603 6.291 119 < 0.001
PTAS_52 - TAS_52 0.275 0.721 0.066 0.145 0.405 4.176 119 < 0.001
PTAS_53 - TAS_53** 0.117 0.712 0.065 -0.012 0.245 1.794 119 0.075
PTAS_54 - TAS_54 0.125 0.559 0.051 0.024 0.226 2.452 119 0.016
PTAS_55 - TAS_55** -0.058 0.639 0.058 -0.174 0.057 -1.000 119 0.319
PTAS_56 - TAS_56 0.358 0.776 0.071 0.218 0.499 5.061 119 < 0.001
**Items do not show significant differences from pre to post.
Page 24.1188.23

Appendix 2: Pre-/ Post- T-Test Results of Scales
Paired Differences
t df Sig. (2-tailed) Mean
Std. Deviatio
n
Std. Error Mean
95% Confidence Interval of the Difference
Lower Upper PRoE - RoE 0.742 1.799 0.164 0.417 1.067 4.517 119 < 0.001
PWtTE - WtTE 1.258 2.677 0.244 0.774 1.742 5.149 119 < 0.001
PSoE - SoE 1.183 2.530 0.231 0.726 1.641 5.123 119 < 0.001
PIAtTE - IAtTE** -0.375 2.415 0.220 -0.812 0.062 -1.701 119 0.092
PPedagogy - Pedagogy 0.708 1.536 0.140 0.431 0.986 5.051 119 < 0.001
PEnjoyment - Enjoyment 0.817 1.545 0.141 0.537 1.096 5.791 119 < 0.001
**PIAtTE did not show a significant difference from IAtTE.
Page 24.1188.24