Embed Size (px)
Citation preview

The ASTER Global Emissivity Dataset (GED) Version 4.1
Monthly 0.05º Product 2000-2015
=====================================================================
Produced by: Glynn Hulley
Jet Propulsion Laboratory, California Institute of Technology
Pasadena, CA
Contact: [email protected]
Version: 4.1**
Description and Availability:
https://lpdaac.usgs.gov/dataset_discovery/community/community_products_table
Reference:
Hulley, G., Hook S.J, Abbott, E., Malakar, N., Islam, T., Abrams, M., (2015), The ASTER
Global Emissivity Database (ASTER GED): Mapping Earth’s emissivity at 100 meter spatial
resolution, Geophysical Research Letters, 42, doi:10.1002/2015GL065564.
** In 4.1 georeferencing attributes have been added to the SDS Group in addition to product
specific attributes such as scaling, offsets and datatypes. Please see section 4.1 for a list of these
attributes.
=====================================================================

Using data from the Advanced Spaceborne Thermal Emission and Reflection Radiometer
(ASTER) on NASA's Terra spacecraft, NASA/JPL recently released the most detailed global
emissivity map of the Earth termed the ASTER Global Emissivity Database (ASTER GEDv3),
available at https://lpdaac.usgs.gov/products/community_products_table. ASTER GEDv3 was
created by processing millions of cloud free ASTER data from 2000-2008 and calculating an
average emissivity of the surface at ~100 m spatial resolution at the five ASTER TIR
wavelengths (Hulley et al. 2015). Validation over a global set of sites showed a close match in
spectral shape with lab measured spectra, and average band error of ~1% (Hulley et al. 2015;
Hulley et al. 2009).
Since the ASTER-GEDv3 emissivities are static (mean from 2000-2008), an emissivity
adjustment was necessary to account for land surface changes over heterogeneous land cover
types that are subject to annual and inter-annual variability; for example, due to snow and ice
melt, agricultural practices, and droughts. The emissivity over desert regions will remain
invariant over time in the absence of soil moisture. To account for these changes, a monthly
mean ASTER GEDv4 emissivity product at 0.05 resolution has been produced from 2000-2015
by using snow cover data from the standard monthly MODIS/Terra snow cover monthly global
0.05 deg product (MOD10CM), and vegetation information from the MODIS monthly gridded
NDVI product (MOD13C2). The methodology for producing the monthly mean product
including uncertainty is described below
The emissivity of vegetation and snow is high and constant (~0.98-1.0) across the TIR
range from 8-12 µm, and as a result vegetation or snow cover systematically reduces the amount
of spectral variation in emissivity for a given surface. Valor and Caselles, (1996) initially
proposed a theoretical relationship between emissivity and NDVI based on observations made by
van de Griend and Owe (1993), and various forms of this method have been adapted to routinely
estimate emissivity for LST estimation from sensors including Advanced Very High Resolution
Radiometer (AVHRR) (Sobrino and Raissouni 2000), ASTER (Jiménez-Muñoz et al. 2006),
1. Introduction
2. Methodology
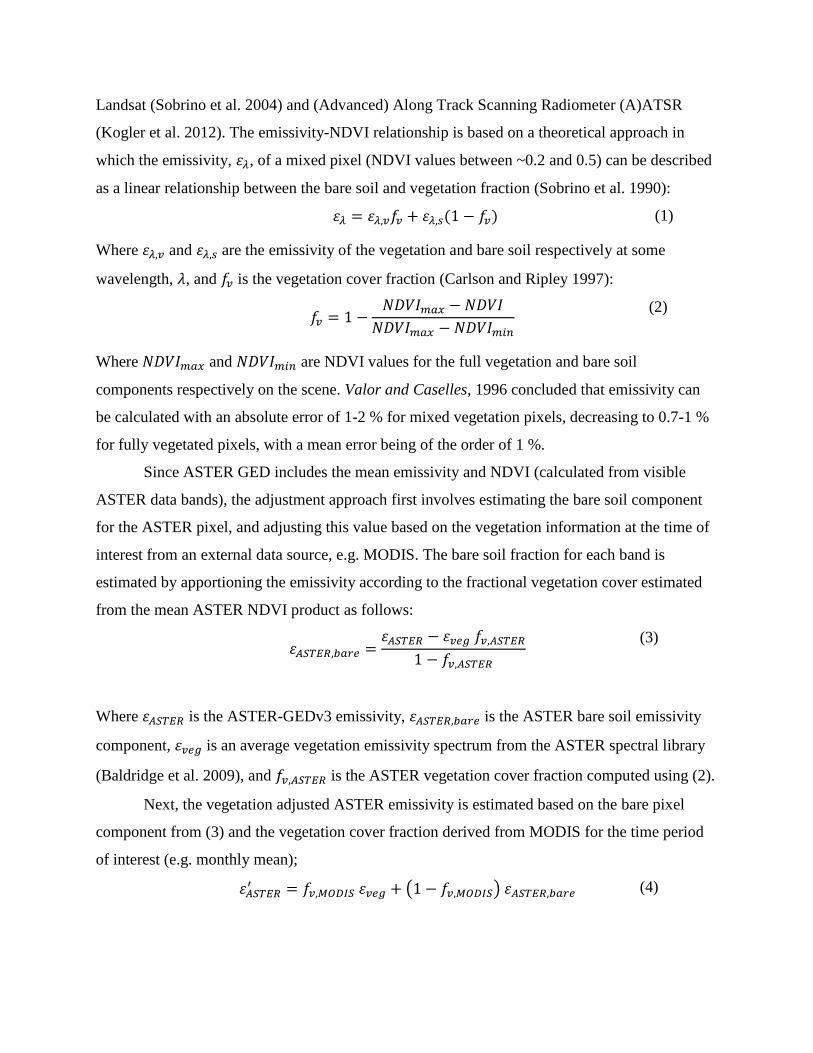
Landsat (Sobrino et al. 2004) and (Advanced) Along Track Scanning Radiometer (A)ATSR
(Kogler et al. 2012). The emissivity-NDVI relationship is based on a theoretical approach in
which the emissivity, 휀𝜆, of a mixed pixel (NDVI values between ~0.2 and 0.5) can be described
as a linear relationship between the bare soil and vegetation fraction (Sobrino et al. 1990):
휀𝜆 = 휀𝜆,𝑣𝑓𝑣 + 휀𝜆,𝑠(1 − 𝑓𝑣) (1)
Where 휀𝜆,𝑣 and 휀𝜆,𝑠 are the emissivity of the vegetation and bare soil respectively at some
wavelength, 𝜆, and 𝑓𝑣 is the vegetation cover fraction (Carlson and Ripley 1997):
𝑓𝑣 = 1 −
𝑁𝐷𝑉𝐼𝑚𝑎𝑥 − 𝑁𝐷𝑉𝐼
𝑁𝐷𝑉𝐼𝑚𝑎𝑥 − 𝑁𝐷𝑉𝐼𝑚𝑖𝑛
(2)
Where 𝑁𝐷𝑉𝐼𝑚𝑎𝑥 and 𝑁𝐷𝑉𝐼𝑚𝑖𝑛 are NDVI values for the full vegetation and bare soil
components respectively on the scene. Valor and Caselles, 1996 concluded that emissivity can
be calculated with an absolute error of 1-2 % for mixed vegetation pixels, decreasing to 0.7-1 %
for fully vegetated pixels, with a mean error being of the order of 1 %.
Since ASTER GED includes the mean emissivity and NDVI (calculated from visible
ASTER data bands), the adjustment approach first involves estimating the bare soil component
for the ASTER pixel, and adjusting this value based on the vegetation information at the time of
interest from an external data source, e.g. MODIS. The bare soil fraction for each band is
estimated by apportioning the emissivity according to the fractional vegetation cover estimated
from the mean ASTER NDVI product as follows:
휀𝐴𝑆𝑇𝐸𝑅,𝑏𝑎𝑟𝑒 =
휀𝐴𝑆𝑇𝐸𝑅 − 휀𝑣𝑒𝑔 𝑓𝑣,𝐴𝑆𝑇𝐸𝑅
1 − 𝑓𝑣,𝐴𝑆𝑇𝐸𝑅
(3)
Where 휀𝐴𝑆𝑇𝐸𝑅 is the ASTER-GEDv3 emissivity, 휀𝐴𝑆𝑇𝐸𝑅,𝑏𝑎𝑟𝑒 is the ASTER bare soil emissivity
component, 휀𝑣𝑒𝑔 is an average vegetation emissivity spectrum from the ASTER spectral library
(Baldridge et al. 2009), and 𝑓𝑣,𝐴𝑆𝑇𝐸𝑅 is the ASTER vegetation cover fraction computed using (2).
Next, the vegetation adjusted ASTER emissivity is estimated based on the bare pixel
component from (3) and the vegetation cover fraction derived from MODIS for the time period
of interest (e.g. monthly mean);
휀𝐴𝑆𝑇𝐸𝑅′ = 𝑓𝑣,𝑀𝑂𝐷𝐼𝑆 휀𝑣𝑒𝑔 + (1 − 𝑓𝑣,𝑀𝑂𝐷𝐼𝑆) 휀𝐴𝑆𝑇𝐸𝑅,𝑏𝑎𝑟𝑒 (4)

Where 휀𝐴𝑆𝑇𝐸𝑅′ is the adjusted ASTER emissivity for vegetation, and 𝑓𝑣,𝑀𝑂𝐷𝐼𝑆 is the
vegetation cover fraction estimated from MODIS data using (2). The final step involves an
additional adjustment for percent snow cover using the same linear adjustment procedure as in
the previous step:
휀𝐴𝑆𝑇𝐸𝑅′′ = 𝑓𝑠,𝑀𝑂𝐷𝐼𝑆 휀𝑠𝑛𝑜𝑤 + (1 − 𝑓𝑠,𝑀𝑂𝐷𝐼𝑆)휀𝐴𝑆𝑇𝐸𝑅
′ (5)
Where 휀𝐴𝑆𝑇𝐸𝑅′′ is the vegetation and snow adjusted ASTER-GEDv4 emissivity, and 𝑓𝑠,𝑀𝑂𝐷𝐼𝑆 is the
MODIS snow cover fraction. Data from the global monthly MODIS snow cover 0.05 product
(MOD10CM), and the MODIS monthly gridded NDVI product (MOD13C2) were used to
estimate 𝑓𝑣,𝑀𝑂𝐷𝐼𝑆 and 𝑓𝑠,𝑀𝑂𝐷𝐼𝑆 in (4) and (5).
An example of the adjusted ASTER GEDv4 monthly product for the year 2004 with
corresponding uncertainty is shown in Figure 1 for March (top), June (middle) and September
(bottom) 2004 for band 12 (9.1 µm). Uncertainties are given in absolute percent (%). Note the
largest uncertainties are over regions that had the largest seasonal changes in phenology (e.g.
Sahel), and over semi-arid regions (Australian outback). Uncertainties are lowest over desert
landscapes and over fully covered snow regions (Greenland).
Figure 2 shows an additional example focused on two regions, highlighting changes due
to snow cover over the Rocky Mountains in Colorado, USA, and due to vegetation phenology
over the Sahel region in Senegal, North Africa. Over the Sahel region (Figure 2a), emissivities
over the grasslands are lower during the dry period in March when grasses are in a senesced and
dry state, but an increase in emissivity can clearly be seen during June and September due to
summertime rainfall that results in greener and denser vegetation cover that is more evident
along the fringes of desert and grassland regions in the north of the images. Corresponding
emissivity uncertainty in % (Figure 2b) are highest over pixels that had the largest vegetation
adjustment based on (4). Higher emissivities (bright red) during January over the Rockies
(Figure 2c) are a result of increased wintertime snow cover at high elevations, while a decrease
in emissivity can be seen in subsequent months of March and June due to snowmelt and
subsequent exposure to background vegetation (orange) and rocks (blue) during the warmer melt
periods. Corresponding emissivity uncertainties (Figure 2d) are highest over pixels that had the
largest snow adjustment based on (5).

A Temperature Emissivity Uncertainty Simulator (TEUSim) was developed at JPL for
simulating LST&E uncertainties from various sources of error for the TES algorithm using in the
creation of ASTER GED in a rigorous manner for any appropriate TIR sensor (Hulley et al.
2012). These include random errors (noise), systematic errors (calibration), and spatio-
temporally correlated errors (atmospheric). The MODTRAN 5.2 radiative transfer model was
used for the simulations with a global set of radiosonde profiles and surface emissivity spectra
representing a broad range of atmospheric conditions and a wide variety of surface types. This
approach allows the retrieval algorithm to be easily evaluated under realistic but challenging
combinations of surface/atmospheric conditions. The TEUSim is designed to separately quantify
error contributions from the following potential sources: noise, model, atmospheric correction,
undetected cloud, calibration.
A set of global radiosonde profiles from the SeeBor database were adjusted to simulate
real data by applying estimated uncertainties from the MODIS MOD07 atmospheric product
(Seemann et al. 2006; Seemann et al. 2003). Using a dataset of 80 clear sky cases over the SGP
ARM site (Tobin et al. 2006), MOD07 air temperature RMS errors showed a linearly decreasing
trend from 4 K at the surface to 2 K at 700 mb, and a constant 2 K above 700 mb (Seemann et al.
2006). These reported values were used to perturb the air temperature profiles at each associated
level using a random number generator with a mean centered on the RMS error. The uncertainty
of the water vapor retrievals were estimated to be between 10–20% (Seemann et al. 2006).
Accordingly, the relative humidity profiles were adjusted by scaling factors ranging from 0.8 to
1.2 in MODTRAN using a uniformly distributed random number generator.
The total emissivity uncertainty for band i in the TES algorithm based on model,
atmospheric and measurement noise contributions can be written as:
𝛿휀𝑖,𝑇𝐸𝑆 = [𝛿휀𝑖,𝑀 + 𝛿휀𝑖,𝐴 + 𝛿휀𝑖,𝑁]1/2
(6)
where 𝛿휀𝑖,𝑀 is the model error due to assumptions made in the TES calibration curve, 𝛿휀𝑖,𝐴 is the
atmospheric error, and 𝛿휀𝑖,𝑁 is the error associated with measurement noise. These errors are
assumed to be independent.
3. Uncertainty Analysis

The second uncertainty source in ASTER GEDv4 is due to the monthly adjustment based
on MODIS vegetation and snow cover information. This uncertainty was estimated as the
magnitude of the difference in emissivity from the adjustment, multiplied by the uncertainty
based on the theoretical emissivity/NDVI relationship (Valor and Caselles 1996).
𝛿휀𝑖′ = (휀𝑖
′ − 휀𝑖) ∙ 𝛿휀𝑖 (7)
Where 휀𝑖′ is the adjusted emissivity from (4), 휀𝑖 is the original ASTER GEDv3 retrieved
emissivity, and 𝛿휀𝑖 is the uncertainty in the emissivity/NDVI relationship for band i. Valor and
Caselles, 1996 concluded that emissivity can be calculated with an absolute error of 1-2 % for
mixed vegetation pixels, decreasing to 0.5-1 % for fully vegetated pixels, with a mean error
being of the order of 1 %. In ASTER GEDv4 we assumed a maximum uncertainty of 2% for
mixed pixels defined as having an NDVI between 0.2 and 0.5, and a minimum uncertainty of
0.5% for fully vegetated pixels having an NDVI greater than 0.8. Uncertainties were then
linearly interpolated between these NDVI assigned values to estimate 𝛿휀𝑖. Pixels that had large
changes in emissivity due to the adjustment had correspondingly larger uncertainties, particularly
over mixed pixels. Uncertainties due to adjustment, 𝛿휀𝑖′, were set to zero over arid pixels
(NDVI<0.2), so over most desert landscapes the total uncertainty was only due to algorithm
uncertainty given by (6).
The total uncertainty per band and per pixel is then calculated as a combination of (6) and
(7) as follows:
𝛿휀𝑖,𝑡𝑜𝑡 = √𝛿휀𝑖
′2 + 𝛿휀𝑖,𝑇𝐸𝑆2 (7)
Any studies using ASTER GEDv4 should include this uncertainty in their calculations and
analysis. Future work will involve an additional adjustment over desert regions due to changes in
soil moisture, which reduces the spectral contrast in emissivity and can result in large variations

in the quartz bands (ASTER bands 10-12) (Hulley et al. 2010; Mira et al. 2007). Soil moisture
information can be derived from microwave remote sensing measurements of top layer soil
moisture, e.g. SMAP, SMOS, or AMSR-E.
Table 1. The Scientific Data Sets (SDSs) in the ASTER GEDv4 product in hdf5 format
SDS Long Name Data
type
Units Valid
Range
Fill
Value
Scale
Factor
Offset
Emissivity Band 10 - 8.3 μm
Band 11 - 8.6 μm
Band 12 - 9.1 μm
Band 13 - 10.6 μm
Band 14 - 11.3 μm
uint8 n/a 1-255 0 0.002 0.49
Emissivity
Uncertainty
Band 10 - 8.3 μm
Band 11 - 8.6 μm
Band 12 - 9.1 μm
Band 13 - 10.6 μm
Band 14 - 11.3 μm
uint8 n/a 1-255 0 0.002 n/a
NDVI Normalized
Difference
Vegetation Index
(MOD13C2)
uint16 n/a 0-65535 0 0.001 n/a
QFlag Quality Flag:
0 = Land
1 = Filled value
2 = Ocean
uint8 n/a 0-255 n/a n/a n/a
4.1 Product Attributes
Group '/SDS' Attributes: 'GridName': 'ASTER_GEDv4.1_0.05DEG_CMG_EMIS'
4. Product Format and Description

'XDim': 7200.000000 'YDim': 3600.000000 'UpperLeftPointMtrs': '(-180000000.000000,90000000.000000)' 'LowerRightPointMtrs': '(180000000.000000,-90000000.000000)' 'Projection': 'GCTP_GEO' 'GridOrigin': 'HDFE_GD_UL' 'EASTBOUNDINGCOORDINATE': 180.000000 'WESTBOUNDINGCOORDINATE': -180.000000 'SOUTHBOUNDINGCOORDINATE': -90.000000 'NORTHBOUNDINGCOORDINATE': 90.000000 Dataset 'Emissivity' Size: 7200x3600x5 MaxSize: 7200x3600x5 Datatype: H5T_STD_U8LE (uint8) ChunkSize: 7200x3600x5 Filters: none FillValue: 0 Attributes: 'Description': 'Emissivity ' 'Precision': 'uint8 ' 'Scale Factor': 0.002000 'Offset': 0.490000 Dataset 'EmissivityUncertainty' Size: 7200x3600x5 MaxSize: 7200x3600x5 Datatype: H5T_STD_U8LE (uint8) ChunkSize: 7200x3600x5 Filters: none FillValue: 0 Attributes: 'Description': 'Emissivity Uncertainty ' 'Precision': 'uint8 ' 'Scale Factor': 0.020000 'Offset': 0.000000 Dataset 'NDVI' Size: 7200x3600 MaxSize: 7200x3600 Datatype: H5T_STD_I16LE (int16) ChunkSize: 7200x3600 Filters: none FillValue: 0 Attributes: 'Description': 'Normalized Difference Vegetation Index ' 'Precision': 'uint16 ' 'Scale Factor': 0.001000 'Offset': 0.000000 Dataset 'QualityFlag' Size: 7200x3600 MaxSize: 7200x3600 Datatype: H5T_IEEE_F64LE (double)

ChunkSize: 7200x3600 Filters: none FillValue: 0.000000 Attributes: 'Description': 'Quality Flag ' 'Precision': 'uint8 ' 'Scale Factor': 0.000000 'Offset': 0.000000

Figure 1. ASTER GEDv4 global emissivity with corresponding uncertainty for March (top), June
(middle) and September (bottom) 2004 for band 12 (9.1 µm). Uncertainties are given in absolute
percent (%). Note the largest uncertainties are over regions that had the largest seasonal changes
in phenology (e.g. Sahel), and over semi-arid regions (Australian outback). Uncertainties are
lowest over desert landscapes and over fully covered snow regions (Greenland).

Figure 2. (a) ASTER GEDv4 monthly emissivity showing increasing emissivity due to
vegetation green-up from summer rainfall over the Sahel, Senegal from Mar- Sep 2004, and (b)
corresponding emissivity uncertainty estimate (%). (c) ASTER GEDv4 monthly emissivity
showing decreasing emissivity with snowmelt from Jan-June 2004 over the Rocky Mountains in
Colorado, and (d) corresponding emissivity uncertainty estimate (%).

Baldridge, A.M., Hook, S.J., Grove, C.I., & Rivera, G. (2009). The ASTER Spectral Library
Version 2.0. Remote Sensing of Environment, 114, 711-715
Carlson, T.N., & Ripley, D.A. (1997). On the relation between NDVI, fractional vegetation
cover, and leaf area index. Remote Sensing of Environment, 62, 241-252
Hulley, G.C., Hook, S.J., Abbott, E., Malakar, N., Islam, T., & Abrams, M. (2015). The ASTER
Global Emissivity Dataset (ASTER GED): Mapping Earth's emissivity at 100 meter spatial scale.
Geophysical Research Letters, 42, 7966-7976
Hulley, G.C., Hook, S.J., & Baldridge, A.M. (2009). Validation of the North American ASTER
Land Surface Emissivity Database (NAALSED) Version 2.0 using Pseudo-Invariant Sand Dune
Sites. Remote Sensing of Environment, 113, 2224-2233
Hulley, G.C., Hook, S.J., & Baldridge, A.M. (2010). Investigating the Effects of Soil Moisture
on Thermal Infrared Land Surface Temperature and Emissivity Using Satellite Retrievals and
Laboratory Measurements. Remote Sensing of Environment, 114, 1480-1493
Hulley, G.C., Hughes, C.G., & Hook, S.J. (2012). Quantifying uncertainties in land surface
temperature and emissivity retrievals from ASTER and MODIS thermal infrared data. Journal of
Geophysical Research-Atmospheres, 117
Jiménez-Muñoz, J.C., Sobrino, J.A., Gillespie, A., Sabol, D., & Gustafson, W.T. (2006).
Improved land surface emissivities over agricultural areas using ASTER NDVI. Remote Sensing
of Environment, 103, 474-487
Kogler, C., Pinnock, S., Arino, O., Casadio, S., Corlett, G., Prata, F., & Bras, T. (2012). Note on
the quality of the (A)ATSR land surface temperature record from 1991 to 2009. International
Journal of Remote Sensing, 33, 4178-4192
Mira, M., Valor, E., Boluda, R., Caselles, V., & Coll, C. (2007). Influence of soil water content
on the thermal infrared emissivity of bare soils: Implication for land surface temperature
determination. Journal of Geophysical Research-Earth Surface, 112, -
Seemann, S.W., Borbas, E., Li, J., Menzel, P., & Gumley, L.E. (2006). MODIS Atmospheric
Profile Retrieval Algorithm Theoretical Basis Document, Cooperative Institute for
Meteorological Satellite Studies, University of Wisconsin-Madison, Madison, WI, Version 6,
October 25, 2006
Seemann, S.W., Li, J., Menzel, W.P., & Gumley, L.E. (2003). Operational retrieval of
atmospheric temperature, moisture, and ozone from MODIS infrared radiances. Journal of
Applied Meteorology, 42, 1072-1091
Sobrino, J.A., Caselles, V., & Becker, F. (1990). Significance of the Remotely Sensed Thermal
Infrared Measurements Obtained over a Citrus Orchard. Isprs Journal of Photogrammetry and
Remote Sensing, 44, 343-354
Sobrino, J.A., Jimenez-Munoz, J.C., & Paolini, L. (2004). Land surface temperature retrieval
from LANDSAT TM 5. Remote Sensing of Environment, 90, 434-440
Sobrino, J.A., & Raissouni, N. (2000). Toward remote sensing methods for land cover dynamic
monitoring: application to Morocco. International Journal of Remote Sensing, 21, 353-366
Tobin, D.C., Revercomb, H.E., Knuteson, R.O., Lesht, B.M., Strow, L.L., Hannon, S.E., Feltz,
W.F., Moy, L.A., Fetzer, E.J., & Cress, T.S. (2006). Atmospheric Radiation Measurement site
atmospheric state best estimates for Atmospheric Infrared Sounder temperature and water vapor
retrieval validation. Journal of Geophysical Research-Atmospheres, 111, -
5. References

Valor, E., & Caselles, V. (1996). Mapping land surface emissivity from NDVI: Application to
European, African, and South American areas. Remote Sensing of Environment, 57, 167-184
Vandegriend, A.A., & Owe, M. (1993). On the Relationship between Thermal Emissivity and the
Normalized Difference Vegetation Index for Natural Surfaces. International Journal of Remote
Sensing, 14, 1119-1131