Embed Size (px)
Citation preview
RESEARCH ARTICLE Open Access
The association between mechanicalventilator compatible bed occupancy andmortality risk in intensive care patients withCOVID-19: a national retrospective cohortstudyHarrison Wilde1†, Thomas Mellan2†, Iwona Hawryluk2, John M. Dennis3, Spiros Denaxas4,5,6, Christina Pagel7,Andrew Duncan4,8, Samir Bhatt2, Seth Flaxman8†, Bilal A. Mateen4,5,9*† and Sebastian J. Vollmer1,4†
Abstract
Background: The literature paints a complex picture of the association between mortality risk and ICU strain.In this study, we sought to determine if there is an association between mortality risk in intensive care units (ICU)and occupancy of beds compatible with mechanical ventilation, as a proxy for strain.
Methods: A national retrospective observational cohort study of 89 English hospital trusts (i.e. groups of hospitalsfunctioning as single operational units). Seven thousand one hundred thirty-three adults admitted to an ICU inEngland between 2 April and 1 December, 2020 (inclusive), with presumed or confirmed COVID-19, for whom datawas submitted to the national surveillance programme and met study inclusion criteria. A Bayesian hierarchicalapproach was used to model the association between hospital trust level (mechanical ventilation compatible), bedoccupancy, and in-hospital all-cause mortality. Results were adjusted for unit characteristics (pre-pandemic size),individual patient-level demographic characteristics (age, sex, ethnicity, deprivation index, time-to-ICU admission),and recorded chronic comorbidities (obesity, diabetes, respiratory disease, liver disease, heart disease, hypertension,immunosuppression, neurological disease, renal disease).
© The Author(s). 2021 Open Access This article is licensed under a Creative Commons Attribution 4.0 International License,which permits use, sharing, adaptation, distribution and reproduction in any medium or format, as long as you giveappropriate credit to the original author(s) and the source, provide a link to the Creative Commons licence, and indicate ifchanges were made. The images or other third party material in this article are included in the article's Creative Commonslicence, unless indicated otherwise in a credit line to the material. If material is not included in the article's Creative Commonslicence and your intended use is not permitted by statutory regulation or exceeds the permitted use, you will need to obtainpermission directly from the copyright holder. To view a copy of this licence, visit http://creativecommons.org/licenses/by/4.0/.The Creative Commons Public Domain Dedication waiver (http://creativecommons.org/publicdomain/zero/1.0/) applies to thedata made available in this article, unless otherwise stated in a credit line to the data.
* Correspondence: [email protected]†Harrison Wilde, Thomas Mellan, and Bilal A Mateen contributed equally tothe manuscript.†Seth Flaxman, Bilal A Mateen, and Sebastian J Vollmer are joint seniorauthors.4The Alan Turing Institute, British Library, 96 Euston Road, London NW1 2DB,UK5Institute of Health Informatics, University College London, 222 Euston Rd,London, London NW1 2DA, UKFull list of author information is available at the end of the article
Wilde et al. BMC Medicine (2021) 19:213 https://doi.org/10.1186/s12916-021-02096-0
Results: One hundred thirty-five thousand six hundred patient days were observed, with a mortality rate of 19.4per 1000 patient days. Adjusting for patient-level factors, mortality was higher for admissions during periods of highoccupancy (> 85% occupancy versus the baseline of 45 to 85%) [OR 1.23 (95% posterior credible interval (PCI): 1.08to 1.39)]. In contrast, mortality was decreased for admissions during periods of low occupancy (< 45% relative tothe baseline) [OR 0.83 (95% PCI 0.75 to 0.94)].
Conclusion: Increasing occupancy of beds compatible with mechanical ventilation, a proxy for operational strain, isassociated with a higher mortality risk for individuals admitted to ICU. Further research is required to establish if thisis a causal relationship or whether it reflects strain on other operational factors such as staff. If causal, the resulthighlights the importance of strategies to keep ICU occupancy low to mitigate the impact of this type of resourcesaturation.
Keywords: Critical care, Hospital mortality, Public health surveillance, Quality of healthcare, Coronavirus infection
BackgroundFrom the first reports of a novel coronavirus (SARS-CoV-2) in late 2019, to date, global mortality associatedwith the resultant disease (COVID-19) has exceeded 1.7million people [1]. The virulence of the pathogen hasprompted persistent concern about the ability of healthservices around the world to effectively care for the vastnumbers of people affected [2]. These concerns are mostrelevant in the context of scarce resources (e.g. mechan-ical ventilation) required by patients in need of high-acuity support, which is relatively common in patientswith COVID-19 [3]. Notably, even with the introductionof non-pharmacological interventions such as stay-at-home orders, almost a third of all hospitals in Englandreached 100% occupancy of their ‘surge’ mechanical ven-tilation capacity (i.e. including the additional beds thatwere created through the re-allocation of resources) dur-ing the first wave of the pandemic [4]. The second wavein England appears to have been worse than the first,with 40% more people in hospital, many hospitals over-whelmed and staff wellbeing suffering due to the pro-longed onslaught [5]. What remains unclear is whetherand to what extent operating at these extremes of criticalcare occupancy impacted patient outcomes.Availability of certain resources, such as bed occupancy/
availability, is well-established proxies for operational strain[6]. Prior to COVID-19, the literature painted a complex pic-ture of the association between morbidity and mortality andICU strain [7]. Some studies suggest that higher strain in in-tensive care was associated with increased morbidity andmortality risk [8–10], whereas others observed no associationat all [11, 12]. Data from the natural experiment caused bythe COVID-19 pandemic is accumulating; however, it issimilarly inconsistent. A recent study from Belgium reported42% higher mortality during periods of ICU surge capacitydeployment, although in the analysis utilisation of surge cap-acity was only evaluated as a binary variable [13]. Similarly, astudy based on the US Veterans Affairs database evaluatingquartile-based bins for occupancy found a 94% increased risk
of mortality when occupancy exceeded 75% [14]. The afore-mentioned observations both directly contradict earlier re-sults from smaller studies in Australia and Wales, where noassociation between ICU occupancy and mortality was iden-tified [15, 16].A better understanding of how operating under such
extreme circumstances affects outcomes is crucial fortwo reasons: firstly, to allow hospitals to adapt practiceto improve outcomes, and secondly, to provide policymakers with more accurate information about the po-tential consequences of allowing health services to beoverwhelmed. As such, in this study, we sought to evalu-ate the extent to which mortality risk in intensive careunits (ICUs) during the COVID-19 pandemic in Englandcould be explained by differences in occupancy.
MethodsData sourcesData on all intensive care unit (ICU) admissions acrossEngland were extracted from the COVID-19 Hospitalisa-tion in England Surveillance System (CHESS) [17]. Infor-mation on occupancy rates were extracted from thedaily situation reports (i.e. ‘SitRep’) [4]. Both datasets aremandatory regulatory submissions for all NationalHealth Service (NHS) acute care providers in England,and further details about them can be found in add-itional file 1: eMethods.
Study populationAll ICU admissions reported to CHESS between 2 Apriland 1 December (see additional file 1: eMethods for de-tails on date selection), with presumed/confirmedCOVID-19 (100% tested positive during their admission;see additional file 1: eMethods for details on diagnosis),aged 18–99, non-pregnant, and with valid admission andoccupancy data, were eligible for inclusion (additionalfile 1: Fig. S1).
Wilde et al. BMC Medicine (2021) 19:213 Page 2 of 12
Recorded clinical featuresPatient-level dataInformation extracted from CHESS about each patientcomprised: administrative features (admitting trust, ad-mission date, and first segment of postcode—used toidentify the relevant indices of multiple deprivation forthe corresponding areas in England)), demographic char-acteristics (age, sex, ethnicity), recorded comorbidities(obesity, diabetes, asthma, other chronic respiratorydisease, chronic heart disease, hypertension, immuno-suppression due to disease or treatment, chronic neuro-logical disease, chronic renal disease, chronic liverdisease), and a binary indicator for use of mechanicalventilation. Ethnicity was coded as white, Asian (Sub-continent and other), black, mixed, and other; comorbid-ities were recorded as binary indicator variables, withmissing entries assumed to reflect the absence of a co-morbidity. The appropriateness of this assumption inCHESS has been previously explored [18].
Occupancy dataTrusts are groups of geographically co-located hospitalsthat function as a single organisational unit within theUK’s national healthcare system. Information extractedfrom SitRep about each trust comprised: pre-pandemic(January–March 2020) number of beds compatible withmechanical ventilation, the proportion of beds compat-ible with mechanical ventilation occupied on each day ofthe study period, and each trust’s geographical region[4]. Linkage was carried out based on the trust that anindividual was admitted to and the date of ICU admis-sion in CHESS; patients in CHESS were matched viatheir admission date to the relevant occupancy informa-tion from the corresponding date in SitRep.
OutcomeThe primary outcome was in-hospital all-cause mortal-ity; patients were followed up until death, discharge,transfer, or a minimum of 90 days from admission. Dis-charge and transfer were both treated as suggesting thatthe patient survived.
Statistical analysisDescriptive summaries were generated as median andinterquartile ranges for continuous variables and fre-quency and percentage incidence for categorical fac-tors. Exploratory analyses included: the relationship ofthe COVID-19 epidemic curve to bed occupancy at anational level (additional file 1: Fig. S2); the distribu-tion of missingness amongst patients and trusts (add-itional file 1: Fig. S3); variation in age andcomorbidity burden over the first wave (additional file1: Fig. S4); the impact of modelling continuous vari-ables either linearly, through the use of threshold
functions, or via (standard cubic) splines/smooths(additional file 1: eMethods).A Bayesian hierarchical approach was used to model
the association between the trust, group and patient-level factors and mortality risk. Specifically, a generalisedadditive mixed model was utilised, with intercept andslope coefficients for population and group level effects,and a Bernoulli likelihood with logit function to link tomortality outcome. Coefficients were inferred by Markovchain Monte Carlo sampling, using Stan (CmdStanV2.25.0), with a model specified using BRMS (V2.14.4)in R (V4.0.3) [19–21]. Further information on the Bayes-ian prior specification and modelling methods are re-ported in additional file 1: eMethods. The rationale forthe different thresholds utilised for bed occupancy is alsodetailed in additional file 1: eMethods; in short, the 85%occupancy threshold utilised is based on guidance fromthe Royal College of Emergency Medicine [22], whereasthe 45% (low occupancy threshold) was derived from theexploratory analysis.As secondary analyses, two potential interactions
were assessed: (1) baseline trust size and occupancyand (2) patient age and occupancy (results not reporteddue to insignificance). We also assessed the associationof occupancy on the recorded outcome date with mor-tality and occupancy expressed in terms of pre-pandemic ICU size. Several sensitivity analyses werecarried out (see additional file 1: eMethods for justifica-tions): (1) filtering for different degrees of missingnessof patient-level comorbidity data at trust-level; (2) in-cluding all individuals still on the unit as of 2 March(and assuming they all survive or die; n = 250); (3) in-cluding all individuals with a known outcome but nodate whom were excluded in the data cleaning process(n = 10); (4) a random effect for all patient post 16 June2020 (i.e. the date of the Recovery Trials press-releaseregarding the effectiveness of dexamethasone); (5)adjusting for week of admission; (6) adjusting for trustand region as random effects; (7) additional patient-level factors: time from hospital admission to ICU ad-mission, chronic liver disease and obesity; (8) the re-sidual bed availability in the sustainability andtransformation partnership (STPs) to which each trustbelongs—STPs are collections of geographically co-located hospital trusts that are meant to operate collab-oratively to support one another, and include ambu-lance providers and community services so as to allowend-to-end integration of care; (9) the weighted averageof the indices of multiple deprivation (IMD) corre-sponding to each patient’s given postcode district (i.e.the first half of their postcode), as a proxy for socio-economic status; and (10) separated into the differentwaves of the pandemic in the UK (i.e. 1st, inter-wave/summer, and 2nd).
Wilde et al. BMC Medicine (2021) 19:213 Page 3 of 12

ResultsSeven thousand one hundred thirty-three individualswere included in this study following application of theinclusion/exclusion criteria (see additional file 1: Fig.S1), of whom 2637 (37.0%) died. In total, 135,600 (me-dian 12 days per patient; IQR 6–25) patient days wereobserved, equating to a mortality rate of 19.4 per 1000patient days. A full summary of the recorded patient-level characteristics is reported in Table 1. Occupancy ofbeds compatible with mechanical ventilation over thestudy observation period is illustrated in additional file1: Fig. S5, expanding on the results presented elsewherewhich are restricted to the first wave [4].
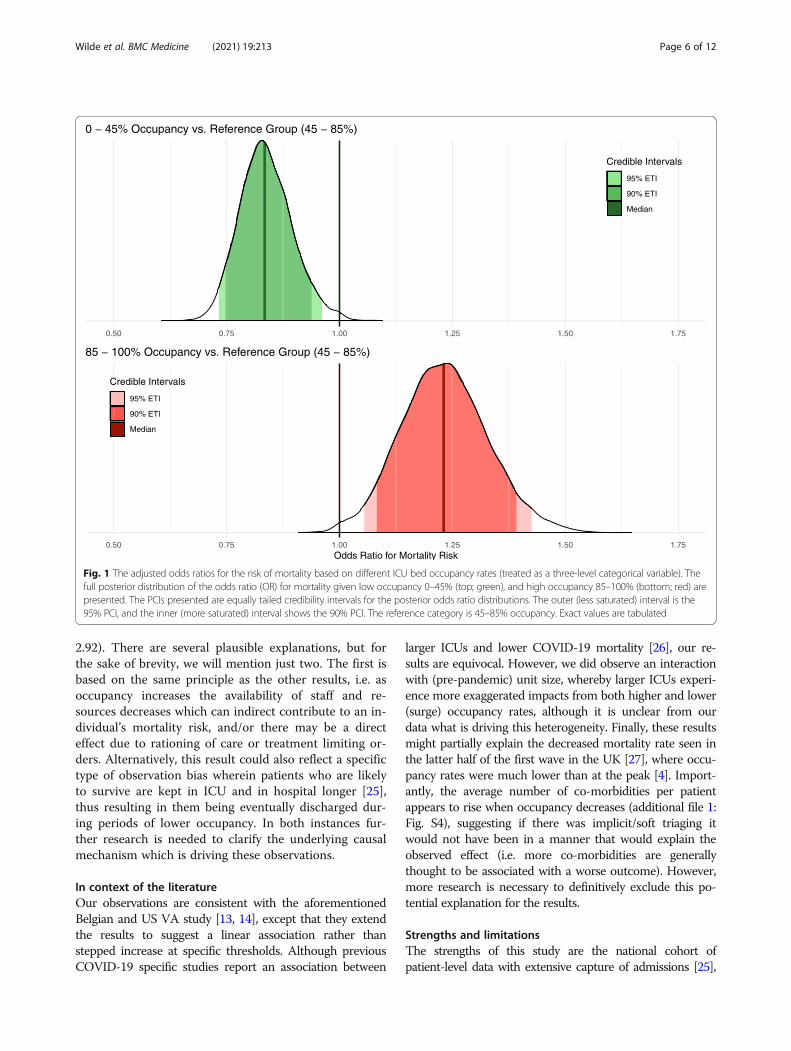
Mechanical ventilator occupancy rate on the day ofadmission is associated with mortality riskFor high occupancy rates (85–100% of total beds, includ-ing surge capacity), the unadjusted odds ratio (OR) formortality based on the mechanical ventilator occupancyrate on the day of admission was 1.22 (95% posterior cred-ibility interval (PCI) 1.06–1.40), relative to the baseline of45–85%. For low occupancy rates (0–45%), the unadjustedodds ratio was 0.82 (95% PCI 0.73–0.93), relative to thebaseline of 45–85%. Following adjustment for patient-level factors (age, sex, ethnicity, and comorbidities), theOR was 1.23 (95% PCI 1.05–1.43) for high occupancyrates and 0.83 (95% PCI 0.73–0.96) for low occupancyrates. Figure 1 illustrates the posterior probabilities for thefully adjusted ORs (see additional file 1: Fig. S6 & S7 forother model coefficients). To aid interpretation, the differ-ence in risk for a 70-year-old man with no comorbiditiesbeing admitted during a period of high versus low occu-pancy is equivalent to the risk of them being over a decadeolder (see full relationship in Fig. 2). Sensitivity analyses asdetailed in additional file 1: Table S1 were all concordantwith the primary analysis, and the results do not appear tobe sensitive to the choice of prior as illustrated in add-itional file 1: Table S2.
Mortality risk increases linearly with admission datespecific occupancy and average exposure over the fulllength of stayThe fully adjusted OR for mortality (Fig. 3), using occu-pancy on the day of admission coded as a continuouslinear variable ranging from 0 to 1 (i.e. specified withoutmultiplying out by 100 (e.g. 20% = 0.20), therefore theresulting odds ratio is for a step from 0% to 100%), was1.59 (95% PCI 1.22–2.03). Furthermore, using the occu-pancy from each individuals’ outcome date identified aneven larger association (full model specification in add-itional file 1: Table S3), OR 2.29 (95% PCI 1.80–2.92).Finally, the fully adjusted OR for the mean occupancyover a patient’s total length of stay in ICU was 2.69 (95%PCI 2.05–3.50); see additional file 1: Table S4.
Mortality risk is evident regardless of comparison tosurge or baseline capacity as the referenceUsing the alternative definition of occupancy, relative tobaseline (i.e. pre-pandemic) capacity instead of the real-time (surge) capacity on the day of admission illustratesthat mortality risk given a linear continuous factor was1.31 (95% PCI 1.16–1.48; additional file 1: Table S5). Inother words, every 100% increase in occupancy abovebaseline capacity was associated with a 31% increase inrisk of mortality.
Larger ICUs experience exaggerated impacts of extremesof mechanical ventilator occupancy ratesPre-pandemic number of beds did not substantially alterthe OR of occupancy as a sensitivity analysis (additionalfile 1: Table S1). Moreover, for every additional 25 bedscompatible with mechanical ventilation (pre-pandemic),there was no observed (significant at the 5% threshold)decrease in mortality (additional file 1: Table S6). How-ever, introduction of an interaction term between pre-pandemic size and real-time occupancy identified thatlarger ICUs experience exaggerated impacts of extremesof mechanical ventilator occupancy rates (additional file1: Fig. S8).
DiscussionThe results of this study, including the individual-levelexperience of over 7000 patients admitted to intensivecare units across England, suggest that survival rates forpatients with COVID-19 in intensive care settings ap-pears to deteriorate as the occupancy of (surge capacity)beds compatible with mechanical ventilation (a proxy foroperational pressure [6]), increases. Moreover, this riskdoes not occur above a specific threshold, but rather ap-pears linear, whereby going from 0% occupancy to 100%occupancy increases the odds of mortality by 59% (afteradjusting for relevant individual-level factors). Further-more, and expectedly, greater exposure to periods ofhigh occupancy over an individual’s total length of stayis also associated with an increased risk of mortality.This lends credibility (via a potential dose-response rela-tionship) to the argument that this is a causal relation-ship that is being observed; however, we cannot make adefinite claim based on our results. An additional pieceof context for interpreting these results is that the rele-vant authorities in the UK made clear that no explicittriaging unique to the pandemic took place [24], mean-ing that everyone whom would have previously beendeemed suitable for ICU treatment was treated similarlyto prior to the pandemic.The remaining result for which the interpretation is
not immediately apparent is that the risk of mortalitybased on occupancy on the date of recorded outcome isalso high; OR 2.29 (95% posterior credible interval 1.80–
Wilde et al. BMC Medicine (2021) 19:213 Page 4 of 12
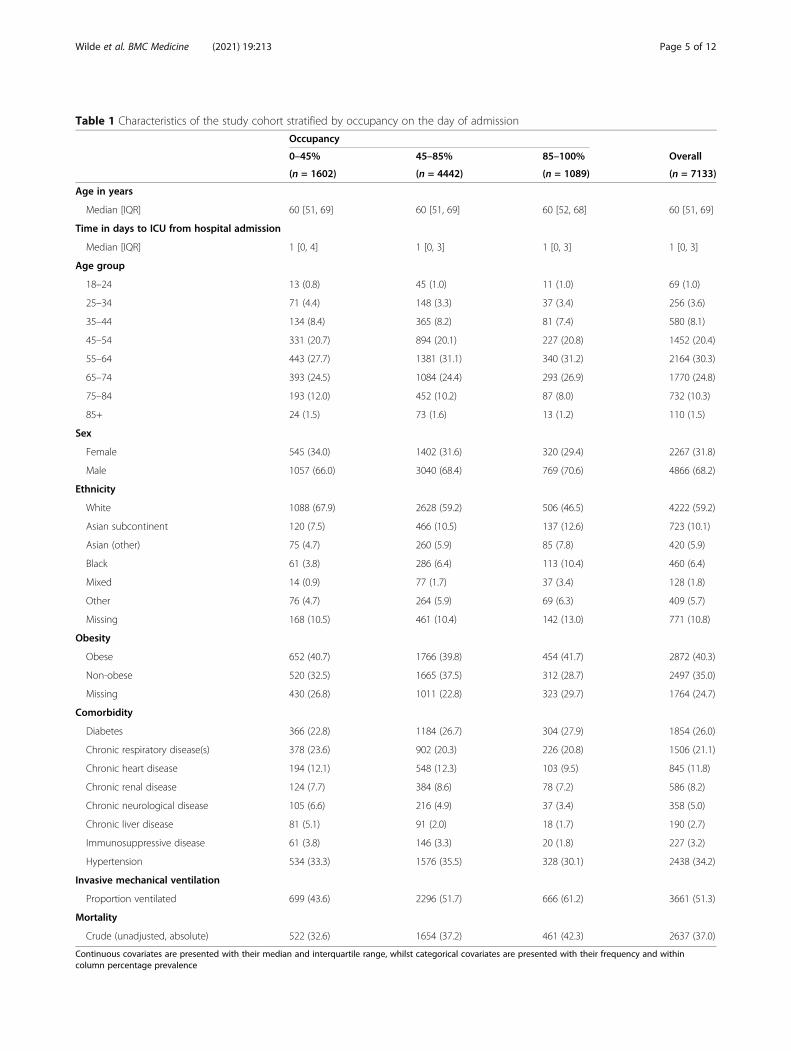
Table 1 Characteristics of the study cohort stratified by occupancy on the day of admission
Occupancy
0–45% 45–85% 85–100% Overall
(n = 1602) (n = 4442) (n = 1089) (n = 7133)
Age in years
Median [IQR] 60 [51, 69] 60 [51, 69] 60 [52, 68] 60 [51, 69]
Time in days to ICU from hospital admission
Median [IQR] 1 [0, 4] 1 [0, 3] 1 [0, 3] 1 [0, 3]
Age group
18–24 13 (0.8) 45 (1.0) 11 (1.0) 69 (1.0)
25–34 71 (4.4) 148 (3.3) 37 (3.4) 256 (3.6)
35–44 134 (8.4) 365 (8.2) 81 (7.4) 580 (8.1)
45–54 331 (20.7) 894 (20.1) 227 (20.8) 1452 (20.4)
55–64 443 (27.7) 1381 (31.1) 340 (31.2) 2164 (30.3)
65–74 393 (24.5) 1084 (24.4) 293 (26.9) 1770 (24.8)
75–84 193 (12.0) 452 (10.2) 87 (8.0) 732 (10.3)
85+ 24 (1.5) 73 (1.6) 13 (1.2) 110 (1.5)
Sex
Female 545 (34.0) 1402 (31.6) 320 (29.4) 2267 (31.8)
Male 1057 (66.0) 3040 (68.4) 769 (70.6) 4866 (68.2)
Ethnicity
White 1088 (67.9) 2628 (59.2) 506 (46.5) 4222 (59.2)
Asian subcontinent 120 (7.5) 466 (10.5) 137 (12.6) 723 (10.1)
Asian (other) 75 (4.7) 260 (5.9) 85 (7.8) 420 (5.9)
Black 61 (3.8) 286 (6.4) 113 (10.4) 460 (6.4)
Mixed 14 (0.9) 77 (1.7) 37 (3.4) 128 (1.8)
Other 76 (4.7) 264 (5.9) 69 (6.3) 409 (5.7)
Missing 168 (10.5) 461 (10.4) 142 (13.0) 771 (10.8)
Obesity
Obese 652 (40.7) 1766 (39.8) 454 (41.7) 2872 (40.3)
Non-obese 520 (32.5) 1665 (37.5) 312 (28.7) 2497 (35.0)
Missing 430 (26.8) 1011 (22.8) 323 (29.7) 1764 (24.7)
Comorbidity
Diabetes 366 (22.8) 1184 (26.7) 304 (27.9) 1854 (26.0)
Chronic respiratory disease(s) 378 (23.6) 902 (20.3) 226 (20.8) 1506 (21.1)
Chronic heart disease 194 (12.1) 548 (12.3) 103 (9.5) 845 (11.8)
Chronic renal disease 124 (7.7) 384 (8.6) 78 (7.2) 586 (8.2)
Chronic neurological disease 105 (6.6) 216 (4.9) 37 (3.4) 358 (5.0)
Chronic liver disease 81 (5.1) 91 (2.0) 18 (1.7) 190 (2.7)
Immunosuppressive disease 61 (3.8) 146 (3.3) 20 (1.8) 227 (3.2)
Hypertension 534 (33.3) 1576 (35.5) 328 (30.1) 2438 (34.2)
Invasive mechanical ventilation
Proportion ventilated 699 (43.6) 2296 (51.7) 666 (61.2) 3661 (51.3)
Mortality
Crude (unadjusted, absolute) 522 (32.6) 1654 (37.2) 461 (42.3) 2637 (37.0)
Continuous covariates are presented with their median and interquartile range, whilst categorical covariates are presented with their frequency and withincolumn percentage prevalence
Wilde et al. BMC Medicine (2021) 19:213 Page 5 of 12
2.92). There are several plausible explanations, but forthe sake of brevity, we will mention just two. The first isbased on the same principle as the other results, i.e. asoccupancy increases the availability of staff and re-sources decreases which can indirect contribute to an in-dividual’s mortality risk, and/or there may be a directeffect due to rationing of care or treatment limiting or-ders. Alternatively, this result could also reflect a specifictype of observation bias wherein patients who are likelyto survive are kept in ICU and in hospital longer [25],thus resulting in them being eventually discharged dur-ing periods of lower occupancy. In both instances fur-ther research is needed to clarify the underlying causalmechanism which is driving these observations.
In context of the literatureOur observations are consistent with the aforementionedBelgian and US VA study [13, 14], except that they extendthe results to suggest a linear association rather thanstepped increase at specific thresholds. Although previousCOVID-19 specific studies report an association between
larger ICUs and lower COVID-19 mortality [26], our re-sults are equivocal. However, we did observe an interactionwith (pre-pandemic) unit size, whereby larger ICUs experi-ence more exaggerated impacts from both higher and lower(surge) occupancy rates, although it is unclear from ourdata what is driving this heterogeneity. Finally, these resultsmight partially explain the decreased mortality rate seen inthe latter half of the first wave in the UK [27], where occu-pancy rates were much lower than at the peak [4]. Import-antly, the average number of co-morbidities per patientappears to rise when occupancy decreases (additional file 1:Fig. S4), suggesting if there was implicit/soft triaging itwould not have been in a manner that would explain theobserved effect (i.e. more co-morbidities are generallythought to be associated with a worse outcome). However,more research is necessary to definitively exclude this po-tential explanation for the results.
Strengths and limitationsThe strengths of this study are the national cohort ofpatient-level data with extensive capture of admissions [25],
Fig. 1 The adjusted odds ratios for the risk of mortality based on different ICU bed occupancy rates (treated as a three-level categorical variable). Thefull posterior distribution of the odds ratio (OR) for mortality given low occupancy 0–45% (top; green), and high occupancy 85–100% (bottom; red) arepresented. The PCIs presented are equally tailed credibility intervals for the posterior odds ratio distributions. The outer (less saturated) interval is the95% PCI, and the inner (more saturated) interval shows the 90% PCI. The reference category is 45–85% occupancy. Exact values are tabulated
Wilde et al. BMC Medicine (2021) 19:213 Page 6 of 12

coupled with a rigorous modelling method (additional file 1:eMethods). However, there are also several limitations. Forexample, we lack 30-day outcome data for discharged andtransferred individuals and thus were forced to model undera naïve assumption that these individuals survived, whichmay have impacted our estimates of the risk of mortality.Below is a more detailed discussion on three key issues that
should be accounted for when interpreting the associationsreported in this study:
Availability of physiological and clinical dataThe lack of physiological data and minimal clinical inter-vention data available in the CHESS dataset limits ourability to adjust for individual-level differences in
Fig. 2 The adjusted odds ratios for the risk of mortality based on ICU bed occupancy (treated as a linear continuous variable) on the day ofadmission (top) and each individual’s recorded outcome date (bottom). The full posterior distribution of the odds ratio (OR) for mortality givenoccupancy on the date of ICU admission (top; purple), mean occupancy during ICU stay (middle: pink), and occupancy on the date of eachindividual’s recorded outcome (bottom; blue) are presented. The PCIs presented are equally tailed credibility intervals for the posterior odds ratiodistributions. Occupancy was specified without multiplying out by 100 (i.e. 20% = 0.20); therefore, the odds ratio is for a step from 0% to 100%(i.e. 0.0 to 1.0). Exact values are tabulated
Wilde et al. BMC Medicine (2021) 19:213 Page 7 of 12

Fig. 3 (See legend on next page.)
Wilde et al. BMC Medicine (2021) 19:213 Page 8 of 12
severity and treatment. Thus, we cannot exclude thatthe observed associations are a result of unmeasuredconfounding due to differences in severity on admissionor variation in natural history due to the evolving treat-ment strategies that have been used over the course ofthe pandemic. At present, there is no single research en-vironment that links primary care, secondary care, ad-ministrative mortality records, surveillance datasets (e.g.CHESS), routine COVID testing (e.g. Public Health Eng-land’s testing data), and national audit data such as thatcollected by the UK Intensive Care National Audit andResearch Centre (ICNARC) which includes some of thenecessary information at the patient-level. Notably, thereare on-going attempts to link the aforementioned data-sets, e.g. [28]. However, this exercise is still notcomplete, and at the time of writing this, the (linked)ICNARC dataset is not available. In essence, a compre-hensive analysis including physiological and treatmentdata alongside all the other ancillary datasets is not pos-sible. To our knowledge, the UK consortium is the firstattempt to make such a national dataset and thus repli-cation of our analysis with these data once available is acritical future task.Although direct analysis to address the above issues is not
possible for the reasons outlined previously, it is still worthnoting that several studies from the UK suggest that any po-tential differences in severity on admission are unlikely to ex-plain the observed association between occupancy andmortality. For example, a study using linked CHESS datafrom the first wave of the pandemic did not find betweencentre variation in severity scores (e.g. mean APACHE-II) tobe associated with mortality risk [29]. Moreover, the UK na-tional audit (ICNARC) did not identify any significant tem-poral variation in mean severity scores of patients admittedto ICU over the course of this study [30]; both results incombination suggest that unmeasured confounding due todifferences in severity of admission are unlikely to fully ex-plain the observed association.
Incomplete characterisation of operational strainCharacterisation of operational strain as a function ofsurge occupancy likely fails to fully reflect the complex-ity of using non-specialist staff and other resource
allocation issues present when ‘creating’ new ICU beds,which could be the underlying causal explanation for theincreased mortality risk observed during periods of highoccupancy. Notably, previous research has identified adetrimental impact of insufficient (adequately trained)nursing and medical consultant staff on patient mortalityrisk in intensive care units [31], and staff absence rateswere raised 3-fold from the baseline of 4% at the peak ofthe first wave of the pandemic [32]. As such, it is notjust functional strain due to the creation of new beds,but also absence that could underlie a staff-specific ex-planation for the observed association. Again, this is akey area for future research to explore, especially withmounting evidence of operational strain being associatedwith increased mortality risk [33].
The prevalence of variants of concernDespite the more recent identification of several effectivetreatments for severe COVID-19, as bed saturation inICUs again became an issue from November 2020 toJanuary 2021, mortality rates increased across Englandto rates similar to that seen during the 1st wave [34].Notably, B117/Alpha was the most prevalent strain ofCOVID-19 in the UK during November 2020 [35] and isknown to have increased transmission and mortality risk[36]. Although we attempted to limit the potential im-pact of varying prevalence of different variants of con-cern (VOC), using specific date windows for our analysisand assessing week of admission as a sensitivity analysis,without knowledge of the specific variant COVID-19 foreach individual diagnosis, it is impossible to exclude thisas a cause of residual confounding.
Implications for policy makers and cliniciansThe results presented in this study are especially relevantgiven the identification of variants of concern with in-creased risk of transmission and mortality [36], as wellas vaccine/immunity escape potential [37], which suggestthat the risk of further epidemics driven by Sars-CoV-2are not implausible. From a mitigation perspective, ourstudy highlights the importance of public health inter-ventions (such as expeditious vaccination programmesand non-pharmacological interventions), to control both
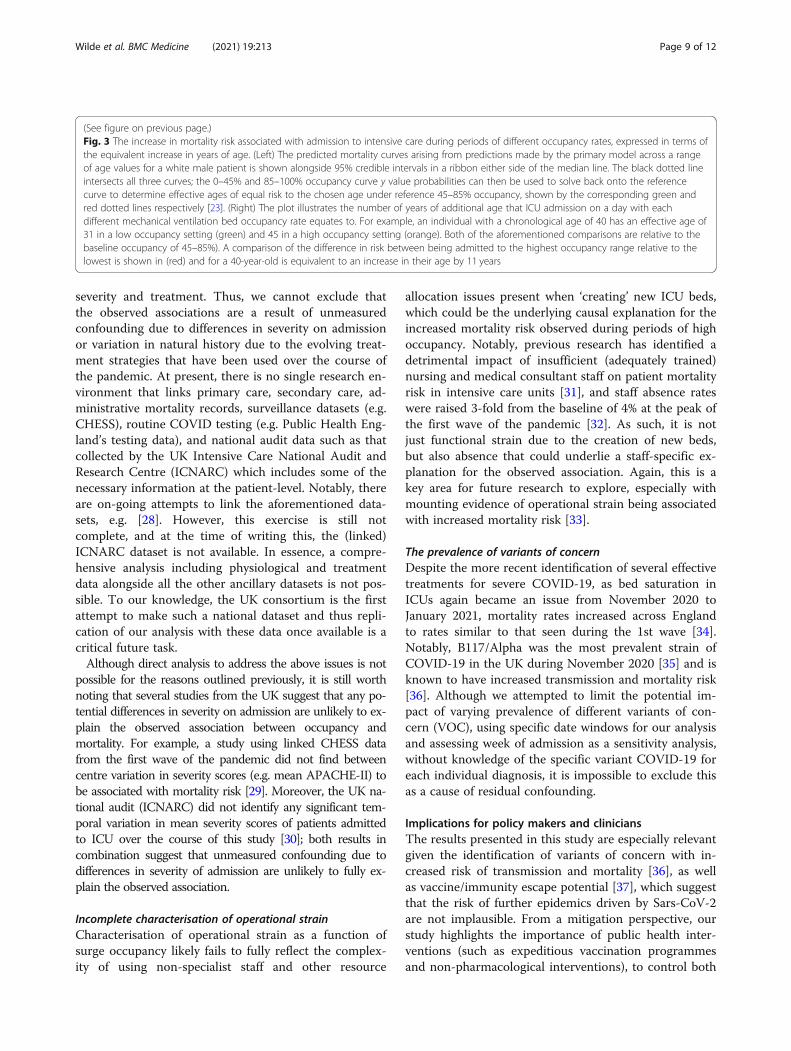
(See figure on previous page.)Fig. 3 The increase in mortality risk associated with admission to intensive care during periods of different occupancy rates, expressed in terms ofthe equivalent increase in years of age. (Left) The predicted mortality curves arising from predictions made by the primary model across a rangeof age values for a white male patient is shown alongside 95% credible intervals in a ribbon either side of the median line. The black dotted lineintersects all three curves; the 0–45% and 85–100% occupancy curve y value probabilities can then be used to solve back onto the referencecurve to determine effective ages of equal risk to the chosen age under reference 45–85% occupancy, shown by the corresponding green andred dotted lines respectively [23]. (Right) The plot illustrates the number of years of additional age that ICU admission on a day with eachdifferent mechanical ventilation bed occupancy rate equates to. For example, an individual with a chronological age of 40 has an effective age of31 in a low occupancy setting (green) and 45 in a high occupancy setting (orange). Both of the aforementioned comparisons are relative to thebaseline occupancy of 45–85%). A comparison of the difference in risk between being admitted to the highest occupancy range relative to thelowest is shown in (red) and for a 40-year-old is equivalent to an increase in their age by 11 years
Wilde et al. BMC Medicine (2021) 19:213 Page 9 of 12

incidence and prevalence of COVID-19, and thereforeprevent ICU saturation, as there is evidence of directharm to patients as a consequence. In terms of adapta-tion, during the second wave over 1000 patients in crit-ical care units across the UK were transferred due tocapacity reasons. Whilst there are pre-existing mecha-nisms to support these action [38], there is need formore investment in digital infrastructure to supportbetter coordinated action at the national level. Again,the natural experiment produced by the pandemic hasproduced substantial amounts of data on transferredpatients and load-sharing between trusts. The com-munity would benefit greatly from analysis of this realworld data to inform future best practices, fromwhom to consider transferring, how far, as well as ahost of other factors that influence decision making,rather than relying solely on model-based inferenceswhich suggest load-sharing is possible and probablyeffective [39]. Moreover, there are number of otheradaptation interventions that might be worth consid-ering for future research, such as modified treatmentstrategies with lower sedation doses and more aggres-sive extubation strategies to increase discharge ratesduring periods of high occupancy and therefore an in-creased baseline risk of mortality independent ofindividual-level factors.
ConclusionThe results of this study suggest that increasing occu-pancy of beds compatible with mechanical ventilation,a proxy for operational strain, is associated with ahigher mortality risk for individuals admitted to ICU.Further research is required to establish if this is acausal relationship or whether it reflects strain onother operational factors such as staff/residual con-founding not addressed due to the lack of physio-logical severity data. If causal, the result highlightsthe importance of strategies to keep ICU occupancylow to mitigate the impact of this type of resourcesaturation, rather than waiting for arbitrary thresholdsto be triggered, especially given the observation thataverage exposure (over an individual’s total length ofstay) to this operational risk factor is also associatedwith mortality risk.
AbbreviationsICU: Intensive care units; CHESS: COVID-19 Hospitalisation in EnglandSurveillance System; SitRep: Daily situation reports; NHS: National HealthService; STPs: Sustainability and transformation partnership; IMD: Indices ofmultiple deprivation; OR: Odds ratio; PCI: Posterior credibility interval;IQR: Interquartile range; VOC: Variant of concern; ICNARC: Intensive CareNational Audit and Research Centre
Supplementary InformationThe online version contains supplementary material available at https://doi.org/10.1186/s12916-021-02096-0.
Additional file 1:. eMethods, Figures S1-8, & Tables S1-6. eMethods– Additional detail on data handling and modelling methods. Fig S1. -Application of inclusion and exclusion criteria to raw data. Fig S2. -Unadjusted mortality rate in the ICU, alongside the total, confirmedCOVID and non-COVID national-level occupancies (Top) and percentagesof the study cohort in each of the three main ICU occupancy bins usedin the primary model (Bottom) across the duration of the study. Fig S3. -Trust-level missingness at varying inclusion thresholds. Fig S4. - Seven-day rolling averages for Age (Top) and Number of Comorbidities (Bot-tom) across the duration of the study. Fig S5. - Trust-Level Ventilator BedOccupancy (Based on Surge Capacities) Across England. Fig S6. - Mar-ginal posterior densities for linear population level coefficients in themodel, for mechanically ventilated bed occupancy binned as describedin the main text, comorbidities, sex and week of admission. Fig S7. -Marginal posterior densities for group level ethnicity intercepts. Fig S8. -The interaction between the baseline availability of beds supportingmechanical ventilation, and occupancy on the day of ICU admission.Table S1. - Marginal posterior densities for occupancy under sensitivityanalyses. Table S2. - Comparison of prior choices via their effect on pri-mary model OR estimates. Table S3. - Marginal posterior densities formortality ORs when occupancy is utilised at each individual’s final out-come date, rather than their date of admission to ICU. Table S4. - Mar-ginal posterior densities for mortality ORs when occupancy is taken asthe mean or median occupancy achieved during each patient’s stay.Table S5. - Marginal posterior densities for mortality ORs when occu-pancy is defined as a ratio relative to baseline capacity. Table S6. - Mar-ginal posterior densities for mortality ORs including baseline bedavailability and interaction with occupancy.
AcknowledgementsHW is supported by the Feuer International Scholarship in ArtificialIntelligence. TAM, IH, and SB acknowledge funding from the MedicalResearch Council (MRC) Centre for Global Infectious Disease Analysis(reference no. MR/R015600/1), jointly funded by the UK MRC and the UKForeign, Commonwealth & Development Office (FCDO), under the MRC/FCDO Concordat agreement and is also part of the EDCTP2 programmesupported by the European Union. SB and SF were support by the MRC toundertake research on COVID-19 (MR/V038109/1). SB acknowledges fundingfrom The Academy of Medical Sciences (SBF004/1080), Bill & Melinda GatesFoundation (CRR00280) and Imperial College Healthcare NHS Trust - BRCFunding (RDA02). JMD is supported by an Independent Fellowship fundedby Research England’s Expanding Excellence in England (E3) fund. SJV andBAM are supported by The Alan Turing Institute (Engineering and PhysicalSciences Research Council (EPSRC) grant EP/N510129/). SJV is also supportedby the University of Warwick IAA (Impact Acceleration Account) funding. SFis supported by EPSRC (EP/V002910/1). AD is supported by Wave 1 of theUKRI Strategic Priorities Fund under the EPSRC Grant EP/T001569/1.
Authors’ contributionsBAM conceived the study, with input from SJV and JMD. HW, JMD, and SJVprepared the data. HW, TM, and IH undertook the analysis, with input fromSJV, SF, and BAM. All authors (HW, TM, IW, JMD, SD, CP, AD, SB, SF, BAM, SJV)contributed to the development of the visualisations. All authors (HW, TM,IW, JMD, SD, CP, AD, SB, SF, BAM, SJV) contributed to the interpretation ofresults. BAM, HW, and TM drafted the manuscript. All authors (HW, TM, IW,JMD, SD, CP, AD, SB, SF, BAM, SJV) critically revised the article and approvedthe final version for submission.
FundingThis study received no direct funding. The individual authors’ funder had norole in the design of the study, the analysis, or the formulation of themanuscript.
Availability of data and materialsData, even a de-identified version, cannot be shared publicly as it was col-lected by Public Health England (PHE) as part of their statutory responsibil-ities, which allows them to process patient confidential data without explicitpatient consent. Given this particular set of circumstances, it was deemed byPHE to not be appropriate to share the data publically as then they would
Wilde et al. BMC Medicine (2021) 19:213 Page 10 of 12

then be unable to fulfil their duty of care to ensure that the data is used in amanner consistent with the statutory remit under which it was collected.Moreover, to retain the fidelity of the data and given that there are numer-ous unique cases due to low prevalence in certain geographic areas overthe time period we analyse, de-identification would be insufficient to complywith the minimum Office for National Statistics’ disclosure principles whichwould come with significant risk of re-identification. Data utilised in thisstudy were made available through an agreement between the University ofWarwick and PHE. Individual requests for access to the raw data are consid-ered directly by PHE (contact via [email protected]).
Declarations
Ethics approval and consent to participateThe study was reviewed and approved by the Warwick Biosciences ResearchEthics Committee (BSREC 120/19-20-V1.1) and sponsorship is being providedby University of Warwick (SOC.28/19-20). As a retrospective study of datacollected by PHE under their statutory authority, the requirement forindividual consent was unnecessary for this project by the BSREC.
Consent for publicationNot applicable.
Competing interestsSJV declares funding from IQVIA and Microsoft. BAM is an employee of theWellcome Trust and holds a Wellcome funded honorary post at UniversityCollege London for the purposes of carrying out independent research; theviews expressed in this manuscript do not necessarily reflect the views orposition of the Wellcome Trust. All other authors declare no competinginterests.
Author details1Department of Statistics, University of Warwick, Coventry CV4 7AL, UK. 2MRCCentre for Global Infectious Disease Analysis, Abdul Latif Jameel Institute forDisease and Emergency Analytics (J-IDEA), Imperial College London, London,UK. 3Institute of Biomedical & Clinical Science, RILD Building, Royal Devon &Exeter Hospital, University of Exeter Medical School, Barrack Road, Exeter EX25DW, UK. 4The Alan Turing Institute, British Library, 96 Euston Road, LondonNW1 2DB, UK. 5Institute of Health Informatics, University College London, 222Euston Rd, London, London NW1 2DA, UK. 6Health Data Research UK, GibbsBuilding, 215 Euston Road, London NW1 2BE, UK. 7Clinical OperationalResearch Unit, University College London, 222 Euston Rd, London, LondonNW1 2DA, UK. 8Department of Mathematics, Imperial College, London,London, UK. 9The Wellcome Trust, Gibbs Building, 215 Euston Road, LondonNW1 2BE, UK.
Received: 26 April 2021 Accepted: 16 August 2021
References1. World Health Organisation. COVID-19 Weekly Epidemiological Update - 29
December 2020; 2020. https://www.who.int/publications/m/item/weekly-epidemiological-update%2D%2D-29-december-2020. Accessed 1 Jan 2021.
2. Ferguson N, Laydon D, Nedjati Gilani G, et al. Report 9: Impact of non-pharmaceutical interventions (NPIs) to reduce COVID19 mortality and healthcaredemand. https://www.imperial.ac.uk/media/imperial-college/medicine/mrc-gida/2020-03-16-COVID19-Report-9.pdf . Accessed 1 Jan 2021.
3. Docherty AB, Harrison EM, Green CA, Hardwick HE, Pius R, Norman L, et al.Features of 20 133 UK patients in hospital with covid-19 using the ISARICWHO Clinical Characterisation Protocol: prospective observational cohortstudy. BMJ. 2020;22:369.
4. Mateen BA, Wilde H, Dennis JM, Duncan A, Thomas N, McGovern A, et al.Hospital bed capacity and usage across secondary healthcare providers inEngland during the first wave of the COVID-19 pandemic: a descriptiveanalysis. BMJ Open. 2021;11(1):e042945. https://doi.org/10.1136/bmjopen-2020-042945.
5. Mahase E. COVID-19: hospitals in crisis as ambulances queue and staff are asked tocancel leave. BMJ. 2020;371:m4980. https://doi.org/10.1136/bmj.m4980.
6. Bagshaw SM, Wang X, Zygun DA, Zuege D, Dodek P, Garland A, et al.Association between strained capacity and mortality among patients
admitted to intensive care: a path-analysis modeling strategy. J Crit Care.2018;43:81–7. https://doi.org/10.1016/j.jcrc.2017.08.032.
7. Eriksson CO, Stoner RC, Eden KB, Newgard CD, Guise JM. The associationbetween hospital capacity strain and inpatient outcomes in highlydeveloped countries: a systematic review. J Gen Intern Med. 2017;32(6):686–96. https://doi.org/10.1007/s11606-016-3936-3.
8. Chrusch CA, Olafson KP, McMillan PM, Roberts DE, Gray PR. High occupancyincreases the risk of early death or readmission after transfer from intensivecare. Crit Care Med. 2009;37(10):2753–8. https://doi.org/10.1097/CCM.0b013e3181a57b0c.
9. Howie AJ, Ridley SA. Bed occupancy and incidence of Methicillin-resistantStaphylococcus aureus infection in an intensive care unit. Anaesthesia. 2008;63(10):1070–3. https://doi.org/10.1111/j.1365-2044.2008.05575.x.
10. Gattinoni L, Radrizzani D, Simini B, Bertolini G, Ferla L, Mistraletti G, et al.Volume of activity and occupancy rate in intensive care units. Associationwith mortality. Intensive Care Med. 2004;30(2):290–7.
11. Wagner J, Gabler NB, Ratcliffe SJ, Brown SE, Strom BL, Halpern SD.Outcomes among patients discharged from busy intensive care units. AnnIntern Med. 2013;159(7):447–55. https://doi.org/10.7326/0003-4819-159-7-201310010-00004.
12. Iwashyna TJ, Kramer AA, Kahn JM. Intensive care unit occupancy andpatient outcomes. Crit Care Med. 2009;37(5):1545–57. https://doi.org/10.1097/CCM.0b013e31819fe8f8.
13. Taccone FS, Van Goethem N, De Pauw R, Wittebole X, Blot K, Van Oyen H,et al. The role of organizational characteristics on the outcome of COVID-19patients admitted to the ICU in Belgium. Lancet Reg Health-Europe. 2021;2:100019. https://doi.org/10.1016/j.lanepe.2020.100019.
14. Bravata DM, Perkins AJ, Myers LJ, Arling G, Zhang Y, Zillich AJ, et al.Association of intensive care unit patient load and demand with mortalityrates in US Department of Veterans Affairs hospitals during the COVID-19pandemic. JAMA Netw Open. 2021;4(1):e2034266.
15. Burrell AJ, Pellegrini B, Salimi F, Begum H, Broadley T, Campbell LT, et al.Outcomes of COVID-19 patients admitted to Australian intensive care unitsduring the early phase of the pandemic. Med J Aust. 2020;16:1.
16. Baumer T, Phillips E, Dhadda A, Szakmany T. Epidemiology of the first waveof COVID-19 ICU admissions in South Wales—the interplay betweenethnicity and deprivation. Front Med. 2020;7. https://doi.org/10.3389/fmed.2020.569714.
17. Public_Health_England. COVID-19 Hospitalisation in England SurveillanceSystem (CHESS) 2020. https://www.england.nhs.uk/coronavirus/wp-content/uploads/sites/52/2020/03/phe-letter-to-trusts-re-daily-covid-19-hospital-surveillance-11-march-2020.pdf. Accessed 1 Jan 2021.
18. Dennis JM, Mateen BA, Sonabend R, Thomas NJ, Patel KA, Hattersley AT,et al. Type 2 diabetes and COVID-19–related mortality in the critical caresetting: a national cohort study in England, March–July 2020. Diabetes Care.2021;44(1):50–7. https://doi.org/10.2337/dc20-1444.
19. Carpenter B, Gelman A, Hoffman MD, Lee D, Goodrich B, Betancourt M,et al. Stan: a probabilistic programming language. J Stat Softw. 2017;76(1).
20. Bürkner PC. brms: an R package for Bayesian multilevel models using Stan. JStat Softw. 2017;80(1):1–28.
21. Development Core Team RR. R: a language and environment for statisticalcomputing. 2011.
22. The Royal College of Emergency Medicine. Fixing emergency departmentstaffing, systems & support to deliver excellent patient centered care.https://www.rcem.ac.uk/docs/Policy/RCEM%20Vision%202020.pdf. Accessed3 Jan 2021.
23. Spiegelhalter D. How old are you, really? Communicating chronic riskthrough ‘effective age’ of your body and organs. BMC Med Inform DecisMak. 2016;16(1):104. https://doi.org/10.1186/s12911-016-0342-z.
24. England N. NHS England » NHS and other professional bodies’ response tothe Sunday Times, 25 October 2020 [Internet]. England.nhs.uk. 2020 [cited14 July 2021]. Available from: https://www.england.nhs.uk/2020/10/nhs-and-other-professional-bodies-response-to-sunday-times/.
25. Doidge JC, Gould DW, Ferrando-Vivas P, Mouncey PR, Thomas K, Shankar-Hari M, et al. Trends in intensive care for patients with COVID-19 in England,Wales, and Northern Ireland. Am J Respir Crit Care Med. 2021;203(5):565–74.https://doi.org/10.1164/rccm.202008-3212OC.
26. Gupta S, Hayek SS, Wang W, Chan L, Mathews KS, Melamed ML, et al.Factors associated with death in critically ill patients with coronavirusdisease 2019 in the US. JAMA Intern Med. 2020;180(11):1436–46. https://doi.org/10.1001/jamainternmed.2020.3596.
Wilde et al. BMC Medicine (2021) 19:213 Page 11 of 12
27. Dennis JM, McGovern AP, Vollmer SJ, Mateen BA. Improving survival ofcritical care patients with coronavirus disease 2019 in England: a nationalcohort study, March to June 2020. Crit Care Med. 2020.
28. Wood A, Denholm R, Hollings S, Cooper J, Ip S, Walker V, et al. Linkedelectronic health records for research on a nationwide cohort of more than54 million people in England: data resource. BMJ. 2021;373.
29. Qian Z, Alaa AM, van der Schaar M, Ercole A. Between-centre differences forCOVID-19 ICU mortality from early data in England. Intensive Care Med.2020;46(9):1779–80. https://doi.org/10.1007/s00134-020-06150-y.
30. Intensive Care National Audit and Research Centre. Report on COVID-19 incritical care: England, Wales and Northern Ireland (31 December 2020).2020.
31. West E, Barron DN, Harrison D, Rafferty AM, Rowan K, Sanderson C. Nursestaffing, medical staffing and mortality in intensive care: an observationalstudy. Int J Nurs Stud. 2014;51(5):781–94. https://doi.org/10.1016/j.ijnurstu.2014.02.007.
32. NHS hospital staff illness or absence up to three times usual level. Guardian.2021 [cited 7 March 2021]. Available from: https://www.theguardian.com/uk-news/2020/dec/30/nhs-hospital-staff-illness-or-absence-up-to-three-times-usual-level.
33. Wilde H, Dennis JM, McGovern AP, Vollmer SJ, Mateen BA. A nationalretrospective study of the association between serious operationalproblems and COVID-19 specific intensive care mortality risk. PLoS One.2021;16(7):e0255377. https://doi.org/10.1371/journal.pone.0255377.
34. Dennis JM, McGovern AP, Thomas NJ, Wilde H, Vollmer SJ, Mateen BA.Trends in 28-day mortality of critical care patients with coronavirus disease2019 in United Kingdom: a national cohort study, March 2020 to January2021. Crit Care Med. 2021.
35. Steel K, Donnarumma H. COVID-19 infection survey: UK Office for NationalStatistics; 2021.
36. Challen R, Brooks-Pollock E, Read JM, Dyson L, Tsaneva-Atanasova K, DanonL. Risk of mortality in patients infected with SARS-CoV-2 variant of concern202012/1: matched cohort study. BMJ. 2021;372.
37. Wibmer CK, Ayres F, Hermanus T, Madzivhandila M, Kgagudi P, OosthuysenB, et al. SARS-CoV-2 501Y. V2 escapes neutralization by South AfricanCOVID-19 donor plasma. Nat Med. 2021;27(4):622–5. https://doi.org/10.1038/s41591-021-01285-x.
38. Campbell D, Marsh S. NHS moving dozens of Covid patients a day in searchfor ICU beds. the Guardian. 2021 [cited 17 April 2021]. Available from:https://www.theguardian.com/world/2021/feb/03/dozens-covid-patients-move-daily-search-nhs-icu-beds.
39. Lacasa L, Challen R, Brooks-Pollock E, Danon L. A flexible method foroptimising sharing of healthcare resources and demand in the context ofthe COVID-19 pandemic. PLoS One. 2020;15(10):e0241027. https://doi.org/10.1371/journal.pone.0241027.
Publisher’s NoteSpringer Nature remains neutral with regard to jurisdictional claims inpublished maps and institutional affiliations.
Wilde et al. BMC Medicine (2021) 19:213 Page 12 of 12


