Embed Size (px)
Citation preview

10-1©2006 Raj JainCSE567MWashington University in St. Louis
The Art of The Art of Data PresentationData Presentation
Raj Jain Washington University in Saint Louis
Saint Louis, MO [email protected]
These slides are available on-line at:http://www.cse.wustl.edu/~jain/cse567-06/

10-2©2006 Raj JainCSE567MWashington University in St. Louis
OverviewOverview
! Types of Variables! Guidelines for Preparing Good Charts! Common Mistakes in Preparing Charts! Pictorial Games! Special Charts for Computer Performance
" Gantt Charts" Kiviat Graphs" Schumacher Charts
! Decision Maker’s Games

10-3©2006 Raj JainCSE567MWashington University in St. Louis
Types of VariablesTypes of Variables
! Type of computer: Super computer, minicomputer, microcomputer
! Type of Workload: Scientific, engineering, educational! Number of processors! Response time of system
10-4©2006 Raj JainCSE567MWashington University in St. Louis
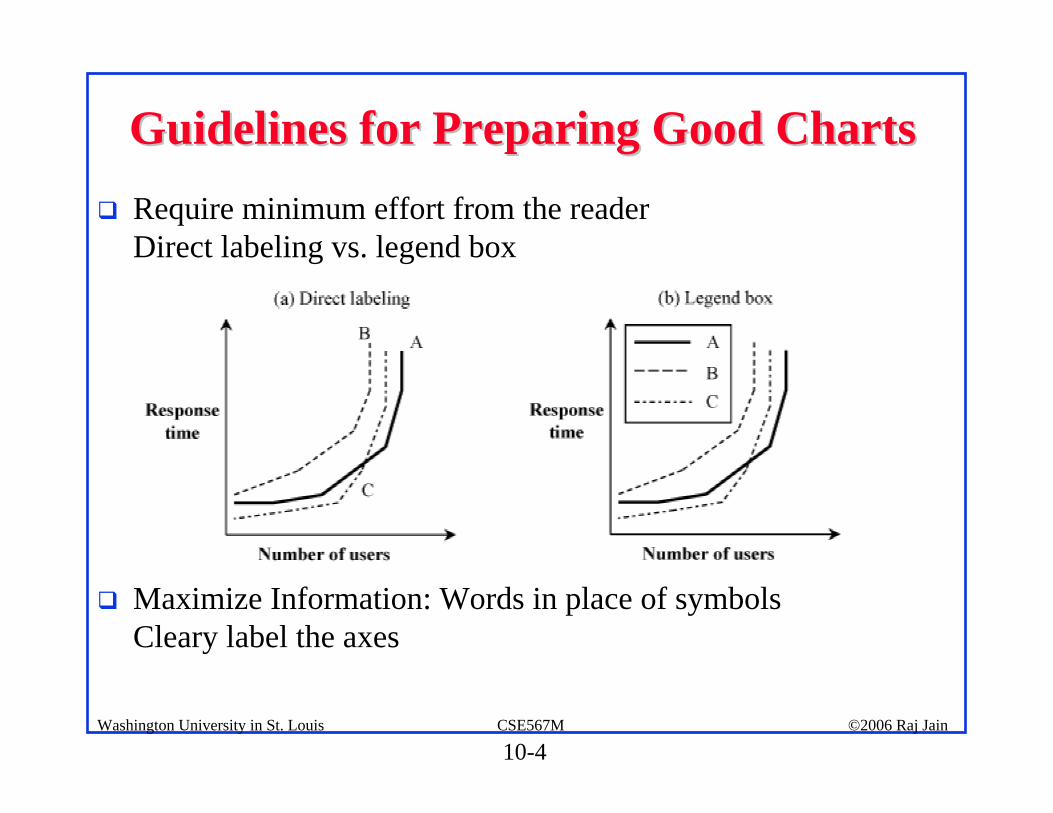
Guidelines for Preparing Good ChartsGuidelines for Preparing Good Charts! Require minimum effort from the reader
Direct labeling vs. legend box
! Maximize Information: Words in place of symbolsCleary label the axes

10-5©2006 Raj JainCSE567MWashington University in St. Louis
Guidelines (cont)Guidelines (cont)! Minimize Ink: No grid lines, more details
! Use Commonly accepted practices: origin at (0,0)Independent variable (cause) along x axis, linear scales, increasing scales, equal divisions
! Avoid ambiguity: Show coordinate axes, scale divisions, origin. Identify individual curves and bars.
! See checklist in Box 10.1

10-6©2006 Raj JainCSE567MWashington University in St. Louis
Common Mistakes in Preparing ChartsCommon Mistakes in Preparing Charts! Presenting too many alternatives on a single chart
Max 5 to 7 messages => Max 6 curves in a line charts, no more than 10 bars in a bar chart, max 8 components in a pie chart
! Presenting many y variables on a single chart
10-7©2006 Raj JainCSE567MWashington University in St. Louis
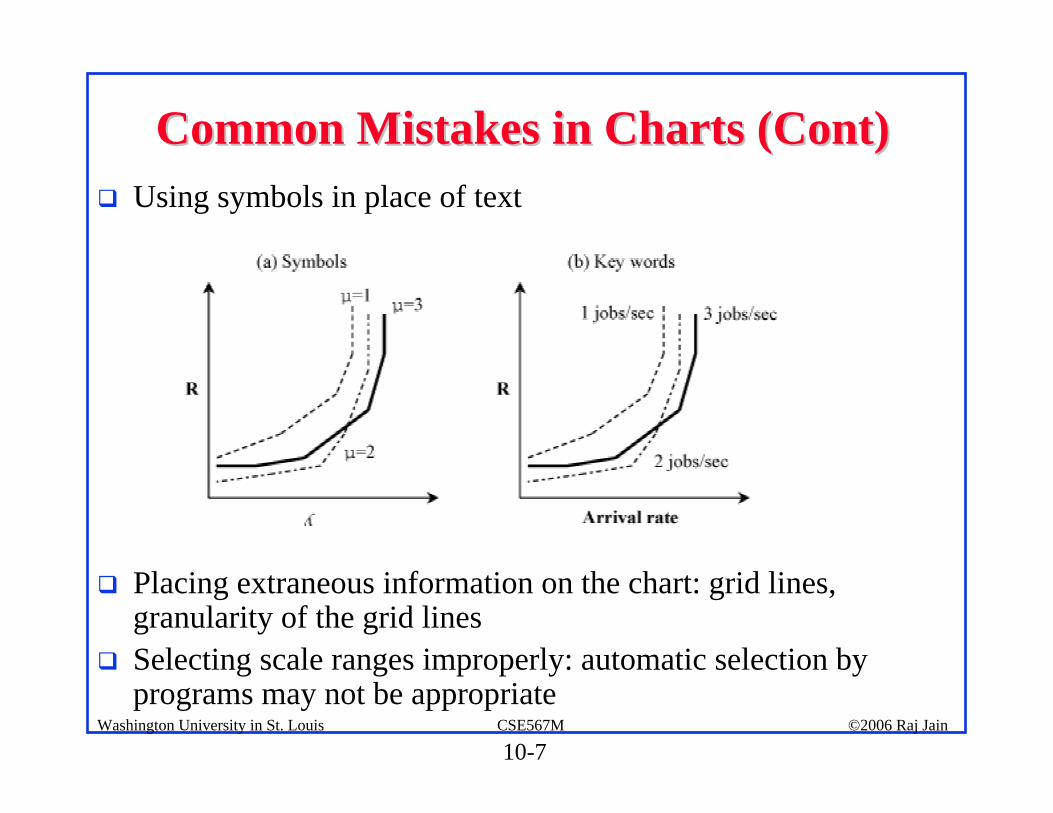
Common Mistakes in Charts (Cont)Common Mistakes in Charts (Cont)! Using symbols in place of text
! Placing extraneous information on the chart: grid lines, granularity of the grid lines
! Selecting scale ranges improperly: automatic selection by programs may not be appropriate

10-8©2006 Raj JainCSE567MWashington University in St. Louis
Common Mistakes in Charts (Cont)Common Mistakes in Charts (Cont)
! Using a line chart in place of column chart: line => Continuity
CPU Type8000 8100 83008200
MIPS

10-9©2006 Raj JainCSE567MWashington University in St. Louis
Pictorial GamesPictorial Games! Using non-zero origins to emphasize the difference
Three quarter high-rule => height/width > 3/4

10-10©2006 Raj JainCSE567MWashington University in St. Louis
Pictorial Games (Cont)Pictorial Games (Cont)
! Using double-whammy graph for dramatizationUsing related metrics

10-11©2006 Raj JainCSE567MWashington University in St. Louis
Pictorial Games (Cont)Pictorial Games (Cont)
! Plotting random quantities without showing confidence intervals

10-12©2006 Raj JainCSE567MWashington University in St. Louis
Pictorial Games (Cont)Pictorial Games (Cont)
! Pictograms scaled by height
MinePerformance = 2
YoursPerformance = 1

10-13©2006 Raj JainCSE567MWashington University in St. Louis
Pictorial Games (Cont)Pictorial Games (Cont)
! Using inappropriate cell size in histograms
[0,2) [2,4) [4,6) [6,8) [8,10) [10,12) [0,6) [6,12)Response Time Response Time
Frequency Frequency
2468
1012
02468
1012
0

10-14©2006 Raj JainCSE567MWashington University in St. Louis
Pictorial Games (Cont)Pictorial Games (Cont)
! Using broken scales in column charts
ASystem
Resp.Time
2468
1012
0B C D E F A
System
Resp.Time
0B C D E F
9
10
11
12

10-15©2006 Raj JainCSE567MWashington University in St. Louis
Special Charts for Computer Performance Special Charts for Computer Performance
! Gantt charts! Kiviat Graphs! Schumacher's charts

10-16©2006 Raj JainCSE567MWashington University in St. Louis
Gantt ChartsGantt Charts! Shows relative duration of a number of conditions
CPU
IO Channel
Network
20% 40% 60% 80% 100%0%
60
20 20
30 10 5 15
Utilization

10-17©2006 Raj JainCSE567MWashington University in St. Louis
Example: Data for Gantt ChartExample: Data for Gantt Chart

10-18©2006 Raj JainCSE567MWashington University in St. Louis
Draft of the Gantt ChartDraft of the Gantt Chart

10-19©2006 Raj JainCSE567MWashington University in St. Louis
Final Gantt ChartFinal Gantt Chart

10-20©2006 Raj JainCSE567MWashington University in St. Louis
Kiviat GraphsKiviat Graphs! Radial chart with even number of metrics! HB and LB metrics alternate! Ideal shape: star
CPUBusy CPU in
Supervisor State
CPU inProblem State
CPUWaitAny Channel
Busy
Channel onlyBusy
CPU/ChannelOverlap
CPU OnlyBusy

10-21©2006 Raj JainCSE567MWashington University in St. Louis
Kiviat Graph for a Balanced SystemKiviat Graph for a Balanced System
! Problem: Inter-related metricsCPU busy = problem state + Supervisor state
CPU wait = 100 – CPU busyChannel only – any channel –CPU/channel overlap
CPU only = CPU busy – CPU/channel overlap
CPUBusy CPU in
Supervisor State
CPU inProblem State
CPUWaitAny Channel
Busy
Channel onlyBusy
CPU/ChannelOverlap
CPU OnlyBusy
10-22©2006 Raj JainCSE567MWashington University in St. Louis
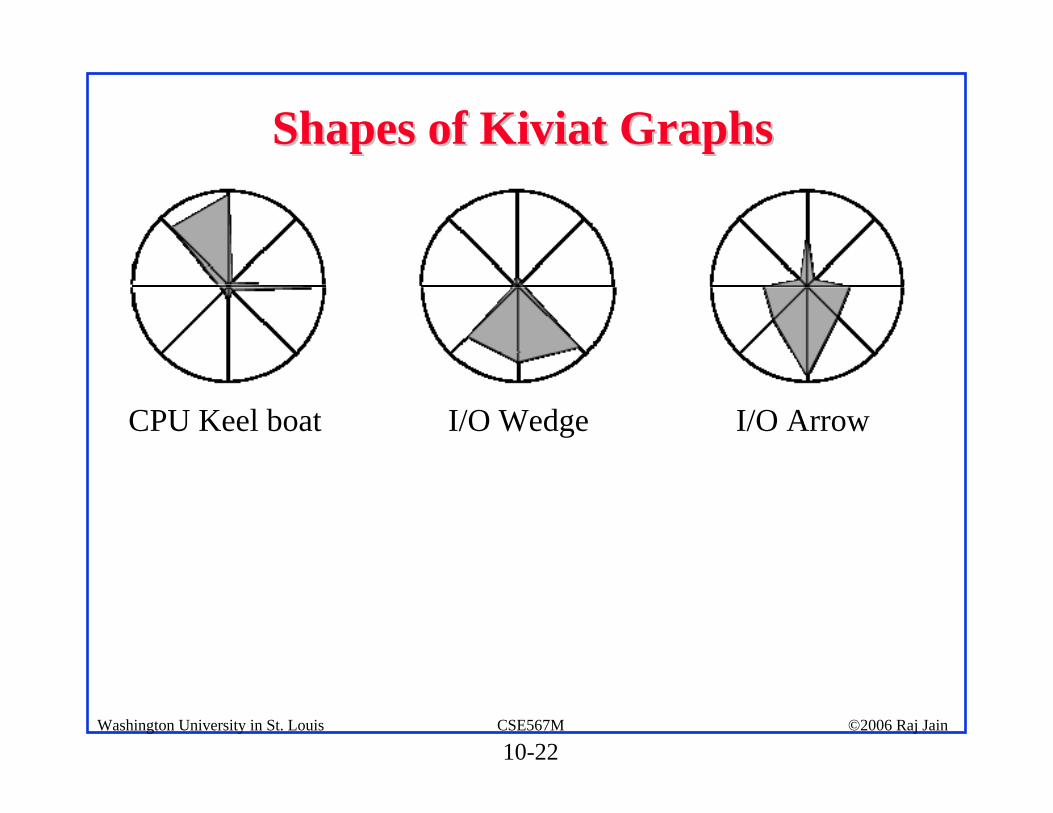
Shapes of Kiviat GraphsShapes of Kiviat Graphs
CPU Keel boat I/O Wedge I/O Arrow

10-23©2006 Raj JainCSE567MWashington University in St. Louis
Merrill’s Figure of Merit (FoM)Merrill’s Figure of Merit (FoM)
! Performance = {x1, x2, x3, …, x2n}Odd values are HB and even values are LB
! x2n+1 is the same as x1
! Average FOM = 50%

10-24©2006 Raj JainCSE567MWashington University in St. Louis
Example: FoMExample: FoM
! System A:

10-25©2006 Raj JainCSE567MWashington University in St. Louis
FoM Example (Cont)FoM Example (Cont)! System B:
System B has a higher figure of merit and it is better.

10-26©2006 Raj JainCSE567MWashington University in St. Louis
Figure of Merit: Known ProblemsFigure of Merit: Known Problems
! All axes are considered equal! Extreme values are assumed to be better! Utility is not a linear function of FoM! Two systems with the same FoM are not equally
good.! System with slightly lower FoM may be better

10-27©2006 Raj JainCSE567MWashington University in St. Louis
Kiviat Graphs For Other SystemsKiviat Graphs For Other Systems! Networks:
ApplicationThroughput
Packets With Error
Implicit Acks
Duplicate Packets
LinkUtilization
LinkOverhead

10-28©2006 Raj JainCSE567MWashington University in St. Louis
Schumacher ChartsSchumacher Charts! Performance matrix are plotted in a tabular manner! Values are normalized with respect to long term means and
standard deviations! Any observations that are beyond mean ± one standard
deviation need to be explained! See Figure 10.25 in the book

10-29©2006 Raj JainCSE567MWashington University in St. Louis
Performance Analysis Rat HolesPerformance Analysis Rat Holes
ConfigurationWorkload Metrics Details

10-30©2006 Raj JainCSE567MWashington University in St. Louis
Reasons for not Accepting an AnalysisReasons for not Accepting an Analysis! This needs more analysis.! You need a better understanding of the workload.! It improves performance only for long IOs/packets/jobs/files,
and most of the IOs/packets/jobs/files are short.! It improves performance only for short IOs/packets/jobs/files,
but who cares for the performance of shortIOs/packets/jobs/files, its the long ones that impact the system.
! It needs too much memory/CPU/bandwidth and memory/CPU/bandwidth isn't free.
! It only saves us memory/CPU/bandwidth and memory/CPU/bandwidth is cheap.
See Box 10.2 on page 162 of the book for a complete list

10-31©2006 Raj JainCSE567MWashington University in St. Louis
SummarySummary
1. Qualitative/quantitative, ordered/unordered, discrete/continuous variables
2. Good charts should require minimum effort from the reader and provide maximum information with minimum ink
3. Use no more than 5-6 curves, select ranges properly, Three-quarter high rule
4. Gantt Charts show utilizations of various components5. Kiviat Graphs show HB and LB metrics alternatively on a
circular graph6. Schumacher Charts show mean and standard deviations7. Workload, metrics, configuration, and details can always be
challenged. Should be carefully selected.

10-32©2006 Raj JainCSE567MWashington University in St. Louis
Exercise 10.1Exercise 10.1What type of chart (line or bar) would you use to plot:
a. CPU usage for 12 months of the yearb. CPU usage as a function of time in monthsc. Number of I/O's to three disk drives: A, B, and Cd. Number of I/O's as a function of number of disk drives in
a system
10-33©2006 Raj JainCSE567MWashington University in St. Louis
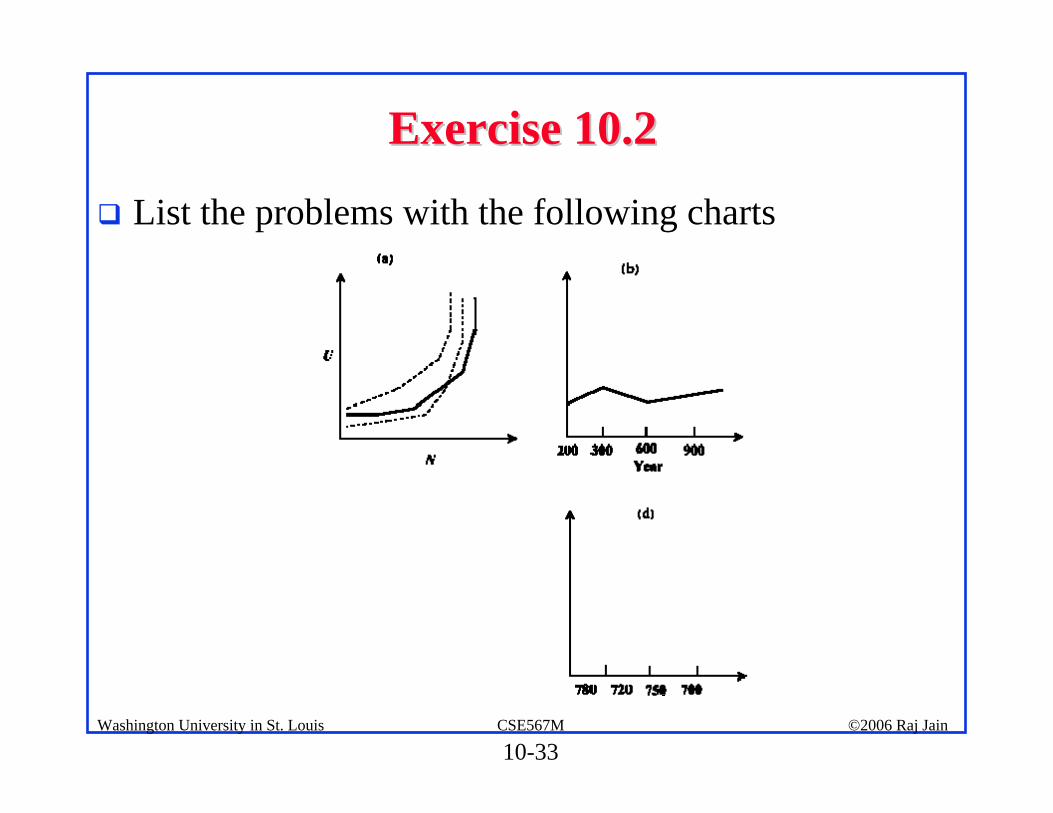
Exercise 10.2Exercise 10.2
! List the problems with the following charts

10-34©2006 Raj JainCSE567MWashington University in St. Louis
Exercise 10.3Exercise 10.3! On a system consisting of 3 resources, called A, B, and C. The
measured utilizations are shown in the following table. A zero in a column indicates that the resource is not utilized. Draw a Gantt chart showing utilization profiles.
10-35©2006 Raj JainCSE567MWashington University in St. Louis
Exercise 10.4Exercise 10.4! The measured values of the eight performance metrics listed in
Example 10.2 for a system are: 70%, 10%, 60%, 20%, 80%, 30%, 50%, and 20%. Draw the Kiviat graph and compute its figure of merit.

10-36©2006 Raj JainCSE567MWashington University in St. Louis
Exercise 10.5Exercise 10.5! For a computer system of your choice, list a number of HB and
LB metrics and draw a typical Kiviat graph using data values of your choice.

10-37©2006 Raj JainCSE567MWashington University in St. Louis
HomeworkHomework
! Read Chapter 10! Submit solutions to exercises 10.3 and 10.4
Approximate hand-drawn figures are sufficient