Embed Size (px)
Citation preview
By David A. BanisterChief Investment StrategistActiveTradingPartners.com
TheMarketTrendForecast.com
THE ART AND SCIENCEOF CROWD BEHAVIORAL BASED INVESTING AND TRADING
Investing for extreme profits in Small Cap Stocks while understanding market behavior.
www.thetechnicaltraders.com 2
Active Trading Partners, LLC was founded by David Banister, a former Independent Investment Advisor in New England. David had a very successful practice with a strong client base, but felt the need to reach a bigger audience and to teach as many people as he could his techniques and strategies for investing and forecasting market trends. After exhaustive research and years of trading experience, ActiveTradingPartners.com was launched in the fall of 2009.
At ATP, David combines a thorough understanding of company fundamentals and catalysts, with a wealth of technical analysis experience to take advantage of the crowd behavior in the markets. Often entering into trades after others have sold and often taken a loss, allows ATP to provide low risk entry points and high upside shortly after our recommendations. In addition, our technical analysis is largely based on crowd behavioral patterns as outlined in this short E-Book. Those patterns serve our Partners well as we consistently out-perform the major indices, and actively manage our positions both for the short term and the long term.
David is or has been quoted and has articles published frequently on CBS Marketwatch.com, 321gold.com, Stockhouse.com, Theaureport.com, TheStreet.com, Kitco.com and numerous other industry publications. Chris Vermeulen of Thegoldandoilguy.com met David in in late 2008 as the financial crisis was unfolding. After numerous months of following the trading profits of and methodologies that David employs now at ATP, Chris suggested that a joint venture be formed and we offer this service to a select group of partners (subscribers). The demand for more active trading advisory services has exploded in the past few years, but we believe very few deliver low risk trades along with longer term core portfolio positions that are consistently profitable. Our track record is in the vicinity of 90% success rates on every trade or Core Position recommended. If you can be 60% successful in the markets, you can make a lot of money. ATP feels it has room to spare on that bar. Perhaps you will consider giving us a try and we hope you enjoy this E book!
David A. BanisterChief Investment Strategistwww.ActiveTradingPartners.comwww.TheMarketTrendForecast.com
www.thetechnicaltraders.com 3
MARKETS AND STOCKS MOVE IN RELIABLE PATTERNS BASED ON CROWD BEHAVIORAL CHARACTERISTICS
Before I can even begin, it’s important for readers to understand that my foundation for investing in small cap stocks and/or ETF’s is based on Elliott Wave theory to a large extent. Now, before you assume that EW theory is bunk or doesn’t work, remember that not all Chef ’s know how to cook a good steak either. I have been blessed with ability to recognize correctly Elliott Wave patterns for example in the SP 500 and Gold/Silver for many years without much effort. This is what I call the Art and Science of Elliott Wave Theory. It’s not as simple as picking up a book, reading about the theory, and then immediately successfully applying it. It is almost as if you need to have a “feel” and “vibe” for the theory, and be able to recognize patterns as they are emerging and before they complete. Many EWT forecasters fail because the matter between their ears is overly biased in either Bull or Bear directions. They spend too much time reading Economic reports and listening to CNBC noise to focus on the big picture, or what I call the “back of napkin” views.
So with that said, the foundation of my forecasting and trading-investing work is based on the understanding that stocks, markets, sectors largely move based on crowd perception of news. The crowd is either in the mood to perceive and act on news as pessimistic and or optimistic. The news itself can be virtually identical during different periods in the market, or in the life cycle of a stock, but the crowd perception and behavior is what changes. If you can learn to anticipate when the crowd is acting over exuberantly or overly pessimistic, you can obviously take extreme advantage and profit.
SEEING THE BOTTOM IN ADVANCE, FIBONACCI AND IT’S IMPORTANCE:Fibonacci sequences are important to learn because they consistently show up in trading and market patterns. 1,2,3,5,8,13,21,34,55,89 and so forth. You take the prior two numbers in the sequence and add them together to get your next number
www.thetechnicaltraders.com 4
in the sequence. Often we take one Fibonacci number divided by another to come up with a Fibonacci percentage, used for pullbacks and advances. 8 divided by 13 is 61.8%, 3 divided by 8 is 38% and so forth. I use these patterns all the time.
FIBONACCI AND ELLIOTT WAVES:To wit, in late February of 2009 I wrote a piece for 321Gold.Com entitled “Is The Market About To Bottom And Nobody Knows It?” My theory was based on Elliott Wave patterns in the final process of bottoming out after 5 fibonacci months of drastic decline. The sentiment levels were at horrid extremes on the bear side, but the patterns on the SP 500 were 3-3-5 in nature. Notice those are all Fibonacci numbers, because crowds move in Fibonacci sequences as well. 3-3-5 means we had 3 waves down, 3 waves up, and 5 waves big on the downside into early March 2009. The 5 months was also a Fibonacci period of time. In addition, at 666 the SP 500 corrected a Fibonacci 61.8% of the rally low of 1974 to the rally highs of March 2000. It was time to get long, and the best place to get long was small cap stocks.
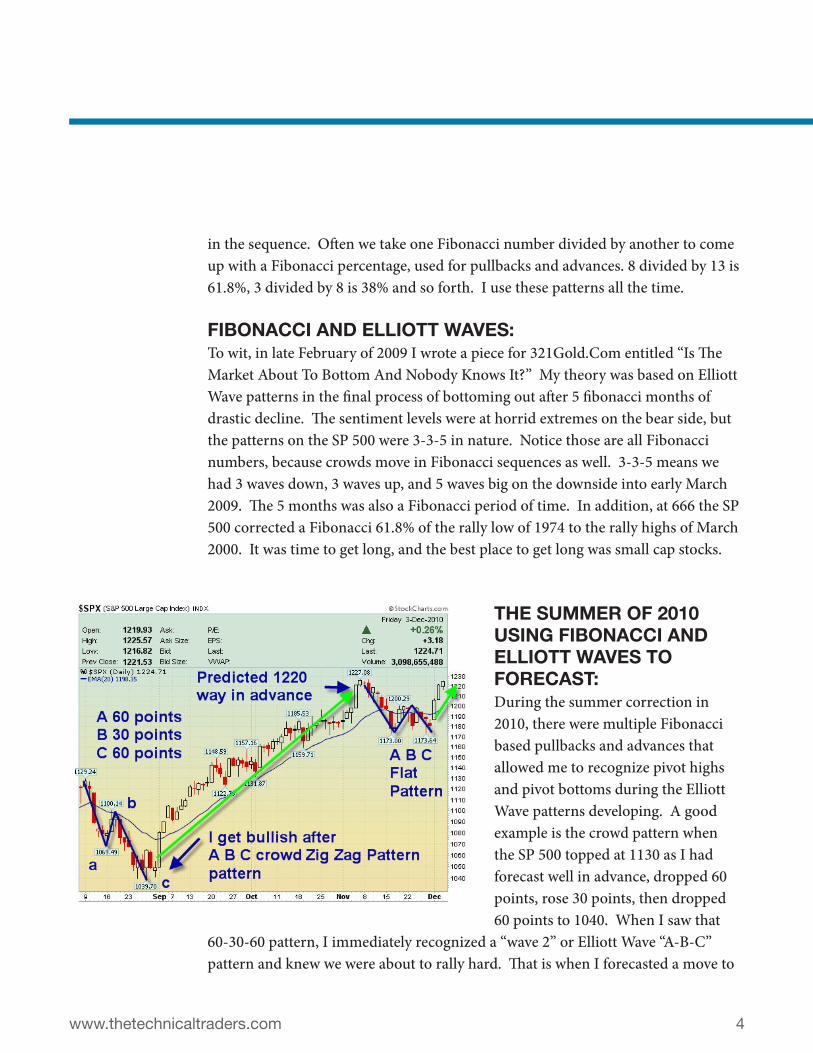
THE SUMMER OF 2010 USING FIBONACCI AND ELLIOTT WAVES TO FORECAST:During the summer correction in 2010, there were multiple Fibonacci based pullbacks and advances that allowed me to recognize pivot highs and pivot bottoms during the Elliott Wave patterns developing. A good example is the crowd pattern when the SP 500 topped at 1130 as I had forecast well in advance, dropped 60 points, rose 30 points, then dropped 60 points to 1040. When I saw that
60-30-60 pattern, I immediately recognized a “wave 2” or Elliott Wave “A-B-C” pattern and knew we were about to rally hard. That is when I forecasted a move to
www.thetechnicaltraders.com 5
1220 on the SP 500 weeks in advance, and we topped at 1227 and peaked for that move on November 5th. How did I know we would rally to 1220? I used Fibonacci mathematics to calculate a likely 180 point move to the upside. We had first rallied from 1010-1130, or 120 points. Assuming we were about to enter a “wave 3 up bull pattern”, I simply took 120 points and multiplied by 150% (50% is a Fibonacci sequence) to come up with 1220. I missed it by 7 points. Most recently I noticed another A B C pattern, called a “flat”. This alerted us to get long the market again at 1174 recently, as a 4th Ellliott wave was completing. Again, crowd behavorial based.
BENEFITING FROM LACK OF INFORMATION AND COVERAGE- MICRO CAP STOCKSSmall cap stocks are the best place to exploit inefficiencies in the delivery of information to the small investor. In most cases they are not widely followed nor do they have any analyst coverage. This opens up a brilliant opportunity to do your own ground work and get an edge on your fellow investors and traders. As much as I am a technical analyst at heart, getting a strong grasp on the risk factors and catalysts for a small company can often help or prevent you from being shaken out on volatile trading moves, which are common for the micro-cap and small cap sector. I read proxy materials, call executives at small companies, contact people in the industry, and read everything I can get my hands on. I often browse through message boards frequently, because there is always at least one poster who is considered the “axe” on a small company on a message board. Ferreting out who knows their information and will share their research is the key.
MARKET MAKER STOP LOSS RUNS- DON’T GET TRAPPED BY FEAR- WATERFALL DECLINESMany traders/Investors assume you should have a “stop-loss” order in place after you make a trade entry or start a new position. Well, yes and no because it’s a double edged sword. Market makers in small or even larger cap names can easily “run the stops” on a small cap stock and take it down hard. As a stock is falling in price, it triggers fear mechanisms in the average investor and even those without stop losses begin to sell at market. Traders and Investors like to avoid the emotion

www.thetechnicaltraders.com 6
of fear, more so than the enjoyment of greed. Fear is a motivating factor in people making very poor trading and investing decisions. You rarely make a good decision when you are panicking. Stop loss runs happen either due to market makers manipulating this fear factor, and/or a group of traders with foolish stop losses set in advance on very volatile stocks. Instead of getting “stopped out” and watching your position later take off and run back up, consider “buying into the panic”, which is what I do. If I’ve done my research and can see a stock is getting really oversold for emotional reasons, I’ll start buying by scaling in.
At my ATP service, we often look for these market making stop loss panic drops, or what I call “waterfall declines”. Waterfall declines often happen over 3 or 5 Fibonacci days, sometimes 8 or 13 days, they often have some type of ABC pattern too. A waterfall decline is my friend assuming I like the company and have done my research, because in 9 out of 10 cases the waterfall pattern is actually human or crowd behavior in action. Fear turns to panic turns to stop losses being run all the way down. I start to scale in by working into my position in the final stages of the waterfall, with the intent of profiting on the inevitable reversal. At ATP we call those “Active Trades”, or positions we hold for 3-30 days. Our success rate is 85-90%, because I wait for the LOW RISK set up to initiate the position, we do not chase stocks.
www.thetechnicaltraders.com 7
DO NOT CHASE STOCKS- A FEW INDICATORS TO USE TO BUY AND/OR HOLD (MOVING AVERAGES)
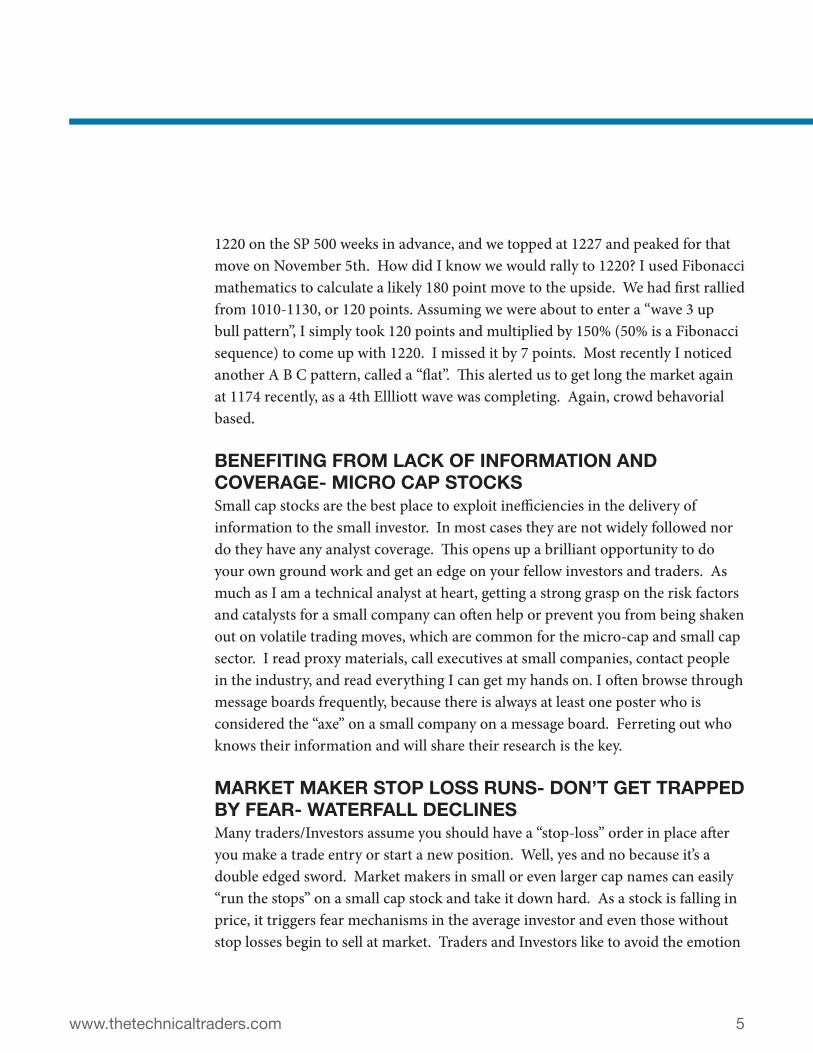
With over 5000 stocks to choose from to invest or trade with, why subject yourself to higher risk by chasing a hot stock up? What I’ve always advised is to look for good strong stocks in a strong pullback, and then buy those which reduces your risk, while retaining strong upside. There are many technical indicators you can use, but in a strong bull cycle for a stock there are two that work very well. The 20 day exponential moving average on a daily chart, and the 10 week EMA on the weekly chart. Pullbacks towards or near the 20 day moving average in a strong uptrending stock are almost always
very good entry points or tradeable buy points. In addition, count the number of trading days since the recent peak where the pullback began, and look for 5, 8, or 13 as your possible pivot days to buy your position. Overlay some basic oversold indicators like Stochastics or RSI or CCI to help look for very oversold stocks in uptrends, near the 20 day MA, and perhaps at a 5, 8 or 13 day point. Using a confluence of indicators (but not too many) can help you identify those lower risk strong upside opportunities. The one here is Stellar Biotech, which ATP advised at .37 cents and as of this writing is at $1.07, but we have stayed long due to both fundamentals and technicals.
TRIANGLE OR WEDGE PATTERNS AND FIBONACCI TRADING DAYS, ARE CROWD BEHAVIORAL SIGNALS:R.N. Elliott called triangles “A period of consolidation that allows the economics of the prior move to catch up with the movement in price”. What he meant in
www.thetechnicaltraders.com 8
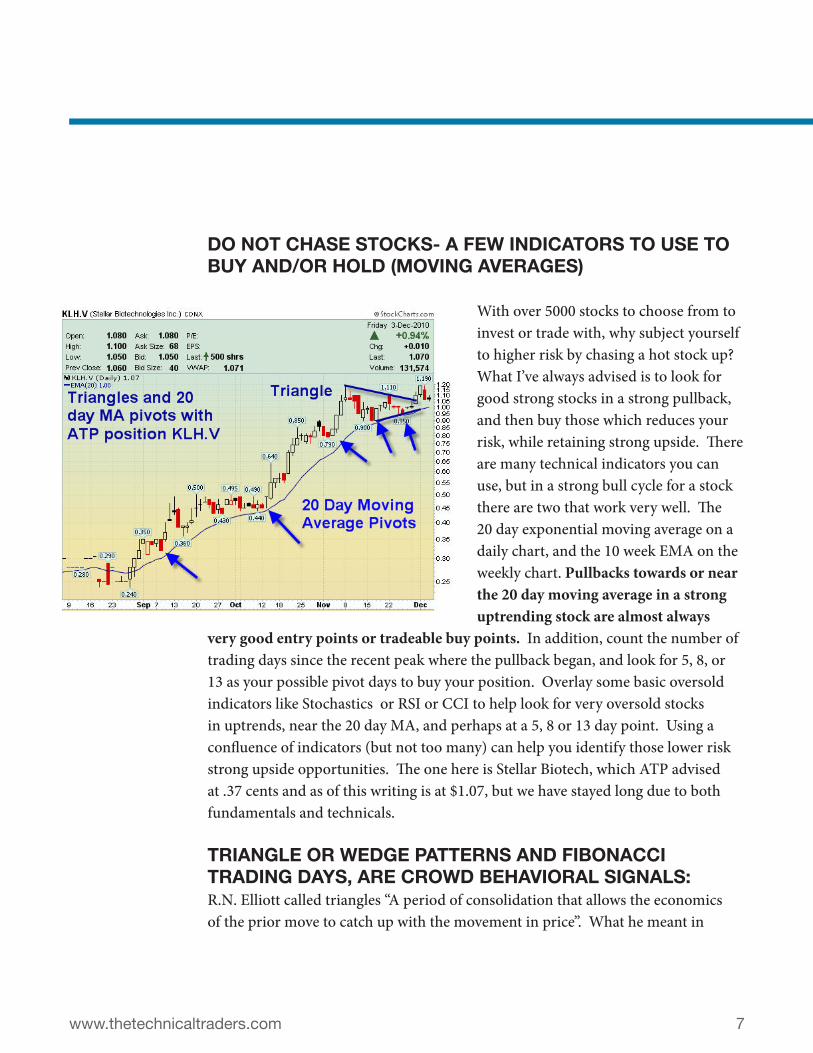
English was, sometimes the market index or a stock has a strong upward move, and then begins a sideways type of “flag” pattern or “triangle” pattern that consolidates the move. If you can learn to spot these short term 8 or 13 day patterns, assuming it’s a good stock in a good uptrend, you can identify another buy point. I’ve used Triangles or flag patterns for years to predict breakouts after consolidations and to accurate forecast the next pivot high well in advance, that type of information can make you a small fortune.
Take the case of East West Petroleum which is an ATP core position stock first recommended at 62 cents in early October 2010. The stock as of this article is at $1.32 a share, and we recently added to our positions from 1.05-1.15. However, at $1.32 we see another flag or triangle pattern emerging, and over just about 8 Fibonacci days. The prior two were 13 Fibonacci Days, and in both cases the stock resumed it’s advance. Not to mention, the 20 day moving average also happened to come into play both at the end of the triangles, Fibonacci
days, and formed the bottoms.
THE ABC PATTERN CAN MAKE YOU A FORTUNE: A 77% GAIN IN 12 WEEKS SAMPLEI’ve made a small fortune trading off the end of a B wave consolidation. Let me explain if I can. Often times a stock or sector has a huge initial run, what I will call an “A” wave rally. Now, most investors will miss that first run and/or chase it right near the top of it’s apex. Instead, look for patterns where a large run occurred, and then a reasonably decent period of consolidation (Could be weeks or even months)
www.thetechnicaltraders.com 9
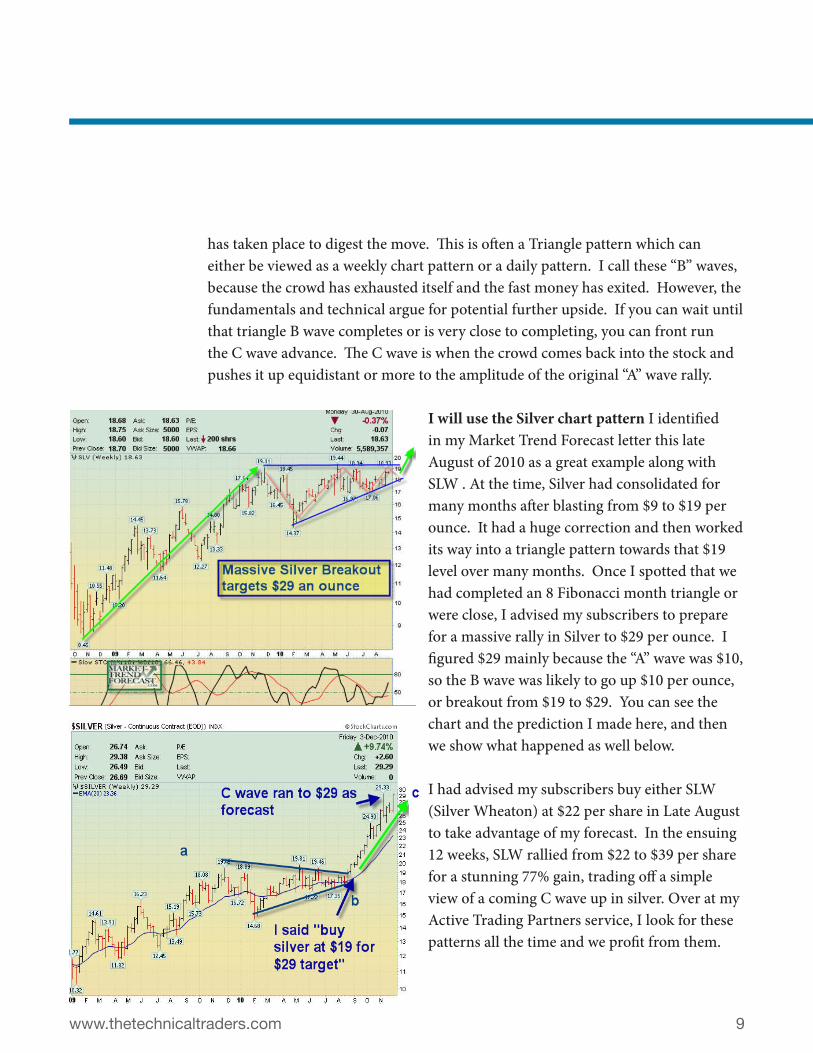
has taken place to digest the move. This is often a Triangle pattern which can either be viewed as a weekly chart pattern or a daily pattern. I call these “B” waves, because the crowd has exhausted itself and the fast money has exited. However, the fundamentals and technical argue for potential further upside. If you can wait until that triangle B wave completes or is very close to completing, you can front run the C wave advance. The C wave is when the crowd comes back into the stock and pushes it up equidistant or more to the amplitude of the original “A” wave rally.
I will use the Silver chart pattern I identified in my Market Trend Forecast letter this late August of 2010 as a great example along with SLW . At the time, Silver had consolidated for many months after blasting from $9 to $19 per ounce. It had a huge correction and then worked its way into a triangle pattern towards that $19 level over many months. Once I spotted that we had completed an 8 Fibonacci month triangle or were close, I advised my subscribers to prepare for a massive rally in Silver to $29 per ounce. I figured $29 mainly because the “A” wave was $10, so the B wave was likely to go up $10 per ounce, or breakout from $19 to $29. You can see the chart and the prediction I made here, and then we show what happened as well below. I had advised my subscribers buy either SLW (Silver Wheaton) at $22 per share in Late August to take advantage of my forecast. In the ensuing 12 weeks, SLW rallied from $22 to $39 per share for a stunning 77% gain, trading off a simple view of a coming C wave up in silver. Over at my Active Trading Partners service, I look for these patterns all the time and we profit from them.

www.thetechnicaltraders.com 10
Here is another recent pick at ATP called Levon Resources. This weekly chart below showed me an A wave up, a B wave triangle, and I figured C wave up was likely next to $1.95 from $1.30 areas. I did my research of course on the company and the silver/gold project itself and did the due diligence. However, once I decided I liked the structure and catalysts for the company, it was easy to see that $1.95 objective. I did the chart below with the research report predicting $1.95. We alerted the stock at $1.40 and within a few days it actually hit $2.00 and pulled back. Now, this was not our subscribers pushing it up because we
bought the stock in day #1 only at a $1.50 maximum price per my advice. It was a few days later that it blasted up on volume to hit those C wave projections. That is crowd behavior, and at ATP we profit from it:
www.thetechnicaltraders.com 11
SOME TENETS I USE FOR INVESTING SUCCESS:• Stocks make their biggest percentage moves up in very short time frames, you
must be positioned prior to the move.
• Buy when it’s quiet, and sell when it’s loud… or Buy when others cry, sell when they yell.
• Small investors are often lazy, take advantage of it and be resourceful with research methods.
• Do not chase stocks, with 5000 to choose from you can be picky and patient.• Allow reasonable leeway for downside volatility, be careful with hard stop loss
orders.
• Never buy your entire position at one time, always use tranche methodology by scaling in over time.
• Trim and Plant- It’s fine to let your winners run, but take some profits consistently and plant proceeds into new trade positions. This serves to both diversify your risk, and often grow your total capital much faster.
• Avoid the noise of CNBC and the headlines, they are reactive as opposed to proactive.
• Let the trade position come to you, do not force it. Trust your instinct at all times. Patience pays.
I could probably write multiple pages on market forecasting and small cap trading, but the bottom line is this. Markets and individual stocks move in volatile patterns mainly related to the participation of the crowd and their volatile shifts in sentiment. These sentiment views can be traced out in Elliott Wave patterns and used by you, the small investor to benefit. Once you learn how the crowd is likely to respond at pivot tops and bottoms, you can routinely position yourself to profit.
www.thetechnicaltraders.com 12
Consider joining us at www.activetradingpartners.com and become a student and benefactor of my theories. We receive unsolicited E-mails from happy partners every week, and many of them are posted up in our testimonials section online. Thanks for reading!
Dave Banister, Chief Strategist- ActiveTradingPartners.com and TheMarketTrendForecast.com
All rights reserved, copyrighted material.
www.thetechnicaltraders.com 13
A few unsolicited E-mails from our Subscribers: More can be viewed at www.activetradingpartners.com/testimonials.php
Dave,I am getting it. My portfolio has jumped over 50% working on your recommendations and suggestions these past couple months. Needless to say, I feel great and indebted to your prowess, acumen, and invest-ment knowledge. Many thanks and am hopeful that you never tire of providing the great opportunities you provide us in ATP.Hayward
Dave,Thank you so much for having this service. I have seen exceptional re-turns - far more than I expected even given this run in the market!Bill Little
Thanks for the info Dave, it’s nice to be able to get answers from some-one who knows how it all works. By the way, my portfolio is up over 50% due mainly to your recommendations and advice in 5-6 months. Which is more than I made in the last 7 years following the advice of my financial adviser , “using less money” I am really glad i found you guys, keep up the great work. ATP is money well spent.Steve Ushinski


![JEFFERY BANISTER names.pdfJohn Banister [I] (c.1624-1679) Time has not dealt kindly with Banister’s compositions. They are spread very widely and are often found in an incomplete](https://img.dokumen.tips/doc/110x75/60bc78178285811beb258ec3/jeffery-namespdf-john-banister-i-c1624-1679-time-has-not-dealt-kindly-with.jpg)


![[David Banister, Joseph Berechman] Transport Inves(BookFi.org)](https://img.dokumen.tips/doc/110x75/563dbb5d550346aa9aac8031/david-banister-joseph-berechman-transport-invesbookfiorg.jpg)


![[David Banister] Transport and Urban Development(Bookos.org)](https://img.dokumen.tips/doc/110x75/553f0488550346096e8b46bf/david-banister-transport-and-urban-developmentbookosorg.jpg)