Embed Size (px)
Citation preview
The Application Usage and Risk Report An Analysis of End User Application Trends in the Enterprise 6th Edition, October 2010 Palo Alto Networks 232 E. Java Dr. Sunnyvale, CA 94089 408.738.7700 www.paloaltonetworks.com

© 2010 Palo Alto Networks Page 2
Table of Contents Executive Summary ........................................................................................................ 3 Introduction .................................................................................................................... 4 Application Dominance is Universal ............................................................................... 5 Saying, Socializing, and Sharing is Consistent Worldwide.............................................. 5
Saying Applications: Unmonitored, Unchecked, and Very Risky ............................................................... 6 Socializing: When at Work, Users are Voyeurs.......................................................................................... 8 Sharing: Massive Amounts of Data is Moving Across Network Boundaries ........................................... 10 Saying, Socializing, and Sharing Security Risks: Malware and Vulnerability Exploits ........................... 13
Cloud-based Computing: Adoption Driven by Users and IT?......................................... 13 Summary....................................................................................................................... 15 Appendix 1: Country-Specific Observations.................................................................. 16 Appendix 2: Methodology .............................................................................................. 18 Appendix 3: Applications Found.................................................................................... 19
© 2010 Palo Alto Networks Page 3
Executive Summary The Application Usage and Risk Report (6th Edition, Oct. 2010) from Palo Alto Networks provides a global view into enterprise application usage by summarizing application traffic assessments conducted between March 2010 and September of 2010. This report highlights the rapid dissolution of the global barriers to application access, which in turn enables worldwide adoption of an application, regardless of where the application was developed. In addition to the usage consistency, the report looks at the risks that are introduced by the heavy use of applications that enable users to “say” what they want through personal webmail and instant messaging, “socialize” when they want through social networking, and “share” when they want via P2P or browser-based filesharing.
This group of applications typically falls outside of the traditional approved communications mechanisms and assigning an action (saying, socializing, and sharing) to them will assist in fostering discussions around their usage and more importantly, the inbound (malware, vulnerability exploits, etc.) and outbound (data loss, inadvertent sharing of private or proprietary data) risks that they may introduce. Finally, the report provides some statistics and discussion around the use of enterprise-class cloud-based applications.
Key findings:
Application usage knows no boundaries.
• Minor anomalies do exist, however, overall, the dominant applications are dominant from a global, borderless perspective.
Saying, socializing, and sharing applications enhance business responsiveness and performance, but they are largely uncontrolled, resulting in increased inbound and outbound risks.
• A total of 224 saying (personal webmail, IM), socializing, and sharing (P2P, browser-based filesharing) applications were found in up to 96% of the participating organizations. The bandwidth consumed by these applications accounted for nearly one quarter of the overall bandwidth.
• More often than not, these applications are unmonitored and uncontrolled, which introduces outbound risks that include data loss and compliance issues. The inbound risks are equally significant - many of these applications are known to transfer malware (Zeus, Conficker, Mariposa) and have had known vulnerabilities.
Adoption of enterprise-class, cloud-based applications is being driven by both end-users and IT.
• The growth patterns around a segment of enterprise-class, cloud-based applications from Microsoft and Google suggests that like IM in the early days, the adoption of cloud-computing is being driven initially by end-users with support from IT as acceptance grows. Overall, the analysis found 92 enterprise-class cloud-based applications in as many as 97% of the participating organizations. These applications are being used for business purposes such as backup, storage, ERP/CRM, database, collaboration, and conferencing.
The traffic analyzed in this report is collected as part of the Palo Alto Networks customer evaluation methodology where a Palo Alto Networks next-generation firewall is deployed to monitor and analyze the network application traffic. At the end of the evaluation period, a report is delivered to the customer that provides unprecedented insight into their network traffic, detailing the applications that were found, and their corresponding risks. The traffic patterns observed during the evaluation are then anonymously summarized in the semi-annual Application Usage and Risk Report.

© 2010 Palo Alto Networks Page 4
Introduction The inaugural version of the Palo Alto Networks Application Usage and Risk Report (1st Edition, March 2008) was published with a sample size that was little more than 20 organizations.
The latest edition of the Application Usage and Risk Report (Oct. 2010) covers a sample size of 723 organizations evenly distributed around the world. The even geographic distribution of the participating organizations highlights the increasingly borderless nature of application usage and the unprecedented speed with which certain types of applications are being adopted.
The speed of adoption by tech-savvy network users adds significantly to the risks that organizations must try to manage – making the challenge doubly difficult because of the resistance to change and the inflexibility that traditional control mechanisms exhibit.
Figure 1: Geographic breakdown of participating organizations.

© 2010 Palo Alto Networks Page 5
Application Dominance is Universal Ubiquitous connectivity is enabling popular applications to extend their dominance, regardless of where the applications are developed or hosted. The frequency that an application is used, regardless of location, the amount of bandwidth consumed, both overall and on a per organization basis are just a few examples of how applications are exhibiting their dominance. Specific examples include:
• Facebook: It is no surprise that Facebook is the social networking application of choice worldwide. What is surprising is the dominance that the Facebook usage exhibits from a bandwidth consumption perspective. Excluding the mail and chat functions, Facebook traffic alone is 500% greater than the other 47 social networking applications combined.
• Gmail and Yahoo! IM: Globally, Gmail and Yahoo! Instant Messaging are the most frequently used webmail and instant messaging applications. In some countries though, Microsoft Hotmail was the leading webmail application. However, the dominance of all three of these well-established applications is being challenged by the growth of Facebook Mail and Facebook Chat, both of which appear in the 5 most frequently detected applications across all geographies analyzed.
• BitTorrent and Xunlei: Filesharing applications exhibited consistent patterns of popularity and usage worldwide. BitTorrent is the most frequently used P2P application in all geographies, with Xunlei appearing consistently in the top 5. From a bandwidth consumption perspective, Xunlei traffic dwarfed BitTorrent use by 460%.
These are just a few examples of how applications are exhibiting and, in most cases, extending their dominance. Even in regions where locally specific applications are well established, the globally dominant applications exert and maintain their position. Country specific observations are discussed in Appendix 3.
Saying, Socializing, and Sharing is Consistent Worldwide Applications that enable users to say (webmail and IM), socialize, and share files or data (P2P and browser-based filesharing) are being used worldwide with remarkable consistency.
Figure 2: Geographic view of the frequency that saying, socializing, and sharing applications were found.
Geographical View: Frequency that Saying, Socializing and Sharing Applications were Detected
60%
70%
80%
90%
100%
Worldwide Americas Europe Asia Pacific, Japan
Webmail Instant Messaging Social Networking Browser-based Filesharing P2P Filesharing
Saying SharingSocializing

© 2010 Palo Alto Networks Page 6
Figure 2 displays a geographical view of the frequency1 that the application category was detected within the participating organizations. The high level of consistency demonstrates that no single geography is that different than another in terms of application usage at a category level. As shown in Appendix 1, there were a few isolated cases where country- or region-specific applications were used as frequently or as heavily (bandwidth per organization). However, in the vast majority of the organizations analyzed, usage patterns showed that popularity and dominance were universally consistent.
To place an exclamation point on the global distribution of the saying, socializing, and sharing applications, figure 3 shows that the number of applications both in total and across the respective categories is consistent.
Figure 3: Categorical breakdown of the saying, socializing, and sharing applications found regionally.
Saying Applications: Unmonitored, Unchecked, and Very Risky
Saying applications include those webmail and instant messaging applications that are typically used for personal communications, yet they allow users to say anything they want about themselves or about the organization. While mostly personal in nature, these applications being used in a largely unmonitored and uncontrolled manner, which, in turn, introduces significant inbound and outbound risks. In some respects, applications in this group were the first “consumer-oriented” applications that crossed-over into corporate use as a means to help users get their jobs done while also staying in touch with friends and family. The business benefits that these applications can bring include more active collaboration, increased communications efficiency, and quicker time-to-market.
The dark side is that these applications are unmonitored and as such, they do pose certain business and security risks. Business risks include internal compliance with application usage policies that may not allow the use at all, or dictate what can or cannot be said about the company. Regulatory compliance violations may occur when these applications are in use within specific industries such as financial services or health care.
1 Note that the frequency is based on a given application appearing at least once on the given network – the number of users, the number of applications within the category, and the number of times the application is used is not a factor in determining frequency.
31 64 45 40 22
32 62 46 46 22
32 63 49 43 22
35 66 51 49 23
0 50 100 150 200 250
Worldwide (224)
Americas (209)
Europe (208)
Asia Pacific, Japan (202)
Category Breakdown of Saying, Socializing and Sharing Applications - By Region
Webmail Instant Messaging Social Networking Browser-based Filesharing P2P Filesharing
Saying SharingSocializing

© 2010 Palo Alto Networks Page 7
The webmail applications that were analyzed excluded the traditional email applications (Outlook, Lotus Notes, etc), traditional email protocols (POP3, SMTP, IMAP, etc) and those email applications that are client server-based. Outlook-Web and Gmail-Enterprise were also excluded from the analysis.
Figure 4: The most frequently detected saying applications.
This left a total of 33 different webmail applications (out of a total sample of 49 email applications). Defining which instant messaging applications (IM) to analyze was far less complex; all 66 IM applications that were discovered were included in the analysis/discussion. Looking more deeply at the underlying technology and the behavioral characteristics for the saying applications highlights some of the business and security risks that IM applications pose.
• The browser is the dominant underlying technology: Not surprisingly, the dominant underlying technology for the saying applications is the browser at 67% (66 of 99). All webmail applications by default use the browser, leaving the applications within the IM group as the source of the technology variants shown in figure 5.
Figure 5: Underlying technology of saying applications.
• Common ports are TCP/80, TCP/443: The majority of the saying applications use the browser as the underlying technology, however, an even greater number percentage, 82% (81 of 99) of these applications use common web traffic ports (TCP/80 or TCP/443). The remaining 18 applications either hop ports or use fixed ports that are not TCP/80 or TCP/443. The slight contradiction between the underlying technology and the common ports emphasizes the fact that application developers no longer adhere to the “application equals port” methodology, which in turn means that these applications are not easily monitored by existing security solutions because of their

© 2010 Palo Alto Networks Page 8
reliance on fixed ports. The result is the introduction of broad-based risks including possible leakage of confidential information that can be introduced by the fact that the traffic looks like common web or SSL traffic. The most significant inbound risk is the plain fact that these applications are a common vector for inbound malware.
• File transfer functionality. Of the 99 saying applications discovered, 59 (60%) of them are capable of transferring files. The business risks associated with file transfer revolve around the fact that the traffic looks like web traffic and could actually be unauthorized transfer of files (data leakage) and/or the delivery of malware as an attachment.
Figure 6: Behavioral characteristics of saying applications.
• Malware and vulnerability exploit delivery. The analysis confirms that saying applications represent a high level of security risk as popular vectors for vulnerability exploits and malware delivery. Specifically, 81 (82%) of the applications have had known vulnerabilities while 50 (51%) are known to deliver malware. Additional details on the malware that was found during the analysis period are discussed later in the paper.
Socializing: When at Work, Users are Voyeurs.
As a category, social networking applications have existed for many years – LinkedIn has been helping professionals connect and network with each other since 2003. However, recently, social networking application usage and adoption rates have accelerated to unprecedented levels with much of the growth driven by Facebook.
As each week goes by, these applications are viewed as an integral business component as opposed to the previous view of nuisance and waste of time. A perfect example is the recent announcement by Delta Airlines that they would be enabling reservations via their Facebook page. Another example is the US Army and their use of Facebook as another element in their recruitment efforts. The challenge that many security professionals are faced with is the fact that the rapid growth has caught everyone by surprise and the traditional, security best-practices response to surprises is try and block or control them while policies are developed and implemented. The challenge of course is the plain fact that speed of adoption and caution do work well together.

© 2010 Palo Alto Networks Page 9
Social networking applications as a whole were found in 96% of the participating organizations, which indicates that control efforts are not working. The analysis found 51 applications that enable employees to socialize and collaborate for both work and personal purposes.
Figure 7: Most commonly detected social networking applications.
Whereas saying applications have a somewhat limited and controlled distribution model (1:1 or 1:few), the broadcast nature of the social networking distribution model represents significant outbound risks in terms of what a user says about the company, their projects, their travel plans, or company status on their social networking pages.
The 2010 Verizon Data Breach Report highlights some of these risks very succinctly. The report discusses how attackers patiently collected information on their targets, taking any length of time to collect the desired data points using a combination of traditional social engineering techniques, updated for today’s web 2.0 world. Social networking sites can help uncover corporate roles or answers to security questions. Hijacked social networking user credentials can be used to convince a user to click on a URL with embedded malware, thinking it was from a friend. The malware in turn collects data such as user names and passwords that is used to help achieve the objectives.
With more than 500 million users, it is no surprise that Facebook is the most popular social networking application. What was surprising was the dominance that Facebook exhibited in terms of resource consumption (bandwidth consumed).
The four Facebook social networking applications (Facebook, Facebook Posting, Facebook Apps and Facebook Social Plugins) consumed 78% of the total social networking bandwidth (3.9 TB) while the remaining 47 social networking applications were left to share the remaining 22% (1.1 TB) of bandwidth. The Facebook traffic patterns contradict certain assumptions about how the application is used while at work.
• Voyeuristic use: In short, while at work, users are voyeurs. The bulk of the Facebook traffic (69%) is watching Facebook pages. The risks of viewing Facebook pages include a potential loss of productivity and the possibility of malware introduction by clicking on a link within someone’s “wall”.
• Very light games activity: Comparatively speaking, Facebook Apps (games) represents a scant 4% of the traffic.
• Minimal posting activity: Facebook Posting represents an even smaller 1% of the traffic, yet the small amount of use should not minimize the risks in terms of what users are saying about work related subjects such as current projects, travel plans, and company status.

© 2010 Palo Alto Networks Page 10
Note that the Facebook traffic discussion excludes Facebook Mail and Facebook Chat, which fall into the email and instant messaging (saying) category. The pattern of dominance within social networking that Facebook displayed was consistent in all regions and countries analyzed.
Figure 8: Social networking application bandwidth consumption comparison.
Sharing: Massive Amounts of Data is Moving Across Network Boundaries
In early 2008, the first Application Usage and Risk Report highlighted a small group of applications that enabled users to move or store files via the web. Categorized as browser-based file sharing, these applications democratized file transfer for all. Whereas P2P and FTP both require some technical acumen to use, these new applications were point and click easy, allowing users to get around traditional email attachment limitations. Since 2008, browser-based file sharing applications have steadily grown from several perspectives.
• The number of browser-based filesharing applications has more than doubled, growing from 22 in March of 2008 to 49 currently
• The frequency that browser-based filesharing applications are used has increased from 30% (March 2008) to 96%.
• At 96% frequency, browser-based filesharing applications are found more commonly than other transfer applications such as P2P (82%) or FTP (91%), as shown in figure 9.
Figure 9: Historical view of the frequency that sharing applications were found.
Social Networking Application Bandwidth Consumption
Facebook 69%
Facebook Social Plugin 4%
Facebook Apps 4%
Facebook Posting 1%
Twitter 3%
Myspace 1%Stumbleupon 1%
LinkedIn 2%
All other SN 15%

© 2010 Palo Alto Networks Page 11
Like any new class of application, browser-based filesharing applications are evolving. Initially, applications like DocStoc, YouSendIt! and Box.net were, and still are, used for business purposes.
• DocStoc is more of a public document repository than a sharing and storing solution, which means there is a higher likelihood that it is being used for work-related purposes. DocStoc allows a user to find a much-needed form such as a leasing agreement, or a legal document such as a non-disclosure agreement (NDA). The premise of DocStoc is to share these documents so other users do not need to recreate them.
• YouSendIt! enables users to move large files to a limited set of users. Upload the file, receive a URL, and then send it to the recipient(s). The user interface for YouSendIt! encourages a 1:1 or 1:few distribution model and its product positioning make this application more work-oriented than others.
• Box.net positions itself as a supplier of collaborative, cloud-based storage. Box.net positions its offering as a solution for corporations that are using collaborative tools such as Microsoft SharePoint. Its offering includes connectors and APIs for many of these corporate offerings. The purpose is to store and collaborate on files and projects using the ubiquitous nature of the Internet cloud.
The most significant change within the browser-based filesharing group is the emergence of a group that uses a broadcast-focused distribution model, making it similar in behavior to P2P, but without the underlying technology. Using RapidShare, MegaUpload, or MediaFire, a user can now upload their content and allow it to be indexed by one of the many affiliated search engines. Visit rapidshare.net, megadownload.net or mediafiresearch.org and a user can find a wide range of content that is hosted on the respective sites. A quick search for any one of the latest movies or popular TV series reveals that these applications are quietly enabling the distribution of copyrighted content. This class of application is geared towards very active upload and download activity, complete with rewards programs for downloads, a robust management interface, and toolbars – all geared towards rewarding those who are active uploaders. Whereas P2P is built to automatically assign added resources to active users, this new class of browser-based filesharing applications encourages uploads through credits or discounts, effectively monetizing activity.
A comparison of the 5 most frequently used browser-based filesharing applications shows that SkyDrive and DocStoc, two very business-focused applications were used most frequently. Viewed from a bandwidth consumption per organization perspective, the order is reversed. MegaUpload, Mediafire, and Rapidshare are the top-3 bandwidth consumers. DocStoc and Skydrive, did not appear on the chart because they consumed a paltry 17 MB and 55 MB per organization.
Figure 10: Five most frequently, and most heavily used browser-based filesharing applications.
© 2010 Palo Alto Networks Page 12
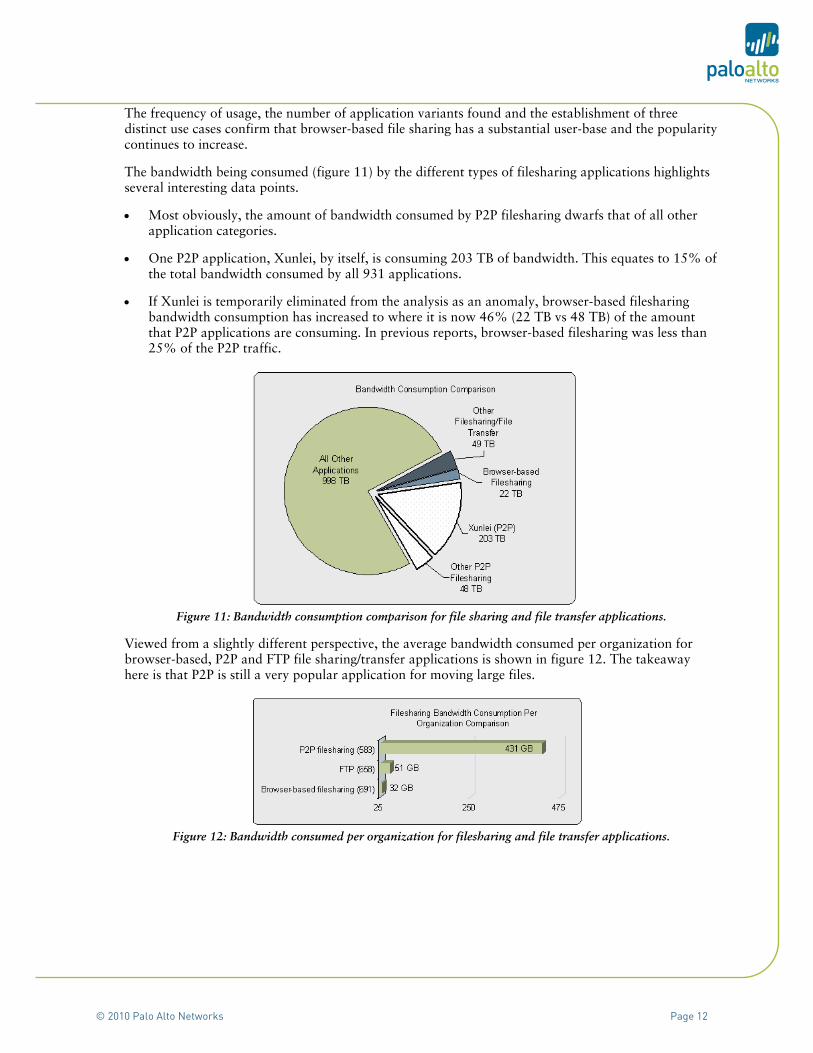
The frequency of usage, the number of application variants found and the establishment of three distinct use cases confirm that browser-based file sharing has a substantial user-base and the popularity continues to increase.
The bandwidth being consumed (figure 11) by the different types of filesharing applications highlights several interesting data points.
• Most obviously, the amount of bandwidth consumed by P2P filesharing dwarfs that of all other application categories.
• One P2P application, Xunlei, by itself, is consuming 203 TB of bandwidth. This equates to 15% of the total bandwidth consumed by all 931 applications.
• If Xunlei is temporarily eliminated from the analysis as an anomaly, browser-based filesharing bandwidth consumption has increased to where it is now 46% (22 TB vs 48 TB) of the amount that P2P applications are consuming. In previous reports, browser-based filesharing was less than 25% of the P2P traffic.
Figure 11: Bandwidth consumption comparison for file sharing and file transfer applications.
Viewed from a slightly different perspective, the average bandwidth consumed per organization for browser-based, P2P and FTP file sharing/transfer applications is shown in figure 12. The takeaway here is that P2P is still a very popular application for moving large files.
Figure 12: Bandwidth consumed per organization for filesharing and file transfer applications.

© 2010 Palo Alto Networks Page 13
Saying, Socializing, and Sharing Security Risks: Malware and Vulnerability Exploits
These applications are popular vectors for delivery of malware and vulnerability exploits. The reason is simple: their popularity makes it easy for malware creators to deliver their payload by simply creating a compelling reason for a user to “click” on what appears to be an update, an IM, a tweet, or a post from a trusted acquaintance. The sender may in fact be the person they say, but that fact is insignificant. By “clicking” first on a link sent by a highly trusted source and asking or thinking later, the user has, unknowingly, propagated the threat or installed the malware.
One recent example involved fictitious accounts of dead celebrities that were used to deliver the Zeus Trojan to unsuspecting users. In this scenario, the compelling reason to “click” is the death of someone famous like Cameron Diaz, which, while untrue, results in the download of the Zeus Trojan that targets a user’s financial accounts by stealing account names, numbers, and associated passwords. Conficker is known to be delivered in a very similar manner, relying on users to help grow the population.
Figure 13: Log instances per organization for commonly found malware.
Figure 13 shows the average number of log instances detected for Conficker, GGDoor, Mariposa, and Zeus. The log instances indicate the “actions” that the malware is taking (command and control, phone home, etc); it is not a direct correlation to the number of end-points infected.
The report by the Shadow Server Foundation, Shadows in the Cloud: Investigating Espionage 2.0, provides additional details on how attackers were able to compromise nearly 1,300 computers in 103 countries by convincing users to click a URL, download a document, presentation, or PDF file that has been sent by (supposed) friends or acquaintances. In reality, the sender was an attacker spoofing someone’s email. Once compromised, the attackers used a variety of web 2.0 applications and tools (Twitter, Yahoo! Mail, Google Groups, and numerous blog sites) as their command and control infrastructure.
Cloud-based Computing: Adoption Driven by Users and IT? There has been significant discussion around the deployment of enterprise-class, cloud-based applications recently. Hot topics include security, performance, scalability, whether or not to develop a private cloud, or use a commercially available solution. The volume of conversation and the number of unanswered questions imply that this type of application does not exist, when in fact, they have been deployed in one manner or another for some time. Excluding the applications discussed in the previous sections, enterprise-class, cloud-based applications that are designed to support business processes are very much in use now.

© 2010 Palo Alto Networks Page 14
The traffic usage patterns for select Microsoft and Google applications from the March 2010 and October 2010 versions of the Application Usage and Risk Report (figure 14) indicates both a top-down and a bottoms-up adoption pattern.
• Bottoms-up: The high use of “free” versions of the Google applications by the end-user is forcing IT to consider these tools as licensed and fully supported alternatives (or replacements) for existing tools.
• Top-down: The enterprise versions of Google Mail and Google Docs were added to the application database halfway through the analysis period (May and June of 2010 respectively) and in that short period, they were found in 29% and 8% of the respective participating organizations. The finding that Google Mail was deployed in 29% of the organizations is a number that is higher then most observers would expect and it supports the top-down and bottoms-up argument. Microsoft Office Live, which typically requires IT involvement, was also found with a high rate of frequency, bolstering the argument that adoption is both top-down and bottoms-up.
Figure 14: Frequency that “cloud-based” applications from Microsoft and Google were detected.
The analysis found at least 92 enterprise-class, cloud-based applications (10% of the sample) that are streamlining and supporting business processes. These applications can be broken down into the following groups:
• Infrastructure: found in 97% of the organizations, this group of 29 applications includes backup and storage, and software updates.
• Productivity: found in 91% of the participating organizations, this group of 37 applications provides office productivity, ERP/CRM, filesharing, and database functionality.
• Collaboration: found in 68% of the organizations, these applications that foster collaboration via web conferencing, VoIP, and business-focused social networking (LinkedIn, XING, Viadeo).
The traditional cloud-based applications such as WebEx and salesforce.com were (and still are) used by a relatively small set of remote users. The adoption and use of these applications, is, by and large, driven by IT (top-down). As tech-savvy users enter the workforce, their usage patterns, work patterns, and requests for more application alternatives are accelerating and expanding the adoption of a wider range of cloud-based applications.
76%85%
81%80%
8%92%93%
29%74%
69%73%
79%
0% 50% 100%
Google App Engine
Google Docs
Google Docs Enterprise*
Google Mail
Google Mail Enterprise*
Microsoft Skydrive
Microsoft Office Live
Frequency that Google and Microsoft Cloud-based Applications were Found
Mar. 2010 Oct. 2010* Respective App-IDs were released in M ay and June of 2010.

© 2010 Palo Alto Networks Page 15
Summary In some respects, applications that enable saying, socializing, and sharing have long been used in workplace environments, however their usage has been somewhat “quiet”. Today, the intertwined nature of work, home, family, and technology, combined with a generation of users that is always connected and assumes usage is “approved”, has dramatically elevated the discussion around these applications. The discussion is healthy because organizations need to determine the best way to enable these applications in a manner that ensures the organization and the users are kept secure. Questions that are top of mind include:
• Should they be allowed? If they are allowed, then what, if any, are the restrictions and limitations? What can and cannot be said while using them?
• What are the alternatives to allowing these applications? And what are the ramifications to blocking them?
• Should they be blocked and if so, what are the repercussions if they are used? What policies and technology should be used to control the use?
Organizations need to work diligently yet quickly to determine the appropriate balance between summarily blocking and blindly allowing these applications. Users are no longer demanding or asking if these applications can be used, they are using them, and they are assuming their use, as long as they get their jobs done, is acceptable. What is not taken into consideration are the risks that the use of these applications pose to their personal information and the company’s, which is where IT and the security team needs to exert their influence and expertise.
About Palo Alto Networks Palo Alto Networks™ is the network security company. Its next-generation firewalls enable unprecedented visibility and granular policy control of applications and content – by user, not just IP address – at up to 10Gbps with no performance degradation. Based on patent-pending App-ID™ technology, Palo Alto Networks firewalls accurately identify and control applications – regardless of port, protocol, evasive tactic or SSL encryption – and scan content to stop threats and prevent data leakage. Enterprises can for the first time embrace Web 2.0 and maintain complete visibility and control, while significantly reducing total cost of ownership through device consolidation. For more information, visit www.paloaltonetworks.com.

© 2010 Palo Alto Networks Page 16
Appendix 1: Country-Specific Observations The consistency of use at a category level masks some country specific anomalies that were found around a few specific application categories.
UK (57 participating organizations, 635 applications, 108 TB of bandwidth observed)
• Hotmail and Yahoo! Mail are the most common (95% and 86% respectively) and most heavily used webmail applications. The UK was the only country where Meebo, a universal IM client, was the most frequently used IM at 82%. In contrast, Facebook Chat, the 4th most frequently used IM, consumed the highest amount of bandwidth per organization by 9.5X (2.5 GB vs. 271 MB).
• Facebook was found in 100% of the participating organizations and it consumed 10 GB per organization – 5X the total of the next 4 social networking applications combined. The UK is the only country where Stumbleupon appeared in the top 5 social networking applications used (78%). Stumbleupon is in the top 10 for other countries.
Germany (21 participating organizations, 625 applications, 14.6 TB of bandwidth observed)
• Local webmail (Web-DE Mail and GMX Mail) were two most frequently used webmail applications (both found 80% of the time) with Hotmail, Gmail and Yahoo! Mail rounding out the top 5. GMX Mail was the most heavily used at 1 GB per organization, which was more then the other 4 applications combined.
• XING, a social networking application, based in America, was detected in 80% of the participating German organizations. In contrast, XING is the 23rd most popular social networking application (out of 51 social networking variants) worldwide. Other local social networking applications (Lokalisten and Meinvz) were the 5th and 9th most frequently used at 60% and 25% respectively.
Benelux (40 participating organizations, 654 applications, 59 TB of bandwidth observed)
• LinkedIn was found in 100% of the organizations while Hyves, a regionally specific social networking application was found in 95% of the organizations.
• Comparatively speaking, a global view of Hyves shows that it was found in only 26% of the participating organizations.
Spain (40 participating organizations, 535 applications, 55.8 TB of bandwidth observed)
• Very global usage patterns were observed with the exception of Tuenti, a Spanish specific social networking application, which consumed the 3rd highest amount of bandwidth per organization (86 MB).
• In terms of frequency of use, Tuenti cannot compete with the global players, as it was the 24th most popular out of 37 social networking applications identified in Spain. Like all regions, Facebook was the most frequently used.
France (39 participating organizations, 581 applications, 39.8 TB of bandwidth observed)
• France is the only country where Horde, an open source webmail application was found in the top 5 webmail applications. Horde was found 86% of the time, ranking it 4th most popular.
• MSN, the IM behind Windows Live, was the 6th most popular, yet it consumed the most bandwidth per organization (588 MB) by 1.5X the closest competitor.
• Viadeo, a local social networking application was found in 81% of the organizations (5th most popular), yet it is the 2nd most heavily used in terms of bandwidth per organization.

© 2010 Palo Alto Networks Page 17
• Dailymotion, a social networking oriented photo/video application was found in 92% of the organizations, a tie for most popular with Google Video and ahead of YouTube (89%). Worldwide, Dailymotion is found in 75% of the organizations.
Australia, New Zealand (26 participating organizations, 524 applications, 16 TB of bandwidth observed)
• Facebook is very popular in this region, appearing in 100% of the participating organizations. The combined Facebook properties (Facebook, Social Plugin, Posting, and Applications) consumed a total of 5 GB per org, which is 5X the total of the 30 other social networking applications combined.
• Australia and New Zealand were the only areas where browser-based file sharing applications in use appeared to be more “business centric” in terms of frequency and bandwidth consumed. In all other regions, browser-based file sharing applications consuming the most bandwidth consumed were more “entertainment or personal use”.
Taiwan (88 participating organizations, 648 applications, 434 TB of bandwidth observed)
• P2P filesharing is being used heavily, consuming 222 terabytes of bandwidth (over a 7 day period). Xunlei, the most popular and heavily used P2P application in Taiwan, consumed 201 TB or 15% of the total 1.3 petabytes of bandwidth observed worldwide.
China (28 participating organizations, 483 applications, 43 TB of bandwidth observed)
• The most popular social networking applications are a mix of local and global offerings. In order of frequency; Facebook (88%), Twitter (85%), Kaixin (85%), LinkedIn (85%), and Kaixin001 (77%). Facebook consumes the most bandwidth at 3.6 GB per org, with Kaixin001 and Kaixin the next highest consumers at 560 MB and 231 MB respectively. Facebook is consuming more bandwidth by a factor of 7X and 16X.
• Netease is the 4th most popular webmail application yet it is the most heavily used (1.2 GB per org) while QQ Mail, another local webmail application is 3rd most heavily (962 MB).
Thailand and Singapore (41 participating organizations, 604 applications, 60 TB of bandwidth observed)
• Application usage patterns mimicked global usage patterns with the exception of the relatively high use of both P2P and browser-based filesharing applications. Both types of applications showed relatively high frequency and bandwidth consumption, despite the restrictions that are normally applied to this type of activity.

© 2010 Palo Alto Networks Page 18
Appendix 2: Methodology The data in this report is generated via the Palo Alto Networks Application Visibility and Risk assessment process where a Palo Alto Networks next-generation firewall is deployed within the network, in either tap mode or virtual wire mode, where it monitors traffic traversing the network. At the end of the data collection period, seven days worth of data is extracted (with permission from the participating organization). The data is analyzed resulting in an Application Visibility and Risk Report that is presented to the participating organization. The report includes the applications found, the associated business risks, and a more accurate picture of how the network is being used. The data from each of the AVR Reports is then anonymized, aggregated, and analyzed, resulting in The Application Usage and Risk Report (produced every 6 months).
About the Palo Alto Networks Next-Generation Firewall:
Delivered as a purpose-built platform, Palo Alto Networks next-generation firewalls bring visibility and control over applications, users and content back to the IT department using three identification technologies: App-ID, Content-ID and User-ID.
• App-ID: Using as many as four different traffic classification mechanisms, App-IDTM accurately identifies exactly which applications are running on networks – irrespective of port, protocol, SSL encryption or evasive tactic employed. App-ID gives administrators increased visibility into the actual identity of the application, allowing them to deploy comprehensive application usage control policies for both inbound and outbound network traffic.
• Content-ID: A stream-based scanning engine that uses a uniform threat signature format detects and blocks a wide range of threats and limits unauthorized transfer of files and sensitive data (CC# and SSN), while a comprehensive URL database controls non-work related web surfing. The application visibility and control delivered by App-ID, combined with the comprehensive threat prevention enabled by Content-ID, means that IT departments can regain control over application and related threat traffic.
• User-ID: Seamless integration with enterprise directory services (Microsoft Active Directory, LDAP, eDirectory) links the IP address to specific user and group information, enabling IT organizations to monitor applications and content based on the employee information stored within Active Directory. User-ID allows administrators to leverage user and group data for application visibility, policy creation, logging and reporting.
• Purpose-Built Platform: Designed specifically to manage enterprise traffic flows using function-specific processing for networking, security, threat prevention and management, all of which are connected by a 10 Gbps data plane to eliminate potential bottlenecks. The physical separation of control and data plane ensures that management access is always available, irrespective of the traffic load.
To view details on more than 1,100 applications currently identified by Palo Alto Networks, including their characteristics and the underlying technology in use, please visit Applipedia, the Palo Alto Networks encyclopedia of applications.

© 2010 Palo Alto Networks Page 19
Appendix 3: Applications Found The complete list of the 931 unique applications found, ranked in terms of frequency are listed below. To view details on the entire list of 1,100+ applications, including their characteristics and the underlying technology in use, please check Palo Alto Networks encyclopedia of applications at http://ww2.paloaltonetworks.com/applipedia/
100% Frequency 1. ssl 2. dns 3. web-browsing 4. ntp 5. ping 6. facebook 7. netbios-ns 8. flash 9. ms-update 10. google-analytics 11. icmp 12. soap 13. twitter 14. gmail 15. rss 16. google-safebrowsing 17. youtube 18. webdav 19. snmp 20. sharepoint 21. smtp 22. http-audio 23. http-proxy 24. ftp 25. http-video 26. google-video 27. flickr 28. hotmail 29. photobucket 30. google-toolbar 31. yahoo-mail 32. rtmpt 33. yahoo-im 34. silverlight 35. linkedin 36. google-app-engine 37. adobe-update 38. atom 39. ms-ds-smb 40. netbios-dg 41. ldap 42. google-calendar 43. apple-update 44. ms-rdp 45. google-translate 46. limelight 47. google-picasa 48. google-docs 49. flexnet-installanywhere 50. facebook-chat 51. yahoo-toolbar 52. myspace 53. office-live 54. facebook-mail 55. msrpc 56. google-talk-gadget 57. itunes 58. rtmp 59. msn 60. skype 61. symantec-av-update 62. ssh 63. facebook-apps
64. asf-streaming 65. meebo 66. google-desktop 75% Frequency 67. dailymotion 68. t.120 69. pop3 70. skydrive 71. kerberos 72. dhcp 73. skype-probe 74. stumbleupon 75. yahoo-webmessenger 76. bittorrent 77. google-earth 78. rtmpe 79. stun 80. mssql-mon 81. salesforce 82. ipsec-esp-udp 83. babylon 84. google-talk 85. ike 86. web-crawler 87. mobile-me 88. telnet 89. active-directory 90. twitpic 91. metacafe 92. msn-voice 93. docstoc 94. ms-netlogon 95. last.fm 96. ooyala 97. mssql-db 98. squirrelmail 99. megaupload 100. netbios-ss 101. rtsp 102. rapidshare 103. ustream 104. gmail-chat 105. teamviewer 106. syslog 107. mediafire 108. orkut 109. friendfeed 110. time 111. 4shared 112. myspace-video 113. aim-mail 114. sky-player 115. hulu 116. logmein 117. sip 118. flixster 119. shoutcast 120. napster 121. emule 122. plaxo 123. megavideo 124. yousendit 50% Frequency 125. outlook-web
126. webshots 127. ms-sms 128. livejournal 129. msn-file-transfer 130. friendster 131. facebook-social-plugin 132. aim-express 133. citrix 134. rtp 135. webex 136. google-cache 137. twitter-posting 138. filestube 139. yourminis 140. slp 141. msn-toolbar 142. ebuddy 143. backweb 144. imap 145. hp-jetdirect 146. teredo 147. bbc-iplayer 148. imeem 149. justin.tv 150. boxnet 151. blackboard 152. ms-exchange 153. channel4 154. vnc 155. rtcp 156. clearspace 157. lotus-notes 158. blogger-blog-posting 159. fotki 160. ssdp 161. tudou 162. yahoo-voice 163. snmp-trap 164. lpd 165. sharepoint-admin 166. ares 167. radius 168. alisoft 169. nintendo-wfc 170. vbulletin-posting 171. shutterfly 172. tftp 173. qvod 174. gnutella 175. xunlei 176. eset-update 177. horde 178. depositfiles 179. flashget 180. adobe-media-player 181. blog-posting 182. gotomeeting 183. oracle 184. grooveshark 185. meebome 186. sightspeed 187. jabber 188. live365 189. seesmic

© 2010 Palo Alto Networks Page 20
190. pandora 191. coralcdn-user 192. yum 193. aim 194. sharepoint-documents 195. open-vpn 196. zimbra 197. myspace-mail 198. hi5 199. portmapper 200. irc 201. esnips 202. xobni 203. logitech-webcam 204. reuters-data-service 205. youku 206. divshare 207. mail.ru 208. ipv6 209. badongo 210. twig 211. playstation-network 212. ciscovpn 213. upnp 214. worldofwarcraft 215. trendmicro 216. ppstream 217. gmail-enterprise 218. facebook-posting 219. myspace-im 220. yahoo-douga 221. sendspace 222. phproxy 223. stickam 224. iheartradio 225. gre 226. steam 227. pandora-tv 228. deezer 229. mysql 230. qq 231. mogulus 232. azureus 233. hyves 234. tidaltv 235. norton-av-broadcast 25% Frequency 236. millenium-ils 237. computrace 238. msn-webmessenger 239. qq-mail 240. bebo 241. google-wave 242. xing 243. ultrasurf 244. bugzilla 245. yandex-mail 246. netvmg-traceroute 247. imvu 248. blin 249. evernote 250. echo 251. zango 252. kaixin001 253. pptp 254. netease-mail 255. mms 256. pogo 257. blackberry 258. pando 259. netsuite 260. tvu 261. drop.io 262. roundcube 263. second-life 264. rhapsody 265. evony
266. ms-groove 267. ipsec-esp 268. iloveim 269. mediawiki-editing 270. kaspersky 271. pplive 272. socks 273. citrix-jedi 274. secureserver-mail 275. classmates 276. imo 277. glype-proxy 278. daytime 279. imesh 280. spark 281. subversion 282. jango 283. live-meeting 284. qqlive 285. linkedin-mail 286. veohtv 287. comcast-webmail 288. kaixin 289. cgiproxy 290. h.323 291. oovoo 292. stagevu 293. files.to 294. icq 295. rpc 296. activesync 297. hamachi 298. dropbox 299. msn-video 300. netspoke 301. gotomypc 302. flumotion 303. qqmusic 304. corba 305. ifile.it 306. tikiwiki-editing 307. gmx-mail 308. vmware 309. aol-proxy 310. pcanywhere 311. rsvp 312. yahoo-file-transfer 313. source-engine 314. garena 315. open-webmail 316. h.245 317. ebay-desktop 318. sharepoint-calendar 319. google-buzz 320. 2ch 321. netflow 322. tor 323. qq-download 324. ipp 325. kkbox 326. ichat-av 327. socialtv 328. sakai 329. h.225 330. sopcast 331. mibbit 332. nntp 333. sybase 334. freegate 335. brighttalk 336. websense 337. nfs 338. rip 339. yoono 340. lwapp 341. yourfilehost 342. gtalk-voice
343. jira 344. octoshape 345. adobe-connect 346. bet365 347. babelgum 348. jaspersoft 349. nimbuzz 350. discard 351. timbuktu 352. ms-win-dns 353. autobahn 354. sap 355. web-de-mail 356. carbonite 357. l2tp 358. netflix 359. baofeng 360. messengerfx 361. wins 362. whois 363. netload 364. dotmac 365. 360-safeguard-update 366. medium-im 367. rpc-over-http 368. apple-airport 369. finger 370. neonet 371. kazaa 372. adrive 373. all-slots-casino 374. tacacs-plus 375. rsync 376. xdmcp 377. editgrid 378. orb 379. dameware-mini-remote 380. rdt 381. concur 382. netlog 383. gogobox 384. netviewer 385. vtunnel 386. instan-t-file-transfer 387. ms-wins 388. diino 389. mcafee-update 390. evalesco-sysorb 391. wolfenstein 392. kugoo 393. viadeo 394. uusee 395. tales-runner 396. akamai-client 397. foxy 398. niconico-douga 399. webqq 400. ezpeer 401. yahoo-webcam 402. lokalisten 403. google-docs-editing 404. ms-scom 405. mixi 406. radmin 407. yammer 408. lineage 409. direct-connect 410. spotify 411. move-networks 412. google-docs-enterprise 413. dealio-toolbar 414. send-to-phone 415. gtalk-file-transfer 416. gadu-gadu 417. mount 418. mediamax 419. ms-scheduler

© 2010 Palo Alto Networks Page 21
420. fastmail 421. filemaker-pro 422. sccp 423. hopster 424. libero-video 425. feidian 426. symantec-syst-center 427. zoho-im 428. battlefield2 429. backup-exec 430. ms-iis 431. ms-dtc 432. clip2net 433. filedropper 434. checkpoint-cpmi 435. tivoli-storage-manager 436. veetle 437. hangame 438. gamespy 439. hotspot-shield 440. mail.com 441. clubbox 442. rsh 443. palringo 444. fs2you 445. zoho-sheet 446. lotus-sametime 447. t-online-mail 448. rping 449. woome 450. kontiki 451. zoho-writer 452. camfrog 453. mozy 454. ncp 455. folding-at-home 456. cox-webmail 457. genesys 458. koolim 459. livelink 460. cisco-nac 461. bomgar 462. freeetv 463. nate-mail 464. trendmicro-officescan 465. userplane 466. sling 467. filer.cx 468. scps 469. cvs 470. eve-online 471. secure-access 472. postgres 473. informix 474. winamp-remote 475. vnc-http 476. tonghuashun 477. xbox-live 478. qq-games 479. optimum-webmail 480. chatroulette 481. forticlient-update 482. kaixin001-mail 483. ospf 484. x11 485. showmypc 486. sophos-update 487. unassigned-ip-prot 488. fortiguard-webfilter 489. sflow 490. aim-file-transfer 491. maplestory 492. db2 493. streamaudio 494. netmeeting 495. miro 496. youtube-safety-mode
497. cups 498. nateon-im 499. regnum 500. cgi-irc 501. capwap 502. adobe-online-office 503. mcafee-epo-admin 504. cpq-wbem 505. magicjack 506. teachertube 507. ibm-director 508. webex-weboffice 509. poker-stars 510. omnidrive 511. verizon-wsync 512. elluminate 513. soulseek 514. manolito 515. google-docs-uploading 516. razor 517. dazhihui 518. innovative 519. outblaze-mail 520. glide 521. kproxy 522. adnstream 523. ilohamail 524. seeqpod 525. ndmp 526. igmp 527. rlogin 528. zelune 529. zoho-show 530. yantra 531. git 532. tagoo 533. zoho-wiki 534. wikispaces-editing 535. kino 536. bacnet 537. yuuguu 538. ms-ocs 539. bomberclone 540. gigaup 541. inforeach 542. eigrp 543. itv-player 544. dimdim 545. icq2go 546. youseemore 547. afp 548. mekusharim 549. unreal 550. 100bao 551. live-mesh 552. gds-db 553. ariel 554. cygnet-scada 555. imhaha 556. ameba-blog-posting 557. yahoo-finance-posting 558. tokbox 559. sosbackup 560. livestation 561. svtplay 562. earthcam 563. big-brother 564. etherip 565. apc-powerchute 566. wiiconnect24 567. soribada 568. pim 569. netop-remote-control 570. tv4play 571. icap 572. ip-messenger 573. xfire
574. bigupload 575. microsoft-dynamics-crm 576. asterisk-iax 577. cyworld 578. iccp 579. wccp 580. zoho-crm 581. packetix-vpn 582. simplify 583. air-video 584. studivz 585. zoho-notebook 586. hovrs 587. ypserv 588. party-poker 589. doof 590. taku-file-bin 591. leapfile 592. hp-data-protector 593. meinvz 594. panos-web-interface 595. usejump 596. ms-ocs-file-transfer 597. plugoo-widget 598. hotfile 599. groupwise 600. daum 601. crossloop 602. keyholetv 603. graboid-video 604. reserved 605. nateon-file-transfer 606. meebo-file-transfer 607. radiusim 608. sugar-crm 609. freenet 610. iscsi 611. tuenti 612. megaproxy 613. acronis-snapdeploy 614. siebel-crm 615. seven-email 616. bebo-mail 617. hushmail 618. ibackup 619. myspace-posting 620. jap 621. avaya-phone-ping 622. trinoo 623. usermin 624. zoho-mail 625. dabbledb 626. ospfigp 627. igp 628. hopopt 629. thinkfree 630. zoho-meeting 631. laconica 632. msn2go 633. webconnect 634. ovation 635. eatlime 636. xm-radio 637. vidsoft 638. mcafee 639. pna 640. perforce 641. fasp 642. fogbugz 643. ventrilo 644. proxeasy 645. meabox 646. cddb 647. swapper 648. peerguardian 649. ms-frs 650. mercurial

© 2010 Palo Alto Networks Page 22
651. transferbigfiles 652. foldershare 653. bonpoo 654. lotus-notes-admin 655. fc2-blog-posting 656. cooltalk 657. gizmo 658. vsee 659. x-font-server 660. http-tunnel 661. rvd 662. mobile 663. arcserve 664. esignal 665. subspace 666. storage.to 667. tcp-over-dns 668. zenbe 669. yahoo-blog-posting 670. yoics 671. altiris 672. pup 673. ip-in-ip 674. emcon 675. pownce 676. hyves-chat 677. ipsec-ah 678. 2ch-posting 679. bebo-posting 680. ameba-now 681. idrp 682. egp 683. tvants 684. zoho-planner 685. noteworthy-admin 686. sun-nd 687. ipcomp 688. yugma 689. webaim 690. propalms 691. ibm-clearcase 692. little-fighter 693. boxnet-uploading 694. boxnet-editing 695. swipe 696. filemaker-anouncement 697. drda 698. surrogafier 699. fly-proxy 700. joost 701. wlccp 702. vrrp 703. trunk-1 704. pgm 705. ipv6-icmp 706. ipip 707. exp 708. argus 709. instan-t-webmessenger 710. wikidot-editing 711. wetpaint-editing 712. cvsup 713. sdrp 714. isis 715. bgp 716. skydur 717. writeboard 718. track-it 719. xnet 720. udplite 721. st 722. srp 723. snp 724. nvp-ii 725. nsfnet-igp 726. merit-inp 727. larp
728. iso-ip 729. fire 730. chaos 731. cbt 732. bna 733. rediffbol-audio-video 734. pharos 735. warcraft 736. warez-p2p 737. megashares 738. file-host 739. steganos-vpn 740. aim-audio 741. mgcp 742. nateon-audio-video 743. flexnet-publisher 744. linkedin-posting 745. synergy 746. camo-proxy 747. rusers 748. rstatd 749. modbus 750. dnp3 751. xns-idp 752. sscopmce 753. skip 754. sat-expak 755. ptp 756. prm 757. private-enc 758. mobilehdr 759. leaf-2 760. lan 761. ipv6-frag 762. iatp 763. hmp 764. fibre-channel 765. dccp 766. cftp 767. bbn-rcc-mon 768. spark-im 769. google-lively 770. bluecoat-adn 771. war-rock 772. peerenabler 773. turboshare 774. gbridge 775. socialtext-editing 776. moinmoin-editing 777. aim-video 778. emc-smartpackets 779. emc-networker 780. schmedley 781. idpr-cmtp 782. idpr 783. unyte 784. techinline 785. pingfu 786. meevee 787. netbotz 788. modbus-read-holding-registers 789. wsn 790. wb-expak 791. ttp 792. sprite-rpc 793. smp 794. sctp 795. reliable-data 796. qnx 797. pipe 798. narp 799. mux 800. leaf-1 801. iplt 802. ipcv 803. ifmp 804. host
805. dgp 806. dfs 807. ddx 808. crtp 809. cpnx 810. aris 811. 3pc 812. we-dancing-online 813. knight-online 814. share-p2p 815. steekr 816. realtunnel 817. maxdb 818. motleyfool-posting 819. backpack-editing 820. ms-ocs-audio 821. sina-weibo 822. dsr 823. r-exec 824. bypassthat 825. asproxy 826. neokast 827. wb-mon 828. vmtp 829. vines 830. uti 831. trunk-2 832. tlsp 833. tcf 834. stp 835. sps 836. secure-vmtp 837. sat-mon 838. pvp 839. pnni 840. mfe-nsp 841. kryptolan 842. ipv6-route 843. ipv6-opts 844. ipv6-nonxt 845. ippc 846. nlsp 847. il 848. gmtp 849. encap 850. ddp 851. dcn-meas 852. crudp 853. cphb 854. br-sat-mon 855. activenet 856. cloudmark-desktop 857. nateon-desktop-sharing 858. rediffbol 859. jxta 860. blokus 861. openft 862. gmail-drive 863. wixi 864. dropboks 865. megashare 866. mydownloader 867. sharebase.to 868. fluxiom 869. firephoenix 870. kaixin-mail 871. zoho-db 872. paloalto-userid-agent 873. daap 874. sharepoint-wiki 875. ragingbull-posting 876. howardforums-posting 877. google-finance-posting 878. ms-ocs-video 879. yosemite-backup 880. sina-weibo-posting 881. ameba-now-posting

© 2010 Palo Alto Networks Page 23
882. your-freedom 883. privax 884. gyao 885. zoho-share 886. meeting-maker 887. spirent 888. OSSEC 889. netware-remote-console 890. modbus-write-single-register 891. modbus-write-multiple-
registers 892. modbus-read-input-registers 893. modbus-read-coils 894. loglogic 895. xtp 896. visa 897. sm 898. netblt 899. mtp 900. mpls-in-ip 901. iso-tp4 902. irtp 903. ipx-in-ip 904. ggp 905. compaq-peer 906. rwho 907. gopher 908. g.ho.st 909. vyew 910. netop-on-demand 911. campfire 912. kaixin-chat 913. airaim 914. sharepoint-blog-posting 915. oracle-bi 916. hitachi-spc 917. paradise-paintball 918. hyves-games 919. call-of-duty 920. zoho-people 921. vnn 922. tinyvpn 923. remobo 924. mobility-xe 925. gpass 926. hyves-mail 927. tacacs 928. bluecoat-auth-agent 929. tvtonic 930. hyves-music 931. freecast