Embed Size (px)
Citation preview

The Application of the LEAP The Application of the LEAP Software Tool to Energy Sector Software Tool to Energy Sector Analysis in the Republic of KoreaAnalysis in the Republic of Korea
East Asia Energy Futures / Asia Energy Security Project
5 November, 2003Vancouver, Canada.
Hoseok Kim

Directions of the StudyDirections of the Study
Applying LEAP software tool to the ROKEstablishing a comprehensive and effective LEAP data set for the ROKAssessing the properness of the application and datasetProjecting future energy outlook based on business-as-usual caseDeveloping reasonable and meaningful alternative scenariosAnalyzing the results and implication of the alternative scenarios

This presentation will showHow to apply the LEAP software tool to the ROK’s energy sector.The structure of ROK2003: An Overview The obstacles and problems in the application Possible energy issues being analyzed based on LEAP ROK data set and ROK2003.Know-how might be shared with other regional working group

Organization of the PresentationOrganization of the Presentation
1. ROK’s Energy Policy 2. LEAP Modeling in ROK3. LEAP ROK2003 4. Demand Sector5. Transformation Sector6. BAU Energy Paths7. Obstacles and Tasks8. Alternative Scenarios

1. 1. ROKROK’’ss Energy PolicyEnergy Policy

Energy Policy and Modeling
Various types of energy policy give a exogenous shock to (inter)national energy system.
Energy demand & supplyEnergy mixEnergy efficiencyThe innovation of energy –related technology
Energy models help to foresee the impacts and to analyze the implications of energy policy.

ROK’s Energy Policy: Problems and Challenges
Maintaining a stable energy supply for enduring economic growthEncouraging competition in energy marketReducing the dependence on oil Diversification of energy sourcesEstablishing environment- and climate-friendly energy system for Sustainable Development. Strengthening the long-run potential for pollution controlRestructuring an energy system with low GHG emissions

Directions of ROK’s Energy Policy
Sustainable Energy System
To stimulate energy efficiencyTo stabilize energy supply capacity
Energy Technology Innovation
To develop energy technologies
Competitive Energy Markets
To privatize energy industriesTo improve efficiency in energy market
Regional Cooperation To diversify energy sourcesTo stabilize energy supply and prices

2. LEAP Modeling in ROK2. LEAP Modeling in ROK

Previous Work
Beijing workshop, June 2000Nautilus provided support in the use of the LEAP software The first national dataset for LEAP was developed.
Berkeley workshop, February 2001The first rigorous application was made.(ROK2000)The conceptual and analytical understanding was elaborated in the training session.
Berkeley workshop, January 2002After the 3rd training workshop ROK2000 was completed. And the dataset was applied to the LFG generation issue.

Why LEAP?
There is a huge range of models that can be used to address energy-related issues, and they are grouped into three categories:macroeconometric models, CGE models, energy-economy modelsEnergy-economy models, so called ‘bottom-up’models, are technology based models found on engineering relationships..

Strengths and Weakness of Bottom-Up ArpproachStrengths of Bottom-up Approach
The capacity to address at a more detailed sectoral and sub-sectoral level the implications of energy policies on energy system
Weaknesses of Bottom-up ApproachThe models may fail to adequately capture opportunity or welfare costs of technological substitution. The choice of modeling platform depends on the purpose of analysis.

LEAP Modeling Platform
LEAP modeling platform With its flexible structures, LEAP allows the user to simulate and assess the impacts of alternative energy policies on energy system-especially technological fields, and to project the energy supply and demand situation As a database, LEAP provides a comprehensive system for maintaining energy information.

Best Conditions for Applying LEAP Modeling PlatformLEAP model is most useful where:
There is insufficient historical macro-economic data for trend analysisThere are significant technological changes in energy sector. There are short-run development problemsThere is a need to disaggregate energy uses. There is a strong policy scheme that is shaping the national energy system.

Energy Modeling in the ROK
Macroeconometric ModelsCGE Models
KEED (Korea Energy Environmental Dynamic GE Model, KEEI)
Energy-Economy ModelsKEEI Model, EFOM-Env (Korea Energy Economics Institute)MARKAL (Korea Institute of Energy Research) META-Net, LEAP (Yonsei University)

3. LEAP ROK2003: An Overview3. LEAP ROK2003: An Overview

LEAP ROK Models
ROK1998 (LEAP v.95)Highly aggregated but simple and intuitive
ROK2000 (LEAP v.2000)Highly disaggregated but complex and with uncertainties in BAU paths
ROK2003 (LEAP v.2003))Less disaggregated than ROK2000 but with reasonable and rigorous BAU paths

Determinants of Model Structure
The purpose of analysisThe modes of shockMethodological approach of the analysisTime horizonGeographical coverageSectoral coverageData restriction or availability

ROK Models
The purpose is to assess the recent ROK’s energy policy scheme and its regional implicationShock: Policies on energy demand, supply, and technological changeMethodology: LEAP software (scenario analysis)Time horizon: 2000-2015 (medium-term)Geographical coverage: National modelSectoral coverage: Energy sectorData availability: Quite good!

The Structure of ROK2003
ROK 2003
DEMAND SECTORS
TRANSFORMATIONSECTOR RESOUCE
Residential
Industrial
Commercial & Public
Transportation
Electricity Generation
District Heating
Town Gas Production
LNG Gasification
SECONDARYElectricity , Town Gas
Natural Gas, Heat
PRIMARYCoal, Gasoline
Diesel, KeroseneFuel oil, LPG
Naphtha, LNGNuclear, Hydro

ROK2002 Model Diagram

Current Status of ROK2003
Well equipped with key data, parameters, and BAU pathHighly disaggregated in residential demand, transportation and transformation sectors Well structured to be applied in electricity generation and transportation analysisTwo alternative scenarios are under developing in the climate policy context

Key Data Gaps
Small Electricity AppliancesRenewable Energy UsesMass transit & freight: BAU path Air TransportationHeat Production of CHPElectricity Production of HOBOil Refining ProcessDomestic Coal Mining

Key Data Sources
Ministry of Commerce, Industry, and EnergyKorea Energy Economics InstituteKorea National Statistical OfficeKorea Development InstituteThe Bank of KoreaKorea Electric Power CorporationKorea District Heating CorporationKorea Coal Corporation Korea Gas Corporation

4. Demand Sector4. Demand Sector

The Structure of Demand Sector
DEMAND SECTOR
RESIDENTIAL TRANSPORTATION INDUSTRIAL COMMERCIAL & PUBLIC
CookingSpace Heating
LightingAppliances
Household VehiclesMass Transit & Freight
Agriculture & FisheryMining
ManufacturingConstruction
Commercial SectorPublic Sector

Energy Balance: TFE
2,626 1,160 22 229 -1,141 -PUBLIC
32,414 7,891 1,097 9,024 49 13,487 718 RESIDENT
30,999 175 -30,824 -TRANSP
83,135 11,374 3,308 207 47,209 19,129 INDUSTRIAL
149,173 20,600 1,119 12,561 256 92,660 19,847 FINAL
TotalElectHeatTown GasLNGPetcoalUNIT: 000 TOE

Final Energy Demand in 2000
150100%
2.11.4%
1.10.7%
20.613.7%
12.68.4%
93.662.4%
19.813.2%
Total
20.6%31.0000.2030.80Transportation
1.7%2.6001.20.21.10Public & Others
21.6%32.40.21.17.99.013.50.7Residential & Commercial
56.0%83.91.9011.43.348.219.1Industrial
TotalRenewableHeatElectri
cityTown Gas
PetroleumCoal(M TOE)

Evolution from 1984 to 2002 of TFE by Sector
010,00020,00030,00040,00050,00060,00070,00080,00090,000
100,000
1988
1989
1990
1991
1992
1993
1994
1995
1996
1997
1998
1999
2000
2001
2002
K T
OE
Industrial Res & ComTransportationPublic

Evolution from 1984 to 2002 of TFE by Fuel
0
20,000
40,000
60,000
80,000
100,000
120,000
1984
1985
1986
1987
1988
1989
1990
1991
1992
1993
1994
1995
1996
1997
1998
1999
2000
2001
2002
K T
OE
Coal Petroleum Town GasElectricityOthers

End-Uses of Residential Sector
Refrigerator, Rice cooker, Air conditioner, TV, PC, Electric stove, Kimchi Refrigerator, Washing machine, Vacuum cleaner
ELECTRICITYAPPLIANCES
Town Gas StoveLPG Stove
LPGTown Gas
COOKING
Incandescent bulbsFluorescent bulbsOther bulbs
ELECTRICITYLIGHTING
BoilersDistrict Heating
COAL, GAS, HEAT, OIL,
ELECTRICITYHEATING
DEVICEFUEL TYPEEND USES

Residential Sector
0.2Coal
0.4Electricity
0.9Oil
46.3LPG
51.3Town gas
Cooking
1.5Coal
1.6Electricity
3.4LPG
6.4District
37Town gas
48.6Oil
Heating

Industrial Sector
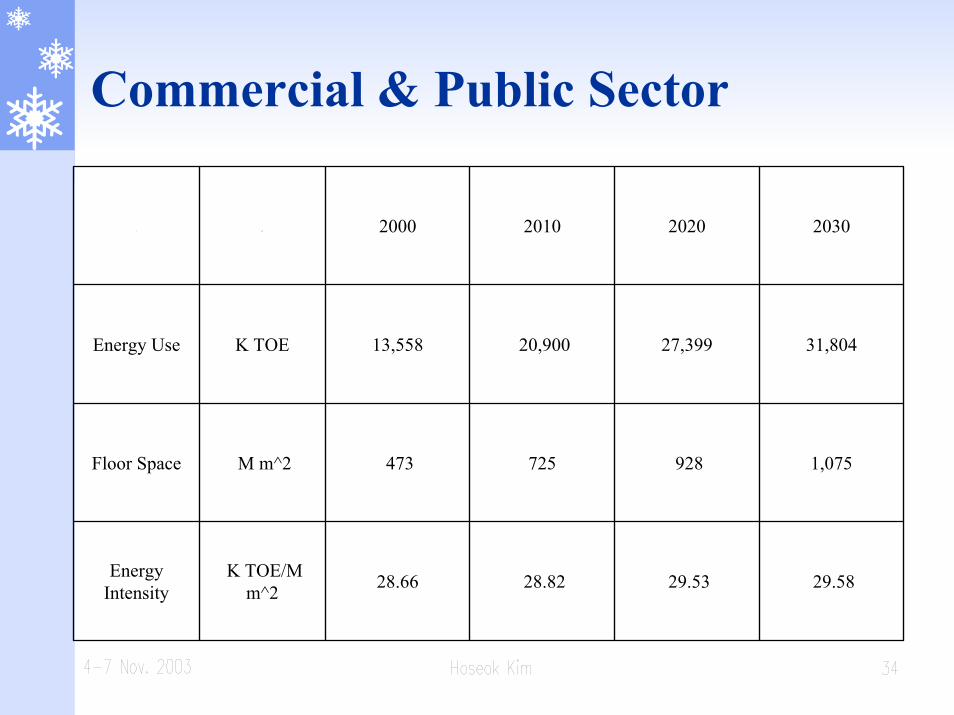
Commercial & Public Sector
29.58 29.53 28.82 28.66 K TOE/M m^2
Energy Intensity
1,075 928 725 473 M m^2 Floor Space
31,804 27,399 20,900 13,558 K TOE Energy Use
2030202020102000

Transportation Sector
17,82411,731,000Sum
5,2682,254,000Truck
2,5421,284,000Bus
972522,000SUV
9,0427,671,000Cars
Fuel Use (Ktoe)
Vehicle PopulationHousehold
2,13869,170Bus
13,616546,328Sum
4927,297Rail
6,1911,827Marine
2,815235,791Truck
1,927232,243Taxi
Fuel Use (Ktoe)
Vehicle Population
MassTran & Freight

5. Transformation Sector5. Transformation Sector

Transformation Sector
Transformation
ElectricGeneration
Town GasProduction
District Heating
Coal, Fuel OilDiesel, Natural Gas
HydroNuclear
LPGNatural Gas
Natural GasTown GasFuel Oil
LPGGasification
LNG

Energy Balance: Transformation
179 -12,520 12,387 312 -
Town Gas
532 -355 120 436 331 -Heat
39,541 27,241 1,402 -22,910
-809 108 5,403 6,042 23,064
Electricity
192,888 27,241 1,402 18,924 100,280 42,911 PRIMARY
TotalNuclearHydroElectHeatTown
GasLNGPetcoalUNIT: 000 TOE

Data on Generation Facilities
42.441,5441,346N.A.Nuclear
1.212,024617N.A.Hydro
9.516,53650544.15Combined
0.169,8401,15437.2Internal
0.6--35.68LNG
7.421,61280037.45Oil
38.732,62892039.25Coal
Output Share (%)
O&M Cost(KRW/kW)
Capital Cost(K KRW/kW)
Efficiency(%)

Electric Generation by Fuel
0
50000
100000
150000
200000
250000
300000
GWh
1980 1982 1984 1986 1988 1990 1992 1994 1996 1998 2000
Trend of Electric Generation
InternalCombinedLNG OilCoalNuclearHydro


6. BAU Energy Path6. BAU Energy Path

Assumptions of BAU Path
GDP: 4.9% annual growth rate for the years 2000-15Population: 0.6% annual growth rateHouseholds: 1.5% annual growth rateResidential
Expansion of town gas use and district heatingDisappearance of LPG and coal uses
Industrial Decrease of the share of industrial GDPDecrease of manufacturing and increase of construction
Commercial & PublicIncrease of floorspace in commercial and public sector

Electricity Generation CapacityStable maintenance of nuclearExpansion of CHPReduction of coal and oil generation
Increase of LNG gasification facilitiesExpansion of district heating areaEnlargement of town gas-using households

Major Demographic Data Outlook
POPULATION
-5,000
10,00015,00020,00025,000
30,00035,00040,000
45,00050,000
1970 1975 1980 1985 1990 1995 2000
Thousand PERSON
HOUSEHOLDS
-
2,000
4,000
6,000
8,000
10,000
12,000
14,000
16,000
1970 1975 1980 1985 1990 1995 2000
Thousand Households
Person per Household
-
1.00
2.00
3.00
4.00
5.00
6.00
1970 1975 1980 1985 1990 1995 2000
Persons

GDP Outlook
GDP
-
200,000
400,000
600,000
800,000
1,000,000
1,200,000
1,400,000
1980 1985 1990 1995 2000 2005 2010 2015 2020
Billion 1995 W
o

Final Energy Demand: BAU

Energy Supply of Transformation Sector

Imports of Primary Energy: BAU

Electricity Generation: BAU

Global Warming Potential: Demand : BAU

Global Warming Potential: Transformation : BAU

Examining the Results: TFE & TPES

Projected TFE in 2015: 226.9 MtoeMOCIE’s outlook: 231.7 MtoeAccounts for 97%
Projected TPES in 2015: 254.7 Mtoe MOCIE’s outlook: 288.4 MtoeAccounts for 88.3%
BAU paths describe ROK’s energy system quite well.


Introduction and expansion of Natural Gas Vehicle (NGV) Introduction and expansion of LFG generationExpansion of compact household vehiclesIntroduction of ‘fuel cell’Changes in energy/environmental technologyStructural change in electricity sectorVarious regional cooperations

Future Work
Developing future energy scenariosCollecting and supplementing missing data Trying plausible structural modificationsUpdating the dataset (2000 2001)Disaggregating major (sub)sectors


![LEAP - perpustakaan.bappenas.go.idperpustakaan.bappenas.go.id/lontar/file?file=digital/153659-[_Konten_]-Konten D491.pdf · LEAP Long-range Energy Alternatives Planning system MANUAL](https://img.dokumen.tips/doc/110x75/5d49018e88c993391e8b9f77/leap-d491pdf-leap-long-range-energy-alternatives-planning-system-manual-model.jpg)