Embed Size (px)
Citation preview

International Journal of Accounting and Financial Reporting
ISSN 2162-3082
2016, Vol. 6, No. 2
77
The Anatomy of Sick Banks in Nigeria: Evidences from
Multidiscriminate Analysis Models on Selected
Nigerian Commercial Banks
Philip Olawale Odewole (Corresponding author)
Department of Management and Accounting, Obafemi Awolowo University
Ile-Ife, Nigeria
Email: [email protected]
Rafiu Oyesola Salawu
Department of Management and Accounting, Obafemi Awolowo University
Ile-Ife, Nigeria
Received: August 23, 2016 Accepted: September 15, 2016 Published: October 03, 2016
doi:10.5296/ijafr.v6i2.10037 URL: http://dx.doi.org/10.5296/ijafr.v6i2.10037
Abstract
This study investigates the banks‟ signs and symptoms of sickness and susceptibility to
corporate failure using multidiscriminate modeling approach with panel data of 14
commercial banks in Nigeria over the periods 2005 – 2012. The study also employed
corporate failure prediction models to generate the parameters used to predict the banks‟
susceptibility to corporate failure and determination of weakness and sickness. The results of
the business failure models revealed that five (5) out of the fourteen (14) banks were strong
with their z-score values ranging from 2.99 to 3.05 which were the minimum bench marks for
strong, sound and healthy banks while five (5) out of the fourteen samples banks were on the
border line of average performance with their z-score figures reported at 1.88 to 2.04 and four
(4) of the banks are already sick and weak and susceptible to failure with z-scores of 1.55 to
1.72 which fall below the cut-offs for average performance as prescribed by Altman. The
study suggests that government should examine with all seriousness the genuineness of the
claim of N25 billion minimum capital base for the Nigerian banks as a follow up to what
banks claimed they had in year 2005.
Keywords: Banks‟ weakness, Sickness, Corporate failure, Multidiscriminate models

International Journal of Accounting and Financial Reporting
ISSN 2162-3082
2016, Vol. 6, No. 2
78
1. Introduction
A sick bank is one whose liquidity or solvency is or will be impaired unless there is a major
improvement in its financial resources, risk profile, strategic business direction, risk
management, capabilities and/or quality of management. They are banks with excessive loan
expansion programme with poor asset quality and collateral securities. Sick banks are the
ones with potential or immediate threats to liquidity and solvency, rather than one with
observable weaknesses that are isolated or temporary and which can normally be corrected by
appropriate remedial action. Sick banks are characterized with poor management, inadequate
financial resources, absence of a long – term sustainable business strategy; weak asset
quality; and poor systems and controls.
Banks are the pivots of a growing economy. They are the cornerstone and secrets of a fast
growing nation. They are the life wires and strong supports of a surviving economy. Banks
are special breed of financial firms who provide deposit and loan products. The deposit
products pay out money on demand or after some notice. They are in business of managing
liabilities and in the process; banks also lend money, thereby creating bank assets, which are
funded by deposit or other liabilities. In modern banking systems, there exists a whole range
of special banks, which focus on niche markets, and generalist banks, which offer a wide
range of banking and other financial products, as diverse as deposit accounts, loan products,
real estate services, stocking, and life assurance.
Banks need liquidity to meet deposit withdrawals and to satisfy customer loan demand. The
more volatile a bank‟s loan and deposit and liability flows are, the more liquidity it needs.
Confidence in a bank permits it to avoid deposit runs or liquidity crisis. The ability of a bank
to provide liquidity requires the existence of a highly liquid and readily transferable stock of
financial assets. The liquidity requirement means that financial assets must be available to
owners on short notice.
The Nigerian banking system has witnessed many notable changes over the years in the
industry in terms of the ownership structure, the number of institutions, as well as depth and
breadth of operations. The decade between 1995 and 2005 was particularly traumatic for the
Nigerian banking industry; with frequency of distress cases reaching an unbelievable level,
thereby making it an issue of concern not only to the regulatory institutions but also to the
policy analysts and the general public who are the direct and indirect consumers of banks
services.
As at end of June, 2004, there were 89 deposits money banks operating in the country,
comprising Institutions of various sizes and degrees of soundness. Most banks in Nigeria
have a capitalization of less than $10 million. Even the largest bank in Nigeria then had a
capital base of about US $240 million compared to US$526 million for the smallest bank in
Malaysia. The small size of most of our banks, each with expensive headquarters, separate
investment in software and hardware, heavy fixed costs and operating expenses, and with
bunching of branches in few states, commercial centres – lead to very high average cost for
the industry. This in turn has implications for the cost of intermediation, the spread between
deposit and lending and puts undue pressures on banks to engage in sharp practices as means

International Journal of Accounting and Financial Reporting
ISSN 2162-3082
2016, Vol. 6, No. 2
79
of survival.
As at end of March 2004, the Central Bank of Nigeria‟s ratings of all the banks, classified 62
as sound / satisfactory, 14 as marginal and 11 as unsound, while 2 of the banks did not render
any returns during the period. The weakness of some of the ruling banks are manifested by
their overdrawn positions with the CBN, high incidence of over – performing loans, capital
deficiencies, weak management and poor corporate governance. The fundamental problems
of the banks, particularly those classified as unsound, have been classified to include
persistent illiquidity, poor assets quality and unprofitable operations.
By the end of 2010, many of the banks that were adjudged as being strong had started
experiencing liquidity problems. Some could not even declare profits generated for a year,
thereby eroding the depositors‟ confidence in the banks and leading to the failure and take –
overs of good number of the failed banks.
The objective of the study is to empirically investigate the characteristics, signs and
symptoms of sick banks in Nigeria. The names of the selected fourteen (14) commercial
banks were not given so as not to offend the confidentiality contents of each bank. Rather,
each bank is assigned alphabet letters A-N without whittling down the originality of the
information.
This paper, therefore, is arranged as follows: following the introductory session, session 2
reviews the literature, section 3 presents the methodology of the study, section 4 presents the
analysis and discussion of results, and section 5 offers policy recommendation while section
6 concludes the study with suggestions for further study.
2. Literature Review
Multidiscriminant models used to analyze bank weakness, sickness and failure are generally
divided into two: quantitative models, which are based largely on published financial
information and qualitative models, which are based on an internal appraisal and assessment
of the banks. The starting point in the use of corporate models to predict corporate weakness
and failure started with William Beaver (1966) with the use of financial ratios. He applied a
univariate model to classify each ratio. A cut – off point was established where the percentage
of misclassification for both failing and non – failing was minimized. The misclassification
could be either classifying a sick firm or non – failing (a Type I error), or classifying a non –
failing firm as failing (a Type II error). Beaver selected a sample of 79 failed firms and 79
non – failing firms and investigated the predictive power of 30 ratios when applied five years
prior to failure of the ratio examined, he found that the cash flow to total debt ratio was most
significant in predicting failure and sickness with a success rate of 78% for five years before
bankruptcy.
Altman (1968) approached the prediction of corporate weakness and failure with the
introduction of multivariate approach which applied discriminate Analysis to Business
Failure Prediction. Altman combined several variables (ratios) into a single weighted score
for each business in the arrays of ratios which were fitted into his models. In the model, the
ratios are combined into a single discriminate score, termed a „Z Score‟, with a low score
International Journal of Accounting and Financial Reporting
ISSN 2162-3082
2016, Vol. 6, No. 2
80
usually indicating poor financial health. Altman‟s study involved 66 manufacturing
companies with equal numbers of failure and survivors, and a total of 22 ratios from five
categories, namely liquidity, profitability, leverage, solvency and activity. This score was
calculated based on the following general discriminant functions:
Z = a1X1 + a2X2 +……..anXn + c
Where Z was the score, xi were the independent variables, an and c were the estimated
parameters.
The linear function for Altman‟s (1968) model was:
Z = 0.012*1 + 0.0141*2 + 0.033*3 + 0.006 *4 +0.999*5 where
X1 = working capital over total assets
X2= retained earnings over total assets
X3 = earnings before interest and tax over total assets
X4= market value of equity over book of total debt and
X5 = sales over total assets.
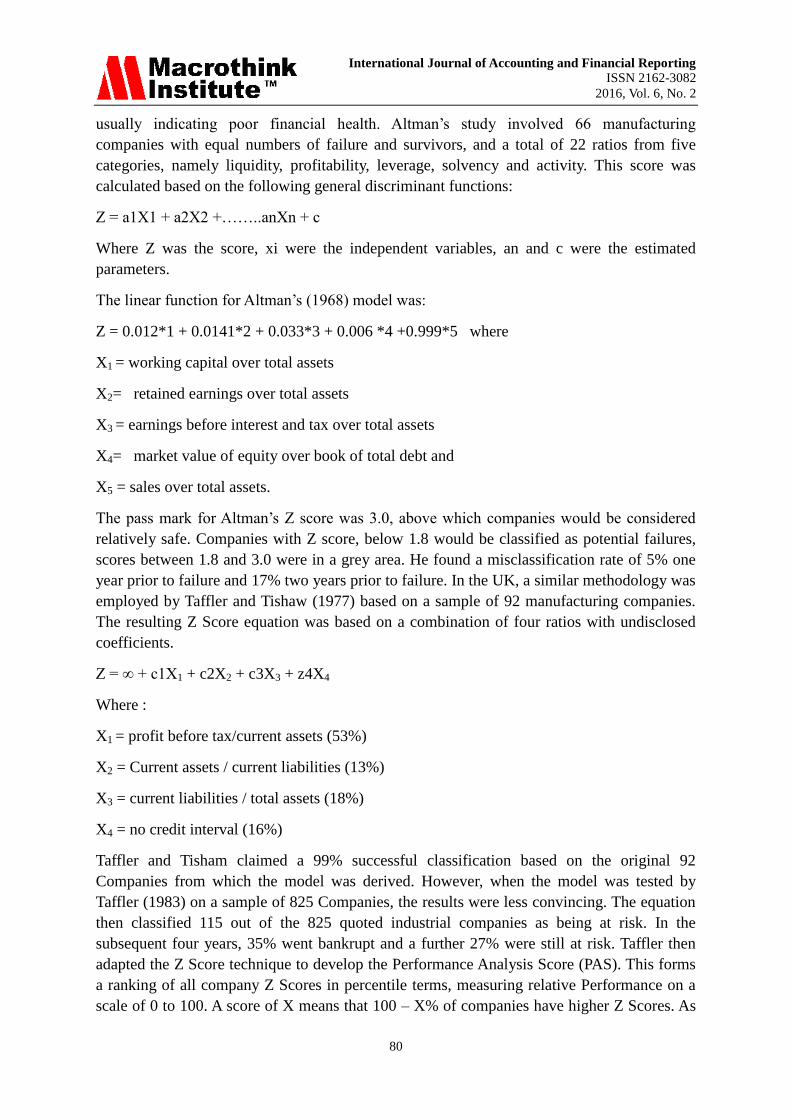
The pass mark for Altman‟s Z score was 3.0, above which companies would be considered
relatively safe. Companies with Z score, below 1.8 would be classified as potential failures,
scores between 1.8 and 3.0 were in a grey area. He found a misclassification rate of 5% one
year prior to failure and 17% two years prior to failure. In the UK, a similar methodology was
employed by Taffler and Tishaw (1977) based on a sample of 92 manufacturing companies.
The resulting Z Score equation was based on a combination of four ratios with undisclosed
coefficients.
Z = ∞ + c1X1 + c2X2 + c3X3 + z4X4
Where :
X1 = profit before tax/current assets (53%)
X2 = Current assets / current liabilities (13%)
X3 = current liabilities / total assets (18%)
X4 = no credit interval (16%)
Taffler and Tisham claimed a 99% successful classification based on the original 92
Companies from which the model was derived. However, when the model was tested by
Taffler (1983) on a sample of 825 Companies, the results were less convincing. The equation
then classified 115 out of the 825 quoted industrial companies as being at risk. In the
subsequent four years, 35% went bankrupt and a further 27% were still at risk. Taffler then
adapted the Z Score technique to develop the Performance Analysis Score (PAS). This forms
a ranking of all company Z Scores in percentile terms, measuring relative Performance on a
scale of 0 to 100. A score of X means that 100 – X% of companies have higher Z Scores. As

International Journal of Accounting and Financial Reporting
ISSN 2162-3082
2016, Vol. 6, No. 2
81
the PAS Score over time shows the relative performance trend of a company, any downward
trend should be investigated immediately.
Meyer and Pifer (1970) employed banking ratios in their study to predict bank failures. They
used ten different ratios in a discriminant analysis model. West (1985) used 19 functional
bank variables to estimate bank failures in a logit – factor analytic frame work. In his study,
the regression variables which were the factor loading of the 19 banking ratios were used.
Korobow and Stuhn (1985) criticized West‟s study for lack of predictive power. A possible
reason for the poor predictive power of the West models was that the factor analysis results
suggested some of his variables were unstable. The instability of variables is suspected
because the factor loadings of the variables were not consistently ranked in each of the three
consecutive years for which the study was conducted.
Martin (1977) used the logit model for bank failure prediction. Also, Ohlson (1980) used the
logit model to predict business failure with a sample of 105 bankrupt firms and 2,058 non –
failing firms. The nine financial ratios included in the model were the firm‟s size ( log of a
price – level deflated measure of total assets), total liabilities / total assets, working capital /
total assets, current liabilities / current assets, a dummy variable indicating whether total
assets were greater or less than total liabilities, net income / total assets, funds from operation
/ total liabilities, another dummy variable indicating whether net income was negative for the
last two years and change of net income. Ohlson used a relatively unbiased sampling
procedure because the failure / non-failure ratio in his study was more realistic.
However, the model did not perform as well as multidiscriminate Analysis, which suggested
that previous researchers, might have overstated the discriminating power of their models
(Morris 1997). Zmijewski (1984) examined the “choice – base” sample bias and “sample
selection” bias faced by financial distress researchers, contrary to the common 1:1 failure /
non – failure matching, he used the probit model on six sets of data where the ratio of failure /
non – failure varied from 1:1 to 1:20. The results indicated that the choice – based sample
bias decreased as the failure / non –failure ratio approached the population probability. Odom
and Sharda (1990) employed the same financial ratios used by Altman (1968) and applied a
Neutral Network model sample on 65 failed and 64 non – failed firms.
In Kumer and Ganesalingam (2001) study, they focused on predicting financial distress
among a selection of major Australian companies. Seventy-one of such companies were
subjected to an analysis to determine various facts about the companies, in particular their
long-term stability. Among these facts are the likelihood of each company becoming bankrupt
and the classification of companies into district groups based on ten financial ratios. Zhu
(2012) suggested that financial ratios (liquidity , profitability, operational efficiency, growth,
structural factors and cash flows) were effective variables to predict and explain corporate
failures. The application has been questioned for inability to predict future decision – making
(Rappaport, 1995). Several studies have considered EVA (Economic Value added) to be a
crucial tool measuring performance (Sharma and Kumer, 2010, Ismail, 2011;Haddad, 2012;
Parvaei and Farhadi, 2013) and managers worldwide have adopted it as a corporate strategy
(Sharma and Kamar, 2010). The companies would face bankruptcy, which explains a direct
International Journal of Accounting and Financial Reporting
ISSN 2162-3082
2016, Vol. 6, No. 2
82
correlation exists between bankruptcy and companies that apply the Eva (Timo and Virtanen,
2001; Pasaribu, 2008, Anvar Khatibietal, 2013). Xie (2011) indicated that macro- economic
indicators were useful to explain the interaction between the environment and corporate
problems.
Sophisticated methods have been developed and used in order to reach higher predictive
power of firm failure models. Frequent usage of neural networks (Tsai and Wu, 2008, Kim
and Kang, 2010; Lee, Choi, 2013), recursive partitioning (Marais, 1984, Muller, 2009),
hazard models (Abdullah, 2008) Bakhasnani 2013; Fijorek and Grotowski, 2012; Foster and
Zurada, 2013) and fuzzy models (Matviychuk, 2010; Karami, 2012). Ezzamel, Brodie and
Mar – Molinero (1987) briefly reviewed the earlier research and reported in the UK study of
Financial Ratio using factor analysis. Using 53 ratios, the described five broad patterns (1)
Capital Intensiveness (2) Profitability-expressed as earnings or cash flows as related to assets
or funds (3) working capital position (4) Liquidity position (5) asset turnover. They
concluded that these patterns were not stable during the period of their study, even when
considering the same group of companies. They however concluded that it was possible to
identify distinct financial patterns and that these could be used to reduce the numbers of
ratios being studied.
Argenti (1976) developed „a score model which suggests that the future process follows
predictable sequences: Defects Mistakes Symptoms of failure. He divided defects
into management weaknesses and accounting deficiencies and assigned values in this order;
autocratic chief executives (8), failure to separate the role of chairman and chief executive
(4), passive board of director (2), lack of balance of skills in management team – financial,
legal, marketing etc. (4), weak finance director(2) , lack of management in-depth (1), poor
response to change (15). He classified accounting deficiencies with assigned values as no
budgetary control (3), no cash flow plans (3) and no costing system (3). Each weakness or
deficiency is given a mark or given zero if the problem is not present. The total mark for
defects is 45, and Argenti suggests that a mark of 10 or less is satisfactory. He therefore
concluded that if a company‟s management is weak, then it will inevitably make mistakes
which may not become evident in the form of symptoms for a long period of time. According
to him, the three main mistakes, likely to occur with attached scores are: high gearing – a
company allows gearing to rise to such a level that one unfortunate event can have disastrous
consequences (15), over – trading – this occurs when a company expands faster than its
financing is capable of supporting. The capital base can become too small and unbalanced
(15), the big project – any external / internal project, the failure of which would bring the
company down (15). The suggested pass mark for mistakes is a maximum of 15
The final stage of the process occurs when the symptoms of failure becomes visible. Argenti
classifies such symptoms of failure using the following categories: (i) Financial signs in the A
Score context, these appear only toward the end of the failure process in the last two years
(4), (ii) creative accounting- optimistic statements are made to the public and figures are
altered (Inventory Valued higher, depreciation lower etc). Because of this, the outsider may
not recognize any change and failure when it arrives, is therefore very rapid(4).(iii) Non –
financial signs – various signs include frozen management salaries, delayed capital
International Journal of Accounting and Financial Reporting
ISSN 2162-3082
2016, Vol. 6, No. 2
83
expenditure, failing market shares according to Tafler, a positive Z-Score means that the
rising staff turnover (3), (iv) Terminal Signs – at the end of the failure process, the financial
signs become so obvious that even the casual observer recognizes them . Richardson (1994)
classified reasons for failure by the use of the analogy of frogs and tadpoles: (1) Boiled frog
failure – these are long – established organizations which exhibit the often observed
organizational characteristics of intro version and inertia in the presence of organizational
change. (ii) Drowned frog failures – less to do with management complacency and more to
do with managerial ambition and hyper activity. In the smaller company context, this is the
failed ambitions entrepreneur whereas in the bigger context, this is the failed conglomerate
kingmaker.(iii) Bull frogs – expensive show – offs who need to adorn themselves with the
trappings of success. The bull frog exists on a continuum from the small firm flush to the
money messing megalomanaiac. The behaviour of bull frogs often raises ethical issues due to
a failure to separate business expenditure from personal expenditure (iv) Tadpoles – Tadpoles
never develop into frogs and represent the failed business start – up in the small business
setting. In the large business context, the tadpole is typified by the business which is dragged
down by a big new project which turns out to be such an expensive failure that a destroys its
parent.
In summary, care has been taken in the literature to critically look at the early signs and
warning of the sick banks in different countries and their susceptibility to failure but no
known study has investigated the signs and symptoms of sick banks in Nigeria and their
susceptibility to failure during the turbulent global financial period. It is therefore important
to look at this issue in Nigeria because it allows us to know the major signs and early
warnings of sick banks and their susceptibility to failure before the eventual doom. Hence the
present study fills this missing gap.
3. Data and Methodology
3.1. Data and Measurement
Annual data are used for this study. The relevant data extracted from the Audited Annual
Reports and Accounts of the banks for the period 2005 – 2012 were retrieved from the
Nigerian Stock Exchange (NSE), Ibadan office and supplemented by the Fact Book, 2012,
making a total of eight (8) observations for each bank.
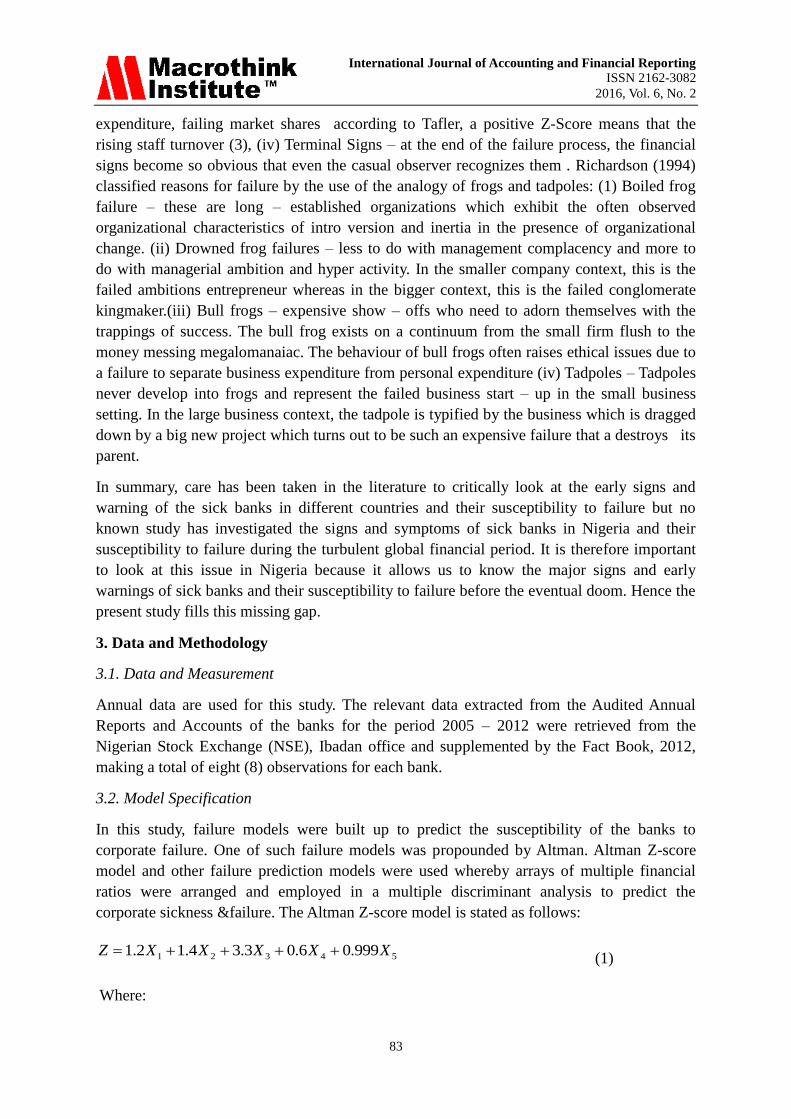
3.2. Model Specification
In this study, failure models were built up to predict the susceptibility of the banks to
corporate failure. One of such failure models was propounded by Altman. Altman Z-score
model and other failure prediction models were used whereby arrays of multiple financial
ratios were arranged and employed in a multiple discriminant analysis to predict the
corporate sickness &failure. The Altman Z-score model is stated as follows:
54321 999.06.03.34.12.1 XXXXXZ (1)
Where:

International Journal of Accounting and Financial Reporting
ISSN 2162-3082
2016, Vol. 6, No. 2
84
X1 = Net working capital/total assets (liquidity of the company)
X2 = Retained Earnings/Total assets (Profitability of the company)
X3 = Earnings before interest and Taxes/Total Assets (leverage of the company)
X4 = Market value equity/Book values of total debt (solvency of the company)
X5 = Sales/Total Assets (Activity of the Company)
X1 - Working capital/Total assets: The working Capital / Total assets ratio frequently found in
the studies of corporate problem is a measure of the net liquid assets of the firm relative to the
total capitalization. Working capital is defined as the difference between current assets and
current liability. Liquidity and size characteristics are explicitly considered. Ordinarily, a firm
experiencing consistent operating losses will have shrinking current assets in relation to total
assets of the three liquidity ratios evaluated the one proved to be the most valuable. This
variable is consistent with Merwin study which rated the net working capital to total assets
ratio as the best indicator of ultimate discontinuance.
X2 – Retained Earning/Total assets: Retained earnings is the account which reports the total
amount of reinvested earnings and/or losses of a firm over its entire life. The account is also
referred to as Earned surplus. It measures the cumulative] profitability over time. The age of a
firm is implicitly considered in this ratio. A relatively young firm will probably show a low
RE/TA ratio because it has both times to build up its cumulative profits. Therefore it may be
argued that the young firm is somewhat discriminated against in this analysis and its chance
of being classified as bankrupt is relatively higher than another older firm, ceteris paribus.
X3 – Earning before interest and Taxes/Total Assets: This ratio is calculated by dividing the
total assets of a firm into its earnings before interest and tax reductions. In essence, it is a
measure of the true productivity of the firm‟s assets, abstracting from any tax or leverage
factors. Since a firm‟s ultimate existence is based on the earning power of its assets, this ratio
appears to be particularly appropriate for studies dealing with corporate failure. Furthermore,
insolvency in a bankruptcy sense occurs when the total liability exceed a fair valuation of the
firm‟s assets with value determined by the earning power of the assets.
X4 – Market value of Equity/Book Value of Total Debt. Equity is measured by the embodied
market value of all share of stock preferred while debt includes both current and long-term.
The measure shows how much the firm‟s assets can decline in value (measured by market
value of equity, plus debt) before the liabilities exceed the assets and the firm becomes
insolvent. This ratio adds a market value dimension which other failure studies did not
consider. It also appears to be a more effective predictor of corporate failure than a similar,
more commonly used ratio. Net worth/Total/debt (book values).
X5 – Sales/total Assets: The capital turnover ratio is a standard financial ratio illustrating the
sales generating ability of the firm‟s assets. It is one measure of management‟s capability in
dealing with competitive conditions. This ratio is quite important because it is the least
significant ratio on an individual basis. To test the individual discriminating ability of the
variables an „F‟ test was performed. This test related the difference between the average
International Journal of Accounting and Financial Reporting
ISSN 2162-3082
2016, Vol. 6, No. 2
85
values of the ratio in each group to the variability (or spread) of values of the ratios within
each group. The tested banks were categorized into three: Category A, Category B and
Category C.
Category A – banks/firms belong to those that are susceptible to failure because the Z-score
are less than 1.81, that is Z<1.81.
Category B – Are those banks that are financially unhealthy because their Z-score are either
greater than 1.81 or less than 2.99 (i.e 1.81>Z<2.99).
Category C – are the banks that are financially healthy since their Z-scores are greater than
2.99 (i.e. Z > 2.99)
From the above findings, prediction was based on the susceptibility of the banks to corporate
failure and the financial soundness of the firms.
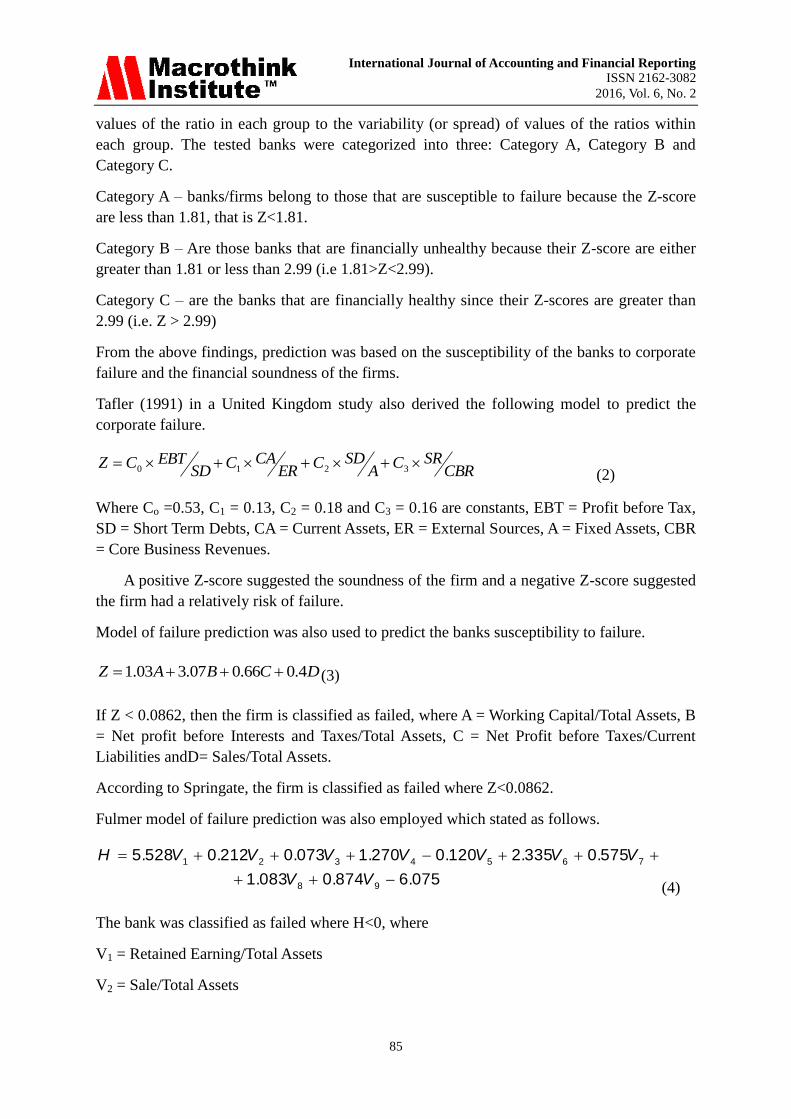
Tafler (1991) in a United Kingdom study also derived the following model to predict the
corporate failure.
CBRSRC
ASDC
ERCAC
SDEBTCZ 3210
(2)
Where Co =0.53, C1 = 0.13, C2 = 0.18 and C3 = 0.16 are constants, EBT = Profit before Tax,
SD = Short Term Debts, CA = Current Assets, ER = External Sources, A = Fixed Assets, CBR
= Core Business Revenues.
A positive Z-score suggested the soundness of the firm and a negative Z-score suggested
the firm had a relatively risk of failure.
Model of failure prediction was also used to predict the banks susceptibility to failure.
DCBAZ 4.066.007.303.1 (3)
If Z < 0.0862, then the firm is classified as failed, where A = Working Capital/Total Assets, B
= Net profit before Interests and Taxes/Total Assets, C = Net Profit before Taxes/Current
Liabilities andD= Sales/Total Assets.
According to Springate, the firm is classified as failed where Z<0.0862.
Fulmer model of failure prediction was also employed which stated as follows.
1 2 3 4 5 6 7
8 9
5.528 0.212 0.073 1.270 0.120 2.335 0.575
1.083 0.874 6.075
H V V V V V V V
V V
(4)
The bank was classified as failed where H<0, where
V1 = Retained Earning/Total Assets
V2 = Sale/Total Assets
International Journal of Accounting and Financial Reporting
ISSN 2162-3082
2016, Vol. 6, No. 2
86
V3 = EBT/Equity
V4 = Cash flow/Total Debt
V5 = Debt/Total Assets
V6 = Current Liability/Total Assets
V7 = Long Term Liability Total Assets
V8 = Working Capital/Total Debt
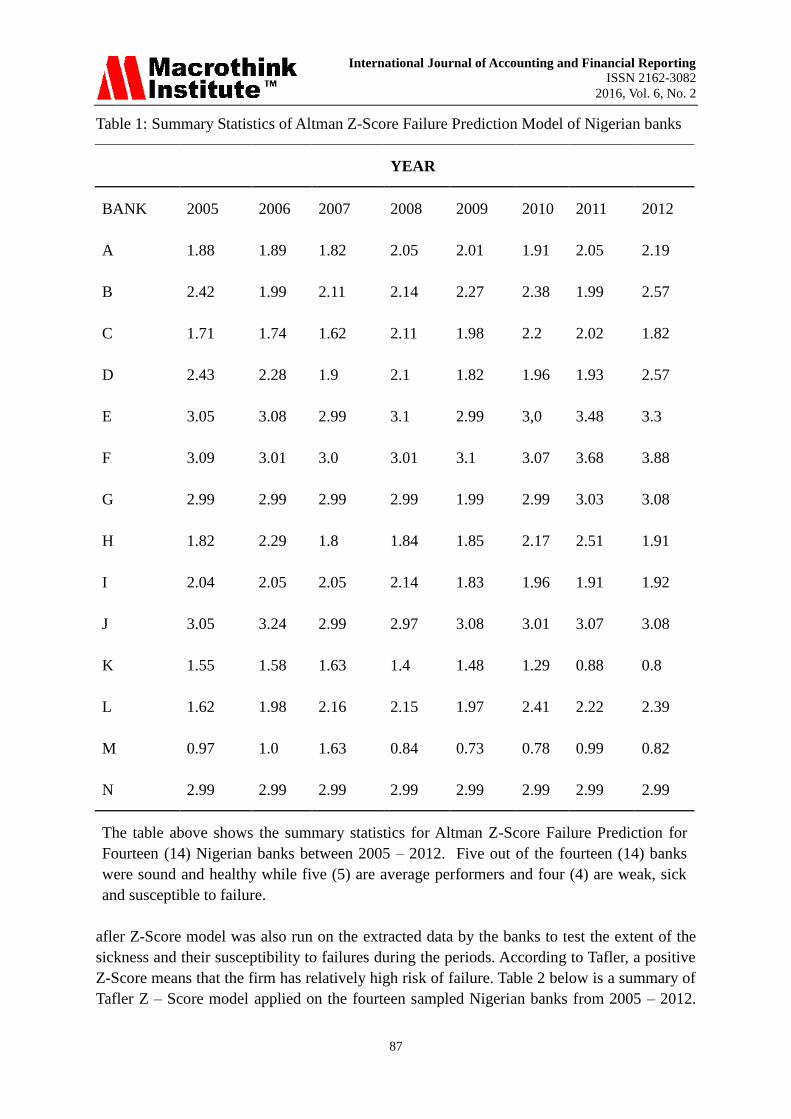
4. Main Results and Discussion
From table 1 below, the sickness of the banks and their susceptibility to corporate failure
using the Altman Z – Score model for the sampled banks between 2005 – 2012 where arrays
of multiple financial ratios were employed in a multiple discriminant analysis to predict the
corporate sickness and failure of the banks. The tested banks were grouped into three (3):
(i) Category A – Banks that were sick and therefore susceptible to failure because of the
Z-Score are less than 1.81, that is, Z < 1.81
(ii) Category B – are those banks that are not mid-way susceptible to failure but they are
financially unhealthy because their Z-Score are either greater than 1.81 or less
than 2.99 i.e (1.81 > Z < 2.99).
(iii) Category C – are the banks that are financially sound and healthy since their Z –
Scores are greater than 2.99 (i.e Z > 2.99).
From these findings therefore, it is revealed that in 2005, only five banks were actually
strong, sound and healthy with the Z – Scores range from 2.99 and above. These are banks
E, F, G,J and N. Five (5) out of the fourteen (14) selected banks were on the border line of
performance with various Z – Scores between 1.81 and 2.99. They were neither strong nor
susceptible to failure. They are mid-way banks with magnitude of signs and symptoms of
weakness.
The trend continued with the banks in 2006. Six of the fourteen sampled banks were sick and
financially unhealthy with various values of recorded Z-Scores. The story was worse for three
of the banks – banks C, K and M with the Z-Scores of 1.74, 1.55 and 0.97. In the Altman‟s
categorization, these banks were sick, weak and susceptible to failure. Those banks witnessed
a sharp decline in fixed interest covers, liquidity problem, cash flow crisis and low
profitability ratios during the period under review. The decline in their profitability lead
directly to a decrease in earnings per share and dividends declared during the periods while
many could not even declare dividends for long period of time.
International Journal of Accounting and Financial Reporting
ISSN 2162-3082
2016, Vol. 6, No. 2
87
Table 1: Summary Statistics of Altman Z-Score Failure Prediction Model of Nigerian banks
YEAR
BANK 2005 2006 2007 2008 2009 2010 2011 2012
A 1.88 1.89 1.82 2.05 2.01 1.91 2.05 2.19
B 2.42 1.99 2.11 2.14 2.27 2.38 1.99 2.57
C 1.71 1.74 1.62 2.11 1.98 2.2 2.02 1.82
D 2.43 2.28 1.9 2.1 1.82 1.96 1.93 2.57
E 3.05 3.08 2.99 3.1 2.99 3,0 3.48 3.3
F 3.09 3.01 3.0 3.01 3.1 3.07 3.68 3.88
G 2.99 2.99 2.99 2.99 1.99 2.99 3.03 3.08
H 1.82 2.29 1.8 1.84 1.85 2.17 2.51 1.91
I 2.04 2.05 2.05 2.14 1.83 1.96 1.91 1.92
J 3.05 3.24 2.99 2.97 3.08 3.01 3.07 3.08
K 1.55 1.58 1.63 1.4 1.48 1.29 0.88 0.8
L 1.62 1.98 2.16 2.15 1.97 2.41 2.22 2.39
M 0.97 1.0 1.63 0.84 0.73 0.78 0.99 0.82
N 2.99 2.99 2.99 2.99 2.99 2.99 2.99 2.99
The table above shows the summary statistics for Altman Z-Score Failure Prediction for
Fourteen (14) Nigerian banks between 2005 – 2012. Five out of the fourteen (14) banks
were sound and healthy while five (5) are average performers and four (4) are weak, sick
and susceptible to failure.
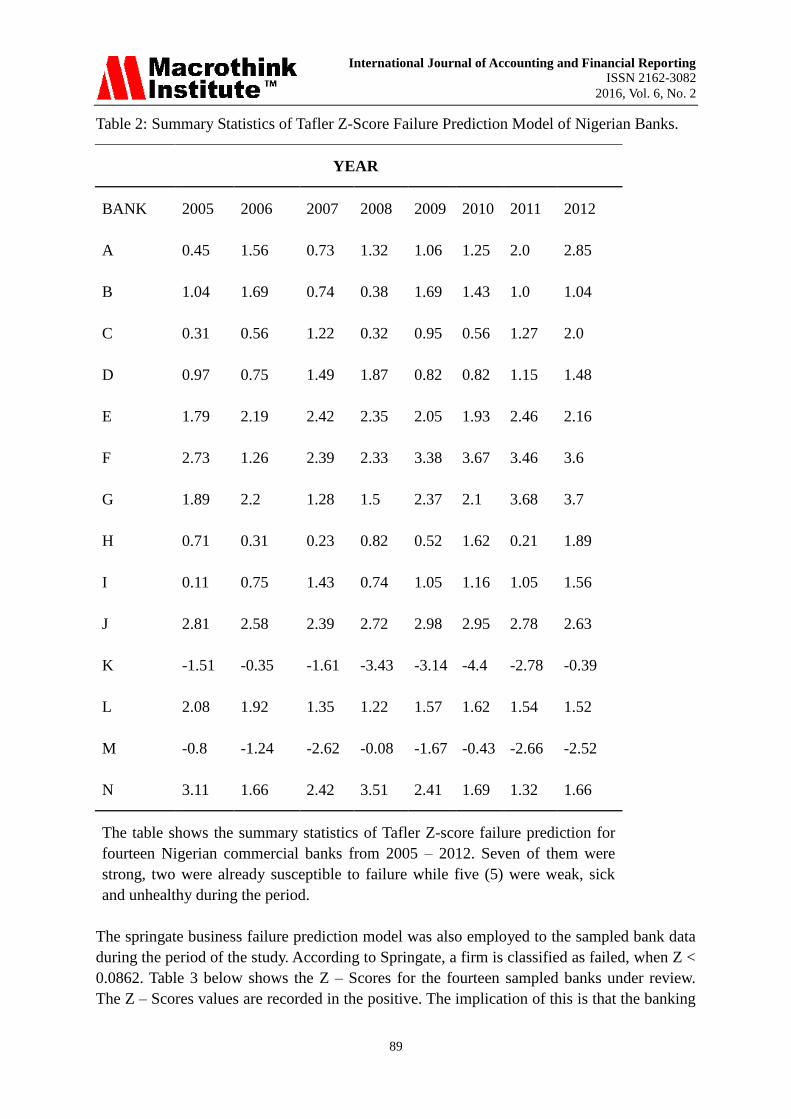
afler Z-Score model was also run on the extracted data by the banks to test the extent of the
sickness and their susceptibility to failures during the periods. According to Tafler, a positive
Z-Score means that the firm has relatively high risk of failure. Table 2 below is a summary of
Tafler Z – Score model applied on the fourteen sampled Nigerian banks from 2005 – 2012.

International Journal of Accounting and Financial Reporting
ISSN 2162-3082
2016, Vol. 6, No. 2
88
From the table, it is clearly evident that all the banks display positive values for their Z-Score
except banks K and M whose Z-Score values recorded -1.51 and -0.80 for the year 2005
respectively indicating a high risk of failure for the banks. This pattern was sustained for the
period under review. In 2005, the current liability for bank K was 83% of its current assets. In
2006, it rose to 86%. It recorded 83% in 2007 and rose again to 108% in 2008. For bank M, a
total of about #155bn of depositors fund had been used by the management of the bank to
buy the Bank‟s own shares in 2008, thereby aggravating the liquidity problems of the Bank.
Despite the fact that the Bank paid huge interest on such deposits, no income was earned
from the investment. Also, about 80% of the total risk assets of the bank were expired and
non – performing as at the time Central Bank of Nigerian intervened. In addition, these
credits had very weak or no collateral to aid recovery.
Bank K had a huge portfolio of non – performing loans, which had been either masqueraded
as Contingent Liabilities or fictitious credits passed into the accounts to make them
performing. This had led to under- provisioning by the Bank, contrary to prudential
guidelines resulting in regulatory infractions for inadequate disclosure of financial
information. The impact of recall of funds prematurely by foreign creditors led to severe
liquidity strain, resulting in the Bank approaching the Central Bank of Nigeria (Sanusi, 2009).
Discount Window to support Corporate Governance broke down and there was a sharp crisis
within the management circle of the bank. The retained earnings were incredibly low and the
gearing ratio was abnormally high. Even the profits they claimed were fictitious which could
not be traced to the values of physical tangible assets available for the banks in terms of the
quantity they disclosed.
International Journal of Accounting and Financial Reporting
ISSN 2162-3082
2016, Vol. 6, No. 2
89
Table 2: Summary Statistics of Tafler Z-Score Failure Prediction Model of Nigerian Banks.
YEAR
BANK 2005 2006 2007 2008 2009 2010 2011 2012
A 0.45 1.56 0.73 1.32 1.06 1.25 2.0 2.85
B 1.04 1.69 0.74 0.38 1.69 1.43 1.0 1.04
C 0.31 0.56 1.22 0.32 0.95 0.56 1.27 2.0
D 0.97 0.75 1.49 1.87 0.82 0.82 1.15 1.48
E 1.79 2.19 2.42 2.35 2.05 1.93 2.46 2.16
F 2.73 1.26 2.39 2.33 3.38 3.67 3.46 3.6
G 1.89 2.2 1.28 1.5 2.37 2.1 3.68 3.7
H 0.71 0.31 0.23 0.82 0.52 1.62 0.21 1.89
I 0.11 0.75 1.43 0.74 1.05 1.16 1.05 1.56
J 2.81 2.58 2.39 2.72 2.98 2.95 2.78 2.63
K -1.51 -0.35 -1.61 -3.43 -3.14 -4.4 -2.78 -0.39
L 2.08 1.92 1.35 1.22 1.57 1.62 1.54 1.52
M -0.8 -1.24 -2.62 -0.08 -1.67 -0.43 -2.66 -2.52
N 3.11 1.66 2.42 3.51 2.41 1.69 1.32 1.66
The table shows the summary statistics of Tafler Z-score failure prediction for
fourteen Nigerian commercial banks from 2005 – 2012. Seven of them were
strong, two were already susceptible to failure while five (5) were weak, sick
and unhealthy during the period.
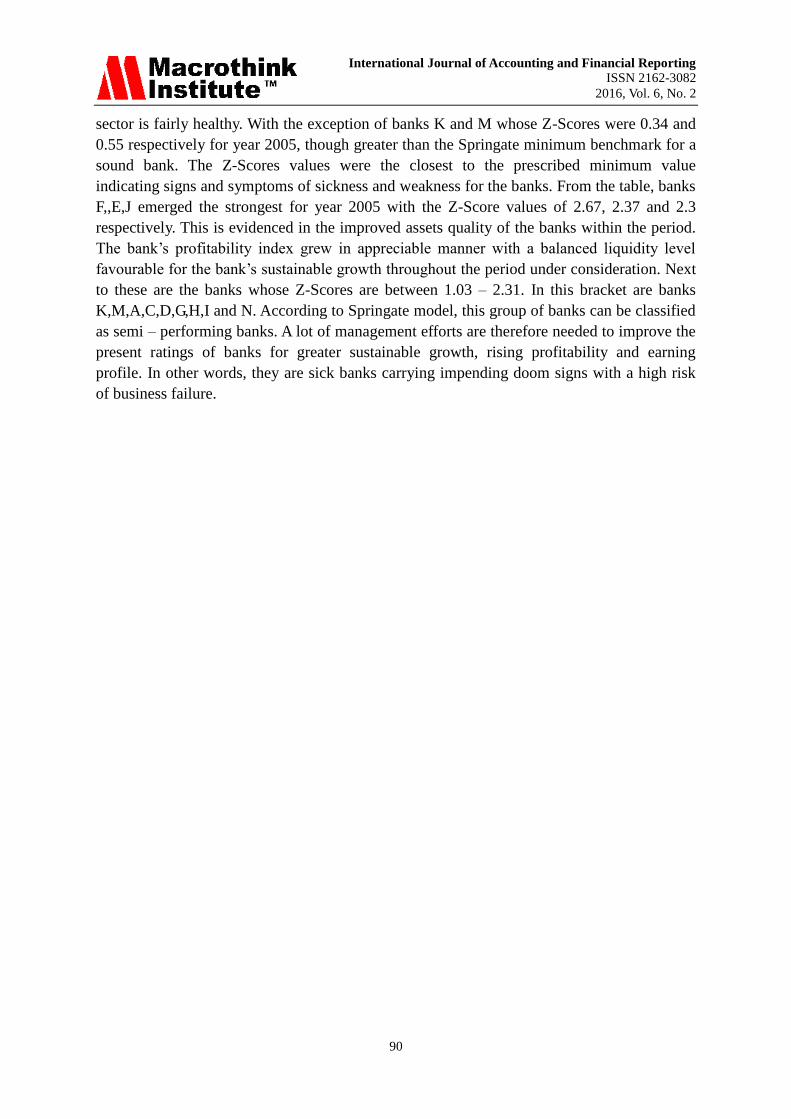
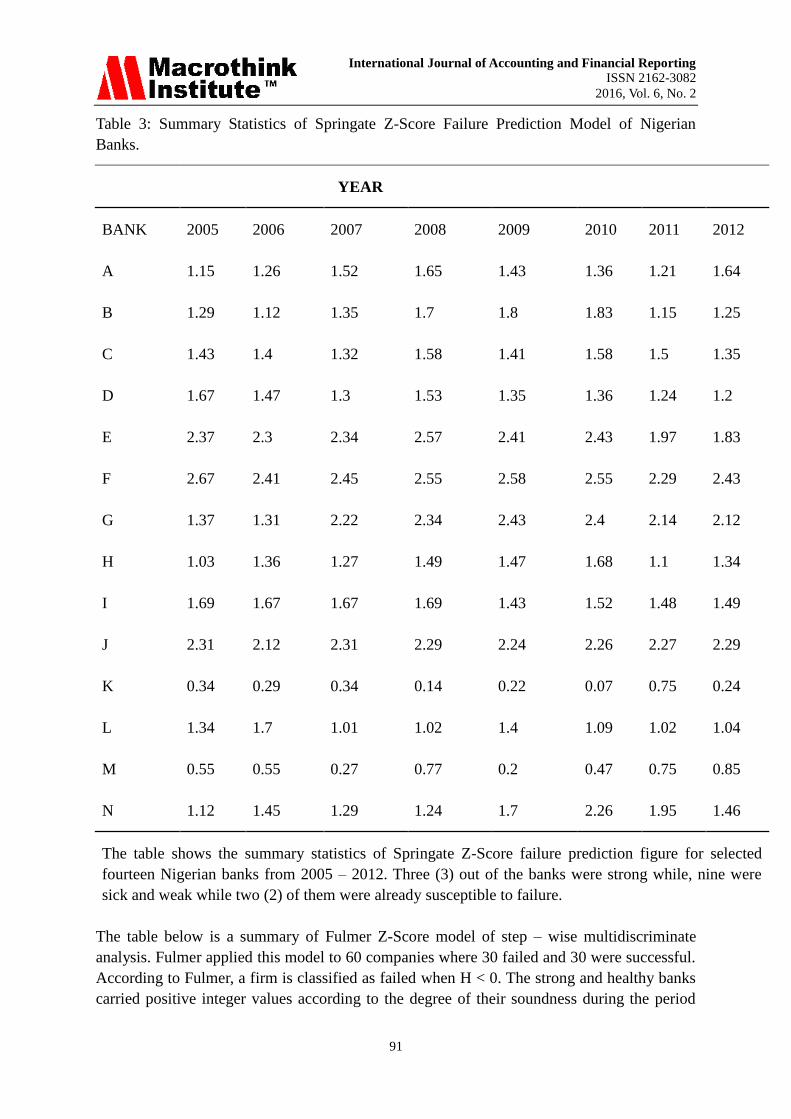
The springate business failure prediction model was also employed to the sampled bank data
during the period of the study. According to Springate, a firm is classified as failed, when Z <
0.0862. Table 3 below shows the Z – Scores for the fourteen sampled banks under review.
The Z – Scores values are recorded in the positive. The implication of this is that the banking
International Journal of Accounting and Financial Reporting
ISSN 2162-3082
2016, Vol. 6, No. 2
90
sector is fairly healthy. With the exception of banks K and M whose Z-Scores were 0.34 and
0.55 respectively for year 2005, though greater than the Springate minimum benchmark for a
sound bank. The Z-Scores values were the closest to the prescribed minimum value
indicating signs and symptoms of sickness and weakness for the banks. From the table, banks
F,,E,J emerged the strongest for year 2005 with the Z-Score values of 2.67, 2.37 and 2.3
respectively. This is evidenced in the improved assets quality of the banks within the period.
The bank‟s profitability index grew in appreciable manner with a balanced liquidity level
favourable for the bank‟s sustainable growth throughout the period under consideration. Next
to these are the banks whose Z-Scores are between 1.03 – 2.31. In this bracket are banks
K,M,A,C,D,G,H,I and N. According to Springate model, this group of banks can be classified
as semi – performing banks. A lot of management efforts are therefore needed to improve the
present ratings of banks for greater sustainable growth, rising profitability and earning
profile. In other words, they are sick banks carrying impending doom signs with a high risk
of business failure.
International Journal of Accounting and Financial Reporting
ISSN 2162-3082
2016, Vol. 6, No. 2
91
Table 3: Summary Statistics of Springate Z-Score Failure Prediction Model of Nigerian
Banks.
YEAR
BANK 2005 2006 2007 2008 2009 2010 2011 2012
A 1.15 1.26 1.52 1.65 1.43 1.36 1.21 1.64
B 1.29 1.12 1.35 1.7 1.8 1.83 1.15 1.25
C 1.43 1.4 1.32 1.58 1.41 1.58 1.5 1.35
D 1.67 1.47 1.3 1.53 1.35 1.36 1.24 1.2
E 2.37 2.3 2.34 2.57 2.41 2.43 1.97 1.83
F 2.67 2.41 2.45 2.55 2.58 2.55 2.29 2.43
G 1.37 1.31 2.22 2.34 2.43 2.4 2.14 2.12
H 1.03 1.36 1.27 1.49 1.47 1.68 1.1 1.34
I 1.69 1.67 1.67 1.69 1.43 1.52 1.48 1.49
J 2.31 2.12 2.31 2.29 2.24 2.26 2.27 2.29
K 0.34 0.29 0.34 0.14 0.22 0.07 0.75 0.24
L 1.34 1.7 1.01 1.02 1.4 1.09 1.02 1.04
M 0.55 0.55 0.27 0.77 0.2 0.47 0.75 0.85
N 1.12 1.45 1.29 1.24 1.7 2.26 1.95 1.46
The table shows the summary statistics of Springate Z-Score failure prediction figure for selected
fourteen Nigerian banks from 2005 – 2012. Three (3) out of the banks were strong while, nine were
sick and weak while two (2) of them were already susceptible to failure.
The table below is a summary of Fulmer Z-Score model of step – wise multidiscriminate
analysis. Fulmer applied this model to 60 companies where 30 failed and 30 were successful.
According to Fulmer, a firm is classified as failed when H < 0. The strong and healthy banks
carried positive integer values according to the degree of their soundness during the period
International Journal of Accounting and Financial Reporting
ISSN 2162-3082
2016, Vol. 6, No. 2
92
under study.
Evident in this group are banks E, F, G, J, A, C and N. The banks witnessed consistent
growth in earnings while a good number measures in managing costs were introduced with
the attendant reduction in average cost per unit of earnings. The period under review was a
challenging one for operators in the banking industry .Despite these challenges, banks in this
group were able to rise above the storm and waxed strong at handling the Nigerian financial
scene. The financial performance has shown a positive and upward trend for the period.
Their gross earnings grew by 45.6% on average during the period under review. This was
achieved largely through increased lending activities and operations within the country and
beyond. The Average Net Interest Margin (MIN) ratio defined as the ratio of Net Interest
Income (i.e. Interest Income Less Interest Expense) to average interest earning assets
improved over the levels attained before the period of study. This affirms the strength and
quality of banks core business. The operating income came up strong, with an average of
45% growth in the period, reflecting their revenue generating capacity from underlying
operations. This is mainly resulting from the increase in earning assets and the protection of
their interest margins in the face of intense market pressures. Though, they witnessed a sharp
drop on the average on their Profit Before Tax (PBT) which expectedly brought low the
Earning Per Share (EPS) at N0.10 on the average and a slight drop in the size of their balance
sheets by 2.3% for the period. There was a slip in deposits for some of the banks in this
group resulted from the banks‟ decisions to act back on costly deposits as interest rates came
under pressure during the period. Their gross loans and advances increased by 44% on
average.
This was achieved by carefully selecting highly rated obligors within the key sectors of the
economy in which they operate by some of the banks within this group. By this loan
portfolio growth, the banks achieved a loan to deposit ratio of 51.7% on average as against
average of 33% in the years prior to the period under review.
The Capital Adequacy Ratio (CAR) was recorded at 16.3% average for the period which is
6.3% above the regulatory minimum of 10%. This was attributable mainly to growth in their
risk weighted assets as there was an increase in loan portfolio as well as long term
investment. The banks were the industry leaders in the e-channel business, continuing to
apply cutting-edge technology platforms to enhance efficient service delivery. The number of
active ATMs, million of credit and debit cards and point-of-sale (POS) terminals for each of
the bank in this group are eloquent testimonies to their leadership in the use of electronic
platforms as service differentiators.

International Journal of Accounting and Financial Reporting
ISSN 2162-3082
2016, Vol. 6, No. 2
93
Table 4: Summary Statistics of Fulmer Z-Score Failure Prediction Model of Nigerian Banks
YEAR
BANK 2005 2006 2007 2008 2009 2010 2011 2012
A 1.38 1.26 1.68 0.76 1.15 1.1 0.91 0.33
B 0.85 0.79 0.91 1.5 0.84 0.94 0.2 0.24
C 1.09 0.97 0.73 0.95 1.22 1.09 1.05 1.46
D 0.66 0.27 0.4 1.39 0.94 1.43 1.63 0.2
E 2.95 2.01 2.68 1.67 2.66 2.02 2.18 2.36
F 2.25 2.74 1.13 1.62 2.08 2.44 2.01 2.19
G 1.81 1.65 1.58 1.87 2.35 1.94 1.72 1.65
H 0.41 0.29 0.47 0.85 1.5 1.51 1.45 1.37
I 0.24 0.23 0.28 0.35 0.35 0.5 0.5 0.51
J 1.53 1.85 2.77 1.22 1.65 1.23 2.7 2.62
K 0.09 0.08 0.01 0.03 0.04 0.09 0.79 0.093
L 0.54 0.73 0.75 0.79 0.94 1.33 1.26 1.2
M 0.05 0.01 0.033 0.09 0.09 0.06 0.06 0.05
N 0.86 1.32 1.98 2.76 2.32 2.62 2.78 2.83
The table shows the summary statistics of Fulmer Z-Score failure prediction of selected Nigerian banks
from 2005 – 2012.from the table, seven (7) of banks were strong, while seven (7) were sick.
During the period under review, many of the sampled banks were characterized with rising
liabilities both current and long-term and falling assets values which are precipitations of
serious financial weakness and early signs of business failure. The profile of the book value
of debts for the banks was rising compared with the equity value employed during the period
which means that much pressure was exerted on the banks for the payment of fixed interest
charges and the banks were financing fixed assets through debt financing. Banks in this

International Journal of Accounting and Financial Reporting
ISSN 2162-3082
2016, Vol. 6, No. 2
94
group are B, D, H, I, K, L and M. The period under review was one of the most difficult time
for the industry. The contagion effect of the financial crisis, which started in the developed
economies in the second half of 2007 spread steadily and enveloped developing economies in
2008. In Nigeria, 2009 saw the near collapse of the capital market, therefore marking the
most severe phase of the crisis. The near collapse of the capital market triggered a sudden
and significant deterioration across industry sectors with the banking sector being severely
traumatized. Financial services came under extreme stress, with acute shortage of liquidity,
sharp reductions in interbank lending, and further pressure on the credit market. Equity
markets experienced heavy falls and extreme volatility. These extraordinary conditions
severely impacted deposit money banks. The Central bank of Nigeria maintained a tight
monetary policy stance throughout the period under review with the aim of keeping
inflationary pressures in check and protecting the Naira currency from external economic
factors. As a result, the Apex bank raised key monetary policy tools several times within the
period to manage money supply amidst increases government spending. Bench Mark Policy
Rate was increased from 6.25% in January 2010 to 12% by October 2011 while the Cash
Reserve Ratio was reviewed upward from 4% to 8%. The firm control of monetary supply
enabled the Government maintain an average headline inflation of 10.9% during the review
period. Peculiar characteristics to these sick banks are falling profitability profile, dwindling
revenues, rising running costs, overtrading and fictitious net profits declaration. The gains in
their earnings and various cost-containment strategies were largely wiped out by one-off
impairment charges on assets culminating after-tax loss of several billions of Naira. Many of
these sick banks began to manifest signs of impending doom ranging from under-
capitalisation, cash flows problems and overtrading. Many of them opened hundreds of
business offices besides maintaining a presence in the West African sub-region which are
heavily depended on their Headquarters in order to keep afloat.
By the middle of 2007, earnings, profitability and Returns On Asset (ROM) and Returns On
Equity began to decline. This decline in profitability indices were attributed to the increase in
shareholders‟ funds that were used for information technology (IT) and other facilities such as
opening new branches to ensure competitive edge over other banks. Some of them engaged
in sharp practices such as creative accounting, converting non-performing loans into
commercial papers, setting-off balance sheet to hide losses, reducing running costs to shoot
up net profits, colluding with other banks in the industry to enhance financial positions
thereby eroding the sentiment generally held by the public in the industry after the
capitalization exercise of a strong and healthy banking sector. There were cases of non-
adaptability by some of the sick banks to meet their customer needs, failure to carry out
decent market research to improve services. The non-performing loans profile was in the
increase, with some of the loan defaulters traced to the banks‟ directors. Some loans were
secured without collateral securities. Some of the banks diversified into new unknown areas
without a clue about costs with the directors spending too much money on frivolous purposes
thereby using up the bank capital on elephant projects.
The Cash Reserve Ratio was grossly below the minimum thereby triggered up the fear
amongst their customers of the possibility of the bank collapse. Failure to adequately

International Journal of Accounting and Financial Reporting
ISSN 2162-3082
2016, Vol. 6, No. 2
95
anticipate cash flow coupled with the banks inability to react promptly to competition,
technology, and other changes in the market place spelt doom for these sick banks. Many of
them were deeply involved in over generalization – trying to do everything for everyone,
stretching themselves too thin and thereby diminish quality. There were deteriorating cash
holdings, current and quick ratios, which resulted into inability of some of them to meet
obligations when they fall due. There were corporate governance malpractices within the
banks which became a conduit pipes for the bank directors employed to siphon depositors‟
fund, obtaining un-secured loans at the expense of depositors‟ and banks‟ due process. The
audit process of the bank was weak, and unable to install the needed aggressive provisioning
against risk assets. There were insider abuses, in several of the banks whereby the Chief
Executive Officers of the banks hid under the Special Purpose Vehicles to lend money to
themselves in order to manipulate the stock price and acquire estates for their cronies.
Depositors‟ money was used by some of the banks‟ executives to purchase private jets which
were later discovered registered in the name of their spouses and sons. These sick banks
made available to the public information on their operations on selective basis, misleading the
investors to make informed decisions on the quality of bank earnings, the strength of their
balance sheets and the risks in their businesses. The Apex bank also failed in its control to
enforce the data quality in banks to guarantee accurate reporting. Therefore, the internal
reporting of the CBN could not serve as an effective warning system for bank surveillance
(Sanusi, 2009). There were sharp declines in their capital ratios which resulted in rapid
increase in risk–weighted assets, a redemption of subordinated loans, overall losses in the
bank operations and adverse exchange rate movements evident in a currency mismatch
between risk–weighted assets and regulatory capital. There were reported asset quality
problems occasioned partly by poor loan management, poor credit underwriting standards
within the banks. The public and market knowledge of these weaknesses and banks‟ poor
performance on asset quality affected the confidence in the banks, leading to uncontrollable
deposit withdrawal and increased in the cost of funding. The banks‟ earnings began to
dwindle as a result of unprofitable investments in new activities and branches, subsidiaries or
overseas operations, insufficient diversification and unsustainable income streams,
unreliability of non–core income items, poor cost controls and increased competition in core
activities, leading to net interest margin comprehension. Their risk management processes
were grossly inadequate for the size and nature of the activities of the banks and their risk
profiles. The banks market risks were high.
The various banks‟ management could not establish prudent risk limits in relations to its
financial strength and risk management capabilities. Many of them could not adapt to the
technological changes and innovation in the emerging markets. Few of these sick banks that
managed to adapt to technologies changes in the half way, witnessed incessant breakdowns of
IT system which greatly led to large losses and a loss of public confidence in the bank
services.
International Journal of Accounting and Financial Reporting
ISSN 2162-3082
2016, Vol. 6, No. 2
96
5. Findings and Policy Recommendation
The results of the various multidiscriminate failure models show that some of the Nigerian
banks were “pathologically” sick during the period covered by the research, manifesting
signs and symptoms of weak banks. In this manner: firstly, there were cases of poor lending
practices within these banks such as poor underwriting skills and aggressive loans expansion
programme coupled with an absence of incentives to identify problem loans at an early stage
and take corrective actions. Secondly, some of the banks management overrode existing
policies and procedures such as limits on concentration or connected lending. There were
cases where some directors within the banks, by force of personality or dominant ownership
or executive position overrode policies and procedures to secure facilities without adequate
collateral securities. Thirdly, there were excessive loan concentrations whereby lending was
towards one geographic or industrial sector. That is, the banks cannot maintain a diversified
loan portfolio.
Fourthly, some of the sick banks experienced sharp declines in their capital ratios with a rapid
increase in risk weighted assets, overall losses in the banks‟ operations.
Fifthly, there were problems loan crisis within the sick banks which indicate banks poor
credit underwriting standards.
Sixthly, the poor performance on the sick banks quality affected the public confidence in the
bank, leading to panic deposit withdrawal by the depositors.
Seventhly, there were cash flow problems within the banks coupled with the banks inability
to react promptly to competition, technology and other changes in the market place.
Eighthly, the risk management processes for the sick banks were inadequate for the size and
nature of the activities of the banks and their risk profile. The various banks‟ management
could not establish prudent risk limits in relation to its financial strength and risk
management capabilities.
Ninthly, the non-performing loan profile of the banks was so high with some of the directors
prominent in the list of the loan defaulters. Unless a bank maintains of a diversified loan
portfolio, it is always exposed to the risk of that loans to any particular area, or related group
of companies, could become impaired at the same time. Strong individuals within the banks,
by force of personality, dominant ownership or executive position, overrode the due
diligence, enshrined policies and procedures got away with it. Cases of fraud, criminal
activities and self-dealings by directors of the banks were in the superlatives.
The risk-management within the banks was poor. The inability of the banks to manage their
interest rate risk, market risk, operational risk and strategic risk snowballed into acute
challenges for the banks. The management of operational risks in some of the banks came
into greater focus as the banks made use of sophisticated systems, new delivery channels and
outsourcing arrangements that increased the banks‟ undue reliance and exposure to third
parties.
International Journal of Accounting and Financial Reporting
ISSN 2162-3082
2016, Vol. 6, No. 2
97
6. Conclusion
In this paper, we have investigated the signs and symptoms of the Nigerian commercial
banks. The study employed Multidiscriminate failure models to obtain the parameters of the
sick banks on the data extracted from the Audited Annual Reports and Accounts for the
relevant periods. We covered the period of turbulent global financial crisis to which Nigerian
banks were not immune. The study showed that many Nigerian commercial banks were sick
during the period. It also showed that many of the banks manifested clear signs and
symptoms of weak and sick banks as against the sound and strong banks‟ slogan that the
Apex bank made available to the stakeholders and the general public at large.
The major limitation of the study is the inability to incorporate all the commercial banks
operating in Nigeria during the period due to data limitations, absence of reliable and
complete database by the Nigerian Stock Exchange and the unresolved merger talks going on
among some of the banks during the period. These limitations however, do not in any way
affect the validity of our findings.
The future research agenda on the investigation of signs and symptoms of the sick banks in
Nigeria by the use of different economic and statistical methods and different coverage period
will surely give added value on this area. The non–financial sector of the economy is another
grey area that can be included in the future research.
References
Abdullah, N. Halim; A, Ahmaditt and Rus, R. (2008).Predicting Corporate Failure of
Malaysia‟s Listed Companies: Comparing Multiplediscriminant Analysis, Logistic
Regression and the Hazard Model; International Research Journal of Finance and
Economics, 15: 193 – 209.
Altman, E.I. (1968). Financial Ratios, Discriminate Analysis and the Prediction of Corporate
Bankruptcy. Journal of Finance, 23(4): 589 – 609.
Anvarkhatibi, S.R, Mohammad, I. and J. Mohammadi, (2013) Investigation of the Effect of
the Value Added, Earning Quality and Leverage Ratios in Bankruptcy in Organisation
Accepted in Tehrian Stock Market. Journal of Natural and Social Sciences, 2(2): 223 – 229.
Argenti, J. (1976) Corporate Collapse: The Causes and Symptoms. McGraw Hill.
Bakhsnani, S. (2013). Bankruptcy Prediction of Appliances Companies Listed in Teheram
Stock Exchange Using Proportional Hazards Regression; Interdisciplinary Journal of
Contemporary Research in Business, 5(2): 327 – 339.
Beaver, W.H. (1966). Financial Ratios as Predictors of Failure: Journal of Accounting
Research (Supplement), 4(5): 71 – 111.
Ezzamel, M. Brodie, T., Mar – Molinero, C. (1987) Financial Patterns of UK Manufacturing
Companies, Journal of Business, Finance and Accounting.
International Journal of Accounting and Financial Reporting
ISSN 2162-3082
2016, Vol. 6, No. 2
98
Foster, B.P. and Zurada, J. (2013). Loan Defaults and Hazard Models for Bankruptcy
Prediction: Managerial Accounting Journal, 28(6): 516 – 541.
Frjorek, K. and Grotowsk, M. (2012) “Bankruptcy Predictions: Some Results from Large
Sample Polish Companies: International Business Research , 9(5): 70 – 77.
Haddad, F.S. (2012). The Relationship between Economic Value Added and Stock Returns:
Evidence from Jordanian Banks. International Research Journal of Finance and Economics,
89: 6 – 15.
Ismail, I. (2011) Company Performance in Malaysia After the 1997 Economic Crisis: Using
Economic Value Added (EVA) as a Predictor. African Journal of Business management, 5(7):
3012 – 3018.
Karami, G., Hoseni, S.M.S., Attaran, N. and Hosseni S.M.M. (2012) “Bankruptcy Prediction
Using Memotic Algorithm with Fazzy Approach: Empirical Evidence from Iran,
International Journal of Economics and Finance, 4(5): 116 – 133.
Korobow, Leon and David Stuhr (1985). Performance Measurement of Early Warning
Models, Journal of Banking and Finance, 9(2): 267 -273.
Lee, S. and Choi, W.S. (2013) “A Multi-Industry Bankruptcy Prediction Model Using Back –
Propagation Neutral Network and Multivariate Discriminant Analysis; Expert Systems with
Applications, 40: 2941 – 2946.
Marais, I., Patell, J.M., and Wolfson, M.A. (1984) “The Experimental Design of
Classification Models. An Application of Recursive Partitioning and Bootstrapping to
Commercial Bank Loan Classifications; Journal of Accounting Research, 22: 87 – 114.
Martin, D. (1977). Early Warning of Bank Failure: A Logic Regression Approach, Journal of
Banking and Finance 1(1): 249 – 276.
Matviychuk, A. (2010) “Bankruptcy in Transformational Economy: Discrimination and
Fuzzy Logic Approach; fuzzy Economic Review, 15(1): 21 – 28.
Mayer, P.A. and N.W. Pifer (1970).Prediction of Bank Failures.Journal of Finance, 22(2):
853 – 868.
Morris, R. (1997). Early Warning Indicators of Corporate Failure (Aldershot, England:
Ashgate Publishing Ltd.).
Mueller, G.H., Steyn-Bruwer, B.W. and Hamman, W.D. (2009) “Predicting Financial Distress
of Companies Listed on the JSE – A Comparison of Techniques, South African Journal of
Business Management, 40(1): 21 – 32.
Odom, M.D. and R. Sharda (1990). A Neutral Network Model for Bankruptcy Prediction,
Proceedings of the International Joint Conference on Neutral Networks 11: 163 – 167.
Ohlson, J.A. (1980). Financial Ratios and the Probabilities Prediction of Bankruptcy, Journal
of Accounting Research (Spring) 1(1): 109 – 131.

International Journal of Accounting and Financial Reporting
ISSN 2162-3082
2016, Vol. 6, No. 2
99
Parvaei, A., and S. Farhadi (2013) The Ability of Explaining and Predicting of Economic
Value Added (EVA) Version Net Income (NI), Residual Income (RI) and Free Cash Flow
(FCF) in Tehran Stock – Exchange (TSE), International Journal of Economics and Finance,
5(2): 67 – 78.
Pasarribu, R.B. (2008) Financial Distress Prediction in Indonesia Stock Exchange Case Study
of Trade Industry Public Company. Journal of Economics Business and Accounting: 11(2):
153 – 172.
Rappaport, A., (1995) Creating Shareholder Value: The New Standard for Business
Performance. New York: The Free Press.
Sharma, A.K. and S. Kumar (2010) Economic Value Added (EVA) – Literature Review and
Relevant Issues. International Journal of Economics and Finance, 2(2): 200 – 220.
Sharma, A.K., and S. Kumar, (2010) Economic Value Added (EVA) – Literature Review and
Relevant Issues; International Journal of Economics and Finance, 2(2): 200 – 220.
Taffler, R.J. (1983). The Assessment of Company Solvency and Performance Using a
Statistical Model. A Comparative UK – Based Study. Accounting & Business Research, vol.
2(1):15 – 25.
Taffler, R.J. and Tishaw, H. (1977). Going, Going, Gone: Four Factors, which Predict.
Accountancy, Vol. 1(1): 58 – 102.
Timo, S. and I. Virtanen (2001) Economic Value Added: A Simulation Analysis of the Trendy,
Onwer-Orented Management Tool, ActaWasaensia, No. 90.
West, R.K. (1985). A Factor Analytic Approach to Bank Condition, Journal of Banking and
Finance, 9(2): 253 – 266.
Zhu, X., (2012) Internal Factors Associated with Business Failures of Public Companies in
China from a Financial Analytical Perspective, International Journal of Business and Social
Science, 3(9): 49 – 59.
Zie, C., C. Luo and X, Yu (2011) Financial Distress Prediction Based on SVM and MDA
methods. The case of Chinese Listed Companies, Quality, Quantity, 45(3): 671 – 686.
International Journal of Accounting and Financial Reporting
ISSN 2162-3082
2016, Vol. 6, No. 2
100
Biography of the Authors
Philip Olawale Odewole
Philip Olawale Odewole, an accountant and Associate Chartered Accountant holds Master of
Science in Accounting from Obafemi Awolowo University,Nigeria. A Ph.D research student
of Accounting at Department of Management and Accounting, Obafemi awolowo University.
He teaches and conducts research in the areas of Banking, Accounting and Finance. He can
be contacted at Phone: 08033710552, Email: [email protected]
Rafiu Oyesola Salawu
Rafiu Oyesola Salawu, an economist and Fellow Chartered Accountant holds Doctor of
Philosophy degree in Management and Accounting from Obafemi Awolowo University,
Nigeria. He is a Professor of Accounting and Fina nce at ObafemiAwolowo University. He
teaches and conducts research in the area of accounting and finance. He can be contacted at
Phone:0803 3795 887 Email: [email protected]
Copyright Disclaimer
Copyright for this article is retained by the author(s), with first publication rights granted to
the journal.
This is an open-access article distributed under the terms and conditions of the Creative
Commons Attribution license (http://creativecommons.org/licenses/by/3.0/).