Embed Size (px)
Citation preview

K.7
The Anatomy of Financial Vulnerabilities and Crises Lee, Seung Jung, Kelly E. Posenau, and Viktors Stebunovs
International Finance Discussion Papers Board of Governors of the Federal Reserve System
Number 1191 February 2017
Please cite paper as: Lee, Seung Jung, Kelly E. Posenau, and Viktors Stebunovs (2017). The Anatomy of Financial Vulnerabilities and Crises. International Finance Discussion Papers 1191. https://doi.org/10.17016/IFDP.2017.1191

Board of Governors of the Federal Reserve System
International Finance Discussion Papers
Number 1191
February 2017
The Anatomy of Financial Vulnerabilities and Crises
Seung Jung Lee
Kelly E. Posenau
Viktors Stebunovs
NOTE: International Finance and Discussion Papers are preliminary materials circulatedto stimulate discussion and critical comment. References in publications to InternationalFinance Discussion Papers (other than an acknowledgment that the writer has had access tounpublished material) should be cleared with the author or authors. Recent IDFPs are avail-able on the Web at www.federalreserve.gov/pubs/ifdp/. This paper can be downloadedwithout charge from Social Science Research Network electronic library at www.ssrn.com.
The Anatomy of Financial Vulnerabilities and Crises
February, 2017
Seung Jung Lee†
Kelly E. Posenau#
Viktors Stebunovs‡
Abstract: We extend the framework used in Aikman, Kiley, Lee, Palumbo, and Waru-sawitharana (2015) that maps vulnerabilities in the U.S. financial system to a broader setof advanced and emerging economies. Our extension tracks a broader set of vulnerabilitiesand, therefore, captures signs of different types of crises. The typical anatomy of the evo-lution of vulnerabilities before and after a financial crisis is as follows. Pressures in assetvaluations materialize, and a build-up of imbalances in the external, financial, and nonfinan-cial sectors follows. A financial crisis is typically followed by a build-up of sovereign debtimbalances as the government tries to deal with the consequences of the crisis. Our earlywarnings indicators which aggregate these vulnerabilities predict banking crises better thanthe Credit-to-GDP gap at long horizons. Our indicators also predict the severity of bank-ing crises and the duration of recessions, as they take into account possible spill-over andamplification channels of financial stress from one sector to another in the economy. Ourindicators are of relevance for macroprudential and crisis management, in part, because theyperform better than the Credit-to-GDP gap and do not suffer from the gap’s econometricflaws.
Keywords: credit-to-GDP gap; crisis management; financial vulnerabilities; early warningsystem; financial crises; banking crises; currency crises; macroprudential policy.
JEL Classifications: C82, D14, G01, G12, G21, G23, G32, H63.
† Board of Governors of the Federal Reserve System, 20th Street and Constitution Avenue, NW, Wash-ington, DC 20551, U.S.A.; [email protected]. URL: http://www.federalreserve.gov/econresdata/
seung-jung-lee.htm.# The University of Chicago Booth School of Business, 5807 South Woodlawn Ave., Chicago, IL 60637,U.S.A.; [email protected].‡ Board of Governors of the Federal Reserve System, 20th Street and Constitution Avenue, NW, Washing-ton, DC 20551, U.S.A.; [email protected]. URL: http://www.federalreserve.gov/econresdata/viktors-stebunovs.htm.We thank Sarah Adler for excellent research assistance. We also thank John Ammer, Mark Carey, JohnClark, Stijn Claessens, Ricardo Correa, Christopher Erceg, Ruth Judson, Steven Kamin, Pavel Kapinos, He-len Popper, Tara Rice, Minh Tam (Tammy) Schlosky, Pierre Siklos, and other participants at presentationsat the Federal Reserve Board, the U.S. Department of Treasury, the IFABS 2016 Barcelona Conference, the2016 IBEFA Summer Meetings, the 2016 CEMLA Regional Conference, the 2016 Federal Reserve SystemSurveillance Conference, the 2016 Southern Finance Association Meetings, the 2016 Southern EconomicsAssociation Meetings, and the 2017 American Economic Association Annual Meetings for helpful comments.We are also grateful to Daniel Beltran, Carol Bertaut, Brett Berger, Jerome Brezillon, Brahmia Coulibaly,Bernado Morais, and Paul Wood for assisting us with various cross-country datasets, and Beth Anne Wilsonwith sharing data on recessions. The views in this paper are solely the responsibility of the authors andshould not be interpreted as reflecting the views of the Board of Governors of the Federal Reserve Systemor of any other person associated with the Federal Reserve System. All errors are our own.

1 Introduction
In this paper, we examine how various financial vulnerabilities evolve in the lead-up to
different types of financial crises, while providing a holistic framework to track financial
imbalances that may render the financial system highly vulnerable to shocks to the economy.
The financial crisis that began in the United States and the United Kingdom in 2007, which
quickly spread to other financial systems around the world, has profoundly changed the
global financial regulatory landscape. Not only have large strands of academic literature
(related to financial imbalances, financial crises, and systemic risk) been revived or newly
created, but central banks and other official institutions, have established many types of
tools to track and monitor financial stability risk.1 Our paper is one of the many attempts
to better align the developments in monitoring tools of public institutions worldwide to the
advancements in the financial stability literature within the past decade.
We posit a view that the advent of a financial crisis can be decomposed into a financial
vulnerability or imbalances component and a shock component (as in Gorton and Ordonez
(2014)). Understanding how much financial vulnerabilities and imbalances matter in the
run-up to a financial crisis provides a framework to better understand the role the shock
component plays in the realization of a financial crisis. Building upon research on how
different types of vulnerabilities in the financial system have set the stage for a dramatic
unraveling of financial imbalances (Ferguson, Hartmann, Panetta, and Portes (2007) and
Reinhart and Rogoff (2009)), we categorize different vulnerabilities that may contribute to
the amplification of economic and financial shocks stemming from five sectors in a finan-
cial system. The first is the financial sector, which includes banks and nonbanks, where
excessive leverage, maturity transformation, reliance on short-term wholesale funding, and
cross-border interconnectedness all played a role in the recent financial crisis and its conta-
gion. The second is the private-nonfinancial sector, where either households or nonfinancial
businesses may accumulate excessive debt, which, in the past, has rendered the entire real
1For example, the Office of Financial Research and the International Monetary Fund publishes the Finan-cial Stability Report and the Global Financial Stability Report, respectively, on a regular basis. In addition,the European Systemic Risk Board also maintains a “Risk Dashboard,” which is a set of quantitative andqualitative indicators of systemic risk in the EU financial system
1
economy susceptible to severe adverse financial shocks. The third is the sovereign sector,
where the government’s strained budget and debt positions has led to sovereign debt crises in
mostly developing economies. The fourth is the external sector, where excessive borrowing
from abroad has sometimes led to both currency and sovereign crises in times of a loss of
confidence from foreign investors. Finally, the fifth category of financial vulnerabilities lie
in asset markets where investors’ risk appetite (and, hence, asset-valuation pressures) have
led to the overvaluation of various asset prices (in the housing market, the equity market,
and the bond market) that have brought on a quick correction in prices or a destabilizing
unraveling of financial imbalances.
This holistic view of financial vulnerabilities allows us to track and determine which com-
binations of financial imbalances are particularly egregious in terms of financial stability risk
leading up to different types of financial crisis episodes identified by Laeven and Valencia
(2013). We extend the main framework in Aikman, Kiley, Lee, Palumbo, and Warusaw-
itharana (2015) used specifically for the United States to a broader set of countries around
the world. In order to account for vulnerabilities that were not accounted for in the United
States, we also augment the categories of vulnerabilities to include imbalances stemming
from excessive sovereign and external debt accumulation. This extension and augmenta-
tion allows us to compare different types of crisis episodes at varying time periods to see
whether patterns emerge regarding the sequence of events or combinations of imbalances in
the lead-up to financial crises.
We find that vulnerabilities in the financial sector and external borrowing are especially
elevated even two years prior to a banking or currency crisis. As an earlier warning indicator,
imbalances in asset valuations tend to peak a couple of years before financial crises and
corrections to valuations are well under way even before the crises occur. External and
financial sector vulnerabilities also become elevated well before and peak around the onset
of financial crises. Nonfinancial sector vulnerabilities also become elevated nearing the onset
of crises. In our sample of 26 (mostly advanced) non-U.S. countries that have gone through
a financial crisis in the past 30 years (1986-2015), sovereign vulnerabilities have played a
minimal role prior to financial crises. However, the level of sovereign vulnerabilities usually
2

become elevated as governments try to deal with the crisis through an increase in sovereign
debt after the crises.
We show that an index (the Lee-Posenau-Stebunovs (LPS) Index) from aggregating the
vulnerabilities, whether we include or exclude sovereign vulnerabilities, is able to predict
financial crisis reasonably well. Aggregating our vulnerability measures to the country level
allows us to compare how a bottom-up approach compares to other types of top-down aggre-
gate measures, such as the credit-to-GDP gap. We show that at the far end of the forecast
horizon (two to three years prior to banking crises), the LPS indexes performs better than the
credit-to-GDP gap. In addition, we show that an aggregated index can be a good indicator
for forecasting the severity of banking crises as the aggregation takes into account possible
spill-over and amplification channels of financial stress to other sectors in the economy by
taking into account multiple vulnerabilities and imbalances in the entire financial system.
Finally, we also investigate how the indexes are associated with both the onset and
severity of recessions based on an expanded number of countries. We find that financial
vulnerabilities are not as useful in predicting the onset or severity of recessions. However,
financial vulnerabilities appear to be positively correlated with how long a recession lasts,
implying that recessions last longer when a downturn in economic activity is accompanied
by a strained financial system.
The outline of the rest of the paper is as follows. In the next section, we do a brief
overview of the growing literature on financial crises. In Section 3, we provide a framework
for understanding how financial crises are created. In Section 4, we describe the data used
for our analysis and the aggregation method. In Section 5, we examine the evolution of
different vulnerabilities leading up to different crises. In Section 6, we compare aggregate
LPS indexes with the credit-to-GDP gap measure in predicting both the occurence and
severity of banking crises. In Section 7, we do the same for the onset, duration, and depth
of recessions. In the last section, we conclude with the ways in which a measure such as the
LPS Index can be used for policy purposes.
3

2 Literature review
Understanding financial crises, its origins, and its aftermath has been at the forefront of pol-
icymaker’s minds since the financial crisis. Claessens and Kose (2014), Ferguson, Hartmann,
Panetta, and Portes (2007), and Reinhart and Rogoff (2009) provide a more modern view of
how financial crises come to fruition and develop. Classical references include Kindelberger
(1978) and Eichengreen and Portes (1987). Eichengreen and Portes (1987), in particular,
looked closely at the full-fledged global crisis in the 1930s and pointed to linkages between
debt defaults, exchange-market disturbances, and bank failures that as crucial in under-
standing the critical role played by institutional arrangements in that era.
In devising a set of vulnerability categories to analyze, not only do we consider the ref-
erences listed above, we also consider imbalances that have been featured in the banking
crisis literature (Demirguc-Kunt and Dtragiache (1997) and Borio and Lowe (2002)), the
currency crisis literature (Kaminsky, Lizondo, and Reinhart (1998)), and the sovereign debt
crisis literature (Detragiache and Spilimbergo (2001), Manasse, Roubini, and Schimmelpfen-
nig (2003), Lee (2009), and Manasse and Roubini (2009)). In addition, we consider asset
valuation pressures as playing a role in crises (see Cecchetti (2008)). Our framework for
considering different types of crises is similar in vein to Adrian, Covitz, and Liang (2013),
as crises can occur due to a myriad of different combinations of build-ups in vulnerabilities
in the financial system.
We also contribute to the literature that associates different types of crises to output
loss. For example, Blanchard, Cerutti, and Summers (2015) looks at the effects of recessions
on output. Howard, Martin, and Wilson (2011) attempts to compare how recoveries are
affected by different types of recessions—those that are related to banking crises and those
that are not. Finally, Kroszner, Laeven, and Klingebiel (2007) looks at 38 developed and
developing countries that experienced financial crises during the last quarter century, and
find that those sectors that are highly dependent on external finance tend to experience a
substantially greater contraction of value added during a banking crisis in countries with
deeper financial systems than in countries with shallower financial systems. Claessens, Kose,
4

and Terrones (2012) and Taylor (2015) also examine the relationship between business cycles
and financial distruptions.
3 Vulnerabilities and Financial Shocks
In this section, we provide a framework to analyze financial crises. The origins of financial
crises can be very diverse, but, as seen in the literature, there are some common themes
we exploit. We posit that financial crises mainly arise from shocks to the economy. An
example from the recent financial crisis in the United States could be the sudden realization
that subprime mortgage-backed securities were not as safe as their ratings would imply or
realizing collateral value was not what it seemed in the repo market (see Gorton and Metrick
(2012) and Gorton and Ordonez (2014)). From many of the peripheral European countries’
perspective, contagion could presumably arise from financial shocks in the U.S., the U.K. and
core European countries. However, not all shocks lead to financial crises. Indeed, financial
systems around the world, more often than not, are able to withstand shocks to the economy
as vulnerabilities or imbalances in the financial system may be very subdued.
For illustrative purposes, Figure 1 allows us to visualize our basic framework for under-
standing financial crises. Point A, for example, represents an economy with relative subdued
vulnerabilities or imbalances in its financial system. Even if this state of the world may be
a drag on the real economy, given that a very large shock would be necessary to move the
financial system to the “crisis” state, the likelihood of a financial crisis would be fairly low.
At point B, however, when vulnerabilities are elevated, even a small shock can trigger the
change into a crisis state. As the shock makes its way through the system, vulnerabilities
and imbalances unwind or, in a sudden correction, unravel to less elevated levels to point
C. The point at which the shock was materialized, therefore, may have implications to the
severity of the crisis, if a crisis occurs. This decomposition between vulnerabilities (which
one can reasonably define and measure) and shocks (which one cannot) allows us to posit
research questions in a tractable manner.
In this context, we can set forth two hypotheses from our framework for understanding
5

financial crises. First, using extensive data, we will see whether vulnerabilities or imbalances
in the financial system can shed light on the likelihood of an onset of a crisis. If we find
that it can, we can argue that not only shocks (which are less quantifiable), but the state
of imbalances in the financial system is also an important factor in bringing forth financial
crises.
For the second hypothesis, we focus on the aftermath of banking crises. We will see if
t elevated vulnerabilities or imbalances have any bearing on the severity of the crisis once
it occurs can be rejected. We look to see if there is a positive and significant relationship
between aggregated vulnerability measures just prior to crises and output loss after the crises
have occurred.
4 Data and Aggregation Methodology
4.1 Data for Financial Crises
Our primary data source for financial crisis episodes is from Laeven and Valencia (2013)
during 1986-2012. We use data on banking, currency, and sovereign crises. Table 1 provides
the years and quarters at which these episodes occurred for 26 countries, eight of which
can be considered developing economies. Banking crises are defined as having significant
signs of financial distress in the banking system (bank runs, losses in the banking system,
and bank liquidations) and significant banking policy intervention measures in response to
significant losses in the banking system. The majority of banking crises in our sample
occurred in advanced economies from the 2007-2008 financial crisis. Currency crises are
defined as nominal deprecation of the currency vis-a-vis the U.S. dollar of at least 30 percent
that is also at least 10 percentage points higher than the rate of depreciation the year before.
We bring forward currency crisis dates (at most a quarter) if we identify countries all of a
sudden floating their currencies. Most of the currency crises are from the 1990s in emerging
markets, with the last in Turkey in 2001. Sovereign debt crises are defined as defaults to
private creditors and debt rescheduling. Only two are in our sample–Russia in 1998 and
6

Greece in 2012.
Following the financial cycle literature, we restrict our sample of analysis to the past
30 years (1986-2015) to account for longer cycles than business cycles (see Borio (2014). In
addition, the financial systems in these countries have likely experienced significant structural
shifts prior to 1986 and, therefore, data may be subject to different interpretations going
further back in time.
4.2 Data and Aggregation for Vulnerabilities
As for our data related to vulnerabilities and imbalances in the financial system, we be-
gin by defining five vulnerability categories for each country, similarly to Aikman, Kiley,
Lee, Palumbo, and Warusawitharana (2015). Some important differences are the following.
We classify vulnerability categories by sector as data is easier to track under this basis for
non-U.S. countries. Some additional categories include sovereign imbalances and external
imbalances that have been the source of financial stress that has led to sovereign debt crises
and currency crises, respectively. Each category may have one or more components, de-
pending on data availability. Similarly, each country may have one or more indicator ratios
that are then aggregated to create the components index. We collect data for 26 coun-
tries (in Table 1) in the following areas: financial sector vulnerabilities; nonfinancial sector
vulnerabilities; sovereign vulnerabilities; external sector vulnerabilities; and valuation pres-
sure. Contributing to these categories are 12 components. Each component and indicator is
detailed by category, following a discussion of the general aggregation methodology.
We create monthly category-level components by aggregating from indicator to compo-
nent, and then from component to category. To accomplish this, we first standardize each
indicator time series by subtracting the sample average values (at most 30 years worth) and
then dividing by the sample standard deviations. We aggregate the standardized series at
the component level by taking an arithmetic mean for indicators grouped in a given compo-
nent. We then use a kernel density estimation function to estimate the historical distribution
of the component index and transform series observations onto a [0,1] interval where .5 is
approximately the median. Importantly, the time an index spends in any point in the [0,1]
7

interval should be more or less equal to another. Importantly, the indicator time series may
have different start dates. We thus incorporate indicators as their data become available in
order to lengthen the overall component time series and capture historical conditions. Then,
excluding the financial sector, all components are standardized, grouped by categories, and
aggregated together with equal weighting.2 Finally we re-scale as before to create the final
category-level index (see below for more detailed information about financial sector aggrega-
tion). To create the overall country index (Lee-Posenau-Stebunovs (LPS) Index), we average
across the five categories using equal weighting and rescale using the kernel density estimates.
We also construct the LPS2 Index which does the aggregation on four components, financial
sector, nonfinancial sector, external sector, and valuation pressure vulnerabilities, without
sovereign vulnerabilities. Our indicators for each country, therefore, are indicative of how
vulnerable each sector is (or how much imbalances each sector has) relative to their own
history. There is no cross-country component to our indicators (as in Aikman, Kiley, Lee,
Palumbo, and Warusawitharana (2015)). The reason we do not pool the data and also
compare across countries is because of severe accounting, reporting, or structural differences
across countries in terms of financial sector development. In addition, available data across
countries is also very different.
Unlike Aikman, Kiley, Lee, Palumbo, and Warusawitharana (2015), the indicators we
collect are at the monthly, quarterly, or annual frequency, and the indexes we construct
are at the monthly frequency. When we aggregate up different frequencies, we simply add
them together to form a time series at the highest frequency. Our analysis is based on the
quarterly frequency of the monthly indexes created by out methodology.
Financial sector vulnerabilities Financial sector vulnerabilities are split into the bank-
ing vulnerabilities and nonbanking sector vulnerabilities.
Under the banking sector, there are four components: leverage; maturity transformation;
wholesale funding; and interconnectedness. Indicators used for each component may differ
2The only exception on equal weighting is when we combine the banking sector and nonbank sector toformulate the financial sector vulnerabilities. Instead, we weight by credit outstanding at banks and thenonbanking sector, respectively.
8

between countries. In order to maintain consistency, we use data on a residential basis for
domestic banks and deposit-taking institutions (excluding central banks). In some cases, due
to data availability, we may use data on a consolidated basis or incorporate other types of
lenders, such as development banks. For leverage, in all countries, we use bank credit to the
private nonfinancial sector to GDP (relative to a 10-year moving average) and either capital
and reserves to total assets of the banking system or equity capital to total assets (with
negative signs). Depending on country data availability, we also include regulatory leverage
ratios, such as a simple leverage ratio and a regulatory capital to risk-weighted assets ratio
(again with negative signs). Maturity transformation is measured across countries using
a loans to deposits ratio, although the exact variables used to construct the numerator
and denominator may differ between countries. In general, we measure nonfinancial loans to
nonfinancial deposits in order to maintain consistency across country. Wholesale funding also
varies across countries. In general, we approximate wholesale funding by monetary financial
institutions (MFI) liabilities to total assets. When available, we also add other short-term
liabilities to MFI liabilities. We incorporate other indicators into the wholesale funding
component when data is available. These indicators may include a regulatory liquidity ratio,
liquid assets to short-term liabilities (both with negative signs), and short-term liabilities to
total assets. Finally, we consider interconnectedness to be foreign assets to total assets. For
some countries, foreign assets is unavailable; for instance, euro-area countries foreign assets
only includes exposures to other euro-area countries. Therefore, we supplement this indicator
with cross-border claims from the Bank of International Settlements (BIS) locational banking
statistics to total banking sector assets.
The nonbanking sector index comprises one indicator, leverage. We proxy nonbanking
leverage across countries as nonbank-provided credit to the private nonfinancial sector to
GDP (relative to a 10-year moving average). Nonbank-provided credit is approximated by
subtracting the BIS measure of credit from the banking sector to the private nonfinancial
sector from total credit to the private nonfinancial sector. Although this is an imperfect
measure of nonbank leverage, it provides an aggregate view of how much credit is being
provided by the nonbanking sector relative to its history.
9

In order to create the financial sector vulnerability index, we aggregate components into
a banking sector and nonbanking sector index. Banking sector indicators are aggregated
together using an arithmetic mean. We then aggregate the banking and nonbanking sector
components together using a weighted mean, where the weights are bank-provided credit to
the nonfinancial sector and nonbank-provided credit to the nonfinancial sector, respectively.
Nonfinancial sector vulnerabilities Nonfinancial sector vulnerabilities have two com-
ponents: the corporate sector and the household sector. Depending on data availability, we
judge corporate sector vulnerabilities to include the following indicators: aggregated cor-
porate debt to equity, the 90th percentile of corporate debt to equity ratios, the corporate
interest coverage ratio, business debt to GDP (relative to a 10-year moving average), and the
nonfinancial corporation debt service ratio. Some countries, such as the United Kingdom,
have additional information on CRE loan-to-value ratios. Vulnerabilities in the household
sector are measured using credit to households and NPISHs to GDP (relative to a 10-year
moving average) and the household debt service ratio. Again, some countries have addition
information, such as mean loan-to-value ratios on mortgages.
Sovereign vulnerabilities The sovereign vulnerabilities category is comprised of three
indicators, differing from the previous two categories. We estimate sovereign vulnerabilities
using the aggregation of government debt to GDP (relative to a 10-year moving average),
the fiscal deficit to GDP, and government revenue to GDP (relative to a 10-year moving
average, with a negative sign).
External sector vulnerabilities Similarly to sovereign vulnerabilities, the external sector
vulnerabilities index is created using the following three indicators: external debt to GDP
(relative to a 10-year moving average), the current account deficit to GDP, and reserves to
GDP (with a negative sign).
Valuation pressure vulnerabilities We estimate valuation pressures using three com-
ponents: housing market pressures, equity market pressures, and junk bond issuance. For
10

housing market pressures, we use price-to-rent ratios for OECD countries, along with ei-
ther nominal price to income or nominal price to GDP. We use nominal price to GDP for
countries where personal disposable income is not readily available. Equity market pressures
includes the weighted average price/earnings ratio, based on 12-month forward earnings and
also dividend to yield ratios (with negative sign), which are backwards-looking but have a
longer time series than our forward P/E ratios. Finally, junk bond issuance is calculated
as the 12-month moving sum of high-yield nonfinancial issuances over the 12-month moving
sum of total issuances.
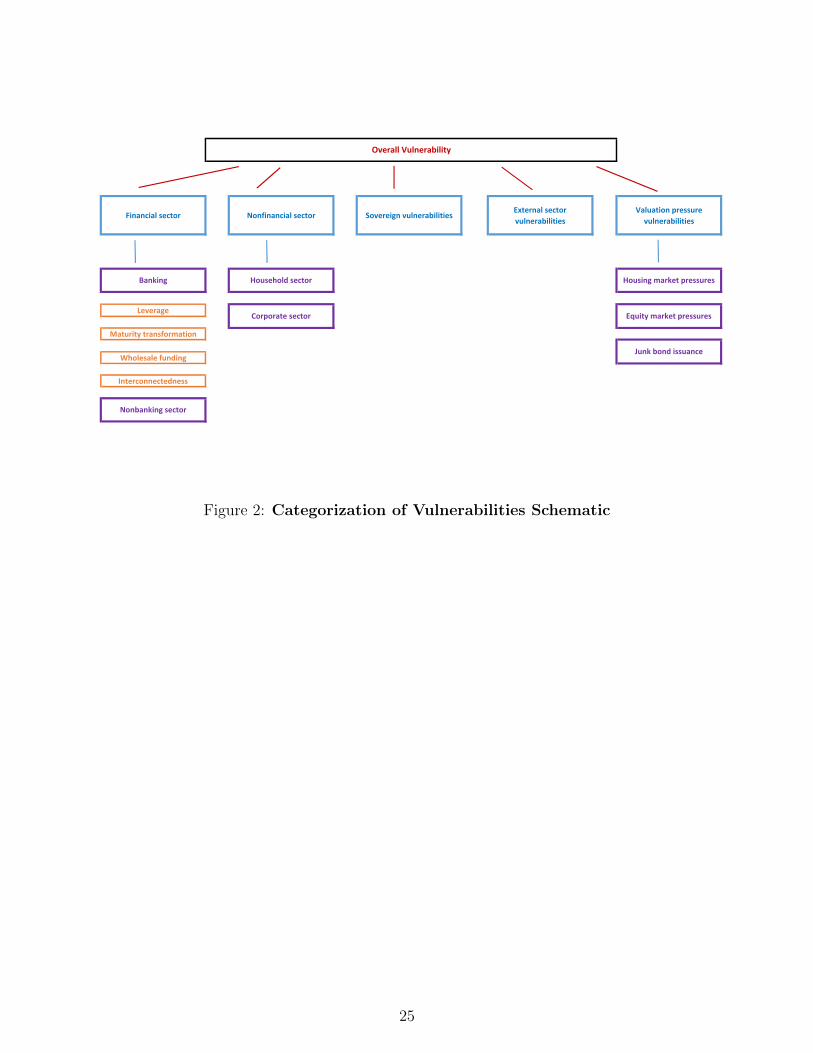
Figure 2 illustrates how data is structured into to relevant categories and subcategories
of vulnerabilities. Each aggregation step is done in the same way as depicted above. The
Appendix shows all the data we use in our sample of 26 countries, in addition to five more
(Australia, Canada, Hong Kong, Poland, and Singapore), which have not experienced a
financial crisis in the past 30 years. We include these additional countries when we investigate
if our measures have any association with the onset, duration, and severity of recessions, as
all of these countries have experienced recessions in the past 30 years.
5 Vulnerabilities and Crises
In this section, we show how our estimated component-based vulnerability measures evolved
around financial crises. Because banking crises are, by far, the most numerous, we have a
good sample of 23 crisis episodes to analyze (for which we have financial sector data at least
8 quarters before each crisis).3 We can also provide a good picture of how vulnerabilities
developed prior to and after currency crisis, for which we have 12 episodes (for which we
have external sector data at least 8 quarters before each crisis). In many cases, currency
crises occur in the same country in multiple years. Finally, we also briefly describe what
happened prior to and after the two sovereign debt crisis episodes (in Russia and Greece).
We convert all our data to quarterly data for this analysis (taking the last month end values
3For our analysis on the onset of banking crises, we can use all 29 banking crisis episodes in our sample.For our analysis on the severity of banking crises, we use 26 due to the availability of data in Laeven andValencia (2013).
11

of each quarter).
Banking Crises We begin with banking crises. As mentioned in Section 3, we first wish to
determine whether vulnerabilities in the financial system and, in particular, financial sector
vulnerabilities were important to the onset of banking crises or if shocks to the financial
system may be more of a dominant factor. Figure 3 provides histograms of all the different
types of vulnerabilities, including the aggregated LPS Index, one quarter prior to banking
crises.
We cannot reject the view that vulnerabilities do not matter for the onset of financial
crises. As the top left indicates about 80 percent of countries in our sample had financial
vulnerability indicators between 0.6 and 1.0 right before the onset of a banking crisis, in-
dicating that financial imbalances were notably or extremely elevated prior to the crises.
What is more striking is the fact that more than 60 percent of countries had extremely
elevated external sector vulnerabilities prior to these crises. These fractions are significant
given that, by definition, our indexes should spend roughly equal amounts of time in each of
the intervals in the histogram. For example, valuation pressure vulnerabilities has a pretty
even distribution across countries prior to banking crises. Sovereign imbalances seem to be
somewhat negatively associated with financial crises, though, as we will show later below,
sovereign imbalances increase dramatically after banking crises to counter the ensuing prob-
lems associated with the crises (by increasing sovereign debt, for example). Our aggregate
LPS Index, however, is more aligned with view that aggregate vulnerabilities matter in the
realization of banking crises. In sum, vulnerabilities in the financial system matter when it
comes to banking crises.
Figure 4 illustrates how our financial sector vulnerabilities, in particular, evolve through
time with horizontal lines depicting banking crises. Consistent with the framework described
in Figure 1, not only do we see elevated imbalances prior to banking crises, we also see
the unwinding or unraveling of those balances after the financial crisis has occurred. The
unraveling appears to have been most dramatic (and quick) in Austria, Belgium, Germany
and Switzerland after 2008 and Japan and Russia after 1998, and Mexico after 1994. Figures
12

5 and 6 provides another perspective on the same phenomena using radar charts. As the
financial crisis nears, imbalances in the financial sector become more and more elevated,
generally peaking when the crisis occurs, and then begins to unwind or unravel so that
vulnerabilities end up becoming less elevated after two years, again similarly depicted in
Figure 1.
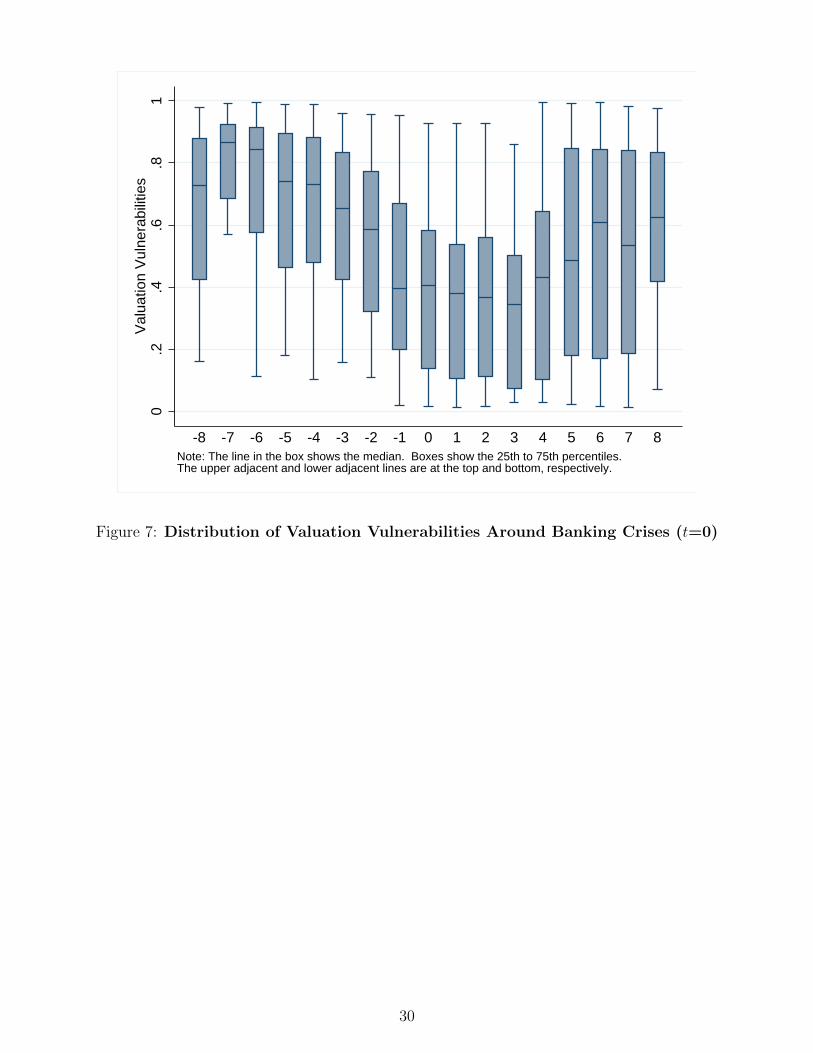
Figures 7 to 11 provide a more complete picture of how different types of vulnerabilities
evolve surrounding banking crisis. First, valuation pressures develop and then self-corrects
almost 2 years prior to a banking crisis (Figure 7). At this time, external vulnerabilities
remain elevated and financial and nonfinancial sector vulnerabilities become more and more
elevated (Figure 8 to (Figure 10)). As most of our sample is from the recent 2007-2008
financial crisis, we can identify in the data that leverage in the household sector was the
driving force behind the increase in nonfinancial vulnerabilities prior to 2008. Then a shock
to the financial system occurs, and, as most other imbalances unwind, the sovereign becomes
more and more vulnerable due to automatic stabilizers and its attempts to deal actively with
the negative effects of the banking crises (Figure 11). Indeed, this reflects what happened
to many countries surrounding the 2007-2008 financial crisis. One country, Greece, follows
this pattern of events, which ultimately lead to a sovereign debt crisis in 2012, a few years
after the banking crisis in 2008.
Currency Crises Next, we look at currency crises. Figure 12 provides histograms of all
the different types of vulnerabilities, including the aggregated LPS Index, one quarter prior
to currency crises. As with banking crises, we cannot reject the view that vulnerabilities do
not matter for the onset of currency crises. As the bottom left suggests, in the vast majority
of cases of currency crises, imbalances in the external sector were notably or extremely
elevated compared to historical norms. Interestingly, again both financial sector and external
sector vulnerabilities are elevated prior to currency crises as was the case with banking
crises. Nonfinancial sector vulnerabilities do not appear to be important in the realization of
currency crises; whereas, valuation pressures are now somewhat positively correlated. As in
the banking crises episodes, the aggregate LPS Index is positively correlated with the onset
13

of currency crises.
Figure 13 illustrates how our external sector vulnerabilities evolve through time with
horizontal lines depicting currency crises. Again, consistent with the view that heighted
imbalances in the external sector (and financial sector) trigger currency crises, imbalances are
generally elevated prior to such crises and unwind or unravel, sometimes very dramatically
as in Mexico and South Korea in 1994 and 1997, respectively. Figures 14 and 15 again
support the framework discussed in Section 3, which went through a hypothetical evolution
of financial crises. Coming into a crisis, vulnerabilities usually become elevated and, in the
case of currency crisis, external vulnerabilities usually unravel quickly.
Finally, Figures 16 to 20 provide further details on the evolution of various vulnerabilities
surrounding currency crises. Compared to banking crises, valuation pressures are more
dispersed (though still relatively elevated) before currency crises. Then, the combination
of imbalances in the financial and external sectors appears to be especially egregious in
providing fertile ground for currency crises to materialize, as was the case for banking crises.
Nonfinancial vulnerabilities do increase a bit, but do not become as elevated as in the case
of banking crises; whereas, sovereign vulnerabilities generally increase after currency crises.
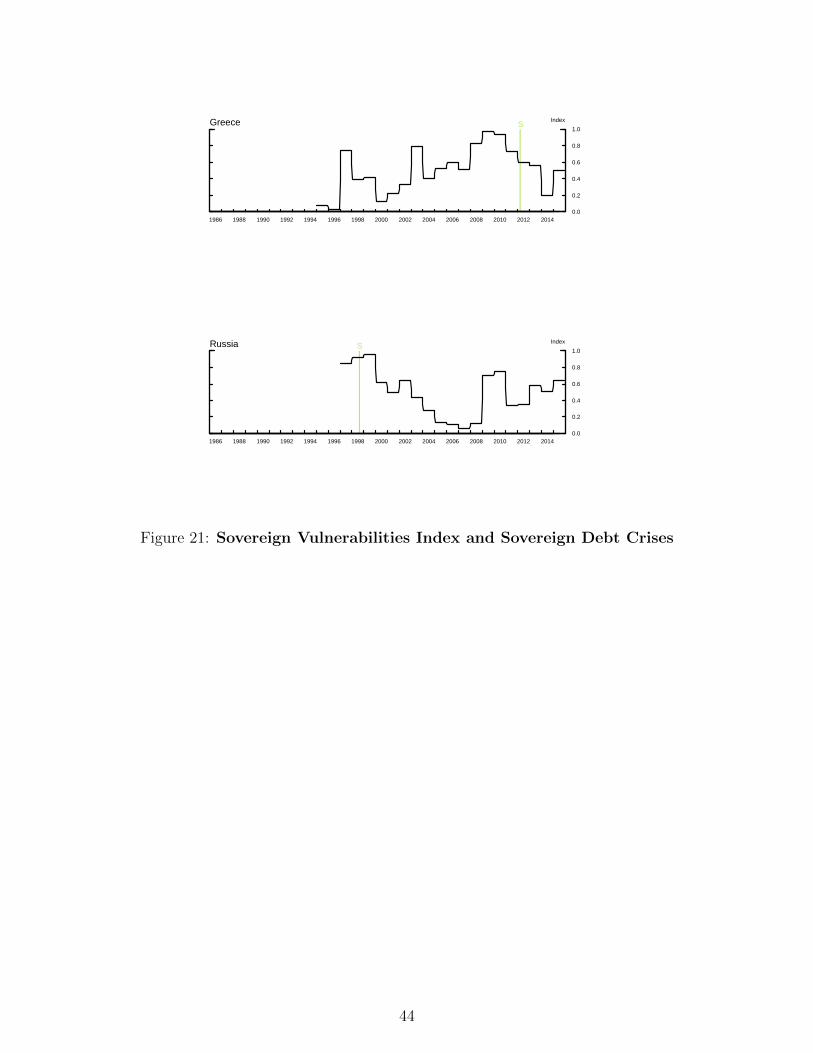
Sovereign Debt Crises Although we do not have sufficient sovereign crises in our sample
to be able to make general statements surrounding sovereign crises, both Russia and Greece
had elevated vulnerabilities in the financial and nonfinancial sectors and at least notable vul-
nerabilities in the external sector. As depicted in Figure 21, though sovereign vulnerabilities
were not as notable in Greece just prior to its sovereign debt crisis, it did have extremely
high imbalances two years prior to its sovereign crisis.
Summary of Results We can summarize our findings related to the evolution of vulner-
abilities surrounding various types of financial crises as follows. Regardless of the type of
financial crises, financial sector and external sector imbalances appear to be important in
the realization of financial crises. In particular, the general lead-lag relationship across the
vulnerability categories is as follows—heighted valuation pressures give way to price correc-
14

tion, external and financial sector imbalances become extremely elevated, then they unwind
or unravel as shocks to the financial system are realized. Sovereign vulnerabilities increase
as both automatic stabilizers and government intervention works to deal with the crisis.
Aggregating our sector vulnerabilities across all the countries in our sample leads to a
heat map (or ribbon chart) as in Figure 22, which reflects the aggregated experience in
advanced foreign economies (AFEs), especially related to the most recent financial crisis.
Here it is clear that valuation pressures mount, followed by heightened external sector vul-
nerabilities, then by financial sector vulnerabilities. Then imbalances in the nonfinancial
sector reach a climax, after which sovereign imbalances grow due to automatic stabilizers
and attempts to deal with the crises. Figure 23 depicts the evolution for emerging market
economies (EMEs). Consistent with the history of currency crises in emerging economies,
external sector vulnerabilities were elevated throughout the beginning of our sample, while
the elevated vulnerabilities in the financial sector in the late 1990s correspond with the
banking crises in China, South Korea, and Thailand. Such a framework suggests that more
recently the financial sector and nonfinancial sector vulnerabilities are worth monitoring for
financial stability risk, though vulnerabilities in other sectors of the financial system are not
as elevated.
Our main aggregate LPS Index can be plotted as in Figures 24 and 25 with horizontal lines
for all types of crises, which shows how the LPS Index can be applied to monitoring financial
stability in various dimensions country by country as well. The next section describes how
some of our metrics help predict the onset and severity of banking crises.
6 The Onset and Severity of Banking Crises
In this section, we analyze whether our measures of vulnerabilities has both significant power
in predicting banking crises and the severity of such crises.4 We consider an index based on
financial sector vulnerabilities only (Fin. Index), the LPS Index, which is an aggregate of
4We do not have enough observations to conduct a rigorous analysis for the onset and severity of currencyor sovereign debt crises. In addition, it has been shown that medium term output loss due to currency crisespales in comparison to that associated with banking crises (see Abiad, Balakrishnan, Brooks, Leigh, andTytell (2014)).
15

all five vulnerability components, and LPS2 Index, which excludes sovereign vulnerabilities
from the LPS Index. We construct the LPS2 Index because we have shown that sovereign
vulnerabilities actually lag the other vulnerabilities by significant margins. Our benchmark
is the credit-to-GDP gap measure that has been touted as one of the more useful measures
in predicting banking crises (as in Drehmann and Juselius (2014)) and has been set forth a
main guide variable for determining countercyclical capital buffers by the Basel Committee
on Banking Supervision in Basel III.
Occurence of Banking Crises Following the exercise used in Drehmann and Juselius
(2014), we estimate the receiver operating characteristic (ROC) curve and calculate the
area under the curve (AUC) as a summary measure to determine which variable provides
predictive power for banking crises. Five key differences differentiate our comparison to
what Drehmann and Juselius (2014) do in their study relative to other measures of financial
imbalances. First, we have a different sample of 26 countries. Their 26 countries include
countries such as Czech Republic, New Zealand, South Africa, and the United States, which
we do not have; whereas, we include countries such as Austria, Brazil, China, Luxembourg,
Mexico, Russia, Singapore, and Turkey, which they don’t have. In addition, we do not
include countries that have not experienced a banking crisis such as Australia, Canada, and
Poland.5 However, if we include these three countries, our results do not change.6 Second,
Drehmann and Juselius (2014) use varying time periods starting from 1980 or up to 2004
and ending all in 2012:Q2. We begin all our data from 1986 the earliest and continue our
analysis to the last quarter of 2012. Third, though they also conduct their analysis in full-
sample, their main analysis is in real time. Our main analysis is in full sample due to data
limitations.7 Fourth, their main crises dates are for systemic banking crises, which occur
one or two quarters after the initial banking crises experienced in most countries. Drehmann
and Juselius (2014) also make some adjustments and do not consider data up to two years
5Although Poland experienced a banking crisis, we do not have data that go far enough to analyzePoland’s banking crisis.
6Later we add Australia and Canada, along with Singapore and Hong Kong to test how well differentmeasures of vulnerabilities predict the onset, duration, and severity of recessions.
7We use the 2-sided Hodrick-Prescott (HP) Filter to calculate the credit-to-GDP gap using the 400,000lambda smoothing parameter as in Drehmann and Juselius (2014).
16

post crisis. We only consider the initial date of the banking crisis and remove periods where
the crisis continues and three years after a crisis ends in order to better predict the initial
advent of a crisis as most countries have experienced one banking crisis in the sample.
Our results are described in Table 2). The higher the AUC, the less false positives and
false negatives there are from the model. We use a normal probit function to estimate our
results, but doing a nonparametric approach does not change our results. A perfect predictor
will have an AUC of one and an uninformative predictor a value of 0.5. The results show
that whether we just use an index based on financial sector vulnerabilities only (Fin. Index)
or any of the LPS Indexes (LPS Index or LPS2 Index), we do better at predicting the onset
of banking crises relative to the CGG in all instances no matter the horizon as the AUCs
are always higher. The Fin. Index, however, is especially superior to the CGG one to two
quarters ahead of the onset of a banking crisis; whereas, the LPS indexes outperform the
CGG at farther horizons. In the case of the LPS Index, anywhere from eight to 12 quarters
ahead is statistically different from the CGG. For the LPS2 Index, at any point from three
to 12 quarters ahead, the AUC is statistically significantly different from when using the
CGG. This implies that there are gains from considering a holistic approach to monitoring
vulnerabilities in the financial systems around the world.8
The Credit-to-GDP gap is data that is directly comparable across countries and the-
oretically should convey information about a country relative to others. This result that
shows our LPS Index being superior in many dimensions may, therefore, highlight some less
attractive features of the credit-to-GDP gap measure. First, large drops in output (the de-
nominator) may influence the measure (whereby an increase in the gap is caused primarily
by a decrease in the GDP). Second, the credit-to-GDP gap may also be biased as a measure
of financial imbalances as sharp increases in credit (as seen in the recent financial crisis)
may temporarily elevate the gap measure as well (but from precautionary motives). Third,
8When we conduct our analysis in pseudo real-time, assuming data is available up to the point in whichthe various indexes and CGG are calculated, our index has severe limitations. First, unlike the credit seriesused in the CGG, our more granular data is not that available going back in time. Since we need a certainamount of data to begin calculating our indexes, we can only reasonably begin in 1996. When we compareour indexes with the CGG in this manner, we find that the AUCs using our indexes are generally similar tothose using the CGG and therefore our indexes are not statistically superior to the CGG.
17
there is difficulty in estimating the trend that is taken away from the credit-to-GDP ratio
in calculating the gap (though the HP-filter is widely used).9 Fourth, as mentioned earlier,
more recent literature has shown that vulnerabilities may not only come from credit booms
per say, but may also arise from the different types of funding of such booms, so it is less
surprising that a holistic approach leads to an earlier warning signal when it comes to crises.
Finally, measuring vulnerabilities may need to be done on a country-by-country basis as
each country may have very different levels of financial deepening that the credit-to-GDP
gap does not account for.10
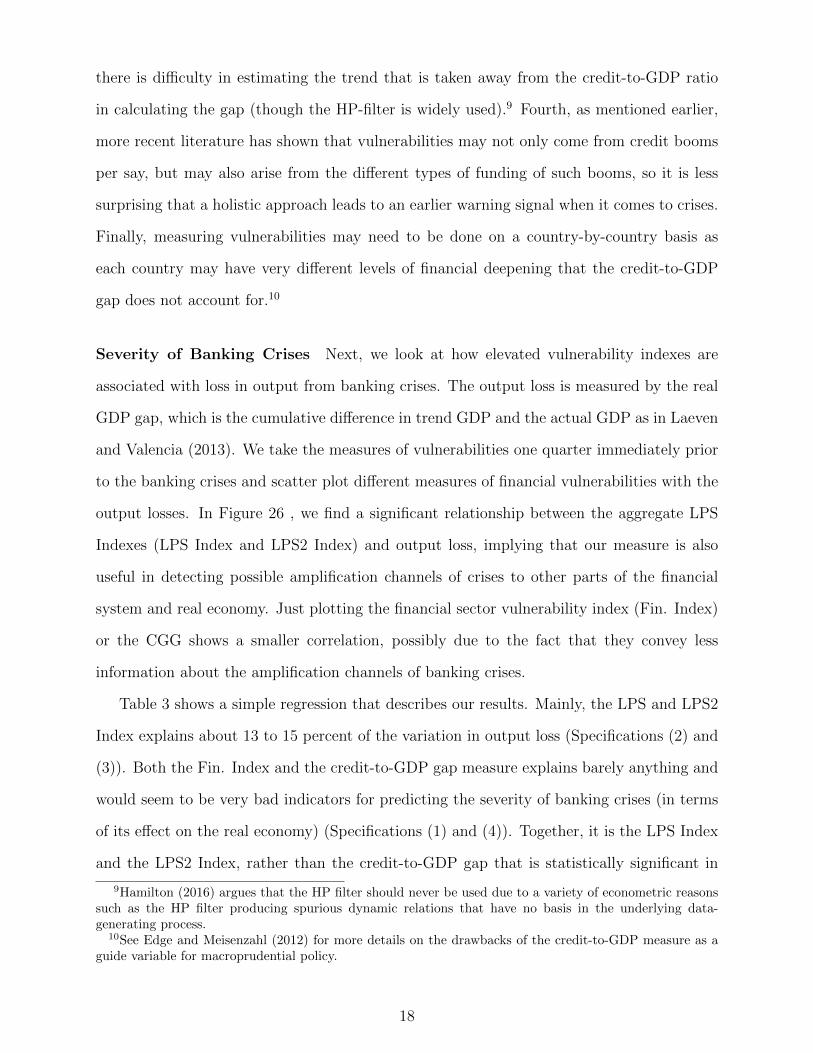
Severity of Banking Crises Next, we look at how elevated vulnerability indexes are
associated with loss in output from banking crises. The output loss is measured by the real
GDP gap, which is the cumulative difference in trend GDP and the actual GDP as in Laeven
and Valencia (2013). We take the measures of vulnerabilities one quarter immediately prior
to the banking crises and scatter plot different measures of financial vulnerabilities with the
output losses. In Figure 26 , we find a significant relationship between the aggregate LPS
Indexes (LPS Index and LPS2 Index) and output loss, implying that our measure is also
useful in detecting possible amplification channels of crises to other parts of the financial
system and real economy. Just plotting the financial sector vulnerability index (Fin. Index)
or the CGG shows a smaller correlation, possibly due to the fact that they convey less
information about the amplification channels of banking crises.
Table 3 shows a simple regression that describes our results. Mainly, the LPS and LPS2
Index explains about 13 to 15 percent of the variation in output loss (Specifications (2) and
(3)). Both the Fin. Index and the credit-to-GDP gap measure explains barely anything and
would seem to be very bad indicators for predicting the severity of banking crises (in terms
of its effect on the real economy) (Specifications (1) and (4)). Together, it is the LPS Index
and the LPS2 Index, rather than the credit-to-GDP gap that is statistically significant in
9Hamilton (2016) argues that the HP filter should never be used due to a variety of econometric reasonssuch as the HP filter producing spurious dynamic relations that have no basis in the underlying data-generating process.
10See Edge and Meisenzahl (2012) for more details on the drawbacks of the credit-to-GDP measure as aguide variable for macroprudential policy.
18

explaining output losses (Specifications (4) and (5)). Our results hold even when we omit
Mexico, for which the output loss is an outlier and the results, except that the CGG has a
marginally statistically significant explanatory power (not shown). One caveat to this simple
analysis is the number of observations. Our results are based on 23 to 27 observations in the
data, which is taken directly from Laeven and Valencia (2013).
In sum, the LPS Indexes, which by definition accounts for imbalances in multiple sectors
in the financial system, is superior to the credit-to-GDP gap in predicting both the occurrence
and the severity of banking crises even when we consider that the LPS Indexes rely solely on
the time series components of the various variables that go into the indicators. In addition,
the LPS Indexes outperform the Fin. Index when it comes to predicting the severity of
banking crises. These results are not surprising as our aggregation set-up, by definition,
considers possible spill-over effects and amplification channels of financial stress to other
sectors in the economy.
7 The Duration and Severity of Recessions
In this section, we analyze whether our measures of vulnerabilities have both significant power
in predicting the onset, duration, and severity of recessions. This allows us to expand our
country sample to include countries like Australia, Canada, Singapore, and Hong Kong, who
have not experienced a banking or currency crisis in the past 30 years, but have experienced
a recession. All told, about 100 recessions are in our sample. As in Section 6, we consider
an index based on financial sector vulnerabilities only (Fin. Index), the LPS Index, which is
an aggregate of all five vulnerability components, and LPS2 Index, which excludes sovereign
vulnerabilities from the LPS Index. We continue to compare against the credit-to-GDP gap
measure, but simply to see if aggregate leverage is superior to predicting the onset, duration,
and severity of recessions. The recessions data is from Howard, Martin, and Wilson (2011)
and measures the length or duration of the recession as the quarters between the peak and
trough of the relevant economic activity. The depth of the recession is simply how much
economic activity fell between the peak and the trough.
19
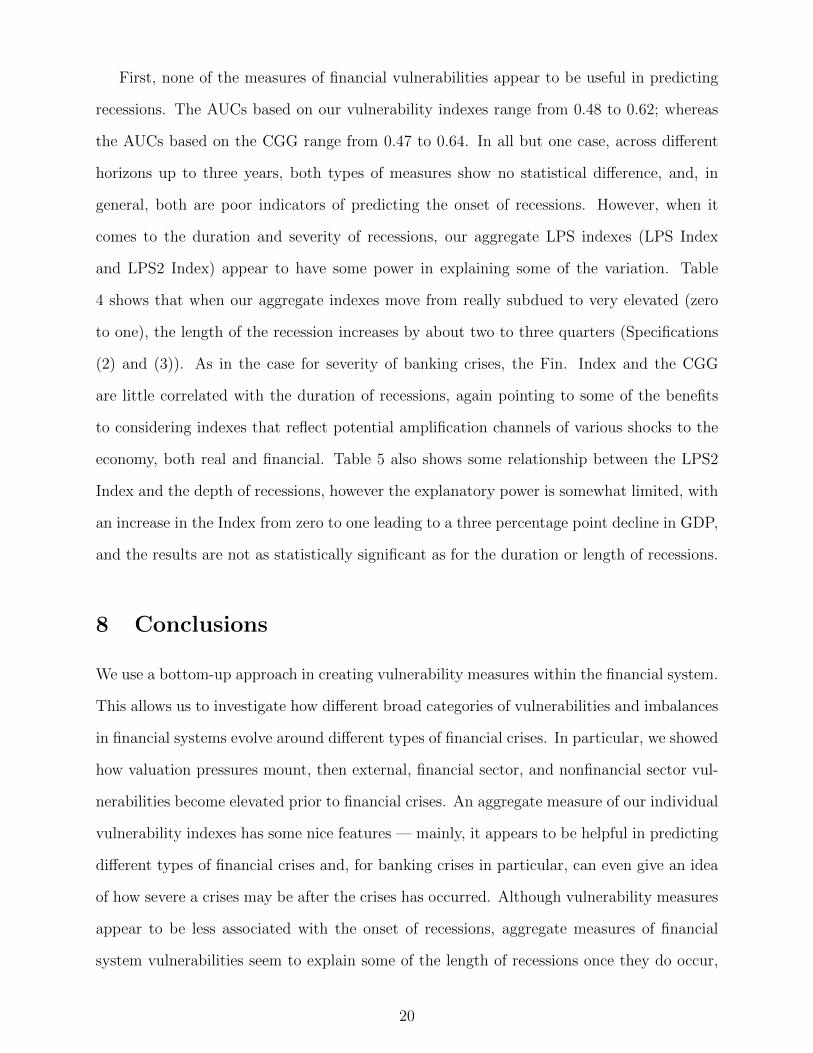
First, none of the measures of financial vulnerabilities appear to be useful in predicting
recessions. The AUCs based on our vulnerability indexes range from 0.48 to 0.62; whereas
the AUCs based on the CGG range from 0.47 to 0.64. In all but one case, across different
horizons up to three years, both types of measures show no statistical difference, and, in
general, both are poor indicators of predicting the onset of recessions. However, when it
comes to the duration and severity of recessions, our aggregate LPS indexes (LPS Index
and LPS2 Index) appear to have some power in explaining some of the variation. Table
4 shows that when our aggregate indexes move from really subdued to very elevated (zero
to one), the length of the recession increases by about two to three quarters (Specifications
(2) and (3)). As in the case for severity of banking crises, the Fin. Index and the CGG
are little correlated with the duration of recessions, again pointing to some of the benefits
to considering indexes that reflect potential amplification channels of various shocks to the
economy, both real and financial. Table 5 also shows some relationship between the LPS2
Index and the depth of recessions, however the explanatory power is somewhat limited, with
an increase in the Index from zero to one leading to a three percentage point decline in GDP,
and the results are not as statistically significant as for the duration or length of recessions.
8 Conclusions
We use a bottom-up approach in creating vulnerability measures within the financial system.
This allows us to investigate how different broad categories of vulnerabilities and imbalances
in financial systems evolve around different types of financial crises. In particular, we showed
how valuation pressures mount, then external, financial sector, and nonfinancial sector vul-
nerabilities become elevated prior to financial crises. An aggregate measure of our individual
vulnerability indexes has some nice features — mainly, it appears to be helpful in predicting
different types of financial crises and, for banking crises in particular, can even give an idea
of how severe a crises may be after the crises has occurred. Although vulnerability measures
appear to be less associated with the onset of recessions, aggregate measures of financial
system vulnerabilities seem to explain some of the length of recessions once they do occur,
20

as disruptions to economic activity can be spread through the financial system.
Although our analysis is based on a limited number of crisis episodes, our findings have
potential to have important policy implications. Mainly, as a financial stability monitoring
tool, our framework has not only the power to detect the build-up of vulnerabilities and
imbalances in the financial system two to three years before the onset of financial crises,
it would also presumably provide useful information regarding how forcefully a government
may want to intervene when dealing with financial crises once they have occurred. Not
only would measures such as the LPS or LPS2 Indexes be useful before financial crises for
macroprudential policy, but potentially even afterwards in the context of crisis management
policy as well. The results regarding the aggregate indexes to explain some of the length
and depth of recessions also has similar policy implications.
There are some other important caveats to our analysis. First, we base our analysis on
crisis data primarily from the 2007-2008 crises episodes. Still, the results in this paper are
consistent with the literature on financial crises dating back to several decades ago. Second,
which is related to the first caveat, is that our analysis is restricted to vulnerability categories
for which data is readily available. The next financial crisis may arise from a sector that has
yet to be developed or is difficult to obtain data for or even in a sector that was less relevant
for the onset of the 2007-2008 global financial crisis, such as sovereign vulnerabilities. That
is why it may still be important to keep track of sovereign vulnerabilities because there has
been a history of sovereign debt crises that have accompanied full-blown financial crises for
many countries in the past. Third, our methodology may have less meaning for countries
that have never experienced financial crises. However, to the extent that we can learn from
such countries’ experiences, tracking vulnerabilities and imbalances in such countries in our
framework may provide useful insights regarding the prevention of financial crises and the
alleviation of severe economic activity nonetheless. Out holistic framework can hopefully
help to pick up distress in the financial system even for those countries who have never
experienced financial crises in the past.
21

References
Abiad, A., R. Balakrishnan, P. K. Brooks, D. Leigh, and I. Tytell (2014):“What’s the Damage? Medium-Term Output Dynamics after Financial Crises,” in Fi-nancial Crises: Causes, Consequences, and Policy Responses, ed. by S. Claessens, M. A.Kose, L. Laeven, and F. Valencia, pp. 277–307. International Monetary Fund.
Adrian, T., D. Covitz, and N. Liang (2013): “Financial Stability Monitoring,” Financeand Economics Discussion Series 2013-21, Board of Governors of the Federal ReserveSystem.
Aikman, D., M. T. Kiley, S. Lee, M. G. Palumbo, and M. N. Warusawitharana(2015): “Mapping Heat in the U.S. Financial System,” Finance and Economics DiscussionSeries 2015-059, Board of Governors of the Federal Reserve System.
Blanchard, O., E. Cerutti, and L. Summers (2015): “Inflation and Activity – TwoExplorations and Their Monetary Policy Implications,” NBER Working Paper 21726,National Burearu of Economic Research.
Borio, C. (2014): “The financial cycle and macroeconomics: What have we learnt?,”Journal of Banking & Finance, 45, 182 – 198.
Borio, C., and P. Lowe (2002): “Assessing the Risk of Banking Crises,” BIS QuarterlyReview 157, BIS.
Cecchetti, S. (2008): “Measuring the Macroeconomic Risks Posed by Asset Price Booms,”in Asset Prices and Monetary Policy, pp. 9–43. National Bureau of Economic Research,Inc.
Claessens, S., and M. A. Kose (2014): “Financial Crises: Explanations, Types, andImplications,” in Financial Crises: Causes, Consequences, and Policy Responses, ed. byS. Claessens, M. A. Kose, L. Laeven, and F. Valencia, pp. 3–59. International MonetaryFund.
Claessens, S., M. A. Kose, and M. E. Terrones (2012): “How do business and finan-cial cycles interact?,” Journal of International Economics, 87(1), 178 – 190, Symposiumon the Global Dimensions of the Financial Crisis.
Demirguc-Kunt, A., and E. Dtragiache (1997): “The Determinants of BankingCrises,” Policy Research Working Paper 1828, World Bank.
Detragiache, E., and A. Spilimbergo (2001): “Crises and Liquidity: Evidence andInterpretation,” IMF Working Paper WP/01/2, International Monetary Fund.
Drehmann, M., and M. Juselius (2014): “Evaluating early warning indicators of bankingcrises: Satisfying policy requirements,” International Journal of Forecasting, 30(3), 759 –780.
Edge, R. M., and R. R. Meisenzahl (2012): “the Unreliability of Credit-to-GDP Ra-tio Gaps in Real Time: Implications for Countercyclical Capital Buffers,” InternationalJournal of Central Banking, 7(4), 261–98.
22

Eichengreen, B., and R. Portes (1987): “Anatomy of Financial Crises,” in Threatsto International Financial Stability, ed. by R. Portes, and A. K. Swoboda, pp. 10–58.Cambridge University Press, New York.
Ferguson, R. W., P. Hartmann, F. Panetta, and R. Portes (2007): InternationalFinancial Stability, Geneva Report on the World Economy. Center for Economic PolicyResearch.
Gorton, G., and A. Metrick (2012): “Securitized banking and the run on repo,” Journalof Financial Economics, 104(3), 425 – 451.
Gorton, G., and G. Ordonez (2014): “Collateral Crises,” American Economic Review,104(2), 343–78.
Hamilton, J. D. (2016): “Why You Should Never Use the Hodrick-Prescott Filter,” Dis-cussion paper.
Howard, G., R. Martin, and B. Wilson (2011): “Are Recoveries from Banking andFinancial Crises Really So Different?,” International Finance Discussion Papers 1037,Board of Governors of the Federal Reserve System.
Kaminsky, G., S. Lizondo, and C. Reinhart (1998): “Leading Indicators of CurrencyCrises,” IMF Staff Papers 1, International Monetary Fund.
Kindelberger, C. P. (1978): Manias, Panics, and Crashes: A History of FinancialCrises. Wiley Investment Classics.
Kroszner, R. S., L. Laeven, and D. Klingebiel (2007): “Banking crises, financialdependence, and growth,” Journal of Financial Economics, 84(1), 187 – 228.
Laeven, L., and F. Valencia (2013): “Systemic Banking Crises Database,” IMF Eco-nomic Review, 61, 225–270.
Lee, S. (2009): “How Information Quality of Macro Aggregates Affects Sovereign Risk: AnEmpirical Investigation,” Review of International Economics, 17(3), 510–532.
Manasse, P., and N. Roubini (2009): “Rules of thumb for sovereign debt crises,” Journalof International Economics, 78(2), 192 – 205.
Manasse, P., N. Roubini, and A. Schimmelpfennig (2003): “Predicting SovereignDebt Crises,” IMF Working Paper WP/03/221, International Monetary Fund.
Reinhart, C. M., and K. S. Rogoff (2009): This Time Is Different: Eight Centuriesof Financial Folly. Princeton University Press, Princeton, New Jersey.
Taylor, A. M. (2015): “Credit, Financial Stability, and the Macroeconomy,” AnnualReview of Economics, 7(1), 309–339.
23

Figure 1: Understanding Financial Crises
24
Financial sector Nonfinancial sector Sovereign vulnerabilitiesExternal sector vulnerabilities
Valuation pressure vulnerabilities
Leverage
Maturity transformation
Wholesale funding
Interconnectedness
Junk bond issuance
Overall Vulnerability
Banking
Nonbanking sector
Household sector
Corporate sector
Housing market pressures
Equity market pressures
Figure 2: Categorization of Vulnerabilities Schematic
25

010
2030
4050
60P
erce
nt
0 .2 .4 .6 .8 1Financial Vulnerabilities
010
2030
4050
60P
erce
nt
0 .2 .4 .6 .8 1Nonfinancial Vulnerabilities
010
2030
4050
60P
erce
nt
0 .2 .4 .6 .8 1Sovereign Vulnerabilities
010
2030
4050
60P
erce
nt
0 .2 .4 .6 .8 1External Vulnerabilities
010
2030
4050
60P
erce
nt
0 .2 .4 .6 .8 1Valuation Vulnerabilities
010
2030
4050
60P
erce
nt
0 .2 .4 .6 .8 1Aggregate LPS Index
Figure 3: Histogram of Vulnerabilities 1 Quarter Prior to Banking Crises
26

1986
1988
1990
1992
1994
1996
1998
2000
2002
2004
2006
2008
2010
2012
2014
0.0
0.4
0.8
Inde
xA
ustr
iaB
1986
1988
1990
1992
1994
1996
1998
2000
2002
2004
2006
2008
2010
2012
2014
0.0
0.4
0.8
Inde
xB
elgi
umB
1987
1989
1991
1993
1995
1997
1999
2001
2003
2005
2007
2009
2011
2013
2015
0.0
0.4
0.8
Inde
xD
enm
ark
B
1986
1988
1990
1992
1994
1996
1998
2000
2002
2004
2006
2008
2010
2012
2014
0.0
0.4
0.8
Inde
xF
inla
ndB
1986
1988
1990
1992
1994
1996
1998
2000
2002
2004
2006
2008
2010
2012
2014
0.0
0.4
0.8
Inde
xF
ranc
eB
1986
1988
1990
1992
1994
1996
1998
2000
2002
2004
2006
2008
2010
2012
2014
0.0
0.4
0.8
Inde
xG
erm
any
B
1986
1988
1990
1992
1994
1996
1998
2000
2002
2004
2006
2008
2010
2012
2014
0.0
0.4
0.8
Inde
xG
reec
eB
1986
1988
1990
1992
1994
1996
1998
2000
2002
2004
2006
2008
2010
2012
2014
0.0
0.4
0.8
Inde
xJa
pan
B
1986
1988
1990
1992
1994
1996
1998
2000
2002
2004
2006
2008
2010
2012
2014
0.0
0.4
0.8
Inde
xIr
elan
dB
1986
1988
1990
1992
1994
1996
1998
2000
2002
2004
2006
2008
2010
2012
2014
0.0
0.4
0.8
Inde
xIta
lyB
1986
1988
1990
1992
1994
1996
1998
2000
2002
2004
2006
2008
2010
2012
2014
0.0
0.4
0.8
Inde
xLu
xem
bour
gB
1986
1988
1990
1992
1994
1996
1998
2000
2002
2004
2006
2008
2010
2012
2014
0.0
0.4
0.8
Inde
xM
exic
oB
1986
1988
1990
1992
1994
1996
1998
2000
2002
2004
2006
2008
2010
2012
2014
0.0
0.4
0.8
Inde
xN
ethe
rland
sB
1986
1988
1990
1992
1994
1996
1998
2000
2002
2004
2006
2008
2010
2012
2014
0.0
0.4
0.8
Inde
xN
orw
ayB
1986
1988
1990
1992
1994
1996
1998
2000
2002
2004
2006
2008
2010
2012
2014
0.0
0.4
0.8
Inde
xP
ortu
gal
B
1986
1988
1990
1992
1994
1996
1998
2000
2002
2004
2006
2008
2010
2012
2014
0.0
0.4
0.8
Inde
xR
ussi
aB
1986
1988
1990
1992
1994
1996
1998
2000
2002
2004
2006
2008
2010
2012
2014
0.0
0.4
0.8
Inde
xS
outh
Kor
eaB
1986
1988
1990
1992
1994
1996
1998
2000
2002
2004
2006
2008
2010
2012
2014
0.0
0.4
0.8
Inde
xS
pain
B
1986
1988
1990
1992
1994
1996
1998
2000
2002
2004
2006
2008
2010
2012
2014
0.0
0.4
0.8
Inde
xS
witz
erla
ndB
1986
1988
1990
1992
1994
1996
1998
2000
2002
2004
2006
2008
2010
2012
2014
0.0
0.4
0.8
Inde
xS
wed
enB
B
1986
1988
1990
1992
1994
1996
1998
2000
2002
2004
2006
2008
2010
2012
2014
0.0
0.4
0.8
Inde
xT
haila
ndB
1986
1988
1990
1992
1994
1996
1998
2000
2002
2004
2006
2008
2010
2012
2014
0.0
0.4
0.8
Inde
xT
urke
yB
1986
1988
1990
1992
1994
1996
1998
2000
2002
2004
2006
2008
2010
2012
2014
0.0
0.4
0.8
Inde
xU
nite
d K
ingd
omB
Fig
ure
4:F
inanci
al
Vuln
era
bil
itie
sIn
dex
and
Bankin
gC
rise
s
27

Figure 5: Financial Vulnerabilities 2 Years and 1 Quarter Prior to Banking Crises,Respectively
28

Figure 6: Financial Vulnerabilities at the Time of and 2 Years After BankingCrises, Respectively
29
0.2
.4.6
.81
Val
uatio
n V
ulne
rabi
litie
s
-8 -7 -6 -5 -4 -3 -2 -1 0 1 2 3 4 5 6 7 8Note: The line in the box shows the median. Boxes show the 25th to 75th percentiles.The upper adjacent and lower adjacent lines are at the top and bottom, respectively.
Figure 7: Distribution of Valuation Vulnerabilities Around Banking Crises (t=0)
30

0.2
.4.6
.81
Ext
erna
l Vul
nera
bilit
ies
-8 -7 -6 -5 -4 -3 -2 -1 0 1 2 3 4 5 6 7 8Note: The line in the box shows the median. Boxes show the 25th to 75th percentiles.The upper adjacent and lower adjacent lines are at the top and bottom, respectively.
Figure 8: Distribution of External Vulnerabilities Around Banking Crises (t=0)
31

0.2
.4.6
.81
Fin
anci
al V
ulne
rabi
litie
s
-8 -7 -6 -5 -4 -3 -2 -1 0 1 2 3 4 5 6 7 8excludes outside values
Figure 9: Distribution of Financial Vulnerabilities Around Banking Crises (t=0)
32

.2.4
.6.8
1N
onfin
anci
al V
ulne
rabi
litie
s
-8 -7 -6 -5 -4 -3 -2 -1 0 1 2 3 4 5 6 7 8Note: The line in the box shows the median. Boxes show the 25th to 75th percentiles.The upper adjacent and lower adjacent lines are at the top and bottom, respectively.
Figure 10: Distribution of Nonfinancial Vulnerabilities Around Banking Crises(t=0)
33

0.2
.4.6
.81
Sov
erei
gn V
ulne
rabi
litie
s
-8 -7 -6 -5 -4 -3 -2 -1 0 1 2 3 4 5 6 7 8Note: The line in the box shows the median. Boxes show the 25th to 75th percentiles.The upper adjacent and lower adjacent lines are at the top and bottom, respectively.
Figure 11: Distribution of Sovereign Vulnerabilities Around Banking Crises (t=0)
34

010
2030
4050
60P
erce
nt
0 .2 .4 .6 .8 1Financial Vulnerabilities
010
2030
4050
60P
erce
nt
0 .2 .4 .6 .8 1Nonfinancial Vulnerabilities
010
2030
4050
60P
erce
nt
0 .2 .4 .6 .8 1Sovereign Vulnerabilities
010
2030
4050
60P
erce
nt
0 .2 .4 .6 .8 1External Vulnerabilities
010
2030
4050
60P
erce
nt
0 .2 .4 .6 .8 1Valuation Vulnerabilities
010
2030
4050
60P
erce
nt
0 .2 .4 .6 .8 1Aggregate LPS Index
Figure 12: Histogram of Vulnerabilities 1 Quarter Prior to Currency Crises
35

1986 1988 1990 1992 1994 1996 1998 2000 2002 2004 2006 2008 2010 2012 20140.0
0.2
0.4
0.6
0.8
1.0
IndexBrazilC C C
1986 1988 1990 1992 1994 1996 1998 2000 2002 2004 2006 2008 2010 2012 20140.0
0.2
0.4
0.6
0.8
1.0
IndexFinland C
1991 1993 1995 1997 1999 2001 2003 2005 2007 2009 2011 2013 20150.0
0.2
0.4
0.6
0.8
1.0
IndexMalaysia C
1986 1988 1990 1992 1994 1996 1998 2000 2002 2004 2006 2008 2010 2012 20140.0
0.2
0.4
0.6
0.8
1.0
IndexMexico C
1986 1988 1990 1992 1994 1996 1998 2000 2002 2004 2006 2008 2010 2012 20140.0
0.2
0.4
0.6
0.8
1.0
IndexRussia C
1986 1988 1990 1992 1994 1996 1998 2000 2002 2004 2006 2008 2010 2012 20140.0
0.2
0.4
0.6
0.8
1.0
IndexSouth Korea C
1986 1988 1990 1992 1994 1996 1998 2000 2002 2004 2006 2008 2010 2012 20140.0
0.2
0.4
0.6
0.8
1.0
IndexSweden C
1993 1995 1997 1999 2001 2003 2005 2007 2009 2011 2013 20150.0
0.2
0.4
0.6
0.8
1.0
IndexThailand C
1987 1989 1991 1993 1995 1997 1999 2001 2003 2005 2007 2009 2011 2013 20150.0
0.2
0.4
0.6
0.8
1.0
IndexTurkey C C C
Figure 13: External Vulnerabilities Index and Currency Crises
36

Figure 14: Financial Vulnerabilities 2 Years and 1 Quarter Prior to CurrencyCrises, Respectively
37

Figure 15: Financial Vulnerabilities at the Time of and 2 Years After CurrencyCrises, Respectively
38

0.2
.4.6
.81
Val
uatio
n V
ulne
rabi
litie
s
-8 -7 -6 -5 -4 -3 -2 -1 0 1 2 3 4 5 6 7 8Note: The line in the box shows the median. Boxes show the 25th to 75th percentiles.The upper adjacent and lower adjacent lines are at the top and bottom, respectively.
Figure 16: Distribution of Valuation Vulnerabilities Around Currency Crises (t=0)
39

.2.4
.6.8
1E
xter
nal V
ulne
rabi
litie
s
-8 -7 -6 -5 -4 -3 -2 -1 0 1 2 3 4 5 6 7 8Note: The line in the box shows the median. Boxes show the 25th to 75th percentiles.The upper adjacent and lower adjacent lines are at the top and bottom, respectively.
Figure 17: Distribution of External Vulnerabilities Around Currency Crises (t=0)
40

0.2
.4.6
.81
Fin
anci
al V
ulne
rabi
litie
s
-8 -7 -6 -5 -4 -3 -2 -1 0 1 2 3 4 5 6 7 8Note: The line in the box shows the median. Boxes show the 25th to 75th percentiles.The upper adjacent and lower adjacent lines are at the top and bottom, respectively.
Figure 18: Distribution of Financial Vulnerabilities Around Currency Crises (t=0)
41

.2.4
.6.8
1N
onfin
anci
al V
ulne
rabi
litie
s
-8 -7 -6 -5 -4 -3 -2 -1 0 1 2 3 4 5 6 7 8Note: The line in the box shows the median. Boxes show the 25th to 75th percentiles.The upper adjacent and lower adjacent lines are at the top and bottom, respectively.
Figure 19: Distribution of Financial Vulnerabilities Around Currency Crises (t=0)
42

0.2
.4.6
.81
Sov
erei
gn V
ulne
rabi
litie
s
-8 -7 -6 -5 -4 -3 -2 -1 0 1 2 3 4 5 6 7 8Note: The line in the box shows the median. Boxes show the 25th to 75th percentiles.The upper adjacent and lower adjacent lines are at the top and bottom, respectively.
Figure 20: Distribution of Sovereign Vulnerabilities Around Currency Crises (t=0)
43
1986 1988 1990 1992 1994 1996 1998 2000 2002 2004 2006 2008 2010 2012 20140.0
0.2
0.4
0.6
0.8
1.0
IndexGreece S
1986 1988 1990 1992 1994 1996 1998 2000 2002 2004 2006 2008 2010 2012 20140.0
0.2
0.4
0.6
0.8
1.0
IndexRussia S
Figure 21: Sovereign Vulnerabilities Index and Sovereign Debt Crises
44

Figure 22: Heat Map of Different Vulnerabilities (Aggregated for advancedeconomies)
45

Figure 23: Heat Map of Different Vulnerabilities (Aggregated for emergingeconomies)
46

1986
1988
1990
1992
1994
1996
1998
2000
2002
2004
2006
2008
2010
2012
2014
0.0
0.2
0.4
0.6
0.8
1.0
Inde
xA
ustr
alia
*
1986
1988
1990
1992
1994
1996
1998
2000
2002
2004
2006
2008
2010
2012
2014
0.0
0.2
0.4
0.6
0.8
1.0
Inde
xA
ustr
iaB
1986
1988
1990
1992
1994
1996
1998
2000
2002
2004
2006
2008
2010
2012
2014
0.0
0.2
0.4
0.6
0.8
1.0
Inde
xB
elgi
umB
1986
1988
1990
1992
1994
1996
1998
2000
2002
2004
2006
2008
2010
2012
2014
0.0
0.2
0.4
0.6
0.8
1.0
Inde
xB
razi
l CB
CB
C
1986
1988
1990
1992
1994
1996
1998
2000
2002
2004
2006
2008
2010
2012
2014
0.0
0.2
0.4
0.6
0.8
1.0
Inde
xC
anad
a*
1986
1988
1990
1992
1994
1996
1998
2000
2002
2004
2006
2008
2010
2012
2014
0.0
0.2
0.4
0.6
0.8
1.0
Inde
xC
hina
B
1986
1988
1990
1992
1994
1996
1998
2000
2002
2004
2006
2008
2010
2012
2014
0.0
0.2
0.4
0.6
0.8
1.0
Inde
xD
enm
ark
B
1986
1988
1990
1992
1994
1996
1998
2000
2002
2004
2006
2008
2010
2012
2014
0.0
0.2
0.4
0.6
0.8
1.0
Inde
xF
inla
ndB
C
1986
1988
1990
1992
1994
1996
1998
2000
2002
2004
2006
2008
2010
2012
2014
0.0
0.2
0.4
0.6
0.8
1.0
Inde
xF
ranc
eB
1986
1988
1990
1992
1994
1996
1998
2000
2002
2004
2006
2008
2010
2012
2014
0.0
0.2
0.4
0.6
0.8
1.0
Inde
xG
erm
any
B
1986
1988
1990
1992
1994
1996
1998
2000
2002
2004
2006
2008
2010
2012
2014
0.0
0.2
0.4
0.6
0.8
1.0
Inde
xG
reec
eB
S
1986
1988
1990
1992
1994
1996
1998
2000
2002
2004
2006
2008
2010
2012
2014
0.0
0.2
0.4
0.6
0.8
1.0
Inde
xJa
pan
B
1986
1988
1990
1992
1994
1996
1998
2000
2002
2004
2006
2008
2010
2012
2014
0.0
0.2
0.4
0.6
0.8
1.0
Inde
xIr
elan
dB
1986
1988
1990
1992
1994
1996
1998
2000
2002
2004
2006
2008
2010
2012
2014
0.0
0.2
0.4
0.6
0.8
1.0
Inde
xIta
lyB
1986
1988
1990
1992
1994
1996
1998
2000
2002
2004
2006
2008
2010
2012
2014
0.0
0.2
0.4
0.6
0.8
1.0
Inde
xLu
xem
bour
gB
1986
1988
1990
1992
1994
1996
1998
2000
2002
2004
2006
2008
2010
2012
2014
0.0
0.2
0.4
0.6
0.8
1.0
Inde
xM
alay
sia
BC
Fig
ure
24:
Aggre
gate
LP
SIn
dex
and
Fin
anci
al
Cri
ses
47

1986
1988
1990
1992
1994
1996
1998
2000
2002
2004
2006
2008
2010
2012
2014
0.0
0.2
0.4
0.6
0.8
1.0
Inde
xM
exic
oB
C
1986
1988
1990
1992
1994
1996
1998
2000
2002
2004
2006
2008
2010
2012
2014
0.0
0.2
0.4
0.6
0.8
1.0
Inde
xN
ethe
rland
sB
1986
1988
1990
1992
1994
1996
1998
2000
2002
2004
2006
2008
2010
2012
2014
0.0
0.2
0.4
0.6
0.8
1.0
Inde
xN
orw
ayB
1986
1988
1990
1992
1994
1996
1998
2000
2002
2004
2006
2008
2010
2012
2014
0.0
0.2
0.4
0.6
0.8
1.0
Inde
xP
olan
d*
1986
1988
1990
1992
1994
1996
1998
2000
2002
2004
2006
2008
2010
2012
2014
0.0
0.2
0.4
0.6
0.8
1.0
Inde
xP
ortu
gal
B
1986
1988
1990
1992
1994
1996
1998
2000
2002
2004
2006
2008
2010
2012
2014
0.0
0.2
0.4
0.6
0.8
1.0
Inde
xR
ussi
aB
CS
B
1986
1988
1990
1992
1994
1996
1998
2000
2002
2004
2006
2008
2010
2012
2014
0.0
0.2
0.4
0.6
0.8
1.0
Inde
xS
inga
pore
*
1986
1988
1990
1992
1994
1996
1998
2000
2002
2004
2006
2008
2010
2012
2014
0.0
0.2
0.4
0.6
0.8
1.0
Inde
xS
outh
Kor
eaB
C
1986
1988
1990
1992
1994
1996
1998
2000
2002
2004
2006
2008
2010
2012
2014
0.0
0.2
0.4
0.6
0.8
1.0
Inde
xS
pain
B
1986
1988
1990
1992
1994
1996
1998
2000
2002
2004
2006
2008
2010
2012
2014
0.0
0.2
0.4
0.6
0.8
1.0
Inde
xS
witz
erla
ndB
1986
1988
1990
1992
1994
1996
1998
2000
2002
2004
2006
2008
2010
2012
2014
0.0
0.2
0.4
0.6
0.8
1.0
Inde
xS
wed
enB
CB
1986
1988
1990
1992
1994
1996
1998
2000
2002
2004
2006
2008
2010
2012
2014
0.0
0.2
0.4
0.6
0.8
1.0
Inde
xT
haila
ndB
C
1986
1988
1990
1992
1994
1996
1998
2000
2002
2004
2006
2008
2010
2012
2014
0.0
0.2
0.4
0.6
0.8
1.0
Inde
xT
urke
yB
CC
C
1986
1988
1990
1992
1994
1996
1998
2000
2002
2004
2006
2008
2010
2012
2014
0.0
0.2
0.4
0.6
0.8
1.0
Inde
xU
nite
d K
ingd
omB
Fig
ure
25:
Aggre
gate
LP
SIn
dex
and
Fin
anci
al
Cri
ses,
conti
nued
48

ATBE
DK
FI
FRDE
GR
IE
ITJP
KR
LU
MXNL
NO
PT
RU
ESSE
CH
TH
TRGB
050
100
Out
put L
oss
0 .2 .4 .6 .8 1Fin. Index
Fitted values output_loss
Fin. Index and Output Loss
AT BE
BR
BR
CN
DK
FI
FRDE
GR
IE
ITJP
KR
LU MY
MXNL
NO
PT
RU
ESSE
CH
TH
TRGB
050
100
Out
put L
oss
0 .2 .4 .6 .8 1LPS Index
Fitted values output_loss
LPS Index and Output Loss
AT BE
BR
BR
CN
DK
FI
FRDE
GR
IE
ITJP
KR
LU MY
MXNL
NO
PT
RU
ESSE
CH
TH
TRGB
050
100
Out
put L
oss
0 .2 .4 .6 .8 1LPS2 Index
Fitted values output_loss
LPS2 Index and Output Loss
ATBE
BR
CN
DK
FI
FRDE
GR
IE
ITJP
KR
LUMY
MXNL
NO
PT
RU
ESSE
CH
TH
TRGB
050
100
Out
put L
oss
0 20 40 60Credit-to-GDP Gap
Fitted values output_loss
Credit-to-GDP Gap and Output Loss
Figure 26: Measures of Vulnerabilities and Output Loss
49

Table 1: Financial Crises from Laeven and Valencia (2013)
Country Banking Crises Currency Crises Sovereign CrisesAustria 2008:Q3Belgium 2008:Q3Brazil 1990:Q1, 1994:Q4 1987:Q2, 1992:Q2, 1999:Q1Denmark 2008:Q3China 1998:Q3Finland 1991:Q3 1992:Q3*France 2008:Q3Germany 2008:Q3Greece 2008:Q3 2012:Q1Japan 1997:Q4Ireland 2008:Q3Italy 2008:Q3Luxembourg 2008:Q3Malaysia 1997:Q3 1997:Q3Mexico 1994:Q4 1994:Q4*Netherlands 2008:Q3Norway 1991:Q4Portugal 2008:Q3Russia 1998:Q3, 2008:Q3 1998:Q3 1998:Q3South Korea 1997:Q3 1997:Q4*Spain 2008:Q3Switzerland 2008:Q3Sweden 1991:Q3, 2008:Q3 1992:Q4*Thailand 1997:Q3 1997:Q3Turkey 2000:Q4 1991:Q2, 1996:Q2, 2001:Q1United Kingdom 2007:Q3Note. * indicates a one quarter earlier designation of currency crisis compared to Laevenand Valencia (2013) as fixed or actively managed exchange rates were first allowed tofloat prior to the date in Laeven and Valencia (2013).
50

Tab
le2:
Are
aU
nder
the
RO
CC
urv
e(A
UC
)pri
orto
Ban
kin
gC
rise
sac
ross
Diff
eren
tH
oriz
ons
-12
-11
-10
-9-8
-7-6
-5-4
-3-2
-1F
in.
Ind
ex0.7
1∗
0.7
20.7
20.7
30.7
4∗
0.7
10.6
90.7
10.7
50.7
70.8
1∗
0.8
4∗∗
CG
G*
0.6
00.6
00.6
00.6
10.6
20.6
50.6
60.7
00.7
20.7
20.7
40.7
4L
PS
Ind
ex0.7
2∗
0.7
5∗
0.7
3∗∗
0.7
3∗
0.7
3∗
0.7
40.7
30.7
30.7
30.7
50.7
70.7
7L
PS
2In
dex
0.7
6∗∗
0.7
8∗∗
0.7
9∗∗
∗0.7
9∗∗
∗0.7
9∗∗
∗0.8
0∗
0.8
0∗∗
∗0.8
0∗∗
0.8
0∗
0.8
1∗
0.7
90.7
9C
GG
0.6
00.6
10.6
00.6
10.6
20.6
40.6
50.6
90.7
20.7
20.7
40.7
5
Note
.E
ach
row
sign
ifies
the
hori
zon
inw
hic
hb
an
kin
gcr
ises
are
pre
dic
ted
,w
hic
hra
nges
from
12
qu
art
ers
ah
ead
to1
qu
art
erb
efore
the
on
set
of
ban
kin
gcr
ises
.F
in.
Index
isth
eF
inan
cial
Sec
tor
Vu
lner
ab
ilit
yIn
dex
;C
GG
isth
eC
red
it-t
o-G
DP
gap
;L
PS
Ind
exis
the
aggre
gate
din
dex
of
the
five
vu
lner
ab
ilit
yco
mp
on
ents
(Fin
an
cial
Sec
tor,
Non
fin
an
cial
Sec
tor,
Exte
rnal
Sec
tor,
Sover
eign
,an
dV
alu
ati
on
Pre
ssu
reV
uln
erab
ilit
ies)
;L
PS
2In
dex
isth
eaggre
gate
din
dex
of
fou
rvu
lner
ab
ilit
yco
mp
on
ents
that
excl
ud
esth
eso
ver
eign
vu
lner
ab
ilit
yco
mp
on
ent.
Th
eF
in.
Ind
exis
com
pare
dto
the
CG
G*,
wh
ich
use
sa
more
lim
ited
sam
ple
than
wh
enco
mp
ari
ng
LP
San
dL
PS
2In
dex
esw
ith
CG
G.
Diff
eren
ces
bet
wee
nan
ind
exan
dth
eC
GG
are
sign
ifica
nt
acc
ord
ing
toth
efo
llow
ing
crit
erio
n–∗p<
.1,∗∗
p<
.05,∗∗
∗p<
.01.
51

Table 3: Output Loss and Financial Vulnerability Measures
(1) (2) (3) (4) (5) (6)Fin. Index 34.5
(0.86)LPS Index 53.2∗∗ 46.1∗
(2.22) (1.75)LPS2 Index 60.2∗∗ 53.0∗
(2.33) (1.88)CGG 0.40 0.21 0.20
(0.98) (0.51) (0.49)Constant 8.84 −2.11 −9.64 −18.17 −0.05 −7.13
(0.29) (−0.12) (−0.50) (−1.07) (−0.00) (−0.35)Obs. 23 27 27 26 26 26R-sq. adj. −0.01 0.13 0.15 −0.00 0.08 0.09
Note. The explained variable: output loss for three years after a banking crisis.The explanatory variables: The Fin. Index is the aggregated financial sectorvulnerability index; the LPS Index, which is an aggregate index of financialsector, nonfinancial sector, external sector, sovereign, and valuation pressurevulnerabilities; the LPS2 Index is an aggregate index of the financial sector,nonfinancial sector, external sector, and valuation pressure vulnerabilities; theCGG is the Credit-to-GDP gap. t statistics in parentheses. ∗ p < .1, ∗∗ p < .05,∗∗∗ p < .01
52

Table 4: Length of Recession and Financial Vulnerability Measures
(1) (2) (3) (4) (5) (6)Fin. Index −0.55
(−0.39)LPS Index 2.14∗ 2.36
(1.86) (1.58)LPS2 Index 2.94∗∗ 3.50∗∗
(2.46) (1.88)CGG 0.01 −0.01 −0.02
(0.44) (−0.29) (−0.64)Constant 5.02∗∗∗ 3.26∗∗∗ 2.76∗∗∗ 4.48∗∗∗ 3.32∗∗∗ 2.62∗∗∗
(5.67) (4.56) (3.58) (13.02) (3.79) (2.88)Obs. 87 103 101 104 92 82R-sq. adj. −0.01 0.02 0.05 −0.01 0.01 0.04
Note. The explained variable: length of the recession as defined by Howard, Martin, and Wilson (2011)where it is defined as the duration between the peak and trough of the relevant economic activity. Theexplanatory variables: The Fin. Index is the aggregated financial sector vulnerability index; the LPS Index,which is an aggregate index of financial sector, nonfinancial sector, external sector, sovereign, and valuationpressure vulnerabilities; the LPS2 Index is an aggregate index of the financial sector, nonfinancial sector,external sector, and valuation pressure vulnerabilities; the CGG is the Credit-to-GDP gap. t statistics inparentheses. ∗ p < .1, ∗∗ p < .05, ∗∗∗ p < .01
53

Table 5: Depth of Recession and Financial Vulnerability Measures
(1) (2) (3) (4) (5) (6)Fin. Index 0.00
(0.28)LPS Index 0.02 0.00
(1.05) (0.23)LPS2 Index 0.03∗ 0.03
(1.95) (1.36)CGG 0.00 0.00 0.00
(1.20) (0.92) (0.41)Constant 0.04∗∗∗ 0.03∗∗∗ 0.03∗∗∗ 0.04∗∗∗ 0.04∗∗∗ 0.03∗∗
(3.80) (3.68) (3.58) (9.86) (3.69) (2.48)Obs. 87 103 101 104 92 82R-sq. adj. −0.01 0.00 0.03 0.00 −0.01 0.01
Note. The explained variable: the depth of a recession as defined by Howard, Martin, and Wilson(2011), which it is defined as the output loss from peak to trough of the relevant economic activity. Theexplanatory variables: The Fin. Index is the aggregated financial sector vulnerability index; the LPSIndex, which is an aggregate index of financial sector, nonfinancial sector, external sector, sovereign,and valuation pressure vulnerabilities; the LPS2 Index is an aggregate index of the financial sector,nonfinancial sector, external sector, and valuation pressure vulnerabilities; the CGG is the Credit-to-GDP gap. t statistics in parentheses. ∗ p < .1, ∗∗ p < .05, ∗∗∗ p < .01
54

Austrailia
Vulnerability Category Variables Data Start Date Frequency Sign* Detrend Source of Data
Financial Sector
Banking
Leverage Total equity over total assets 2004Q2 Quarterly - Australian Prudential Regulation Authority
Bank-provided credit to GDP 1959Q3 Quarterly + Y BIS Credit Series
Maturity transformation Loans to deposits 2004Q2 Quarterly + Australian Prudential Regulation Authority
Wholesale funding MFI liabilities to total assets 2004Q2 Quarterly + Australian Prudential Regulation Authority
Interconnectedness Cross-border claims to assets 2004Q2 Quarterly + BIS Locational Banking Statistics and Australian Prudential Regulation Authority
Nonbanking
Leverage Nonbank-provided credit to GDP 1959Q3 Quarterly + Y BIS Credit Series
Nonfinancial sector
Household leverage Household credit to GDP 1977Q4 Quarterly + Y BIS Credit Series
Household debt service ratio 1999Q1 Quarterly BIS debt service ratios for the private nonfinancial sector
Corporate leverage Corporate leverage 90th percentile 2005Q1 Quarterly + S&P Capital IQ
Aggregated corporate leverage 2005Q1 Quarterly + S&P Capital IQ
Interest rate coverage ratio 2005Q1 Quarterly - S&P Capital IQ
Corporate debt to GDP 1977Q4 Quarterly + Y BIS Credit Series
Nonfinancial corporation debt service ratio 1999Q1 Quarterly + BIS debt service ratios for the private nonfinancial sector
Sovereign vulnerabilities
Government debt to GDP 1989 Annual + Y OECD
Government fiscal balance to GDP 1989 Annual - OECD
Government revenue to GDP 1997 Annual - Moody’s
Government interest to revenue 1997 Annual + Moody’s
External sector vulnerabilities
External debt to GDP 1988Q3 Quarterly + Y Haver
Current account balance to GDP 1959Q3 Quarterly - Haver
Reserves to GDP 1959Q3 Quarterly - International Financial Statistics
Valuation pressures
Housing market Nominal house price to income 1975Q1 Quarterly + Dallas Fed cross-country housing price database
Price to rent 1972Q3 Quarterly + Dallas Fed cross-country housing price database
Equity market Price to earnings ratio January 2006 Monthly + Thomson Reuters I/B/E/S Aggregates
Dividend yield July 1993 Monthly - Bloomberg
Junk bond issuance Corporate junk bond issuance January 1980 Monthly + Thomson Reuters
Note: Sign* signifies the direction of the variable in which vulnerabilities increase. For example, “+” indicates that larger values of the variable are associated with more elevated vulnerabilities. For variables with a
“Y” in the “detrend” column, we use the detrended series based on the difference between the current value and the ten-year moving average.
55
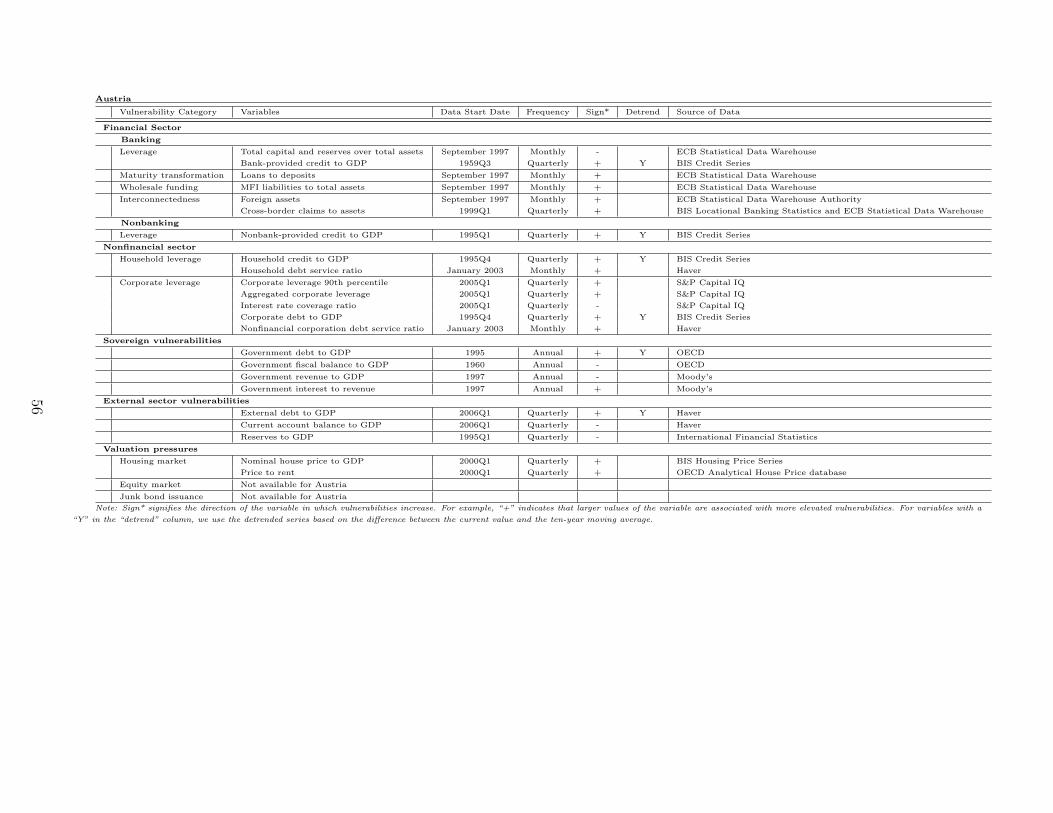
Austria
Vulnerability Category Variables Data Start Date Frequency Sign* Detrend Source of Data
Financial Sector
Banking
Leverage Total capital and reserves over total assets September 1997 Monthly - ECB Statistical Data Warehouse
Bank-provided credit to GDP 1959Q3 Quarterly + Y BIS Credit Series
Maturity transformation Loans to deposits September 1997 Monthly + ECB Statistical Data Warehouse
Wholesale funding MFI liabilities to total assets September 1997 Monthly + ECB Statistical Data Warehouse
Interconnectedness Foreign assets September 1997 Monthly + ECB Statistical Data Warehouse Authority
Cross-border claims to assets 1999Q1 Quarterly + BIS Locational Banking Statistics and ECB Statistical Data Warehouse
Nonbanking
Leverage Nonbank-provided credit to GDP 1995Q1 Quarterly + Y BIS Credit Series
Nonfinancial sector
Household leverage Household credit to GDP 1995Q4 Quarterly + Y BIS Credit Series
Household debt service ratio January 2003 Monthly + Haver
Corporate leverage Corporate leverage 90th percentile 2005Q1 Quarterly + S&P Capital IQ
Aggregated corporate leverage 2005Q1 Quarterly + S&P Capital IQ
Interest rate coverage ratio 2005Q1 Quarterly - S&P Capital IQ
Corporate debt to GDP 1995Q4 Quarterly + Y BIS Credit Series
Nonfinancial corporation debt service ratio January 2003 Monthly + Haver
Sovereign vulnerabilities
Government debt to GDP 1995 Annual + Y OECD
Government fiscal balance to GDP 1960 Annual - OECD
Government revenue to GDP 1997 Annual - Moody’s
Government interest to revenue 1997 Annual + Moody’s
External sector vulnerabilities
External debt to GDP 2006Q1 Quarterly + Y Haver
Current account balance to GDP 2006Q1 Quarterly - Haver
Reserves to GDP 1995Q1 Quarterly - International Financial Statistics
Valuation pressures
Housing market Nominal house price to GDP 2000Q1 Quarterly + BIS Housing Price Series
Price to rent 2000Q1 Quarterly + OECD Analytical House Price database
Equity market Not available for Austria
Junk bond issuance Not available for Austria
Note: Sign* signifies the direction of the variable in which vulnerabilities increase. For example, “+” indicates that larger values of the variable are associated with more elevated vulnerabilities. For variables with a
“Y” in the “detrend” column, we use the detrended series based on the difference between the current value and the ten-year moving average.
56

Belgium
Vulnerability Category Variables Data Start Date Frequency Sign* Detrend Source of Data
Financial Sector
Banking
Leverage Total capital and reserves over total assets September 1997 Monthly - ECB Statistical Data Warehouse
Bank-provided credit to GDP 1980Q1 Quarterly + Y BIS Credit Series
Maturity transformation Loans to deposits September 1997 Monthly + ECB Statistical Data Warehouse
Wholesale funding MFI liabilities to total assets September 1997 Monthly + ECB Statistical Data Warehouse
Interconnectedness Foreign assets September 1997 Monthly + ECB Statistical Data Warehouse Authority
Cross-border claims to assets 1999Q1 Quarterly + BIS Locational Banking Statistics and ECB Statistical Data Warehouse
Nonbanking
Leverage Nonbank-provided credit to GDP 1980Q1 Quarterly + Y BIS Credit Series
Nonfinancial sector
Household leverage Household credit to GDP 1980Q4 Quarterly + Y BIS Credit Series
Household debt service ratio 1999Q1 Quarterly + BIS debt service ratios for the private nonfinancial sector
Corporate leverage Corporate leverage 90th percentile 2005Q1 Quarterly + S&P Capital IQ
Aggregated corporate leverage 2005Q1 Quarterly + S&P Capital IQ
Interest rate coverage ratio 2005Q1 Quarterly - S&P Capital IQ
Corporate debt to GDP 1980Q4 Quarterly + Y BIS Credit Series
Nonfinancial corporation debt service ratio 1999Q1 Quarterly + BIS debt service ratios for the private nonfinancial sector
Sovereign vulnerabilities
Government debt to GDP 1969 Annual + Y OECD
Government fiscal balance to GDP 1970 Annual - OECD
Government revenue to GDP 1997 Annual - Moody’s
Government interest to revenue 1997 Annual + Moody’s
External sector vulnerabilities
External debt to GDP 2003Q1 Quarterly + Y Haver
Current account balance to GDP 1995Q1 Quarterly - Haver
Reserves to GDP 1980Q1 Quarterly - International Financial Statistics
Valuation pressures
Housing market Nominal house price to income 1975Q1 Quarterly + Dallas Fed cross-country housing price database
Price to rent 1976Q2 Quarterly + OECD Analytical House Price database
Equity market Dividend yield June 1993 Monthly - Bloomberg
Junk bond issuance Corporate junk bond issuance January 1980 Monthly + Thomson Reuters
Note: Sign* signifies the direction of the variable in which vulnerabilities increase. For example, “+” indicates that larger values of the variable are associated with more elevated vulnerabilities. For variables with a
“Y” in the “detrend” column, we use the detrended series based on the difference between the current value and the ten-year moving average.
57
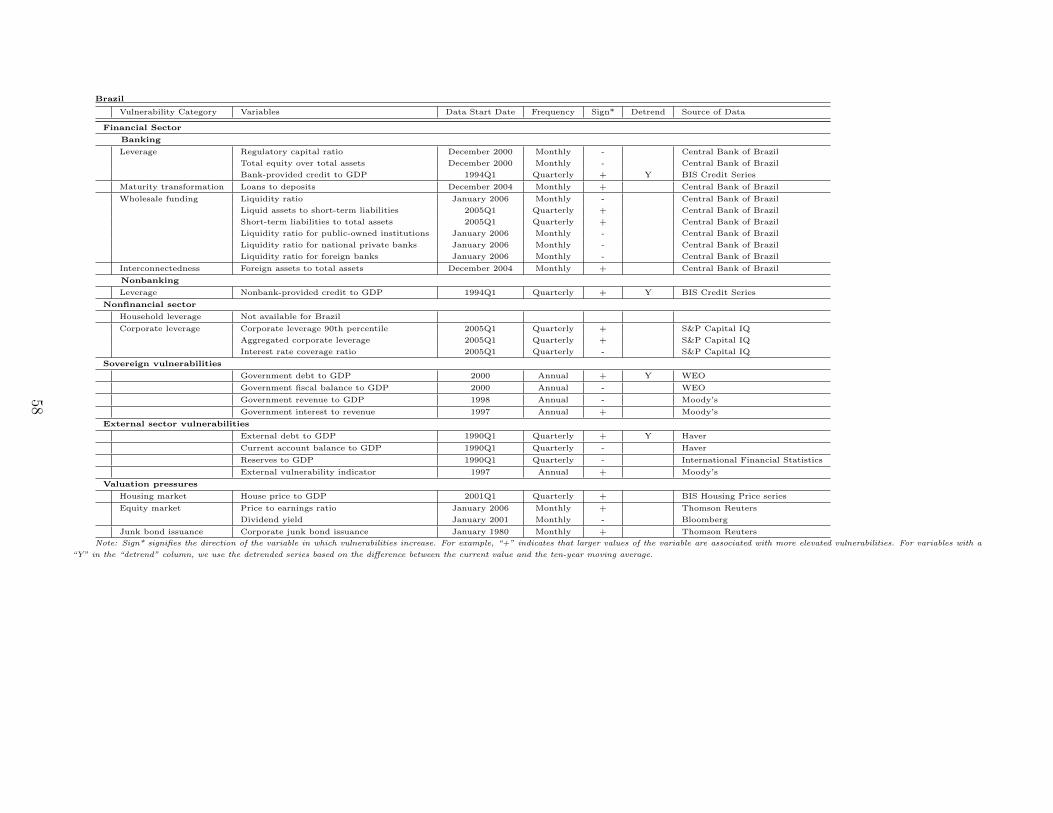
Brazil
Vulnerability Category Variables Data Start Date Frequency Sign* Detrend Source of Data
Financial Sector
Banking
Leverage Regulatory capital ratio December 2000 Monthly - Central Bank of Brazil
Total equity over total assets December 2000 Monthly - Central Bank of Brazil
Bank-provided credit to GDP 1994Q1 Quarterly + Y BIS Credit Series
Maturity transformation Loans to deposits December 2004 Monthly + Central Bank of Brazil
Wholesale funding Liquidity ratio January 2006 Monthly - Central Bank of Brazil
Liquid assets to short-term liabilities 2005Q1 Quarterly + Central Bank of Brazil
Short-term liabilities to total assets 2005Q1 Quarterly + Central Bank of Brazil
Liquidity ratio for public-owned institutions January 2006 Monthly - Central Bank of Brazil
Liquidity ratio for national private banks January 2006 Monthly - Central Bank of Brazil
Liquidity ratio for foreign banks January 2006 Monthly - Central Bank of Brazil
Interconnectedness Foreign assets to total assets December 2004 Monthly + Central Bank of Brazil
Nonbanking
Leverage Nonbank-provided credit to GDP 1994Q1 Quarterly + Y BIS Credit Series
Nonfinancial sector
Household leverage Not available for Brazil
Corporate leverage Corporate leverage 90th percentile 2005Q1 Quarterly + S&P Capital IQ
Aggregated corporate leverage 2005Q1 Quarterly + S&P Capital IQ
Interest rate coverage ratio 2005Q1 Quarterly - S&P Capital IQ
Sovereign vulnerabilities
Government debt to GDP 2000 Annual + Y WEO
Government fiscal balance to GDP 2000 Annual - WEO
Government revenue to GDP 1998 Annual - Moody’s
Government interest to revenue 1997 Annual + Moody’s
External sector vulnerabilities
External debt to GDP 1990Q1 Quarterly + Y Haver
Current account balance to GDP 1990Q1 Quarterly - Haver
Reserves to GDP 1990Q1 Quarterly - International Financial Statistics
External vulnerability indicator 1997 Annual + Moody’s
Valuation pressures
Housing market House price to GDP 2001Q1 Quarterly + BIS Housing Price series
Equity market Price to earnings ratio January 2006 Monthly + Thomson Reuters
Dividend yield January 2001 Monthly - Bloomberg
Junk bond issuance Corporate junk bond issuance January 1980 Monthly + Thomson Reuters
Note: Sign* signifies the direction of the variable in which vulnerabilities increase. For example, “+” indicates that larger values of the variable are associated with more elevated vulnerabilities. For variables with a
“Y” in the “detrend” column, we use the detrended series based on the difference between the current value and the ten-year moving average.
58

Canada
Vulnerability Category Variables Data Start Date Frequency Sign* Detrend Source of Data
Financial Sector
Banking
Leverage Total equity over total assets November 1981 Monthly - Haver
Bank-provided credit to GDP 1961Q1 Quarterly + Y BIS Credit Series
Maturity transformation Loans to deposits November 1981 Monthly + Haver
Wholesale funding MFI Liabilities to total assets January 1999 Monthly + Haver and Bank of Canada
Interconnectedness Foreign assets to total assets 1978Q2 Quarterly + Haver and Bank of Canada
Nonbanking
Leverage Nonbank-provided credit to GDP 1961Q1 Quarterly + Y BIS Credit Series
Nonfinancial sector
Household leverage Household credit to GDP 1969Q1 Quarterly + Y BIS Credit Series
Household debt service ratio 2005Q1 Quarterly + BIS debt service ratios for the private nonfinancial sector
Corporate leverage Corporate leverage 90th percentile 2005Q1 Quarterly + S&P Capital IQ
Aggregated corporate leverage 2005Q1 Quarterly + S&P Capital IQ
Interest rate coverage ratio 2005Q1 Quarterly - S&P Capital IQ
Corporate debt to GDP 1969Q1 Quarterly + Y BIS Credit Series
Nonfinancial corporation debt service ratio 1999Q1 Quarterly + BIS debt service ratios for the private nonfinancial sector
Sovereign vulnerabilities
Government debt to GDP 1970Q1 Quarterly + Y OECD
Government fiscal balance to GDP 1970 Annual - OECD
Government revenue to GDP 1997 Annual - Moody’s
Government interest to revenue 1997 Annual + Moody’s
External sector vulnerabilities
External debt to GDP 2002Q4 Quarterly + Y Haver
Current account balance to GDP 1981Q1 Quarterly - Haver
Reserves to GDP 1961Q1 Quarterly - International Financial Statistics
Valuation pressures
Housing market Nominal house price to income 1975Q1 Quarterly + Dallas Fed cross-country housing price database
Price to rent 1970Q1 Quarterly + OECD Analytical House Price Database
Equity market Price to earnings ratio January 2006 Monthly + Thomson Reuters
Dividend yield June 1993 Monthly - Bloomberg
Junk bond issuance Corporate junk bond issuance January 1980 Monthly + Thomson Reuters
Note: Sign* signifies the direction of the variable in which vulnerabilities increase. For example, “+” indicates that larger values of the variable are associated with more elevated vulnerabilities. For variables with a
“Y” in the “detrend” column, we use the detrended series based on the difference between the current value and the ten-year moving average.
59

China
Vulnerability Category Variables Data Start Date Frequency Sign* Detrend Source of Data
Financial Sector
Banking
Leverage Total equity over total assets January 2006 Monthly - Haver
Bank-provided credit to GDP 1992Q1 Quarterly + Y BIS Credit Series
Maturity transformation Loans to deposits January 2008 Monthly + Haver
Wholesale funding MFI Liabilities to total assets January 2006 Monthly + Haver
Interconnectedness Foreign assets to total assets January 2006 Monthly + Haver
Nonbanking
Leverage Nonbank-provided credit to GDP 1992Q1 Quarterly + Y BIS Credit Series
Nonfinancial sector
Household leverage Household credit to GDP 2006Q1 Quarterly + Y BIS Credit Series
Corporate leverage Corporate leverage 90th percentile 2005Q1 Quarterly + S&P Capital IQ
Aggregated corporate leverage 2005Q1 Quarterly + S&P Capital IQ
Interest rate coverage ratio 2005Q1 Quarterly - S&P Capital IQ
Corporate debt to GDP 2006Q1 Quarterly + Y BIS Credit Series
Sovereign vulnerabilities
Government debt to GDP 1995 Annual + Y WEO
Government fiscal balance to GDP 1995 Annual - WEO
Government revenue to GDP 1997 Annual + Moody’s
Government interest to revenue 1997 Annual + Moody’s
External sector vulnerabilities
External debt to GDP 2003Q2 Quarterly + Y CEIC
Current account balance to GDP 1981Q1 Quarterly - Haver
Reserves to GDP 1992Q1 Quarterly - International Financial Statistics
External vulnerability indicator 1997 Annual + Moody’s
Valuation pressures
Housing market House price to income 1996Q4 Quarterly + Economist and Thomson Reuters
Price to rent 2001Q1 Quarterly + Economist and Thomson Reuters
Equity market Price to earnings ratio January 2006 Monthly + Thomson Reuters
Dividend yield December 1997 Monthly - Bloomberg
Junk bond issuance Corporate junk bond issuance January 1980 Monthly + Thomson Reuters
Note: Sign* signifies the direction of the variable in which vulnerabilities increase. For example, “+” indicates that larger values of the variable are associated with more elevated vulnerabilities. For variables with a
“Y” in the “detrend” column, we use the detrended series based on the difference between the current value and the ten-year moving average.
60

Denmark
Vulnerability Category Variables Data Start Date Frequency Sign* Detrend Source of Data
Financial Sector
Banking
Leverage Total capital and reserves over total assets July 2000 Monthly - ECB Statistical Data Warehouse
Bank-provided credit to GDP 1990Q1 Quarterly + Y BIS Credit Series
Maturity transformation Loans to deposits July 2000 Monthly + ECB Statistical Data Warehouse
Wholesale funding MFI Liabilities to total assets July 2000 Monthly + ECB Statistical Data Warehouse
Interconnectedness Cross-border claims to assets 2000Q3 Quarterly + BIS Locational Banking Statistics and ECB Statistical Data Warehouse
Nonbanking
Leverage Nonbank-provided credit to GDP 1990Q1 Quarterly + Y BIS Credit Series
Nonfinancial sector
Household leverage Household credit to GDP 1994Q4 Quarterly + Y BIS Credit Series
Household debt service ratio 1999Q1 Quarterly + BIS debt service ratios for the private nonfinancial sector
Corporate leverage Corporate leverage 90th percentile 2005Q1 Quarterly + S&P Capital IQ
Aggregated corporate leverage 2005Q1 Quarterly + S&P Capital IQ
Interest rate coverage ratio 2005Q1 Quarterly - S&P Capital IQ
Corporate debt to GDP 1994Q4 Quarterly + Y BIS Credit Series
Nonfinancial corporation debt service ratio 1999Q1 Quarterly + BIS debt service ratios for the private nonfinancial sector
Sovereign vulnerabilities
Government debt to GDP 1980 Annual + Y OECD
Government fiscal balance to GDP 1971 Annual - OECD
Government revenue to GDP 1997 Annual - Moody’s
Government interest to revenue 1997 Annual + Moody’s
External sector vulnerabilities
External debt to GDP 2003Q1 Quarterly + Y Haver
Current account balance to GDP 1997Q1 Quarterly - Haver
Reserves to GDP 1957Q1 Quarterly - International Financial Statistics
Valuation pressures
Housing market Nominal house price to income 1975Q1 Quarterly + Dallas Fed cross-country housing price database
Price to rent 1970Q1 Quarterly + OECD Analytical House Price database
Equity market Dividend yield July 2001 Monthly - Bloomberg
Junk bond issuance Corporate junk bond issuance January 2003 Monthly + Thomson Reuters
Note: Sign* signifies the direction of the variable in which vulnerabilities increase. For example, “+” indicates that larger values of the variable are associated with more elevated vulnerabilities. For variables with a
“Y” in the “detrend” column, we use the detrended series based on the difference between the current value and the ten-year moving average.
61
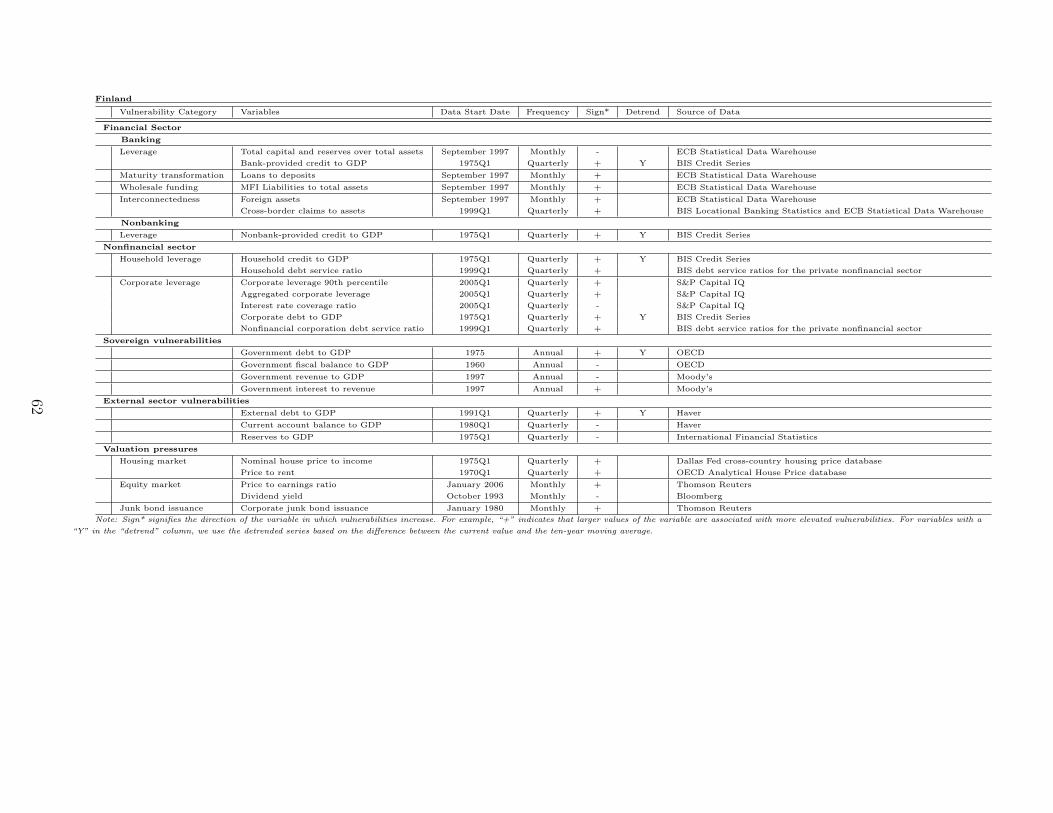
Finland
Vulnerability Category Variables Data Start Date Frequency Sign* Detrend Source of Data
Financial Sector
Banking
Leverage Total capital and reserves over total assets September 1997 Monthly - ECB Statistical Data Warehouse
Bank-provided credit to GDP 1975Q1 Quarterly + Y BIS Credit Series
Maturity transformation Loans to deposits September 1997 Monthly + ECB Statistical Data Warehouse
Wholesale funding MFI Liabilities to total assets September 1997 Monthly + ECB Statistical Data Warehouse
Interconnectedness Foreign assets September 1997 Monthly + ECB Statistical Data Warehouse
Cross-border claims to assets 1999Q1 Quarterly + BIS Locational Banking Statistics and ECB Statistical Data Warehouse
Nonbanking
Leverage Nonbank-provided credit to GDP 1975Q1 Quarterly + Y BIS Credit Series
Nonfinancial sector
Household leverage Household credit to GDP 1975Q1 Quarterly + Y BIS Credit Series
Household debt service ratio 1999Q1 Quarterly + BIS debt service ratios for the private nonfinancial sector
Corporate leverage Corporate leverage 90th percentile 2005Q1 Quarterly + S&P Capital IQ
Aggregated corporate leverage 2005Q1 Quarterly + S&P Capital IQ
Interest rate coverage ratio 2005Q1 Quarterly - S&P Capital IQ
Corporate debt to GDP 1975Q1 Quarterly + Y BIS Credit Series
Nonfinancial corporation debt service ratio 1999Q1 Quarterly + BIS debt service ratios for the private nonfinancial sector
Sovereign vulnerabilities
Government debt to GDP 1975 Annual + Y OECD
Government fiscal balance to GDP 1960 Annual - OECD
Government revenue to GDP 1997 Annual - Moody’s
Government interest to revenue 1997 Annual + Moody’s
External sector vulnerabilities
External debt to GDP 1991Q1 Quarterly + Y Haver
Current account balance to GDP 1980Q1 Quarterly - Haver
Reserves to GDP 1975Q1 Quarterly - International Financial Statistics
Valuation pressures
Housing market Nominal house price to income 1975Q1 Quarterly + Dallas Fed cross-country housing price database
Price to rent 1970Q1 Quarterly + OECD Analytical House Price database
Equity market Price to earnings ratio January 2006 Monthly + Thomson Reuters
Dividend yield October 1993 Monthly - Bloomberg
Junk bond issuance Corporate junk bond issuance January 1980 Monthly + Thomson Reuters
Note: Sign* signifies the direction of the variable in which vulnerabilities increase. For example, “+” indicates that larger values of the variable are associated with more elevated vulnerabilities. For variables with a
“Y” in the “detrend” column, we use the detrended series based on the difference between the current value and the ten-year moving average.
62

France
Vulnerability Category Variables Data Start Date Frequency Sign* Detrend Source of Data
Financial Sector
Banking
Leverage Total capital and reserves over total assets September 1997 Monthly - ECB Statistical Data Warehouse
Bank-provided credit to GDP 1969Q4 Quarterly + Y BIS Credit Series
Maturity transformation Loans to deposits September 1997 Monthly + ECB Statistical Data Warehouse
Wholesale funding MFI Liabilities to total assets September 1997 Monthly + ECB Statistical Data Warehouse
Interconnectedness Foreign assets September 1997 Monthly + ECB Statistical Data Warehouse
Cross-border claims to assets 1999Q1 Quarterly + BIS Locational Banking Statistics and ECB Statistical Data Warehouse
Nonbanking
Leverage Nonbank-provided credit to GDP 1969Q4 Quarterly + Y BIS Credit Series
Nonfinancial sector
Household leverage Household credit to GDP 1977Q4 Quarterly + Y BIS Credit Series
Household debt service ratio 1999Q1 Quarterly + BIS debt service ratios for the private nonfinancial sector
Corporate leverage Corporate leverage 90th percentile 2005Q1 Quarterly + S&P Capital IQ
Aggregated corporate leverage 2005Q1 Quarterly + S&P Capital IQ
Interest rate coverage ratio 2005Q1 Quarterly - S&P Capital IQ
Corporate debt to GDP 1969Q1 Quarterly + Y BIS Credit Series
Nonfinancial corporation debt service ratio 1999Q1 Quarterly + BIS debt service ratios for the private nonfinancial sector
Sovereign vulnerabilities
Government debt to GDP 1969 Annual + Y OECD
Government fiscal balance to GDP 1978 Annual - OECD
Government revenue to GDP 1997 Annual - Moody’s
Government interest to revenue 1997 Annual + Moody’s
External sector vulnerabilities
External debt to GDP 2008Q1 Quarterly + Y Haver
Current account balance to GDP 2008Q1 Quarterly - Haver
Reserves to GDP 1975Q1 Quarterly - International Financial Statistics
Valuation pressures
Housing market Nominal house price to income 1975Q1 Quarterly + Dallas Fed cross-country housing price database
Price to rent 1970Q1 Quarterly + OECD Analytical House Price database
Equity market Price to earnings ratio January 2006 Monthly + Thomson Reuters
Dividend yield January 1994 Monthly - Bloomberg
Junk bond issuance Corporate junk bond issuance January 1980 Monthly + Thomson Reuters
Note: Sign* signifies the direction of the variable in which vulnerabilities increase. For example, “+” indicates that larger values of the variable are associated with more elevated vulnerabilities. For variables with a
“Y” in the “detrend” column, we use the detrended series based on the difference between the current value and the ten-year moving average.
63

Germany
Vulnerability Category Variables Data Start Date Frequency Sign* Detrend Source of Data
Financial Sector
Banking
Leverage Total capital and reserves over total assets September 1997 Monthly - ECB Statistical Data Warehouse
Bank-provided credit to GDP 1960Q1 Quarterly + Y BIS Credit Series
Maturity transformation Loans to deposits September 1997 Monthly + ECB Statistical Data Warehouse
Wholesale funding MFI Liabilities to total assets September 1997 Monthly + ECB Statistical Data Warehouse
Interconnectedness Foreign assets September 1997 Monthly + ECB Statistical Data Warehouse
Cross-border claims to assets 1999Q1 Quarterly + BIS Locational Banking Statistics and ECB Statistical Data Warehouse
Nonbanking
Leverage Nonbank-provided credit to GDP 1960Q1 Quarterly + Y BIS Credit Series
Nonfinancial sector
Household leverage Household credit to GDP 1970Q4 Quarterly + Y BIS Credit Series
Household debt service ratio 1999Q1 Quarterly + BIS debt service ratios for the private nonfinancial sector
Corporate leverage Corporate leverage 90th percentile 2005Q1 Quarterly + S&P Capital IQ
Aggregated corporate leverage 2005Q1 Quarterly + S&P Capital IQ
Interest rate coverage ratio 2005Q1 Quarterly - S&P Capital IQ
Corporate debt to GDP 1970Q4 Quarterly + Y BIS Credit Series
Nonfinancial corporation debt service ratio 1999Q1 Quarterly + BIS debt service ratios for the private nonfinancial sector
Sovereign vulnerabilities
Government debt to GDP 1991 Annual + Y OECD
Government fiscal balance to GDP 1991 Annual - OECD
Government revenue to GDP 1997 Annual - Moody’s
Government interest to revenue 1997 Annual + Moody’s
External sector vulnerabilities
External debt to GDP 1999Q2 Quarterly + Y Haver
Current account balance to GDP 1971Q1 Quarterly - Haver
Reserves to GDP 1960Q1 Quarterly - International Financial Statistics
Valuation pressures
Housing market Nominal house price to income 1975Q1 Quarterly + Dallas Fed cross-country housing price database
Price to rent 1970Q1 Quarterly + OECD Analytical House Price database
Equity market Price to earnings ratio January 2006 Monthly + Thomson Reuters
Dividend yield January 1997 Monthly - Bloomberg
Junk bond issuance Corporate junk bond issuance January 1980 Monthly + Thomson Reuters
Note: Sign* signifies the direction of the variable in which vulnerabilities increase. For example, “+” indicates that larger values of the variable are associated with more elevated vulnerabilities. For variables with a
“Y” in the “detrend” column, we use the detrended series based on the difference between the current value and the ten-year moving average.
64

Greece
Vulnerability Category Variables Data Start Date Frequency Sign* Detrend Source of Data
Financial Sector
Banking
Leverage Total capital and reserves over total assets March 1998 Monthly - ECB Statistical Data Warehouse
Bank-provided credit to GDP 1995Q1 Quarterly + Y BIS Credit Series
Maturity transformation Loans to deposits March 1998 Monthly + ECB Statistical Data Warehouse
Wholesale funding MFI Liabilities to total assets March 1998 Monthly + ECB Statistical Data Warehouse
Interconnectedness Foreign assets March 1998 Monthly + ECB Statistical Data Warehouse
Cross-border claims to assets 1999Q1 Quarterly + BIS Locational Banking Statistics and ECB Statistical Data Warehouse
Nonbanking
Leverage Nonbank-provided credit to GDP 1995Q1 Quarterly + Y BIS Credit Series
Nonfinancial sector
Household leverage Household credit to GDP 1995Q1 Quarterly + Y BIS Credit Series
Household debt service ratio January 2006 Monthly + Haver
Corporate leverage Corporate leverage 90th percentile 2005Q1 Quarterly + S&P Capital IQ
Aggregated corporate leverage 2005Q1 Quarterly + S&P Capital IQ
Interest rate coverage ratio 2005Q1 Quarterly - S&P Capital IQ
Corporate debt to GDP 1995Q1 Quarterly + Y BIS Credit Series
Nonfinancial corporation debt service ratio January 2006 Monthly + Haver
Sovereign vulnerabilities
Government debt to GDP 1995 Annual + Y OECD
Government fiscal balance to GDP 1995 Annual - OECD
Government revenue to GDP 1997 Annual - Moody’s
Government interest to revenue 1997 Annual + Moody’s
External sector vulnerabilities
External debt to GDP 2008Q4 Quarterly + Y Haver
Current account balance to GDP 1997Q1 Quarterly - Haver
Reserves to GDP 1995Q1 Quarterly - International Financial Statistics
Valuation pressures
Housing market Nominal house price to income 2006Q1 Quarterly + BIS Housing Price Series
Price to rent 1997Q1 Quarterly + OECD Analytical House Price database
Equity market Dividend yield May 1999 Monthly - Bloomberg
Junk bond issuance Corporate junk bond issuance January 1980 Monthly + Thomson Reuters
Note: Sign* signifies the direction of the variable in which vulnerabilities increase. For example, “+” indicates that larger values of the variable are associated with more elevated vulnerabilities. For variables with a
“Y” in the “detrend” column, we use the detrended series based on the difference between the current value and the ten-year moving average.
65

Hong Kong
Vulnerability Category Variables Data Start Date Frequency Sign* Detrend Source of Data
Financial Sector
Banking
Leverage Total capital and reserves over total assets December 1993 Monthly - Haver
Bank-provided credit to GDP 1978Q4 Quarterly + Y BIS Credit Series
Maturity transformation Loans to deposits December 1993 Monthly + Haver
Wholesale funding MFI Liabilities to total assets December 1993 Monthly + Haver
Interconnectedness Foreign assets to total assets December 1993 Monthly + Haver
Nonbanking
Leverage Nonbank-provided credit to GDP 1978Q4 Quarterly + Y BIS Credit Series
Nonfinancial sector
Household leverage Household credit to GDP 1990Q4 Quarterly + Y BIS Credit Series
Corporate leverage Corporate leverage 90th percentile 2005Q1 Quarterly + S&P Capital IQ
Aggregated corporate leverage 2005Q1 Quarterly + S&P Capital IQ
Interest rate coverage ratio 2005Q1 Quarterly - S&P Capital IQ
Corporate debt to GDP 1990Q4 Quarterly + Y BIS Credit Series
Sovereign vulnerabilities
Government debt to GDP 2001Q1 Quarterly + Y WEO
Government fiscal balance to GDP 1985Q1 Quarterly - WEO
Government revenue to GDP 1997Q1 Quarterly - Moody’s
Government interest to revenue 1997 Annual + Moody’s
External sector vulnerabilities
External debt to GDP 2002Q1 Quarterly + Y Haver
Current account balance to GDP 1999Q1 Quarterly - Haver
Reserves to GDP 1970Q1 Quarterly - International Financial Statistics
Valuation pressures
Housing market Nominal house price to GDP 1993Q1 Quarterly + BIS Housing Price Series
Equity market Price to earnings ratio January 2006 Monthly + Thomson Reuters
Dividend yield October 1993 Monthly - Bloomberg
Junk bond issuance Corporate junk bond issuance January 1980 Monthly + Thomson Reuters
Note: Sign* signifies the direction of the variable in which vulnerabilities increase. For example, “+” indicates that larger values of the variable are associated with more elevated vulnerabilities. For variables with a
“Y” in the “detrend” column, we use the detrended series based on the difference between the current value and the ten-year moving average.
66

Ireland
Vulnerability Category Variables Data Start Date Frequency Sign* Detrend Source of Data
Financial Sector
Banking
Leverage Total capital and reserves over total assets September 1997 Monthly - ECB Statistical Data Warehouse
Bank-provided credit to GDP 1990Q1 Quarterly + Y BIS Credit Series
Maturity transformation Loans to deposits September 1997 Monthly + ECB Statistical Data Warehouse
Wholesale funding MFI Liabilities to total assets September 1997 Monthly + ECB Statistical Data Warehouse
Interconnectedness Foreign assetss September 1997 Monthly + ECB Statistical Data Warehouse
Cross-border claims to assets 1999Q1 Quarterly + BIS Locational Banking Statistics and ECB Statistical Data Warehouse
Nonbanking
Leverage Nonbank-provided credit to GDP 1990Q1 Quarterly + Y BIS Credit Series
Nonfinancial sector
Household leverage Household credit to GDP 2002Q1 Quarterly + Y BIS Credit Series
Household debt service ratio January 2003 Monthly + Haver
Corporate leverage Corporate leverage 90th percentile 2005Q1 Quarterly + S&P Capital IQ
Aggregated corporate leverage 2005Q1 Quarterly + S&P Capital IQ
Interest rate coverage ratio 2005Q1 Quarterly - S&P Capital IQ
Corporate debt to GDP 2002Q1 Quarterly + Y BIS Credit Series
Nonfinancial corporation debt service ratio January 2003 Monthly + Haver
Sovereign vulnerabilities
Government debt to GDP 1997 Annual + Y OECD
Government fiscal balance to GDP 1990 Annual - OECD
Government revenue to GDP 1997 Annual - Moody’s
Government interest to revenue 1997 Annual + Moody’s
External sector vulnerabilities
External debt to GDP 2002Q4 Quarterly + Y Haver
Current account balance to GDP 1997Q1 Quarterly - Haver
Reserves to GDP 1970Q1 Quarterly - International Financial Statistics
Valuation pressures
Housing market Nominal house price to GDP 1975Q1 Quarterly + Dallas Fed cross-country housing price database
Price to rent 1970Q1 Quarterly + OECD Analytical House Price database
Equity market Dividend yield October 1996 Monthly - Bloomberg
Junk bond issuance Corporate junk bond issuance January 1980 Monthly + Thomson Reuters
Note: Sign* signifies the direction of the variable in which vulnerabilities increase. For example, “+” indicates that larger values of the variable are associated with more elevated vulnerabilities. For variables with a
“Y” in the “detrend” column, we use the detrended series based on the difference between the current value and the ten-year moving average.
67

Italy
Vulnerability Category Variables Data Start Date Frequency Sign* Detrend Source of Data
Financial Sector
Banking
Leverage Total capital and reserves over total assets September 1997 Monthly - ECB Statistical Data Warehouse
Bank-provided credit to GDP 1974Q4 Quarterly + Y BIS Credit Series
Maturity transformation Loans to deposits September 1997 Monthly + ECB Statistical Data Warehouse
Wholesale funding MFI Liabilities to total assets September 1997 Monthly + ECB Statistical Data Warehouse
Interconnectedness Foreign assetss September 1997 Monthly + ECB Statistical Data Warehouse
Cross-border claims to assets 1999Q1 Quarterly + BIS Locational Banking Statistics and ECB Statistical Data Warehouse
Nonbanking
Leverage Nonbank-provided credit to GDP 1974Q4 Quarterly + Y BIS Credit Series
Nonfinancial sector
Household leverage Household credit to GDP 1970Q1 Quarterly + Y BIS Credit Series
Household debt service ratio 1999Q1 Quarterly + BIS debt service ratios for the private nonfinancial sector
Corporate leverage Corporate leverage 90th percentile 2005Q1 Quarterly + S&P Capital IQ
Aggregated corporate leverage 2005Q1 Quarterly + S&P Capital IQ
Interest rate coverage ratio 2005Q1 Quarterly - S&P Capital IQ
Corporate debt to GDP 1970Q1 Quarterly + Y BIS Credit Series
Nonfinancial corporation debt service ratio 1999Q1 Quarterly + BIS debt service ratios for the private nonfinancial sector
Sovereign vulnerabilities
Government debt to GDP 1960Q1 Quarterly + Y OECD
Government fiscal balance to GDP 1960Q1 Quarterly - OECD
Government revenue to GDP 1997Q1 Quarterly - Moody’s
Government interest to revenue 1997 Annual + Moody’s
External sector vulnerabilities
External debt to GDP 2002Q4 Quarterly + Y Haver
Current account balance to GDP 1995Q1 Quarterly - Haver
Reserves to GDP 1970Q1 Quarterly - International Financial Statistics
Valuation pressures
Housing market Nominal house price to GDP 1975Q1 Quarterly + Dallas Fed cross-country housing price database
Price to rent 1970Q1 Quarterly + OECD Analytical House Price database
Equity market Dividend yield August 2003 Monthly - Bloomberg
Junk bond issuance Corporate junk bond issuance January 1980 Monthly + Thomson Reuters
Note: Sign* signifies the direction of the variable in which vulnerabilities increase. For example, “+” indicates that larger values of the variable are associated with more elevated vulnerabilities. For variables with a
“Y” in the “detrend” column, we use the detrended series based on the difference between the current value and the ten-year moving average.
68
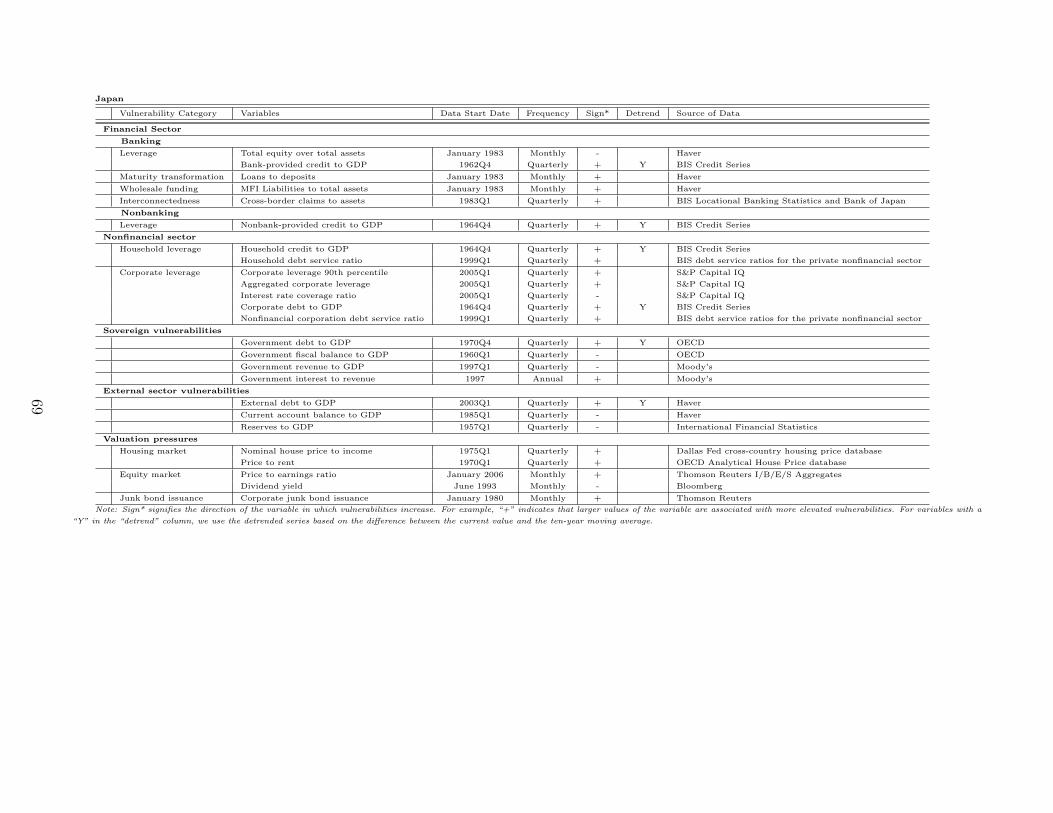
Japan
Vulnerability Category Variables Data Start Date Frequency Sign* Detrend Source of Data
Financial Sector
Banking
Leverage Total equity over total assets January 1983 Monthly - Haver
Bank-provided credit to GDP 1962Q4 Quarterly + Y BIS Credit Series
Maturity transformation Loans to deposits January 1983 Monthly + Haver
Wholesale funding MFI Liabilities to total assets January 1983 Monthly + Haver
Interconnectedness Cross-border claims to assets 1983Q1 Quarterly + BIS Locational Banking Statistics and Bank of Japan
Nonbanking
Leverage Nonbank-provided credit to GDP 1964Q4 Quarterly + Y BIS Credit Series
Nonfinancial sector
Household leverage Household credit to GDP 1964Q4 Quarterly + Y BIS Credit Series
Household debt service ratio 1999Q1 Quarterly + BIS debt service ratios for the private nonfinancial sector
Corporate leverage Corporate leverage 90th percentile 2005Q1 Quarterly + S&P Capital IQ
Aggregated corporate leverage 2005Q1 Quarterly + S&P Capital IQ
Interest rate coverage ratio 2005Q1 Quarterly - S&P Capital IQ
Corporate debt to GDP 1964Q4 Quarterly + Y BIS Credit Series
Nonfinancial corporation debt service ratio 1999Q1 Quarterly + BIS debt service ratios for the private nonfinancial sector
Sovereign vulnerabilities
Government debt to GDP 1970Q4 Quarterly + Y OECD
Government fiscal balance to GDP 1960Q1 Quarterly - OECD
Government revenue to GDP 1997Q1 Quarterly - Moody’s
Government interest to revenue 1997 Annual + Moody’s
External sector vulnerabilities
External debt to GDP 2003Q1 Quarterly + Y Haver
Current account balance to GDP 1985Q1 Quarterly - Haver
Reserves to GDP 1957Q1 Quarterly - International Financial Statistics
Valuation pressures
Housing market Nominal house price to income 1975Q1 Quarterly + Dallas Fed cross-country housing price database
Price to rent 1970Q1 Quarterly + OECD Analytical House Price database
Equity market Price to earnings ratio January 2006 Monthly + Thomson Reuters I/B/E/S Aggregates
Dividend yield June 1993 Monthly - Bloomberg
Junk bond issuance Corporate junk bond issuance January 1980 Monthly + Thomson Reuters
Note: Sign* signifies the direction of the variable in which vulnerabilities increase. For example, “+” indicates that larger values of the variable are associated with more elevated vulnerabilities. For variables with a
“Y” in the “detrend” column, we use the detrended series based on the difference between the current value and the ten-year moving average.
69

Luxembourg
Vulnerability Category Variables Data Start Date Frequency Sign* Detrend Source of Data
Financial Sector
Banking
Leverage Total capital and reserves over total assets September 1997 Monthly - ECB Statistical Data Warehouse
Bank-provided credit to GDP 2003Q1 Quarterly + Y BIS Credit Series
Maturity transformation Loans to deposits September 1997 Monthly + ECB Statistical Data Warehouse
Wholesale funding MFI Liabilities to total assets September 1997 Monthly + ECB Statistical Data Warehouse
Interconnectedness Foreign assets September 1997 Monthly + ECB Statistical Data Warehouse
Cross-border claims to assets 1999Q1 Quarterly + BIS Locational Banking Statistics and ECB Statistical Data Warehouse
Nonbanking
Leverage Nonbank-provided credit to GDP 2003Q1 Quarterly + Y BIS Credit Series
Nonfinancial sector
Household leverage Household credit to GDP 2002Q1 Quarterly + Y BIS Credit Series
Household debt service ratio January 2003 Monthly + Haver
Corporate leverage Corporate leverage 90th percentile 2005Q1 Quarterly + S&P Capital IQ
Aggregated corporate leverage 2005Q1 Quarterly + S&P Capital IQ
Interest rate coverage ratio 2005Q1 Quarterly - S&P Capital IQ
Corporate debt to GDP 2002Q1 Quarterly + Y BIS Credit Series
Sovereign vulnerabilities
Government debt to GDP 1995 Annual + Y OECD
Government fiscal balance to GDP 1990 Annual - OECD
Government revenue to GDP 1997 Annual - Moody’s
Government interest to revenue 1997 Annual + Moody’s
External sector vulnerabilities
External debt to GDP 2002Q4 Quarterly + Y Haver
Current account balance to GDP 1995Q1 Quarterly - Haver
Reserves to GDP 2000Q1 Quarterly - International Financial Statistics
Valuation pressures
Housing market Nominal house price to GDP 1975Q1 Quarterly + Dallas Fed cross-country housing price database
Price to rent 2007Q1 Quarterly + OECD Analytical House Price database
Equity market Not available for Luxembourg
Junk bond issuance Not available for Luxembourg
Note: Sign* signifies the direction of the variable in which vulnerabilities increase. For example, “+” indicates that larger values of the variable are associated with more elevated vulnerabilities. For variables with a
“Y” in the “detrend” column, we use the detrended series based on the difference between the current value and the ten-year moving average.
70

Malaysia
Vulnerability Category Variables Data Start Date Frequency Sign* Detrend Source of Data
Financial Sector
Banking
Leverage Equity over total assets January 2007 Monthly - Haver
Bank-provided credit to GDP 1991Q1 Quarterly + Y BIS Credit Series
Maturity transformation Loans to deposits January 2007 Monthly + Haver
Wholesale funding MFI Liabilities to total assets January 2007 Monthly + Haver
Interconnectedness Foreign assets to total assets January 2007 Monthly + Haver
Nonbanking
Leverage Nonbank-provided credit to GDP 1991Q1 Quarterly + Y BIS Credit Series
Nonfinancial sector
Household leverage Household credit to GDP 2006Q1 Quarterly + Y BIS Credit Series
Corporate leverage Corporate leverage 90th percentile 2005Q1 Quarterly + S&P Capital IQ
Aggregated corporate leverage 2005Q1 Quarterly + S&P Capital IQ
Interest rate coverage ratio 2005Q1 Quarterly - S&P Capital IQ
Corporate debt to GDP 2006Q1 Quarterly + BIS Credit Series
Sovereign vulnerabilities
Government debt to GDP 1980 Annual + Y WEO
Government fiscal balance to GDP 1980 Annual - WEO
Government revenue to GDP 1997 Annual - Moody’s
Government interest to revenue 1997 Annual + Y Moody’s
External sector vulnerabilities
External debt to GDP 2009Q1 Quarterly + Y Haver
Current account balance to GDP 1999Q1 Quarterly - Haver
Reserves to GDP 1991Q1 Quarterly - International Financial Statistics
Valuation pressures
Housing market House price to GDP 1999Q1 Quarterly + BIS Housing Price series
Equity market Price to earnings ratio January 2006 Monthly + Thomson Reuters I/B/E/S Aggregates
Dividend yield May 1993 Monthly - Bloomberg
Junk bond issuance Corporate junk bond issuance January 1980 Monthly + Thomson Reuters
Note: Sign* signifies the direction of the variable in which vulnerabilities increase. For example, “+” indicates that larger values of the variable are associated with more elevated vulnerabilities. For variables with a
“Y” in the “detrend” column, we use the detrended series based on the difference between the current value and the ten-year moving average.
71

Mexico
Vulnerability Category Variables Data Start Date Frequency Sign* Detrend Source of Data
Financial Sector
Banking
Leverage Total equity over total assets December 2000 Monthly - Banco de Mxico
Bank-provided credit to GDP 1980Q4 Quarterly + Y BIS Credit Series
Maturity transformation Loans to deposits December 2000 Monthly + Banco de Mxico
Wholesale funding MFI Liabilities to total assets December 2000 Monthly + Banco de Mxico
Interconnectedness Foreign assets to total assets December 2000 Monthly + Banco de Mxico
Nonbanking
Leverage Nonbank-provided credit to GDP 1980Q4 Quarterly + Y BIS Credit Series
Nonfinancial sector
Household leverage Household credit to GDP 1994Q4 Quarterly + Y BIS Credit Series
Corporate leverage Corporate leverage 90th percentile 2005Q1 Quarterly + S&P Capital IQ
Aggregated corporate leverage 2005Q1 Quarterly + S&P Capital IQ
Interest rate coverage ratio 2005Q1 Quarterly - S&P Capital IQ
Corporate debt to GDP 1994Q4 Quarterly + Y BIS Credit Series
Sovereign vulnerabilities
Government debt to GDP 1996 Annual + Y WEO
Government fiscal balance to GDP 1996 Annual - WEO
Government revenue to GDP 1998 Annual - Moody’s
Government interest to revenue 1998 Annual + Moody’s
External sector vulnerabilities
External debt to GDP 2002Q1 Quarterly + Y Haver
Current account balance to GDP 1980Q1 Quarterly - Haver
Reserves to GDP 1980Q1 Quarterly - International Financial Statistics
External vulnerability indicator 1997 Annual + Moodys
Valuation pressures
Housing market House price to GDP 2005Q1 Quarterly + BIS Housing Price series
Price to rent 2005Q1 Quarterly + OECD Analytical House Price Database
Equity market Price to earnings ratio January 2006 Monthly + Thomson Reuters I/B/E/S Aggregates
Dividend yield April 1994 Monthly - Bloomberg
Junk bond issuance Corporate junk bond issuance January 1980 Monthly + Thomson Reuters
Note: Sign* signifies the direction of the variable in which vulnerabilities increase. For example, “+” indicates that larger values of the variable are associated with more elevated vulnerabilities. For variables with a
“Y” in the “detrend” column, we use the detrended series based on the difference between the current value and the ten-year moving average.
72

Netherlands
Vulnerability Category Variables Data Start Date Frequency Sign* Detrend Source of Data
Financial Sector
Banking
Leverage Total capital and reserves over total assets September 1997 Monthly - ECB Statistical Data Warehouse
Bank-provided credit to GDP 1977Q1 Quarterly + Y BIS Credit Series
Maturity transformation Loans to deposits September 1997 Monthly + ECB Statistical Data Warehouse
Wholesale funding MFI Liabilities to total assets September 1997 Monthly + ECB Statistical Data Warehouse
Interconnectedness Foreign assets September 1997 Monthly + ECB Statistical Data Warehouse
Cross-border claims to assets 1999Q1 Quarterly + BIS Locational Banking Statistics and ECB Statistical Data Warehouse
Nonbanking
Leverage Nonbank-provided credit to GDP 1977Q1 Quarterly + Y BIS Credit Series
Nonfinancial sector
Household leverage Household credit to GDP 1990Q4 Quarterly + Y BIS Credit Series
Household debt service ratio 1999Q1 Quarterly + BIS debt service ratios for the private nonfinancial sector
Corporate leverage Corporate leverage 90th percentile 2005Q1 Quarterly + S&P Capital IQ
Aggregated corporate leverage 2005Q1 Quarterly + S&P Capital IQ
Interest rate coverage ratio 2005Q1 Quarterly - S&P Capital IQ
Corporate debt to GDP 1990Q4 Quarterly + Y BIS Credit Series
Nonfinancial corporation debt service ratio 1999Q1 Quarterly + BIS debt service ratios for the private nonfinancial sector
Sovereign vulnerabilities
Government debt to GDP 1960 Annual + Y OECD
Government fiscal balance to GDP 1969 Annual - OECD
Government revenue to GDP 1997 Annual - Moody’s
Government interest to revenue 1997 Annual + Moody’s
External sector vulnerabilities
External debt to GDP 2003Q2 Quarterly + Y Haver
Current account balance to GDP 2003Q2 Quarterly - Haver
Reserves to GDP 1977Q1 Quarterly - International Financial Statistics
Valuation pressures
Housing market Nominal house price to income 1975Q1 Quarterly + Dallas Fed cross-country housing price database
Price to rent 1970Q1 Quarterly + OECD Analytical House Price Database
Equity market Price to earnings ratio January 2006 Monthly + Thomson Reuters I/B/E/S Aggregates
Dividend yield July 1993 Monthly - Bloomberg
Junk bond issuance Corporate junk bond issuance January 1980 Monthly + Thomson Reuters
Note: Sign* signifies the direction of the variable in which vulnerabilities increase. For example, “+” indicates that larger values of the variable are associated with more elevated vulnerabilities. For variables with a
“Y” in the “detrend” column, we use the detrended series based on the difference between the current value and the ten-year moving average.
73

Norway
Vulnerability Category Variables Data Start Date Frequency Sign* Detrend Source of Data
Financial Sector
Banking
Leverage Total equity over total assets January 1980 Monthly - Statistics Norway
Bank-provided credit to GDP 1978Q1 Quarterly + Y BIS Credit Series
Maturity transformation Loans to deposits January 1980 Monthly + Statistics Norway and Norges Bank Historical monetary statistics
Wholesale funding MFI Liabilities to total assets May 2009 Monthly + Statistics Norway
Interconnectedness Cross-border claims to assets 1983Q4 Quarterly + BIS Locational Banking Statistics and Statistics Norway
Nonbanking
Leverage Nonbank-provided credit to GDP 1978Q1 Quarterly + Y BIS Credit Series
Nonfinancial sector
Household leverage Household credit to GDP 1978Q1 Quarterly + Y BIS Credit Series
Household debt service ratio 1999Q1 Quarterly + BIS debt service ratios for the private nonfinancial sector
Corporate leverage Corporate leverage 90th percentile 2005Q1 Quarterly + S&P Capital IQ
Aggregated corporate leverage 2005Q1 Quarterly + S&P Capital IQ
Interest rate coverage ratio 2005Q1 Quarterly - S&P Capital IQ
Corporate debt to GDP 1978Q1 Quarterly + Y BIS Credit Series
Nonfinancial corporation debt service ratio 1999Q1 Quarterly + BIS debt service ratios for the private nonfinancial sector
Sovereign vulnerabilities
Government debt to GDP 1970 Annual + Y OECD
Government fiscal balance to GDP 1962 Annual - OECD
Government revenue to GDP 1997 Annual - Moody’s
Government interest to revenue 1997 Annual + Moody’s
External sector vulnerabilities
External debt to GDP 2005Q1 Quarterly + Y Haver
Current account balance to GDP 1981Q1 Quarterly - Haver
Reserves to GDP 1978Q1 Quarterly - International Financial Statistics
Valuation pressures
Housing market Nominal house price to income 1975Q1 Quarterly + Dallas Fed cross-country housing price database
Price to rent 1979Q1 Quarterly + OECD Analytical House Price Database
Equity market Dividend yield July 2001 Monthly - Bloomberg
Junk bond issuance Corporate junk bond issuance January 1997 Monthly + Thomson Reuters
Note: Sign* signifies the direction of the variable in which vulnerabilities increase. For example, “+” indicates that larger values of the variable are associated with more elevated vulnerabilities. For variables with a
“Y” in the “detrend” column, we use the detrended series based on the difference between the current value and the ten-year moving average.
74

Poland
Vulnerability Category Variables Data Start Date Frequency Sign* Detrend Source of Data
Financial Sector
Banking
Leverage Total capital and reserves over total assets January 2004 Monthly - ECB Statistical Data Warehouse
Bank-provided credit to GDP 1995Q1 Quarterly + Y BIS Credit Series
Maturity transformation Loans to deposits January 2004 Monthly + ECB Statistical Data Warehouse
Wholesale funding MFI Liabilities to total assets January 2004 Monthly + ECB Statistical Data Warehouse
Interconnectedness Foreign assets January 2004 Monthly + ECB Statistical Data Warehouse
Nonbanking
Leverage Nonbank-provided credit to GDP 1995Q1 Quarterly + Y BIS Credit Series
Nonfinancial sector
Household leverage Household credit to GDP 1995Q4 Quarterly + Y BIS Credit Series
Corporate leverage Corporate leverage 90th percentile 2005Q1 Quarterly + S&P Capital IQ
Aggregated corporate leverage 2005Q1 Quarterly + S&P Capital IQ
Interest rate coverage ratio 2005Q1 Quarterly - S&P Capital IQ
Corporate debt to GDP 1995Q4 Quarterly + Y BIS Credit Series
Nonfinancial corporation debt service ratio 1999Q1 Quarterly + BIS debt service ratios for the private nonfinancial sector
Sovereign vulnerabilities
Government debt to GDP 1995 Annual + Y OECD
Government fiscal balance to GDP 1995 Annual - OECD
Government revenue to GDP 1997 Annual - Moody’s
Government interest to revenue 1997 Annual + Moody’s
External sector vulnerabilities
External debt to GDP 1995Q4 Quarterly + Y Haver
Current account balance to GDP 1997Q1 Quarterly - Haver
Reserves to GDP 1995Q1 Quarterly - International Financial Statistics
Valuation pressures
Housing market House price to GDP 1 2006Q3 Quarterly + BIS Housing Price series
House price to GDP 2 2006Q3 Quarterly + BIS Housing Price series
House price to GDP 3 2006Q3 Quarterly + BIS Housing Price series
Equity market Price to earnings ratio January 2006 Monthly + Thomson Reuters I/B/E/S Aggregates
Dividend yield June 2001 Monthly - Bloomberg
Junk bond issuance Corporate junk bond issuance January 1980 Monthly + Thomson Reuters
Note: Sign* signifies the direction of the variable in which vulnerabilities increase. For example, “+” indicates that larger values of the variable are associated with more elevated vulnerabilities. For variables with a
“Y” in the “detrend” column, we use the detrended series based on the difference between the current value and the ten-year moving average.
75

Portugal
Vulnerability Category Variables Data Start Date Frequency Sign* Detrend Source of Data
Financial Sector
Banking
Leverage Total capital and reserves over total assets September 1997 Monthly - ECB Statistical Data Warehouse
Bank-provided credit to GDP 1986Q1 Quarterly + Y BIS Credit Series
Maturity transformation Loans to deposits September 1997 Monthly + ECB Statistical Data Warehouse
Wholesale funding MFI Liabilities to total assets September 1997 Monthly + ECB Statistical Data Warehouse
Interconnectedness Foreign assets September 1997 Monthly + ECB Statistical Data Warehouse
Cross-border claims to assets 1999Q1 Quarterly + BIS Locational Banking Statistics and ECB Statistical Data Warehouse
Nonbanking
Leverage Nonbank-provided credit to GDP 1986Q1 Quarterly + Y BIS Credit Series
Nonfinancial sector
Household leverage Household credit to GDP 1986Q1 Quarterly + Y BIS Credit Series
Household debt service ratio 1999Q1 Quarterly + BIS debt service ratios for the private nonfinancial sector
Corporate leverage Corporate leverage 90th percentile 2005Q1 Quarterly + S&P Capital IQ
Aggregated corporate leverage 2005Q1 Quarterly + S&P Capital IQ
Interest rate coverage ratio 2005Q1 Quarterly - S&P Capital IQ
Corporate debt to GDP 1986Q1 Quarterly + Y BIS Credit Series
Nonfinancial corporation debt service ratio 1999Q1 Quarterly + BIS debt service ratios for the private nonfinancial sector
Sovereign vulnerabilities
Government debt to GDP 1995 Annual + Y OECD
Government fiscal balance to GDP 1977 Annual - OECD
Government revenue to GDP 1997 Annual - Moody’s
Government interest to revenue 1997 Annual + Moody’s
External sector vulnerabilities
External debt to GDP 1996Q1 Quarterly + Y Haver
Current account balance to GDP 1996Q1 Quarterly - Haver
Reserves to GDP 1986Q1 Quarterly - International Financial Statistics
Valuation pressures
Housing market House price to GDP 2008Q1 Quarterly + BIS Housing Price series
Price to rent 1988Q1 Quarterly + OECD Analytical House Price database
Equity market Dividend yield October 1997 Monthly - Bloomberg
Junk bond issuance Corporate junk bond issuance January 1980 Monthly + Thomson Reuters
Note: Sign* signifies the direction of the variable in which vulnerabilities increase. For example, “+” indicates that larger values of the variable are associated with more elevated vulnerabilities. For variables with a
“Y” in the “detrend” column, we use the detrended series based on the difference between the current value and the ten-year moving average.
76

Russia
Vulnerability Category Variables Data Start Date Frequency Sign* Detrend Source of Data
Financial Sector
Banking
Leverage Total equity over total assets December 2000 Monthly - Haver
Bank-provided credit to GDP 1995Q2 Quarterly + Y BIS Credit Series
Maturity transformation Loans to deposits December 2000 Monthly + Haver
Wholesale funding MFI Liabilities to total assets January 2000 Monthly + Haver
Interconnectedness Foreign assets January 2000 Monthly + Haver
Nonbanking
Leverage Nonbank-provided credit to GDP 1995Q2 Quarterly + Y BIS Credit Series
Nonfinancial sector
Household leverage Not available for Russia
Corporate leverage Corporate leverage 90th percentile 2005Q1 Quarterly + S&P Capital IQ
Aggregated corporate leverage 2005Q1 Quarterly + S&P Capital IQ
Interest rate coverage ratio 2005Q1 Quarterly - S&P Capital IQ
Sovereign vulnerabilities
Government debt to GDP 1999 Annual + Y WEO
Government fiscal balance to GDP 1997 Annual - WEO
Government revenue to GDP 1997 Annual - Moody’s
Government interest to revenue 1997 Annual + Moody’s
External sector vulnerabilities
External debt to GDP 1993Q4 Quarterly + Y Haver
Current account balance to GDP 1995Q1 Quarterly - Haver
Reserves to GDP 1993Q4 Quarterly - International Financial Statistics
External vulnerability indicator 1997 Annual + Moody’s
Valuation pressures
Housing market House price to GDP 1 2001Q1 Quarterly + BIS Housing Price series
House price to GDP 2 2001Q1 Quarterly + BIS Housing Price series
Equity market Price to earnings ratio January 2006 Monthly - Thomson Reuters I/B/E/S Aggregates
Dividend yield August 2003 Monthly + Bloomberg
Junk bond issuance Corporate junk bond issuance January 1980 Monthly + Thomson Reuters
Note: Sign* signifies the direction of the variable in which vulnerabilities increase. For example, “+” indicates that larger values of the variable are associated with more elevated vulnerabilities. For variables with a
“Y” in the “detrend” column, we use the detrended series based on the difference between the current value and the ten-year moving average.
77

Singapore
Vulnerability Category Variables Data Start Date Frequency Sign* Detrend Source of Data
Financial Sector
Banking
Leverage Capital and reserves over total assets January 1991 Monthly - Haver
Bank-provided credit to GDP 1975Q1 Quarterly + Y BIS Credit Series
Maturity transformation Loans to deposits January 1991 Monthly + Haver
Wholesale funding MFI Liabilities to total assets January 1991 Monthly + Haver
Interconnectedness Foreign assets to total assets January 1991 Monthly + Haver
Nonbanking
Leverage Nonbank-provided credit to GDP 1975Q1 Quarterly + Y BIS Credit Series
Nonfinancial sector
Household leverage Household credit to GDP 1991Q1 Quarterly + Y BIS Credit Series
Corporate leverage Corporate leverage 90th percentile 2005Q1 Quarterly + S&P Capital IQ
Aggregated corporate leverage 2005Q1 Quarterly + S&P Capital IQ
Interest rate coverage ratio 2005Q1 Quarterly - S&P Capital IQ
Corporate debt to GDP 1991Q1 Quarterly + Y BIS Credit Series
Sovereign vulnerabilities
Government debt to GDP 1980 Annual + Y WEO
Government fiscal balance to GDP 1980 Annual - WEO
Government revenue to GDP 1997 Annual - Moody’s
External sector vulnerabilities
External debt to GDP 2003Q2 Quarterly + Y Haver
Current account balance to GDP 1986Q1 Quarterly - Haver
Reserves to GDP 1975Q1 Quarterly - International Financial Statistics
Valuation pressures
Housing market House price to GDP 1998Q1 Quarterly + BIS Housing Price series
Equity market Price to earnings ratio January 2006 Monthly + Thomson Reuters I/B/E/S Aggregates
Dividend yield February 2008 Monthly - Bloomberg
Junk bond issuance Corporate junk bond issuance January 1980 Monthly + Thomson Reuters
Note: Sign* signifies the direction of the variable in which vulnerabilities increase. For example, “+” indicates that larger values of the variable are associated with more elevated vulnerabilities. For variables with a
“Y” in the “detrend” column, we use the detrended series based on the difference between the current value and the ten-year moving average.
78

South Korea
Vulnerability Category Variables Data Start Date Frequency Sign* Detrend Source of Data
Financial Sector
Banking
Leverage Total equity over total assets January 1991 Monthly - Haver
Bank-provided credit to GDP 1962Q4 Quarterly + Y BIS Credit Series
Maturity transformation Loans to deposits January 1991 Monthly + Haver
Wholesale funding MFI Liabilities to total assets January 1991 Monthly + Haver
Interconnectedness Foreign assets to total assets January 1991 Monthly + Haver
Nonbanking
Leverage Nonbank-provided credit to GDP 1962Q4 Quarterly + Y BIS Credit Series
Nonfinancial sector
Household leverage Household credit to GDP 1962Q4 Quarterly + Y BIS Credit Series
Household debt service ratio 1999Q1 Quarterly + BIS debt service ratios for the private nonfinancial sector
Corporate leverage Corporate leverage 90th percentile 2005Q1 Quarterly + S&P Capital IQ
Aggregated corporate leverage 2005Q1 Quarterly + S&P Capital IQ
Interest rate coverage ratio 2005Q1 Quarterly - S&P Capital IQ
Corporate debt to GDP 1962Q4 Quarterly + Y BIS Credit Series
Nonfinancial corporation debt service ratio 1999Q1 Quarterly + BIS debt service ratios for the private nonfinancial sector
Sovereign vulnerabilities
Government debt to GDP 2002 Annual + Y OECD
Government fiscal balance to GDP 1970 Annual - OECD
Government revenue to GDP 1997 Annual - Moody’s
Government interest to revenue 2000 Annual + Moody’s
External sector vulnerabilities
External debt to GDP 1994Q4 Quarterly + Y Haver
Current account balance to GDP 1980Q1 Quarterly - Haver
Reserves to GDP 1970Q1 Quarterly - International Financial Statistics
External vulnerability indicator 1997 Annual + Moody’s
Valuation pressures
Housing market Nominal house price to income 1975Q1 Quarterly + Dallas Fed cross-country housing price database
Price to rent 1986Q1 Quarterly + OECD Analytical House Price Database
Equity market Price to earnings ratio January 2006 Monthly + Thomson Reuters I/B/E/S Aggregates
Dividend yield February 2002 Monthly - Bloomberg
Junk bond issuance Corporate junk bond issuance January 1980 Monthly + Thomson Reuters
Note: Sign* signifies the direction of the variable in which vulnerabilities increase. For example, “+” indicates that larger values of the variable are associated with more elevated vulnerabilities. For variables with a
“Y” in the “detrend” column, we use the detrended series based on the difference between the current value and the ten-year moving average.
79

Spain
Vulnerability Category Variables Data Start Date Frequency Sign* Detrend Source of Data
Financial Sector
Banking
Leverage Total capital and reserves over total assets September 1997 Monthly - ECB Statistical Data Warehouse
Bank-provided credit to GDP 1980Q1 Quarterly + Y BIS Credit Series
Maturity transformation Loans to deposits September 1997 Monthly + ECB Statistical Data Warehouse
Wholesale funding MFI Liabilities to total assets September 1997 Monthly + ECB Statistical Data Warehouse
Interconnectedness Foreign assets to total assets September 1997 Monthly + ECB Statistical Data Warehouse
Cross-border claims to assets 1999Q1 Quarterly + BIS Locational Banking Statistics and ECB Statistical Data Warehouse
Nonbanking
Leverage Nonbank-provided credit to GDP 1980Q4 Quarterly + Y BIS Credit Series
Nonfinancial sector
Household leverage Household credit to GDP 1980Q4 Quarterly + Y BIS Credit Series
Household debt service ratio 1999Q1 Quarterly + BIS debt service ratios for the private nonfinancial sector
Corporate leverage Corporate leverage 90th percentile 2005Q1 Quarterly + S&P Capital IQ
Aggregated corporate leverage 2005Q1 Quarterly + S&P Capital IQ
Interest rate coverage ratio 2005Q1 Quarterly - S&P Capital IQ
Corporate debt to GDP 1980Q4 Quarterly + Y BIS Credit Series
Nonfinancial corporation debt service ratio 1999Q1 Quarterly + BIS debt service ratios for the private nonfinancial sector
Sovereign vulnerabilities
Government debt to GDP 1980 Annual + Y OECD
Government fiscal balance to GDP 1964 Annual - OECD
Government revenue to GDP 1997 Annual - Moody’s
Government interest to revenue 1997 Annual + Moody’s
External sector vulnerabilities
External debt to GDP 2002Q1 Quarterly + Y Haver
Current account balance to GDP 1990Q1 Quarterly - Haver
Reserves to GDP 1980Q1 Quarterly - International Financial Statistics
Valuation pressures
Housing market Nominal house price to income 1975Q1 Quarterly + Dallas Fed cross-country housing price database
Price to rent 1971Q1 Quarterly + OECD Analytical House Price Database
Equity market Price to earnings ratio January 2006 Monthly + Thomson Reuters I/B/E/S Aggregates
Dividend yield November 1996 Monthly - Bloomberg
Junk bond issuance Corporate junk bond issuance January 1980 Monthly + Thomson Reuters
Note: Sign* signifies the direction of the variable in which vulnerabilities increase. For example, “+” indicates that larger values of the variable are associated with more elevated vulnerabilities. For variables with a
“Y” in the “detrend” column, we use the detrended series based on the difference between the current value and the ten-year moving average.
80

Sweden
Vulnerability Category Variables Data Start Date Frequency Sign* Detrend Source of Data
Financial Sector
Banking
Leverage Total capital and reserves over total assets December 2001 Monthly - ECB Statistical Data Warehouse
Bank-provided credit to GDP 1980Q1 Quarterly + Y BIS Credit Series
Maturity transformation Loans to deposits December 2001 Monthly + ECB Statistical Data Warehouse
Wholesale funding MFI Liabilities to total assets December 2001 Monthly + ECB Statistical Data Warehouse
Interconnectedness Foreign assets to total assets December 2001 Monthly + ECB Statistical Data Warehouse
Cross-border claims to assets 2001Q4 Quarterly + BIS Locational Banking Statistics and ECB Statistical Data Warehouse
Nonbanking
Leverage Nonbank-provided credit to GDP 1980Q1 Quarterly + Y BIS Credit Series
Nonfinancial sector
Household leverage Household credit to GDP 1980Q4 Quarterly + Y BIS Credit Series
Household debt service ratio 1999Q1 Quarterly + BIS debt service ratios for the private nonfinancial sector
Corporate leverage Corporate leverage 90th percentile 2005Q1 Quarterly + S&P Capital IQ
Aggregated corporate leverage 2005Q1 Quarterly + S&P Capital IQ
Interest rate coverage ratio 2005Q1 Quarterly - S&P Capital IQ
Corporate debt to GDP 1980Q4 Quarterly + Y BIS Credit Series
Nonfinancial corporation debt service ratio 1999Q1 Quarterly + BIS debt service ratios for the private nonfinancial sector
Sovereign vulnerabilities
Government debt to GDP 1960 Annual + Y OECD
Government fiscal balance to GDP 1960 Annual - OECD
Government revenue to GDP 1997 Annual - Moody’s
Government interest to revenue 1997 Annual + Moody’s
External sector vulnerabilities
External debt to GDP 1997Q4 Quarterly + Y Haver
Current account balance to GDP 1982Q1 Quarterly - Haver
Reserves to GDP 1980Q1 Quarterly - International Financial Statistics
Valuation pressures
Housing market Nominal house price to income 1975Q1 Quarterly + Dallas Fed cross-country housing price database
Price to rent 1980Q1 Quarterly + OECD Analytical House Price Database
Equity market Price to earnings ratio January 2006 Monthly + Thomson Reuters I/B/E/S Aggregates
Dividend yield October 1993 Monthly - Bloomberg
Junk bond issuance Corporate junk bond issuance January 1980 Monthly + Thomson Reuters
Note: Sign* signifies the direction of the variable in which vulnerabilities increase. For example, “+” indicates that larger values of the variable are associated with more elevated vulnerabilities. For variables with a
“Y” in the “detrend” column, we use the detrended series based on the difference between the current value and the ten-year moving average.
81

Switzerland
Vulnerability Category Variables Data Start Date Frequency Sign* Detrend Source of Data
Financial Sector
Banking
Leverage Total equity over total assets December 1996 Monthly - SNB
Bank-provided credit to GDP 1980Q1 Quarterly + Y BIS Credit Series
Maturity transformation Loans to deposits December 1996 Monthly + SNB
Wholesale funding MFI Liabilities to total assets December 1996 Monthly + SNB
Interconnectedness Foreign assets to total assets December 1996 Monthly + SNB
Nonbanking
Leverage Nonbank-provided credit to GDP 1980Q1 Quarterly + Y BIS Credit Series
Nonfinancial sector
Household leverage Household credit to GDP 1999Q4 Quarterly + Y BIS Credit Series
Corporate leverage Corporate leverage 90th percentile 2005Q1 Quarterly + S&P Capital IQ
Aggregated corporate leverage 2005Q1 Quarterly + S&P Capital IQ
Interest rate coverage ratio 2005Q1 Quarterly - S&P Capital IQ
Corporate debt to GDP 1999Q4 Quarterly + Y BIS Credit Series
Sovereign vulnerabilities
Government debt to GDP 1990 Annual + Y OECD
Government fiscal balance to GDP 1990 Annual - OECD
Government revenue to GDP 1997 Annual - Moody’s
Government interest to revenue 1997 Annual + Moody’s
External sector vulnerabilities
External debt to GDP 1999Q4 Quarterly + Y Haver
Current account balance to GDP 1980Q1 Quarterly - Haver
Reserves to GDP 1980Q1 Quarterly - International Financial Statistics
Valuation pressures
Housing market Nominal house price to income 1975Q1 Quarterly + Dallas Fed cross-country housing price database
Price to rent 1970Q1 Quarterly + OECD Analytical House Price Database
Equity market Price to earnings ratio January 2006 Monthly + Thomson Reuters I/B/E/S Aggregates
Dividend yield June 1993 Monthly - Bloomberg
Junk bond issuance Corporate junk bond issuance January 1980 Monthly + Thomson Reuters
Note: Sign* signifies the direction of the variable in which vulnerabilities increase. For example, “+” indicates that larger values of the variable are associated with more elevated vulnerabilities. For variables with a
“Y” in the “detrend” column, we use the detrended series based on the difference between the current value and the ten-year moving average.
82

Thailand
Vulnerability Category Variables Data Start Date Frequency Sign* Detrend Source of Data
Financial Sector
Banking
Leverage Equity over total assets January 1997 Monthly - Haver
Bank-provided credit to GDP 1993Q1 Quarterly + Y BIS Credit Series
Maturity transformation Loans to deposits January 1991 Monthly + Haver
Wholesale funding MFI Liabilities to total assets January 1997 Monthly + Haver
Interconnectedness Foreign assets to total assets January 2003 Monthly + Haver
Nonbanking
Leverage Nonbank-provided credit to GDP 1993Q1 Quarterly + Y BIS Credit Series
Nonfinancial sector
Household leverage Household credit to GDP 1993Q1 Quarterly + Y BIS Credit Series
Corporate leverage Corporate leverage 90th percentile 2005Q1 Quarterly + S&P Capital IQ
Aggregated corporate leverage 2005Q1 Quarterly + S&P Capital IQ
Interest rate coverage ratio 2005Q1 Quarterly - S&P Capital IQ
Corporate debt to GDP 1993Q1 Quarterly + Y BIS Credit Series
Sovereign vulnerabilities
Government debt to GDP 1980 Annual + Y WEO
Government fiscal balance to GDP 1980 Annual - WEO
Government revenue to GDP 1997 Annual - Moody’s
Government interest to revenue 1997 Annual + Moody’s
External sector vulnerabilities
External debt to GDP 1999Q1 Quarterly + Y Haver
Current account balance to GDP 1986Q1 Quarterly - Haver
Reserves to GDP 1993Q1 Quarterly - International Financial Statistics
Valuation pressures
Housing market House price to GDP 1 2008Q1 Quarterly + BIS Housing Price series
House price to GDP 2 2008Q1 Quarterly + BIS Housing Price series
House price to GDP 3 2008Q1 Quarterly + BIS Housing Price series
Equity market Price to earnings ratio January 2006 Monthly + Thomson Reuters I/B/E/S Aggregates
Dividend yield September 1993 Monthly - Bloomberg
Junk bond issuance Corporate junk bond issuance January 1980 Monthly + Thomson Reuters
Note: Sign* signifies the direction of the variable in which vulnerabilities increase. For example, “+” indicates that larger values of the variable are associated with more elevated vulnerabilities. For variables with a
“Y” in the “detrend” column, we use the detrended series based on the difference between the current value and the ten-year moving average.
83

Turkey
Vulnerability Category Variables Data Start Date Frequency Sign* Detrend Source of Data
Financial Sector
Banking
Leverage Total equity over total assets January 1986 Monthly - Central Bank of the Republic of Turkey
Bank-provided credit to GDP 1987Q1 Quarterly + Y BIS Credit Series
Maturity transformation Loans to deposits January 1986 Monthly + Central Bank of the Republic of Turkey
Wholesale funding MFI Liabilities to total assets January 1986 Monthly + Central Bank of the Republic of Turkey
Interconnectedness Foreign assets to total assets January 1986 Monthly + Central Bank of the Republic of Turkey
Nonbanking
Leverage Nonbank-provided credit to GDP 1987Q1 Quarterly + Y BIS Credit Series
Nonfinancial sector
Household leverage Household credit to GDP 1987Q1 Quarterly + Y BIS Credit Series
Corporate leverage Corporate leverage 90th percentile 2005Q1 Quarterly + S&P Capital IQ
Aggregated corporate leverage 2005Q1 Quarterly + S&P Capital IQ
Interest rate coverage ratio 2005Q1 Quarterly - S&P Capital IQ
Corporate debt to GDP 1987Q4 Quarterly + Y BIS Credit Series
Sovereign vulnerabilities
Government debt to GDP 2001 Annual + Y WEO
Government fiscal balance to GDP 2002 Annual - WEO
Government revenue to GDP 1997 Annual - Moody’s
Government interest to revenue 1997 Annual + Moody’s
External sector vulnerabilities
External debt to GDP 1989Q4 Quarterly + Y Haver
Current account balance to GDP 1987Q1 Quarterly - Haver
Reserves to GDP 1987Q1 Quarterly - International Financial Statistics
External vulnerability indicator 1997 Annual + Moody’s
Valuation pressures
Housing market House price to GDP 2010Q1 Quarterly + BIS Housing Price series
Price to rent 2010Q1 Quarterly + OECD Analytical House Price Database
Equity market Price to earnings ratio January 2006 Monthly + Thomson Reuters I/B/E/S Aggregates
Dividend yield February 2004 Monthly - Bloomberg
Junk bond issuance Corporate junk bond issuance January 1980 Monthly + Thomson Reuters
Note: Sign* signifies the direction of the variable in which vulnerabilities increase. For example, “+” indicates that larger values of the variable are associated with more elevated vulnerabilities. For variables with a
“Y” in the “detrend” column, we use the detrended series based on the difference between the current value and the ten-year moving average.
84

United Kingdom
Vulnerability Category Variables Data Start Date Frequency Sign* Detrend Source of Data
Financial Sector
Banking
Leverage Total capital and reserves over total assets January 1999 Monthly - ECB Statistical Data Warehouse
Leverage ratio 2005Q1 Quarterly - Bank of England CCB Core Indicators
Bank-provided credit to GDP 1963Q1 Quarterly + Y BIS Credit Series
Maturity transformation Loans to deposits January 1999 Monthly + ECB Statistical Data Warehouse
Wholesale funding MFI Liabilities to total assets September 1997 Monthly + ECB Statistical Data Warehouse
Interconnectedness Foreign assets to total assets September 1997 Monthly + ECB Statistical Data Warehouse
Cross-border claims to assets 1999Q1 Quarterly + BIS Locational Banking Statistics and ECB Statistical Data Warehouse
Nonbanking
Leverage Nonbank-provided credit to GDP 1963Q1 Quarterly + Y BIS Credit Series
Nonfinancial sector
Household leverage Household debt service ratio January 2004 Monthly + Haver
Household credit to GDP 1963Q4 Quarterly + Y Bank of England SCR Core Indicators
Residential mortgage terms 2005Q2 Quarterly + Bank of England SCR Core Indicators
Corporate leverage Corporate leverage 90th percentile 2005Q1 Quarterly + S&P Capital IQ
Aggregated corporate leverage 2005Q1 Quarterly + S&P Capital IQ
Interest rate coverage ratio 2005Q1 Quarterly - S&P Capital IQ
Corporate debt to GDP 1976Q1 Quarterly + Y BIS Credit Series
Commercial real estate loan terms 1999Q1 Quarterly + Bank of England SCR Core Indicators
Debt to profit 1964Q1 Quarterly + Bank of England SCR Core Indicators
Nonfinancial corporation debt service ratio January 2004 Monthly + Haver
Sovereign vulnerabilities
Government debt to GDP 1970 Annual + Y OECD
Government fiscal balance to GDP 1970 Annual - OECD
Government revenue to GDP 1997 Annual - Moody’s
Government interest to revenue 1997 Annual + Moody’s
External sector vulnerabilities
External debt to GDP 1987Q1 Quarterly + Haver
Current account balance to GDP 1955Q1 Quarterly - Haver
Reserves to GDP 1957Q1 Quarterly - International Financial Statistics
Valuation pressures
Housing market Nominal house price to income 1975Q1 Quarterly + Dallas Fed cross-country housing price database
Price to rent 1987Q1 Quarterly + Bank of England SCR Core Indicators
Equity market Price to earnings ratio January 2006 Monthly + Thomson Reuters I/B/E/S Aggregates
Dividend yield June 1993 Monthly - Bloomberg
Junk bond issuance Corporate junk bond issuance January 1980 Monthly + Thomson Reuters
Note: Sign* signifies the direction of the variable in which vulnerabilities increase. For example, “+” indicates that larger values of the variable are associated with more elevated vulnerabilities. For variables with a
“Y” in the “detrend” column, we use the detrended series based on the difference between the current value and the ten-year moving average.
85