Embed Size (px)
Citation preview

Entrepreneurship and the Extensive Margin in Export Growth: A Microeconomic Accounting of Costa Rica’s Export Growth during 1997-2007
Daniel Lederman
Andrés Rodríguez-Clare
Daniel Yi Xu
Abstract
Successful exporting countries are often seen as successful economies. This paper studies the role of new exporting entrepreneurs – defined as firms that became exporters – in determining export growth in a fast growing and export oriented middle-income country i.e., Costa Rica during 1997-2007. It provides a detailed description of the contribution of export entrepreneurs in the short and long run, and compares the observed patterns with an emerging literature on the role of the “extensive” margin in international trade. On a year-by-year basis, the rate of firm turnover into and out of exporting is high, but exit rates decline rapidly with age (i.e., the number of years the firm has been exporting). On average, about 30 percent of firms in each year tend to exit export activities, and a similar percentage of firms enter. The exiting and entering firms tend to be significantly smaller than incumbent firms in terms of export value (e.g., entrants export about 30 percent less on average than incumbent firms). These findings are consistent with existing evidence for other middle income Latin American countries. However, in the long run new product-firm combinations (i.e., product-firm combinations not present in 1997) account for almost 60 percent of the value of exports in 2007. Surviving new exporters actively adopted new products (for the firm, but not necessarily new for the country) and abandoned weaker existing products they started with, and their export growth rates were very high during a period (1999-2005) when those of incumbent exporting firms were actually negative. JEL codes: F14
*Daniel Lederman (corresponding author) is a lead economist at the International Trade Department of World Bank. Andrés Rodríguez-Clare is a professor of economics at the Pennsylvania State University and a faculty research associate of NBER. Daniel Yi Xu is an assistant professor of economics at New York University and a faculty research fellow of NBER. The authors gratefully acknowledge financial support from the World Bank’s Latin American and Caribbean Regional Studies Program under the proyect on the “Quality of Trade” led by William F. Maloney and from the Costa Rica Competitiveness Project led by José Luis Guasch, Thomas Haven, and José Guilherme Reis. The following colleagues provided useful insights and guidance during preliminary discussions: José Luis Guasch, Porfirio Guevara, Bill Maloney, Martha Denise Pierolo, Roberto Alvarez, and Augusto de la Torre. Javier Cravino and Oana Luca provided stellar research assistance at various stages. Ronald Arce (PROCOMER), Francisco Gamboa (Research Director, PROCOMER), and Ricardo Matarrita (INCAE, formerly with PROCOMER) spent time providing and explaining the PROCOMER data during recent years. Last but not least, we gratefully acknowledge invaluable comments provided by two anonymous referees and Betty Sadoulet.

Successful exporting countries are often seen as successful economies. Most governments
use export promotion policies and have established export promotion agencies, regardless
of the level of development or institutional capacities (Lederman, Olarreaga and Payton
2010). The World Bank consistently argues that promoting trade and exports in particular is
a recipe for promoting firm and national productivity (e.g., Fajnzylber, Guasch, and López
2009). East Asian economies used export targets as part of their development strategies in
the 1970s and 1980s (Noland and Pack 2003, Pack 1997). Furthermore, export activities are
also seen by policymakers as a means to improve the productivity or other outcomes of
small and medium enterprises, and thus export promotion policies are often designed to
serve these firms rather than large or multinational corporations (Volpe and Carballo 2008).
In this paper we study the role of new export entrepreneurs in determining export
growth. We focus on the case of Costa Rica, a successful middle-income economy, during
the period 1997-2007. This article provides a detailed description of the contribution of
export entrepreneurs in the short and long run, and compares the observed patterns with an
emerging literature on the role of the “extensive” margin in international trade (e.g.,
Besedes and Prusa 2006, 2010; Eaton et al. 2007; Alvarez and Fuentes 2009; Brenton et al.
2010; Freund and Pierola 2010).
The empirical analysis relies on customs data compiled by the Costa Rican export
promotion agency, PROCOMER, which is part of the Ministry of Foreign Trade. The data
includes all firms with positive exports during 1997-2007 and provides information on
export values by year classified by product categories as well as quantities measured in
kilograms and destination markets. Although the information is limited, because it does not
1
provide information about domestic sales or other variables that would be needed to
calculate standard indicators of firm productivity, it does allow us to decompose export
growth and explore the role of firm turnover in and out of exporting activities, as well as
the main drivers of export growth across firms of different export sizes (in terms of value).
The main findings are as follows. On a year-by-year basis, the rate of firm turnover
into and out of exporting activities is quite high. On average, about 30 percent of incumbent
exporting firms in each year tend to exit export activities while a similar percentage of
firms are new exporters. The exiting and entering firms tend to be significantly smaller than
incumbent firms in terms of export value (e.g., entrants export about 30 percent less on
average than incumbent firms). Over 40 percent of firms exit exporting after one year, and
the exit rate thereafter hovers around 20 percent.1 To put these numbers in an international
comparative perspective, Freund and Pierola (2010) report that 34 percent of Peruvian
firms that export agricultural and agribusiness products exit after one year. Brenton et al.
(2010) report that for middle-income economies only about 51 percent of product-
destinations survive past the first year, with the rate of survival stabilizing just below 20
percent in subsequent years.
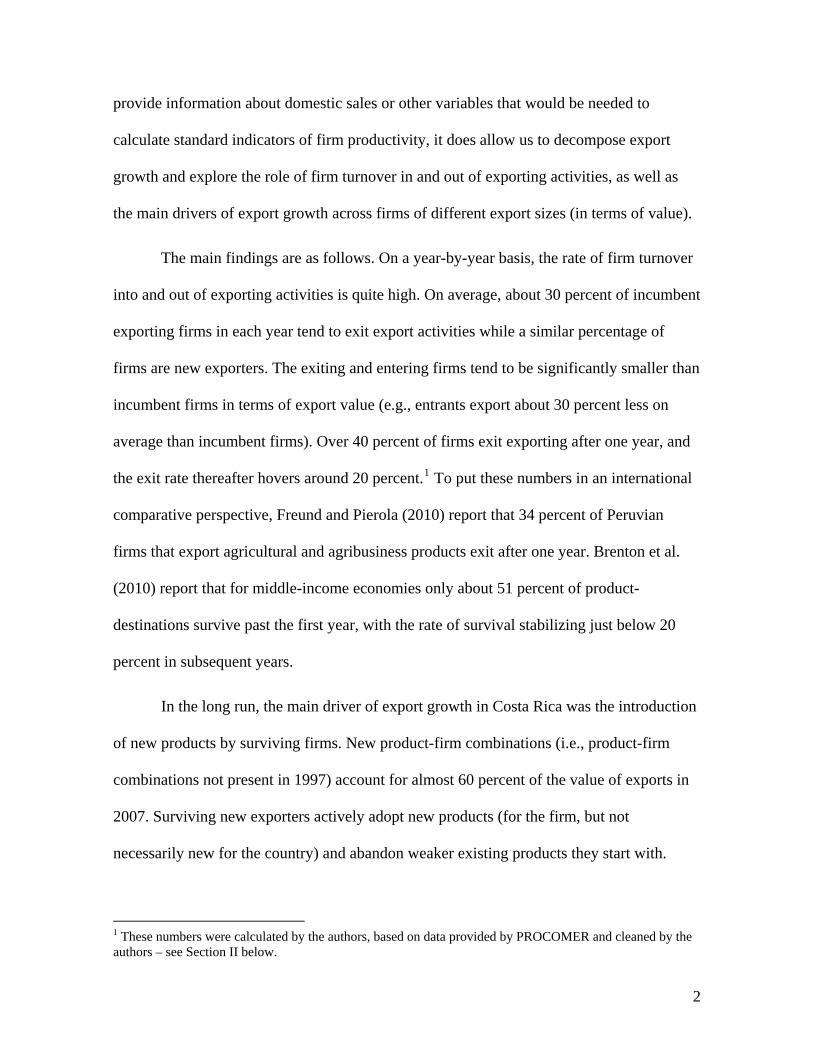
In the long run, the main driver of export growth in Costa Rica was the introduction
of new products by surviving firms. New product-firm combinations (i.e., product-firm
combinations not present in 1997) account for almost 60 percent of the value of exports in
2007. Surviving new exporters actively adopt new products (for the firm, but not
necessarily new for the country) and abandon weaker existing products they start with.
1 These numbers were calculated by the authors, based on data provided by PROCOMER and cleaned by the authors – see Section II below.
2

The rest of this paper is organized as follows. Section I briefly compares Costa
Rica’s export and growth performance during 1997-2007 with other countries and regions.
Section II discusses the PROCOMER data by comparing the series with other data on
Costa Rican exports. This section also describes how the firm data was cleaned and
discusses key features of the resulting data set, including the lack of significant changes in
the composition of exports and exporting firms across broad industrial categories. Section
III presents the microeconomic accounting frameworks used to assess the contribution of
incumbent and new firms, products and export market destinations, to total export growth
in the short run and in the long run. Section IV concludes with a brief summary of the
results.
I. Costa Rica’s Export and Growth Performance in Comparative Perspective, 1997-
2007
Table 1 shows average growth rates of exports (measured in current U.S. dollars) and Gross
Domestic Product per capita (adjusted for Purchasing Power Parity with international prices
of 2005) for the period 1997 – 2007.
Costa Rica’s average export growth during this period was 9 percent per year. This
is a bit higher than the average growth rate for Latin America and the Caribbean region,
and clearly superior to the Central America and Caribbean region, but lowers than the
average for all the other regions. Within Latin America, Costa Rica’s export growth
performance is dominated by Peru and Chile, which achieved export growth rates of 16.4%
and 15.7%, respectively.
3

The picture is slightly better when looking at GDP per capita growth rates.
Costa Rica’s economic growth rate of 3.3% is higher than Peru and Chile, and higher than
the average for all regions except Europe and Central Asia and South Asia. This suggests
that Costa Rica’s overall economic performance was relatively more impressive than its
export growth rate
II. The PROCOMER Data
Before conducting a detailed analysis of the microeconomics of export growth, we need to
ascertain the quality of the data. Figure 1 compares the value of total Costa Rican
merchandise exports in the PROCOMER data with the World Bank’s data on total
merchandise exports, which come from official government sources,.
The two series are not identical, which is worrisome. However, the over time
correlation is very strong, and thus the PROCOMER data does capture the direction if not
the exact magnitude of merchandise export growth observed in the macroeconomic data.
The divergence between the two series is largest in 1997 and 1998, which converge to a
constant gap in 1999. Consequently, the PROCOMER data tend to exaggerate the total
export growth rates in 1998 and 1999, but the subsequent growth rates are comparable, as
shown in Table 2. Nonetheless, the underlying microeconomic dynamics observed in the
PROCOMER data are informative for understanding the sources of total export growth
during this time period.
4

Unfortunately there are other issues with the PROCOMER data, which would affect
the microeconomic analyses. Table 3 lists the steps taken to clean the data and the main
features of the resulting data set.
The cleaning focused on issues that are relevant for understanding the
microeconomic sources of export growth, including the role of incumbent, new and exiting
firms, products and destinations, as well as unit values (the ratio of export value over
quantities exported measured in kilograms). Hence we removed duplicate observations of
firms-product-destinations, deleted observations where the description of the product was
empty, entries where the reported quantity was zero, observations that reported Costa Rica
as the destination market, etc. After this phase of the cleaning, the total number of
observations of firms-products-year-destinations declined by about 6,000 observations and
total export value declined by 0.26 percent. The next step was to remove any remaining
duplicate observations that were due to the recording of the same firm, but with spelling
mistakes or other errors in the reported name of the firm. This step reduced the total
number of firm-product-destination-year observations by about 800. Finally, given that we
are interested in learning about Costa Rican firm dynamics in export activities, we removed
the observations corresponding to two big multinational corporations, INTEL and Abbott
Labs, whose export experience is better suited for firm case studies. INTEL alone
accounted for over 23 percent of the value of exports of Costa Rica during 1997-2007,
while Abbot contributed over 3 percent of the total.
Table 4 describes the main features of the resulting data set. Regarding export
growth, the resulting data shows a weaker performance than the aggregate export data
presented in Figure 1. The year 1998 remains an outlier with a real growth rate of 29
5

percent, even after removing the exports from INTEL and Abbot.2 This year was also an
outlier in the aggregate export data. In the remaining years, the real export growth rates
were rather mediocre when compared to the aggregate data, with negative real growth rates
during the years of the East Asian financial crisis of 1997-1999, the beginning of the U.S.
slowdown in 2000-2001, and the incorporation of China as a full member of the World
Trade Organization in 2001. Thereafter the real export growth rates were positive but
modest, except in 2006 when it reached 10 percent.
The most striking feature of the data, however, is the low number of firms that
reported exports in every year during 1997-2007, which were 554. This is a mere 6.2
percent of the total number of firms that appear in the sample during the eleven years. The
number of continuing products, measured either at the 6- or 10-digit product categories, is
also small relative to the total number of products exported at any time during this period
(27.6 and 15.5 percent, respectively). The difference between these ratios also indicates that
the level of aggregation of the product categories affects the accounting of the contribution
of the new products. In contrast, the number of export destinations was relatively constant
over time, and over 46 percent of destinations were serviced every year. Overall, the
cleaned data suggests that the rate of turnover of exporting firms and products is quite high,
with very few continuing firms and products, the latter being sensitive to the product
nomenclature.
Table 5 provides a standard analysis of the composition of trade. It shows the export
shares of broad industrial sectors. If the aforementioned high turnover rates of firms and
products were associated with structural change across industries, we should also observe
2 It is noteworthy that both companies began exporting from Costa Rica in 1998.
6

dramatic changes in the composition of trade. The data in this regard is a bit noisy and
needs to be analyzed with caution. The last industry, which is broadly labeled “services”,
captures over 13 percent of total exports at the beginning of the sample but falls to zero by
2001. Also, the industry labeled “Miscellaneous” experienced a dramatic increase in its
share, but it is difficult to interpret these fluctuations in export shares as structural change
precisely because these industries are loosely identified. Perhaps more interestingly,
between 2001 (when “services” were more appropriately recorded as having a zero share in
the merchandise export accounting) and 2007 the most dramatic decline happened in
textiles and apparel, an industry that we know faced tough competition from Chinese
exports to third markets, including the United States, as a result of its WTO accession and
the dismantling of the Multi-Fiber Arrangement that had historically maintained high levels
of protection for costly producers in high-income countries (see Ozden and Sharma 2006
and Ozden 2006).3 In brief, the changes of the inter-industry structure of Costa Rican
exports between 1997 and 2001 seems to be a recording illusion, due to the role of
“miscellaneous” and “service” merchandise exports, and after the latter category
disappeared in 2001, the only notable structural change is related to the textile and apparel
sectors. More importantly, these structural changes are very small when compared to the
evidence concerning the rather high rates of firm and product turnover rates during 1997-
2007. Thus, most of the action in terms of firm and product dynamics was within sectors,
rather than across broad industrial categories. This observation alone makes the fast
growing literature on firm heterogeneity and within industry dynamics (e.g., Melitz 2003)
3 Ozden and Sharma (2006) found that preferential margins on apparel exports to the U.S. from beneficiaries of the Caribbean Basin Initiative declined significantly during 2000-2002 when compared to 1992-2000. Ozden (2006) found that Costa Rican apparel exports to the U.S. declined after 2000, but that average unit values (prices) of apparel exports to the United States rose.
7

of particular interest to the case of Costa Rica. In this light, the following sections assess
the contribution of firm, product and export-destination dynamics to overall export growth.
III. Accounting for Microeconomic Sources of Export Growth
What are the main micro sources that drive export dynamics? We borrow the
insights from the literature of industry dynamics to view firms’ exporting behavior as a
process of “creative destruction.” A consistent message from the industry dynamics
literature, both empirical and theoretical, is that new firms are born small and suffer a high
hazard rate of exit. Yet, in the medium to long run, the new firms that manage to survive
grow rapidly and take over the incumbents. This in turn forces the inefficient incumbent
firms to quit the market.
While a lot of previous studies have looked at the above-described process using
data of firm domestic sales, entry, and exit, few have investigated this with data on firm
export market dynamics. The related work in this area includes Colombia (Eaton et al.,
2007), Chile (Alvarez and Fuentes 2009), and Peru (Freund and Pierola 2010). We believe
that looking at trade transactions data brings some empirical advantage compared with
previous studies based on industry census data.
First, customs data provides richer information on how new firms expand and
prosper over time. They can expand by selling products in more markets, or adopting
existing product lines, or creating brand new products. While each of these activities will be
reflected in the growth of export sales, they tend to have different implications for
competition, resource allocation, and welfare.
8

Second, the fact that exporting firms potentially serve multiple markets at different
points in time provides rich variation in controlling for firm’s initial heterogeneity and
avoids selection bias.
To assess the contribution of microeconomic dynamics related to firm, product and
export destinations, we conduct two sets of export-decomposition exercises. The first
concerns the contribution of microeconomic dynamics to short-term growth, namely on
annual growth rates during 1997-2007. The second explores the contribution of new export
entrepreneurs, products and export destinations in the longer run, which is defined as a five-
year period of export growth (1999-2004).
Short-run decomposition framework
The export-growth decomposition framework used by Eaton et al. (2007) to study
export growth in Colombia is given by equation (1):
(1)
)(2
1)(
2
1
)(2
1)(
2
1)(
2
1)(
2
1
)(2
1
)(2
1XX
1
111
1
11
1
11
1
11
1
1
1
1
1
1
tt
ttEXt
tt
tt
tt
ttENt
tt
tt
CNt
CNt
CNt
CNt
tt
CNt
CNt
tt
tt
XX
XNEXX
XX
XNEX
XX
XNENX
XX
XNEN
XX
XX
XX
XX
XX
where equals total exports in period t; is the average exports (across firms) in
period t-1; CN, EN and EX are indexes for variables corresponding to continuing, entering
and exiting firms, respectively (continuing firms are those that exported both in t and t-1,
9

entering firms are those that exported in t but not in t-1, and exiting firms are those that
exported in t-1 but not in t); and NENt and NEXt is the number of entering and exiting
firms in t, respectively. The denominator in the export growth ratio is the average of
exports in t and t-1, which Eaton et al. use for convenience so that the growth rates do not
depend on the one year. In any case, the results, discussed further below are not
significantly affected by this choice of denominator.
In a nutshell, the decomposition exercise separates the contributions to annual
export growth of incumbent, entering and exiting firms. The contribution of incumbent
firms is simply the product of the share of exports of incumbent firms times their export
growth. This contribution appears in the first term inside brackets in equation (1).
The contribution of entering firms has two components, both appearing inside the
brackets of the second term on the right-hand side of (1). The first is simply the number of
entering firms as a share of average number of total firms in t-1 and t. In (1), this is written
as the number of entrants times the average exports per firm in t-1. The second component
concerns the deviation of the average exports of new firms from the average exports of
incumbent firms, the latter being equal to the number of new firms’ times the average
exports per firm in the previous year. The contribution of exiting firms is analogous to the
decomposition of the contribution of entrants.
The results from these decompositions of annual export growth rates are presented
in the following section and Table 6a. As discussed below, the annual growth rates are
dominated by the contribution of incumbent firms. Thus, we explore the contribution of
new and exiting products and export destinations by incumbent firms in Tables 5b and 5c.
Short-run results
10

The first column of Table 6a shows the annual growth rate of real exports observed
in the cleaned PROCOMER data. The second column shows the share in total exports in
the previous year due to incumbent firms, and the third column contains the export growth
of these incumbent firms. The evidence clearly shows that incumbent firms dominate
export growth from year to year, as over 95 percent of total exports in the previous year
were due to firms that remained as exporters in the following year. Consequently the export
growth rate of the incumbent firms closely tracks the annual growth of total exports.
Interestingly, the rate of turnover of exporting firms is large. The number of entrants
accounts for more than 27 percent of the number of firms in every year – see column 4.
Similarly, the rate of exit is higher than 25 percent every year – see column 6. Furthermore,
the average exports of entrants and departing firms tended to be low relative to the average
export value of incumbent firms. This is reflected in the value gap of entrants and departing
firms, which was around 30 percent during the period (i.e., entrants were 30% smaller than
incumbents, and similarly for firms that stopped exporting). Thus, incumbent firms’ export
growth dominates year by year export growth in spite of the rather high turnover rate of
exporting firms, because both new and exiting firms export very low values.
The results on firm dynamics for Costa Rica seem high. However, the evidence
from Colombia and Chile also suggest that firm turnover in export activities tends to be
high. For the case of Colombia, Eaton et al. (2007) report entry rates that average over 45
percent and the average exit rates surpass 43 percent per year during 1996-2005. Alvarez
and Fuentes (2009) report comparable rates for Chilean manufacturing exports during
1991-2001 when annual entry rates averaged over 29 percent while exit rates ranged
between 8 and 28 percent. Freund and Pierola (2010) also found high entry and exit rates of
11

export entrepreneurs in the agricultural and agribusiness sectors in Peru during 1994-2007.4
Thus the results for Costa Rica in terms of firm dynamics seems consistent with data from
other case studies.
Next, we investigate the growth and decline path of incumbent firms. The customs
data provides us with two important dimensions of incumbent firms’ export dynamics:
destinations and products. Regarding the role of new export destinations in shaping the
growth of exports of incumbent firms, Table 6b shows the results from the decomposition
of the annual export growth of incumbent firms into incumbent destinations, new
destinations, and exiting destinations. Not surprisingly, incumbent destinations account for
most of the observed export growth of incumbent firms, but we do observe non-trivial entry
and exit of new destination markets. Table 6c presents the results concerning the
contribution of the new and exiting products exported by incumbent firms. The entry and
departure rates of products exported by incumbent firms are very high, even higher than the
firm and export-destination turnover rates reported in tables 5a and 5b. Also, the value gaps
are larger for new and exiting products than for entering and exiting firms or destinations.
In sum, in the short-run, the growth rate of exports by incumbent firms is the main
factor behind the aggregate export growth rate, but this occurs with vigorous firm
dynamics. These dynamics are characterized by high firm entry and exit from export
activities, experimentation by incumbent firms with new markets and especially new
products. The introduction of new products and the shedding of existing products by
incumbent firms tend to be the largest source of renewal for Costa Rica’s exports. 4 Freund and Pierola (2010) report entries and exits in the annual data ranging from under 100 at the beginning of the period to close to 200 by the end. They also report that the total number of firms in the sectors they investigate peaked at 593 in 2007. Both Freund and Pierola (2010) and Besedes and Prusa (2010) propose theoretical models that rely on ex-post realizations of fixed costs of exporting to explain these high rates of entry and exit.
12

Firm dynamics and export growth in the long run
The previously discussed results concern annual export growth rates. Given that
incumbent firms dominate aggregate export growth in the short run, but with notably high
churning at the firm and firm-product levels, it is worth asking whether new firms,
products, or destinations made significant contributions to Costa Rica’s total export growth
between 1997 and 2007. In the long run we can expect much higher contributions to total
exports from firm dynamics. For instance, in the case of Colombia, existing evidence
indicates that the contribution of new firms to total export growth (of 7.6 percent) between
1996 and 2005 rose from 10 percent on an annual basis to 26 percent for the whole period.
The case of Chilean manufacturing exports is more dramatic: the contribution of entering
firms to total export growth during 1991-2001 (which averaged 11.5 percent per year) rises
from 23 percent on an annual basis to over 83 percent over the whole period. In the case of
Costa Rica, new product-firm combinations (i.e., product-firm combinations not present in
1997) account for almost 60 percent of the value of exports in 2007.5 However, what are
the firm dynamics behind this high long-run contribution of export entrepreneurship? Is it
that new exporters grow faster than incumbent firms when they survive for a few years? If
so, is this export growth by new export entrepreneurs associated with changes in products?
To better understand the microeconomic dynamics underpinning the long run result
we use the period 1999-2005 and examine the contribution of new exporters relative to
incumbents. We start with year 1999 to identify the “new’’ exporters. We define any firm
that never appears in the customs records before 1999 (i.e. on 1997 and 1998) and enter the
5 This finding is also consistent with an analysis of the contribution of new products and new destinations utilizing SITC 4-digit product level data provided by an anonymous referee: In 2008, ninety three percent of total exports were due to product-destination relationship that existed in 1999.
13

record on or after 1999 as a “new” firm. This helps to alleviate the concern of the initial
status problem since our sample starts in 1997. With a similar rule, we define a firm as an
“exiting” exporter if it appears in custom records on or before 2005 and never appears in
the customs records after 2005 (i.e. on 2006 and 2007). Incumbent exporters are defined as
those that enter before 1999 and survive until 2005. The benefit of these definitions is that
the group of incumbent exporters is fixed over the whole period. This allows us to evaluate
the contribution of “new” exporters to long-run export growth despite their extremely high
year-by-year turnover rate.
Table 7 summarizes the share of Costa Rica’s total exports by entrants versus
incumbents. It illustrates that the new exporters as a group experienced an increase in
exports by almost a factor of ten during the sample period. In contrast, the sales of
incumbent exporters declined by 25% over the same period. This is consistent with earlier
empirical findings that older firms grow slower and their growth rate eventually becomes
negative (see, for instance, Dunne, Roberts, and Samuelson 1989 on manufacturing plants
in the United States). Overall, it is fair to say that new exporters are the main driving force
of export growth in this sample period. If we think of “exporting entrepreneurship” as entry
of new firms into exporting, we can say that over the medium term export entrepreneurship
is the main driver of export growth in Costa Rica. What are these new exporters doing?
How are they growing? This is what we explore next.
To further understand the path of new exporter dynamics, we can also look at each
cohort of these entrants. We define the year 1999 cohort as the new exporters that appear
for the first time in custom records in year 1999. In Table 8 we trace out the annual export
sales of surviving 1999 cohort firms and exiting 1999 cohort firms. As shown in Table 8,
14

although the majority of the 1999 cohort exited before the end of our sample (only 152 out
of 732 remain), the exiting firms as a group account for very little in terms of total export
sales of the whole cohort. As a result, total exports of this cohort were dominated by
surviving firms. The results of Table 8 are consistent with the view that although new
exporters enter small and have a high failure rate, the surviving ones tend to catch up with
incumbents quickly.
A natural question here is whether the new product margin is an important channel
for growth among surviving new exporters. To answer this question, we separate new
exporters’ products into two categories. We define “initial products” as the 6-digit products
that the new exporters sell in the first year of their export market participation. We further
define “added products” as those 6-digit products that are added in their later years of
exporting. In Table 9a, we report the sales coming from “initial products” and “added
products” for the surviving exporters within the 1999 and 2000 cohorts. Both cohorts
exhibit a similar pattern: the new product margin and the initial product margin are equally
important in contributing to new exporters’ sales growth in the long run. The “added
products” category explains close to 40% of new exporters’ growth after 5 years, while the
within “initial product” category growth is also very strong over the similar time span and
explains 60%. In contrast, in Table 9b, we report the value of “continuing products” and
“added products” of incumbent firms which survive until year 2005. For this group of
firms, the “continuing products” are 6-digit products they’ve already exported before 1999.
Although this group of firms as a whole declines over time, their “added products” still
grows quite substantially from 1999-2005. However, compared with the new exporters of
1999 and 2000, the growth rate of “added products” from incumbent firms is lower.
15

Table 9c documents how new exporters drop their initial products and how the
remaining initial products grow. We again focus on the 1999 cohort. The evidence suggests
that the creative destruction process on the product margin within exporters also has a
strong selection effect. New exporters keep only the strongest products that they start with
and drop the weaker products along the way. Table 9d reports how incumbent exporters
drop their continuing products and how the surviving products grow. Similar to new
exporters, incumbent exporters also drop their weaker products over the years. However,
their surviving products also decline gradually, while the surviving initial products of new
exporters grow strongly. This explains a large fraction of the difference in export growth
between new and incumbent exporters
Overall, Tables 6-8 provide a coherent picture of Costa Rica’s export growth from
1999 – 2005. We find that the surviving new exporters are the major contributing force to
aggregate export growth. Meanwhile, they actively adopt more products and abandon
weaker existing products they start with. So in this sense, the survival of new exporters
itself is not random: it is partially determined by a firm’s active experimentation with their
export product lines.
IV. Conclusion
Costa Rica’s export growth was not stellar when compared to other countries, and
even less so without the contributions of two large multinational corporations. Inter-sectoral
adjustments across broad industries were negligible, both in terms of export-value shares
and in terms of the number of exporting firms as a share of the total number of exporting
firms. Hence, most of the action seems to be associated to within-industry dynamics.
16

In the short run, by far the major contribution to export growth came from
incumbents exporting more of the same products to the same markets, but there are high
rates of turnover in firms, products and destinations that become very important in the long
run. Almost 60 percent of export growth was due to incumbent firms exporting products
that were not originally exported in 1997. Most of this number is due to surviving new
exporters who actively add new products and drop weaker ones.
Overall, one way to interpret our findings is that the country’s export performance
was primarily limited by the inability of firms to survive the test of exporting. In contrast, it
is difficult to interpret our findings as providing support for one of the key suspected
obstacles to export growth, namely the inability of small firms to enter exporting activities
or to grow their exports. In fact, new exporting firms experienced the fastest growth in their
export values, so that over the long run they contribute almost as much to overall export
growth as incumbents.
17

Appendix
Table A1. Broad Industrial HS Classification Used in Table 5.
1 Animal and Animal Products 2 Vegetable Products 3 Food stuffs 4 Mineral Products 5 Chemicals and Allied Industries 6 Plastics / Rubbers 7 Raw Hides, Skins, Leather, and Furs 8 Wood and Wood Products 9 Textiles / Apparel 10 Footwear / Headgear 11 Stone / Glass 12 Metals 13 Machinery / Electrical 14 Transportation 15 Miscellaneous 16 Service
18

References
Alvarez, Roberto, and Rodrigo Fuentes. 2009. “The Quality of Trade: Unit Value
Dynamics.” Mimeo. Central Bank of Chile and Department of Economics, Catholic
University of Chile, Santiago, Chile.
Besedes, T., Prusa, T.J. 2010. “The Role of the Extensive and Intensive Margins and
Export Growth.” Journal of Development Economics, forthcoming,
Besedes, Tibor, and Thomas Prusa. 2006. “Ins, Outs and the Duration of Trade.” Canadian
Journal of Economics 104(1): 635-54.
Brenton, Paul, Christian Saborowski, and Erik Von Uexkull. 2010. “What Explains the
Low Survival Rate of Developing Country Export Flows?” The World Bank Economic
Review, forthcoming
Dunne, Timothy, Mark J. Roberts, and Larry Samuelson. 1989. “The Growth and Failure of
U.S. Manufacturing Plants.” The Quarterly Journal of Economics 104(4): 671-98.
Eaton, Jonathan, Eslava, Marcela, Kugler, Maurice and James Tybout. 2007. “Export
Dynamics in Colombia: Firm-Level Evidence.” NBER Working Paper 13351, National
Bureau of Economic Research, Inc., Cambridge, MA.
19

Fajnzylber, Pablo, José L. Guasch, and J. Humberto López, editors. 2009. Does the
Investment Climate Matter? Microeconomic Foundations of Growth in Latin America.
World Bank: Washington, DC.
Freund, Caroline, and Martha Denisse Pierola. 2008. “Export Entrepreneurs: Evidence from
Peru.” World Bank Policy Research Working Paper 5407, Washington, DC.
Lederman, Daniel, Marcelo Olarreaga, and Lucy Payton. 2010. “Export Promotion
Agencies: Do They Work?” Journal of Development Economics 91: 257-65.
Melitz, Marc. 2003. “The Impact of Trade on Intra-Industry Reallocations and Aggregate
Industry Productivity.” Econometrica 71(6): 1695-1725.
Noland, Marcus, and Howard Pack. 2003. Industrial Policy in an Era of Globalization:
Lessons from Asia. Institute for International Economics: Washington, DC.
Ozden, Caglar. 2006. “Caribbean Basin Initiative Beneficiary Countries and the Apparel
Sector: Same Preferences, Different Responses.” Mimeo, Development Research Group,
The World Bank, Washington, DC.
Ozden, Caglar, and Gunjan Sharma. 2006. “Price Effects of Preferential Market Access:
Caribbean Basin Initiative and the Apparel Sector.” World Bank Economic Review 20(2):
241-260.
20

Pack, Howard. 1997. “The Role of Exports in Asian Economic Development and Lessons
from Latin America.” In Pathways to Growth, edited by N. Birdsall and F. Jaspersen.
Baltimore: Johns Hopkins University Press.
Volpe Martinicus, Christian, and Jerónimo Carballo. 2008. “Beyond Average Effects: The
Distributional Impacts of Export Promotion Programs in Developing Countries.” Mimeo.
Inter-American Development Bank, Washington, DC.
21

Figure 1. Costa Rica: Merchandise Exports versus PROCOMER Data, 1997-2007
3,000
4,000
5,000
6,000
7,000
8,000
9,000
10,000
1997 1998 1999 2000 2001 2002 2003 2004 2005 2006 2007
(Mill
ion
s U
SD
)
PROCOMER Aggregate merchandise exports (current US$)
Source: Data are from PROCOMER and World Bank, and both series are expressed in current U.S. dollars.
22

Table 1. Annual Merchandise Export and GDP per Capita Growth Rates, 1997-2007
Country/GroupsMean Median Mean Median
Costa Rica (1) 0.090 0.129 0.033 0.042
Peru (2) 0.164 0.160 0.028 0.033Chile (2) 0.157 0.147 0.026 0.030China (3) 0.215 0.215 0.088 0.088Cambodia (3) 0.200 0.173 0.073 0.074Azerbaijan (4) 0.317 0.361 0.140 0.100Albania (4) 0.253 0.266 0.065 0.055Libya (5) 0.210 0.230 0.016 0.026Lebanon (5) 0.198 0.168 0.013 0.012Buthan (6) 0.199 0.127 0.061 0.045India (6) 0.158 0.193 0.055 0.062Chad(7) 0.520 0.058 0.046 0.039Sierra Leone (7) 0.447 0.480 0.043 0.039Slovak Republic (8) 0.207 0.154 0.048 0.041Czech Republic (8) 0.190 0.156 0.035 0.037Equatorial Guinea (9) 0.374 0.422 0.190 0.143Trinidad and Tobago (9) 0.215 0.236 0.076 0.074Kazakhstan (10) 0.240 0.243 0.080 0.089Lybia (10) 0.210 0.230 0.016 0.026Sudan (11) 0.340 0.291 0.045 0.040Azerbaijan (11) 0.317 0.361 0.140 0.100Chad (12) 0.520 0.058 0.046 0.039Sierra Leone (12) 0.447 0.480 0.043 0.039
Singapore 0.100 0.129 0.034 0.040Ireland 0.087 0.078 0.047 0.037Hong Kong 0.067 0.090 0.032 0.040
Latin America and Caribbean 0.084 0.083 0.020 0.019Central America and Caribbean (1) 0.055 0.051 0.022 0.023Latin America (2) 0.114 0.123 0.017 0.014East Asia and Pacific (3) 0.097 0.088 0.026 0.020Europe and Central Asia (4) 0.168 0.171 0.062 0.060Middle East and North Africa (5) 0.163 0.162 0.023 0.026South Asia (6) 0.126 0.104 0.042 0.042Sub‐Saharan Africa (7) 0.121 0.094 0.017 0.016High income OECD members (8) 0.097 0.087 0.026 0.023High income non OECD economies (9) 0.112 0.095 0.035 0.025Upper‐middle income economies (10) 0.105 0.093 0.034 0.030Lower‐middle income economies (11) 0.135 0.114 0.035 0.026Low income economies (12) 0.119 0.094 0.017 0.018
Exports GDP per Capital (PPP)
Note: This table presents mean and median annual growth rates of merchandise exports (current US$) and GDP
per capita PPP (constant 2005 international $) for each of the described groups. The regional and income country
classifications come from the World Bank (as of July 2008). Each country's group is indicated inside parentheses.
Highlighted cells indicate cases where the corresponding mean or median growth rate was below Costa Rica's. All
data are from the World Bank's World Development Indicators.
Export Over Achievers
Regional and Income Groups
Other Comparator Countries
23
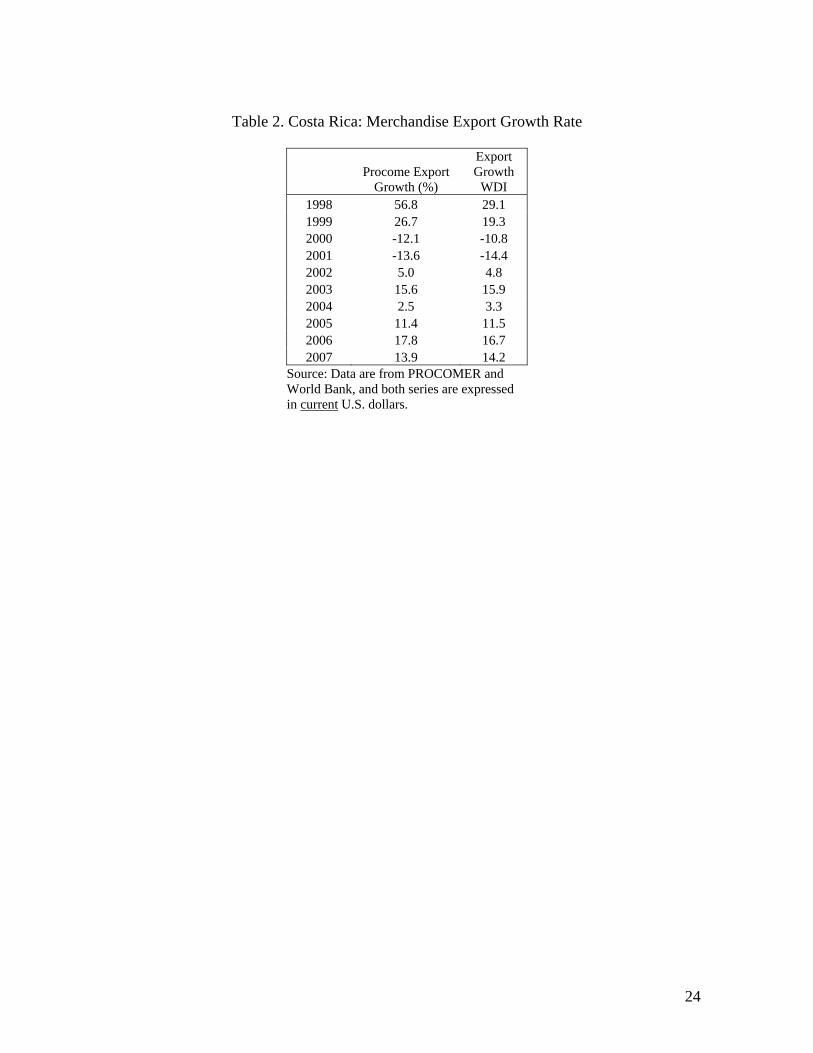
Table 2. Costa Rica: Merchandise Export Growth Rate
Source: Data are from PROCOMER and World Bank, and both series are expressed in current U.S. dollars.
Procome Export
Growth (%)
Export Growth
WDI 1998 56.8 29.1 1999 26.7 19.3 2000 -12.1 -10.8 2001 -13.6 -14.4 2002 5.0 4.8 2003 15.6 15.9 2004 2.5 3.3 2005 11.4 11.5 2006 17.8 16.7 2007 13.9 14.2
24

Table 3. Cleaning the PROCOMER Data
Step # of observations
Total real export value (1997 U.S.$)
Share of initial
value (%) Raw data 296,238 59,219,688,885 100
(-) Duplicate entries 10 174,453 0.00
(-) Entries with desc="" 56 3,584,951 0.01
(-) Entries with quantity 0 4,739 3,638,070 0.01
(-) country: Costa Rica 217 2,144,049 0.00
(-) country: Alta Mar 4 44,239 0.00
(-) country: Generico 189 4,821,894 0.01
(-) country: Zonas Francas de Exportacion 678 148,249,409 0.25
Subtotal 290,345 59,057,031,820 99.73
Cleaning firm-product-year-country observations (consolidation of observations with similar firm names)
289,549 59,057,031,820 99.73
(-) Abbott entries (product-destination-years) 1,157 1,816,626,930 3.07
(-) Intel entries (product-destination-years) 3,277 13,689,799,703 23.12
Cleaned data 285,115 43,550,605,188 73.54
Source: Authors’ calculations based on data from PROCOMER.
25

Table 4. Summary of the Cleaned PROCOMER Data: Real Export Growth, Firms, Products, and Destinations
Year Total exports (1997 USD)
Growth (%) Firms
HS6 products
HS10 products Destinations
1997 3,217,752,622 - 2,200 2,454 3,283 121 1998 4,157,732,964 29 2,328 2,629 3,513 129 1999 3,911,376,028 -6 2,432 2,599 3,505 116 2000 3,695,897,353 -6 2,392 2,594 3,557 121 2001 3,573,232,631 -3 2,493 2,626 3,641 127 2002 3,827,746,595 7 2,531 2,592 3,707 129 2003 3,860,064,635 1 2,670 2,736 3,869 133 2004 4,055,665,596 5 2,760 2,774 3,915 134 2005 4,083,061,065 1 2,863 2,800 3,933 138 2006 4,507,923,206 10 2,937 2,833 4,087 136 2007 4,660,152,494 3 2,973 2,878 4,293 151
1997-2007 (total) 8,865 4,568 7,941 189 1997-2007 (continuing) 554 1,262 1,232 88 Continuing/Unique (%) 6.2 27.6 15.5 46.6
Source: Authors’ calculations based on data from PROCOMER and World Bank. Export growth is expressed in constant U.S. dollars of 1997, using the U.S. Producer Price Index as deflator.
26

Table 5. Broad Inter-Sectoral Changes are Absent A. Sectoral Shares in Total Exports (%)
Ind 1997 1998 1999 2000 2001 2002 2003 2004 2005 2006 2007 1 10.3 8.6 4.4 4.2 4.4 4.1 4.0 3.4 3.6 3.0 3.0 2 33.1 29.9 31.0 27.0 26.9 25.5 27.9 27.0 26.1 26.7 27.9 3 8.5 8.2 8.7 9.0 9.4 10.2 10.1 11.2 11.0 11.6 13.5 4 0.8 0.7 0.8 1.5 1.4 1.6 0.9 0.3 1.0 0.9 1.0 5 5.1 5.0 5.8 6.6 7.7 7.9 8.5 8.5 8.2 7.8 8.1 6 3.7 3.2 4.0 4.5 4.9 5.2 5.5 6.0 6.6 6.5 6.0 7 1.1 1.4 1.5 1.2 1.2 1.0 1.2 1.8 1.7 1.4 1.1 8 3.0 2.7 3.0 2.9 3.0 2.9 2.6 3.3 3.3 3.4 3.7 9 6.0 16.7 18.0 19.1 18.0 17.4 13.9 11.7 10.4 8.1 6.8 10 0.5 0.5 0.4 0.2 0.1 0.0 0.0 0.0 0.0 0.0 0.0 11 2.0 2.5 2.6 2.2 2.5 2.7 2.3 2.1 2.4 2.9 2.5 12 2.8 2.6 2.8 3.0 3.0 3.0 3.1 3.7 4.2 4.9 5.7 13 8.0 10.8 9.6 12.4 11.5 12.6 13.1 14.2 13.6 14.6 11.4 14 0.2 0.3 0.4 0.8 0.9 0.5 0.7 0.4 0.5 0.5 0.7 15 1.6 3.7 4.0 4.1 5.1 5.4 6.0 6.5 7.3 7.6 8.8 16 13.2 3.1 2.9 1.1 0.0 0.0 0.0 0.0 0.0 0.0 0.0
B. Sectoral Share in Total Firms (%) 1997 1998 1999 2000 2001 2002 2003 2004 2005 2006 2007 1 6.9 6.9 6.5 5.6 6.3 6.0 6.1 5.5 5.0 4.9 4.4 2 28.5 27.1 27.4 29.8 30.7 29.1 28.2 27.6 26.1 28.1 28.8 3 9.2 9.8 10.1 10.6 10.4 9.8 9.8 10.5 10.5 10.7 10.3 4 3.6 4.7 4.1 4.0 3.7 3.7 3.6 3.8 3.7 3.8 3.6 5 14.1 15.0 15.2 16.0 16.3 16.8 16.6 16.7 16.6 16.7 16.4 6 15.2 18.1 18.5 19.1 18.7 18.4 19.4 20.2 21.2 21.6 21.6 7 3.0 3.4 3.2 3.4 3.6 3.2 3.9 4.1 3.9 3.6 3.5 8 18.8 19.7 20.1 19.9 20.8 20.4 21.1 21.2 22.2 20.4 20.8 9 11.1 11.4 12.3 12.3 11.4 9.9 10.0 10.6 10.3 9.1 9.5 10 2.9 3.0 2.7 2.9 2.5 3.0 3.5 3.4 3.1 3.2 3.5 11 6.2 6.8 6.5 5.8 5.9 6.3 7.0 6.7 7.4 7.3 6.6 12 15.1 16.4 16.4 15.7 16.6 16.7 16.9 17.8 18.1 19.1 18.2 13 22.4 25.3 26.1 26.2 25.8 26.6 26.9 26.7 28.2 28.4 27.8 14 3.6 5.2 4.2 4.6 4.9 5.1 4.2 5.0 4.8 5.3 5.4 15 14.5 17.1 17.6 18.3 18.6 20.0 18.4 19.0 20.8 20.0 18.8 16 9.5 5.8 2.5 2.3 0.6 0.2 0.1 0.1 0.0 0.0 0.1
Source: Authors’ calculations based on data from PROCOMER. Ind = industry. See industry classification in the Appendix.
27

Table 6a. The Contribution of Firm Turnover in the Short Run
Export growth
(%)
Share cont. firms
(%)
Growth cont. firms
(%) Entry (%)
Entry value gap (%) Exit (%)
Exit value gap (%)
1998 25 97 26 30 -27 -25 23 1999 -6 95 -7 35 -30 -31 26 2000 -6 96 -4 30 -28 -32 27 2001 -3 97 -5 34 -31 -30 28 2002 7 98 7 30 -28 -29 27 2003 1 98 1 34 -32 -29 26 2004 5 98 7 32 -30 -28 25 2005 1 99 1 33 -31 -29 28 2006 10 98 11 29 -27 -27 24 2007 3 99 3 27 -26 -25 24
Source: Authors’ calculations based on data from PROCOMER. Cont.= continuing or incumbent firms. Table 6b. The Contribution of Destination Turnover among Incumbent Firms in the Short Run
Growth cont. firms (%)
Share cont.
firm_dest (%)
Growth cont. firm-dest (%)
Entry (%)
Entry value gap (%) Exit (%)
Exit value gap (%)
1998 26 96 25 28 -23 -23 20 1999 -7 95 -5 27 -24 -30 24 2000 -4 97 -4 28 -26 -26 23 2001 -5 97 -4 26 -23 -27 24 2002 7 96 8 25 -22 -26 22 2003 1 98 1 27 -25 -24 22 2004 7 98 7 26 -24 -24 22 2005 1 97 -1 28 -25 -25 23 2006 11 98 10 26 -23 -24 22 2007 3 97 4 28 -25 -24 20
Source: Authors’ calculations based on data from PROCOMER. Table 6c. The Contribution of Product Turnover among Incumbent Firms in the Short Run
Growth cont. firms (%)
Share cont.
firm_prod (%)
Growth cont.
firm_prod (%)
Entry (%)
Entry value gap (%) Exit (%)
Exit value gap (%)
1998 26 94 30 50 -45 -41 34 1999 -7 94 -1 52 -49 -51 42 2000 -4 97 -4 54 -51 -49 46 2001 -5 96 -7 53 -48 -49 46 2002 7 96 6 46 -41 -45 41 2003 1 96 5 53 -50 -46 40 2004 7 96 6 48 -44 -46 43 2005 1 98 0 50 -48 -46 45 2006 11 98 10 48 -46 -44 42 2007 3 92 2 51 -43 -48 41
Source: Authors’ calculations based on data from PROCOMER.
28

Table 7. The Contribution of New vs. Incumbent Exporters in the Long Run
New Incumbent Sales Share (%) Number Sales Share (%) Number
1999 5 732 95 823 2000 13 942 87 817 2001 18 1,221 82 821 2002 25 1,391 75 818 2003 32 1,616 68 834 2004 36 1,791 64 846 2005 39 1,885 61 922
29

Table 8. Total Sales of 1999 New Exporters: Survivors vs. Exits (millions of US $)
Survivors Exit Survive Year x from 1999-2005 at Year x But Exit Later
1999 157 15.0 36.1 2000 332 9.46 50.4 2001 270 6.85 45.0 2002 337 1.63 22.7 2003 422 12.1 4.96 2004 581 3.05 2005 641
30

Table 9a. Total Sales of 1999/2000 New Exporters: Initial Products vs. Added Products
(millions of US $) Cohort 1999 Cohort 2000 Initial Products Added Products Initial Products Added Products
1999 157 2000 324 7.87 79 2001 241 29.0 188 12.8 2002 298 39.7 200 41.2 2003 358 63.3 229 76.3 2004 442 140.0 245 82.1 2005 406 235.0 209 102.0
Table 9b. Total Sales of Incumbent Exporters: Continuing Products vs. Added Products
(millions of US $) Incumbent Exporters - 2005
Continuing
Products Added Products 1999 2510 58.9 2000 2480 147 2001 2260 222 2002 2250 363 2003 2160 497 2004 2260 677 2005 2160 695
Table 9c. Total Sales of 1999 Cohort Surviving Exporters: Initial Products Dropped
(millions of US $) Initial Products Initial Products Total Surviving 99-05 Dropped Before 05
1999 132 25.5 157 2000 284 39.6 324 2001 217 23.6 241 2002 290 7.39 298 2003 357 1.04 358 2004 441 .563 442 2005 406 406
Table 9d. Total Sales of Incumbent Exporters: Continuing Products Dropped
(millions of US $)
Continuing
Products Continuing
Products Total Surviving 99-05 Dropped Before 05
1999 2180 327 2510 2000 2230 250 2480 2001 2060 205 2260 2002 2070 180 2250 2003 2100 61.5 2160 2004 2230 27.5 2260 2005 2160 2160
31