Embed Size (px)
Citation preview

1
The Analysis of Total Factor Productivity in the Manufacturing Industries:
Empirical Evidences from Iran, Turkey, South Korea, and USA1
Alimorad Sharifi (PhD)
Karim Azarbaijani (PhD)
Mehdi Sadeghi (PhD)
Arash Dehghani (MA)
Energy Economics and Management Research Group
Research Academy of Administrative Sciences and Economics
University of Isfahan
Postal code 81746-73441, Isfahan-Iran
Tel: +98 311- 7935234, Fax: +98 311- 6687396
Email: [email protected]
Email: [email protected]
ABSTRACT
This paper investigates the total factor productivity (TFP) performance in the manufacturing
industries of selected four countries-Iran, Turkey, South Korea, and the United States- during
1980-2007. The productivity measurement index is based on Caves, Christensen, and Diewert
(1982) method. The findings indicate that there are significant productivity differences between
these countries during the last two decades. The empirical results improve the understanding of
how technical and organizational structures as well as their combinations can affect the
productivity performance of the above-mentioned countries.
Keywords: Total Factor Productivity, Manufacturing industries, CCD Productivity Index, Iran,
Turkey, South Korea, USA.
JEL classification: D24, L60.
1 We are grateful to Prof. Fatma Dogruel for providing us with Turkish data.

2
1. Introduction
The concept of total factor productivity (hereafter referred to as TFP) is the core of
Microeconomic theory which encompasses the optimum utilization of natural resources as well
as factors of production. Both developed and developing countries have emphasized the
importance of total factor productivity growth as one of the essential steps in the process of
economic development. In order to obtain comparative advantage in the global economy, to
achieve higher productivity growth is the main point. In the recent decades it is believed that the
degree of socio-economic development is the optimum rate of utilization of available resources.
The post-WWII experiences of developed countries have shown that the dynamics and
growth of manufacturing industries play important roles in the development of other economic
sectors. Irrespective of the size of manufacturing sector in the economy, however, it is
considered as a basic contributor to economic growth (Wagner and Van Ark, 1996). TFP
comparison among different countries would be a critical issue both in theory and practice since
it is believed that one of the major bottlenecks of the developing countries even resource-rich
ones is the low rate of TFP in the manufacturing industries (?). This will result in distortions both
in factors of production as well as output pricing mechanism. As Nadiri and Rosen (?) have
discussed the behavior of interrelated factor demands the change in one factor price will result in
utilization change of another factor, for instance changes in the price of energy carriers will
consequently change labor and capital utilization. The final result will be total factor productivity
fluctuations.
The main initiative for this research is to find out the sources of TFP differences among
four selected countries, two of them are developing countries, one is energy-exporter while the
other one is energy-importer and the other two one industrialized and the other semi-
industrialized. Although there are major structural differences between the above-mentioned
countries but still it makes sense to analyze the sources of this difference and forecast the near
future. In this paper, the cross-country differences in TFP are estimated based on Caves,
Christensen, and Diewert index (hereafter referred to as CCD). The paper is organized as
follows: Next section reviews the relevant literature and section three outlines the major
approaches for TFP measurement. Fourth section discusses the empirical results while section
five concludes the paper.

3
2. Literature review
There are two general methods to estimate the international TFP differentials: The first
one is based on value added while the second one considers gross domestic output (GDP).
Among the studies which estimate TFP using a value added measure are Dollar et al. (1988),
Maskus (1991), Dollar and Wolff (1993), Van Ark (1993), Van Ark and Pilat (1993), and
Harrigan (1997, 1999). The first three references use overall GDP price levels and as a
consequence this causes distortions to the extent that relative Prices differ across countries.
Harrigan (1997,1999) shows that this distortion is large enough to substantively change the
results of TFP comparisons. The two closely related studies by Van Ark (1993) and Van Ark and
Pilat (1993) deflate value added by a price index which is constructed by direct comparisons of
output Prices at the wholesale level rather than using GDP price levels. Unfortunately, this
theoretically superior procedure is compromised by the very small number of matches across
countries for specific products (see Jorgenson, 1990). In addition to this, Ark (1993) and Ark and
Pilat (1993) studies include only a small number of countries and years.
The second class of studies uses data on GDP, and deflates all factors (capital, labor,
materials, energy, etc.) in an asymmetric way. This procedure was pioneered by Jorgenson
(1990) and various authors, and is undoubtedly the most theoretically appropriate and least
restrictive method of making TFP comparisons. Jorgenson (1990) has comprehensively
introduced this methodology. Because of stringent data requirements needed for Jorgenson
procedure, however, there have been only two studies applying this method and comparing only
two countries, the United States and Japan (Jorgenson et al., 1987; Jorgenson and Kuroda, 1990).
3. The concept of productivity
Productivity is simply defined as the ratio of output to the input. While there is no
disagreement on this general notion, a look at the productivity literature and its various
applications reveals that there is neither a unique purpose for nor a single measure of
productivity. There are many different productivity measures. The choice between them depends
on the purpose of productivity measurement and, in many instances, on the availability of data.
Broadly, productivity measures can be classified as single (or partial) factor productivity
measures (relating a measure of output to a single measure of input) or multifactor productivity

4
measures (relating a measure of output to a bundle of inputs). The most common multifactor
productivity measure is TFP (Total Factor Productivity). TFP, in particular, has been actively
studied to explain sectoral productivity differences across countries or over time. Since TFP
analysis is one of the most comprehensive ways of comparing relative industry performance as
well as technical change indicator and economies of scale, therefore, the high level of TFP
indicates the good economic performance. This concept has been emphasized in many
investigations for instance Wagner and Van Ark, 1996; Diewert, ; Denny, et al., ).
Moreover, the productivity is comparative concept. The rate of TFP growth is important
for productivity comparison under a given country, a region, an industry at different times, but is
not as useful in comparing the relative productivity of different countries or regions. Hulten
(2001) believes that the TFP growth rate is of interest for intertemporal comparisons of
productivity for a given country or region at different points in time, but it is far less useful for
comparing the relative productivity of different countries or regions. A developing country may,
for example, have a much more rapid growth in TFP than a developed country,but start from a
much lower level.Indeed,a developing country may have a more rapid growth in TFP than a
developed country because it starts from a lower level and is able to import technology.
Productivity comparison across countries needs the different framework from the other
productivity measurements, a framework that was developed in the late 1970s and the early
1980s by Jorgenson and Nishimizu (1978), Christensen, Cummings and Jorgenson (1981) and
Caves, Christensen and Diewert (1982b). In particularly, Caves et al (1982b) developed a
multilateral productivity index based on Malmquist index as CCD productivity Index. CCD
index preserves transitivity in TFP comparisons across countries.
There are three different types of conversion factors: (i) Exchange rates, (ii) Purchasing
power parities (PPPs), and (iii) Unit value ratios (UVRs). The exchange rate is well known for
not being an appropriate conversion factor because it is influenced by short-term capital
movements. PPPs are a less appropriate conversion factor for productivity comparison of the
manufacturing sector, but still can be a reliable conversion factor for specific branches of the
manufacturing sector, which does not depend on the intermediate products of the production
process. Finally, UVRs are considered an appropriate conversion factor for the manufacturing
sector as a whole and its branches. Due to each conversion factor characteristics, the results of

5
productivity comparisons are expected to be different. Table 1 indicates the variations in
productivity level caused by different conversion factors.
Table 1- Alternative comparative labor productivity Estimates (Output per employee, Britain=100)
Country Benchmark
Year
Using 1985-
based Proxy
PPP
Using 1990-
based Proxy
PPP
Using UVRs
France 1984 107.5 101.1 117
Germany 1987 109.5 109.6 113.5
Japan 1987 108.3 119.4 159.6
United States 1987 174.8 174.3 186.7
Britain 1984/1987 100 100 100
Source: O’Mahany (1996)
The International Comparison Program (commonly known as ICP) is a worldwide
statistical initiative to collect comparative price data and estimate purchasing power parities
(PPPs) of the world’s economies. Using PPPs instead of market exchange rates to convert
currencies makes it possible to compare the output of economies and the welfare of their
inhabitants in real terms. The ICP-PPPs have the average of being based on large samples of
carefully matched products. These PPPs had been matched to national accounts aggregates,
expressed in national currency, to convert them to a common currency at a uniform price level.
In this case, productivity comparison is more representative and less affected by quality
problems. This paper uses ICP-PPPs because UVRs are only available for a few countries.
4. Methodology
This section briefly describes methodology and data followed and illustrates the sample
and discusses the measurement of the inputs and the outputs used in our analysis. Following
Harrigan (1997, 1999), it is supposed that each country's value added function is translog with
identical second-order terms, so that the value added function of country c can be written as

6
(1)
Where constant returns to scale requires and .
Under the additional assumptions that producers are cost-minimizers and price takers in input
markets, Caves, Christensen and Diewert (1982) show that the geometric mean of the two
distance functions for any two countries a and b gives the TFP index
(2)
Where ,
, and
stand for output or value added, labor input and capital stock of country c in
industry j, respectively. and are geometric averages over all the observations in the sample
and , where is labor's share in total cost in country c and is the arithmetic
average of the labor c shares.
is TFP level of industry j between countries a and b. The
relation (2) is superlative index, meaning that it is an exact index for the flexible translog
functional form which is a second-order approximation to Taylor series. Furthermore it is
transitive:
(3)
Which makes the choice of base country and year inconsequential. Our sample includes 2-digit
ISIC branches of manufacturing sector for Iran, Turkey, South Korea, and the United States of
America. The data are collected from different official statistical sources such as The Iranian
Statistical Center, Turkish Statistical Institute, OECD Statistical Yearbooks, World Bank, and
PENN World tables.
Cross-country comparisons require data on outputs, inputs and price indices. The output
measure mostly used in international productivity comparisons is value added. Once value added
is converted into base year, a US price index is required to make different years comparable to
each other. Denote this US value added deflator as , where for t = 2000 for all
j. As a result, we measure real value added (y) in constant dollar (2000 = 100) as

7
⁄ (4)
Where and are real value added and nominal value added during year t in country c,
respectively. is the purchasing power parity for converting the value added in terms of the
domestic currency into US$ values. For , the ICP-PPPs are taken as proxies for the
manufacturing branch.
Labor is derived from industry employment figures. Although using employment raw
data is inappropriate but there is no alternative to use man-hour employment because of data
limitation. The capital stock is constructed as a distributed lag of past investment flows:
∑ (5)
Where is the capital stock of industry j in country c at the beginning of year t, is the
discount factor, and is real investment during year t. Note that the capital stock in year t does
not include year t investment, but only up through year t-1. In this paper, it is assumed that
. If the actual useful life of a capital good is 20 years, this amounts to dropping about
10% of the total weight used in constructing the capital stock . The nominal investment is
⁄ (6)
Where is nominal investment during year t in country c for industry j and is taken from Gross
Fixed Capital Formation (GFCF). We use the deflator for US investment from the OECD STAN
data, various years. Denote this deflator as , with a base t year of 2000.
is the
purchasing power parity for converting the past values of investment in terms of the domestic
currency into U.S dollar values. are taken from the PENN world tables(V6. 2008).
The cost shares in the raw data are very volatile, and in many cases exceed one. Under
the assumptions about technology and input market behavior used to derive (2) and by following
from Harrigan (1997, 1999), we use a smoothing procedure to generate the cost shares used in
constructing the TFP index. For each industry, we estimate the following regression by OLS over
all time periods t and countries c:

8
(7)
We use the fitted values from this regression as the labor cost shares in constructing the reported
TFP results.
4. Empirical results
Food, beverage and tobacco industries (ISIC 15-16):
In this industry all three countries Iran, Turkey and South Korea have a wide productivity
gap relative to USA. Among three countries, Korea has highest productivity during the period
and only in 1990 Iran has had higher productivity with respect to Korea and Turkey. Productivity
of Korea has more or less constant process, but an increasing trend in 2002 will begin.
Productivity trend in Iran is more or less constant; this is done while in 1990, Iran has witnessed
a sharp increase in the productivity. But this increase is not continuous and after this increase,
decreasing trend begins. Productivity trend of Turkey during the 1995-2001 is more or less
constant and maximum size of the country's productivity in 1996 and is equal to 50. During this
period Korea has the highest productivity and Turkey and Iran, respectively, are then replaced.
Diagram 1:
Textile, Textile products, leather and footwear industries (ISIC 17-19):
9
All three countries Iran, Turkey, and South Korea in the industry have the productivity
gap relative to USA. From 1980 to 1994 Iran has relative productivity higher than South Korea.
In the period 1995 to 2001 that the statistics are available for the three countries, trend of level
productivity Korea is constant and for Turkey and Iran less downside is descending. Differences
in productivity levels across the three countries during this period are not very significant. From
2002 to 2007, productivity levels of Korea, unlike 1994 to 1980 period, had been more than Iran.
Diagram 2:
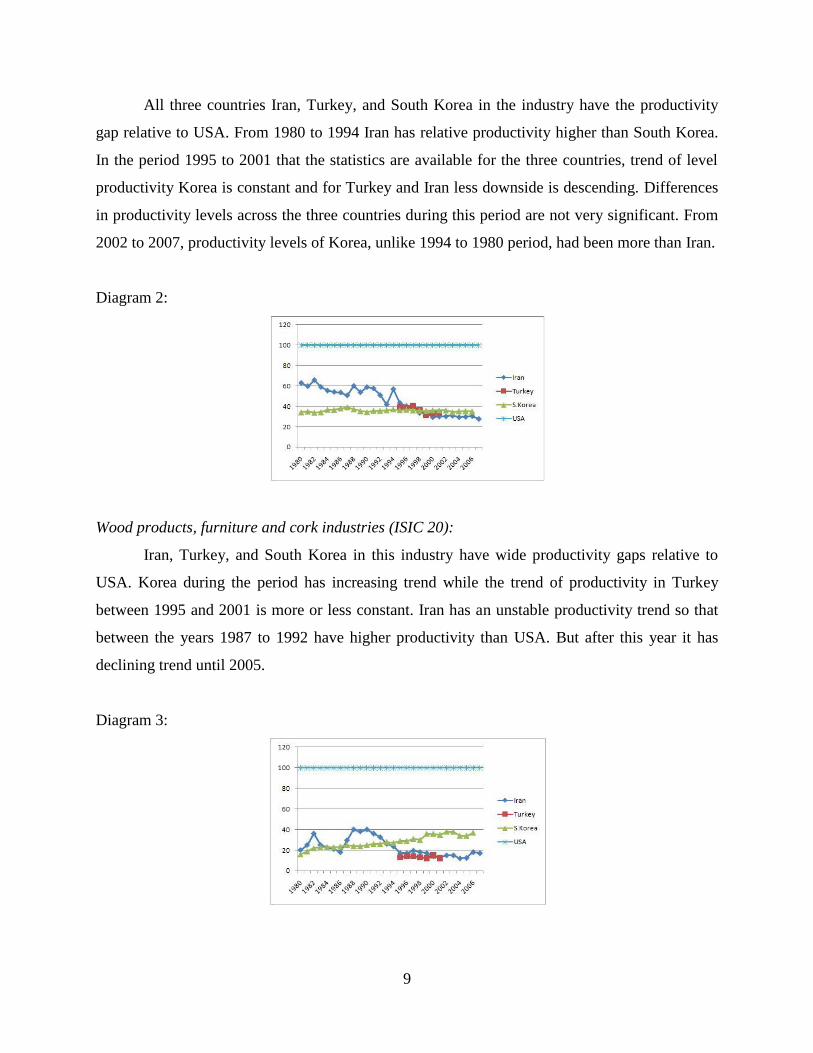
Wood products, furniture and cork industries (ISIC 20):
Iran, Turkey, and South Korea in this industry have wide productivity gaps relative to
USA. Korea during the period has increasing trend while the trend of productivity in Turkey
between 1995 and 2001 is more or less constant. Iran has an unstable productivity trend so that
between the years 1987 to 1992 have higher productivity than USA. But after this year it has
declining trend until 2005.
Diagram 3:
10
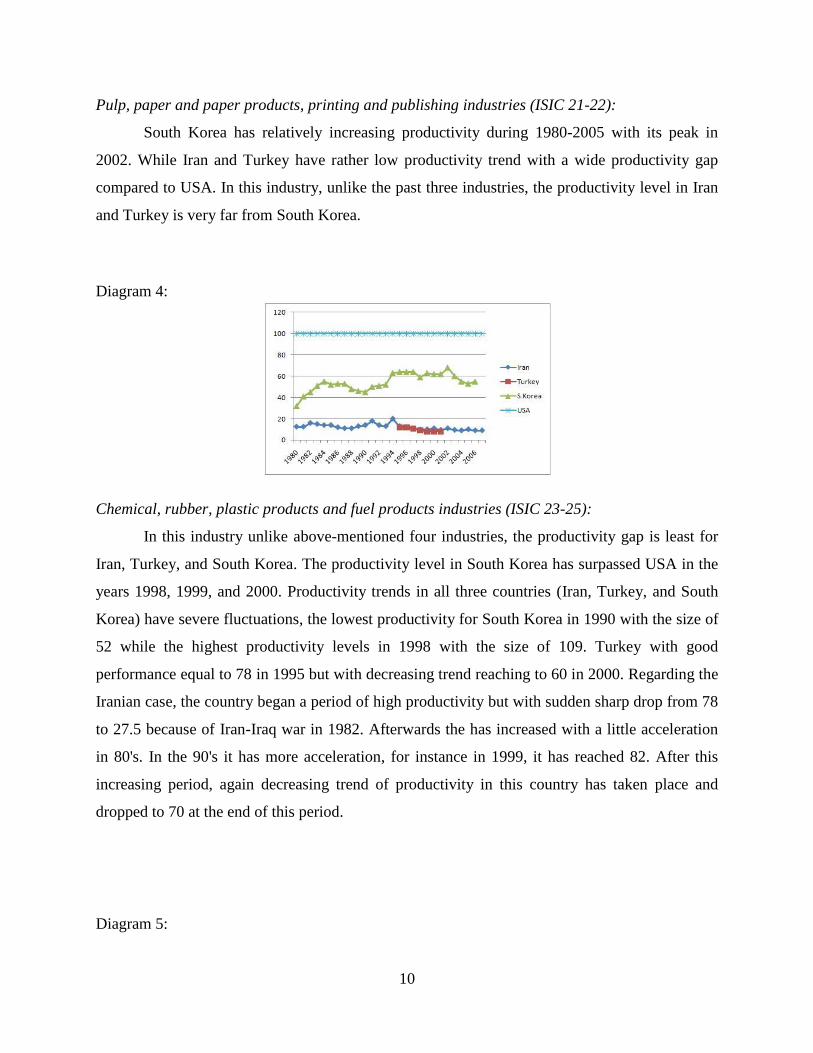
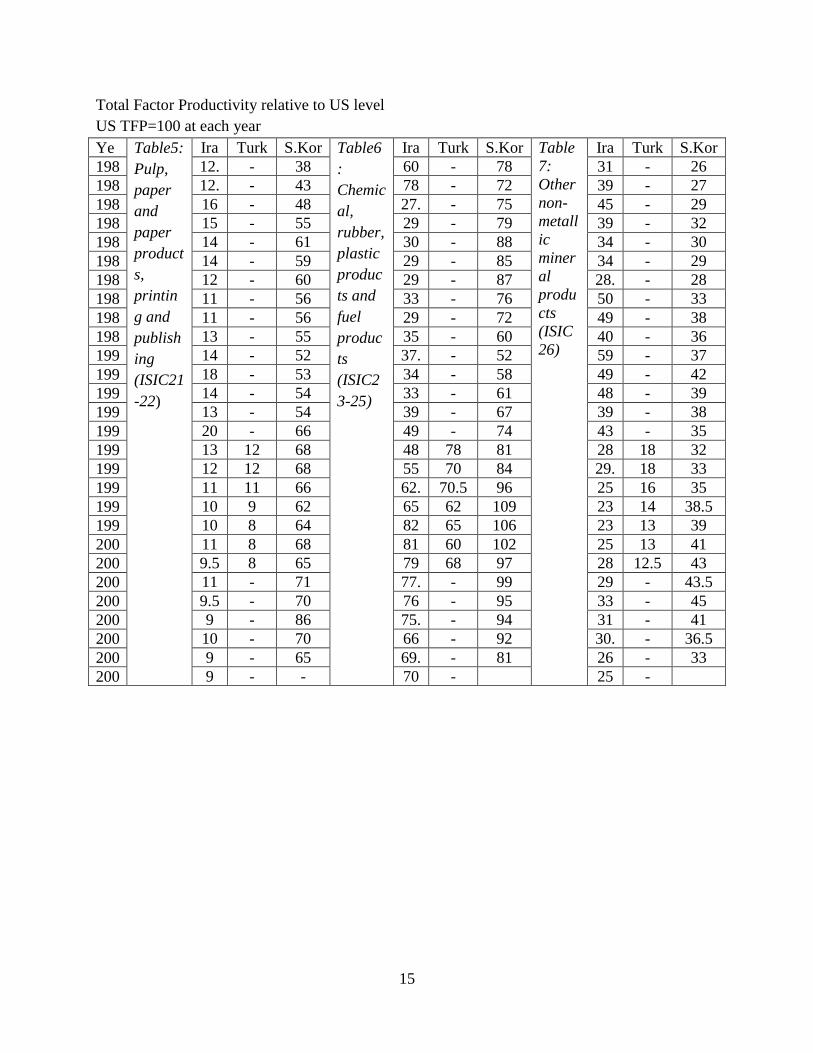
Pulp, paper and paper products, printing and publishing industries (ISIC 21-22):
South Korea has relatively increasing productivity during 1980-2005 with its peak in
2002. While Iran and Turkey have rather low productivity trend with a wide productivity gap
compared to USA. In this industry, unlike the past three industries, the productivity level in Iran
and Turkey is very far from South Korea.
Diagram 4:
Chemical, rubber, plastic products and fuel products industries (ISIC 23-25):
In this industry unlike above-mentioned four industries, the productivity gap is least for
Iran, Turkey, and South Korea. The productivity level in South Korea has surpassed USA in the
years 1998, 1999, and 2000. Productivity trends in all three countries (Iran, Turkey, and South
Korea) have severe fluctuations, the lowest productivity for South Korea in 1990 with the size of
52 while the highest productivity levels in 1998 with the size of 109. Turkey with good
performance equal to 78 in 1995 but with decreasing trend reaching to 60 in 2000. Regarding the
Iranian case, the country began a period of high productivity but with sudden sharp drop from 78
to 27.5 because of Iran-Iraq war in 1982. Afterwards the has increased with a little acceleration
in 80's. In the 90's it has more acceleration, for instance in 1999, it has reached 82. After this
increasing period, again decreasing trend of productivity in this country has taken place and
dropped to 70 at the end of this period.
Diagram 5:

11
Other non-metallic mineral products industries (ISIC 26):
In this industry, all three countries Iran, Turkey, and South Korea have wide productivity
gaps compared to USA. An interesting point is the trend of productivity in Iran and South Korea,
it can divided into two periods, the first period from 1980 to 1995 in which Iran has performed
better than South Korea while in the second period from 1996 to 2006 the trend has been
reversed with the superiority of productivity in South Korea. Moreover, Iran, Turkey, and South
Korea have failed during this period to decrease their productivity gaps and the former two
countries also have decreasing productivity trends.
Diagram 6:
Basic metal industries (ISIC 27):
The large gap still exists among Iran, Turkey, and South Korea compare to USA,
although the former three countries have been able to reduce their gaps with each other in this
period. From 1980 to 1994 South Korea and Iran have fully benefited to increase their
productivity trend from 19 to 35 and from 14 to 34, respectively. During 1995 to 2001, South
Korea and Iran both have slow increase in productivity while Turkey has its productivity peak in

12
1997 with a sharp drop in productivity afterwards. Between 2002 and 2006, South Korea and
Iran have very close productivity trend, however, Iran in 2004 is relatively higher than South
Korea. But after this year, the productivity difference between the two countries has been low.
Diagram 7:
Fabricated metal products, machinery and equipment, transport equipment industries (ISIC 28-
35):
In this category, all three countries still have large productivity gaps compared to USA.
During 1980 to 1994 both South Korea and Iran have increasing productivity trends. South
Korea has started from 19.5 and reached 30, while Iran with very low productivity of 4.5 has
reached to 11.5 in 1994. From 1995 to 2001, South Korea have experienced a higher rate of
productivity growth, followed by lower rate of productivity in both Turkey and Iran. During the
whole period, South Korea has productivity level more than twice the level of Iranian
productivity.
Diagram 8:

13
5. Conclusions
This study investigates the concept of productivity comparison and then, using the model
introduced by multilateral index of total factor productivity (CCD) which is estimated for four
selected countries. The main findings are as follows:
- In most ISIC industries studied during 1980 to 2006, South Korea has higher
productivity trend compare to both Iran and Turkey. However, a comparison of South
Korean productivity relative to USA represents large gaps in most industries and
years.
- It must be confirmed that South Korea in all reviewed industries except for industry
code 17-19 in the 90’s has been able to reduce its productivity gap with USA.
- The trend of relative TFP in Iran and Turkey, in most industries, has been decreasing
or at least constant.
- The best productivity peroformance in all three countries, Iran ,Turkey, and South
Korea relative to USA has been in code 23-25 where South Korea has been able even
to surpass USA in 1998, 1999 and 2000.
- Iran at the beginning of period has had the lowest relative productivity in the industry
code 28-35, but at the end of the period the country has been able to achieve a good
growth; However, the industry code 21-22 , has the highest loss of relative
productivity for Iran. Turkey has also experienced its lowest relative productivity
with the same industry code. The Lowest level of relative productivity for South
Korea is also in the industry code 17-19.

14
Appendix:
Total Factor Productivity relative to US level
US TFP=100 at each year
Year T
able
2:
Food, bev
erag
e and t
obacc
o (
ISIC
15
-16)
Iran Turkey S. Korea
Table
3:
Tex
tile
, T
exti
le p
roduct
s, l
eath
er a
nd f
ootw
ear
(ISIC
17
-19)
Iran Turkey S. Korea
Table
4:
Wood p
roduct
s, f
urn
iture
and c
ork
(IS
IC2
0)
Iran Turkey S. Korea
1980 31 - 56 63 - 34 20 - 16
1981 37 - 59 60 - 35 25 - 19
1982 37 - 64 66 - 34 36 - 22
1983 32 - 63 59 - 34 25 - 23
1984 28 - 61 55 - 37 22.5 - 23
1985 33 - 60 54 - 36 21 - 23
1986 32 - 58 53 - 38 18 - 23.5
1987 33 - 56 51 - 39 29.5 - 25
1988 45 - 56 60 - 37 40 - 24
1989 36 - 57 54 - 35 38 - 24
1990 59 - 54 59 - 34 40 - 25
1991 49 - 52 57 - 35 36 - 26
1992 40 - 53 51 - 36 32.5 - 26
1993 48 - 57 42 - 36 26 - 28
1994 42 - 60 57 - 37 23.5 - 27
1995 37 47 54 43 39 36 17 13 29
1996 38 50 60 40 39 37 17 14 29
1997 36 39 64 41 40 36 19.5 14 31
1998 38 44 71 33 36 36 18 13 30
1999 37 41 68 33 32 35 17 12 36
2000 33 41 69 29 33 36 14 15 36
2001 29 48 63 30 34 36 13 12 35
2002 33 - 66 30 - 36 15 - 38
2003 33 - 66 31 - 34 15 - 38
2004 33 - 74 29 - 35 12 - 34
2005 38 - 76 30 - 35 12.5 - 34
2006 35 - 81 30 - 35 18 - 37
2007 28 - - 28 - - 17 - -
15
Total Factor Productivity relative to US level
US TFP=100 at each year
Ye
ar
Table5:
Pulp,
paper
and
paper
product
s,
printin
g and
publish
ing
(ISIC21
-22)
Ira
n
Turk
ey
S.Kor
ea
Table6
:
Chemic
al,
rubber,
plastic
produc
ts and
fuel
produc
ts
(ISIC2
3-25)
Ira
n
Turk
ey
S.Kor
ea
Table
7:
Other
non-
metall
ic
miner
al
produ
cts
(ISIC
26)
Ira
n
Turk
ey
S.Kor
ea 198
0
12.
5
- 38 60 - 78 31 - 26
198
1
12.
5
- 43 78 - 72 39 - 27
198
2
16 - 48 27.
5
- 75 45 - 29
198
3
15 - 55 29 - 79 39 - 32
198
4
14 - 61 30 - 88 34 - 30
198
5
14 - 59 29 - 85 34 - 29
198
6
12 - 60 29 - 87 28.
5
- 28
198
7
11 - 56 33 - 76 50 - 33
198
8
11 - 56 29 - 72 49 - 38
198
9
13 - 55 35 - 60 40 - 36
199
0
14 - 52 37.
5
- 52 59 - 37
199
1
18 - 53 34 - 58 49 - 42
199
2
14 - 54 33 - 61 48 - 39
199
3
13 - 54 39 - 67 39 - 38
199
4
20 - 66 49 - 74 43 - 35
199
5
13 12 68 48 78 81 28 18 32
199
6
12 12 68 55 70 84 29.
5
18 33
199
7
11 11 66 62.
5
70.5 96 25 16 35
199
8
10 9 62 65 62 109 23 14 38.5
199
9
10 8 64 82 65 106 23 13 39
200
0
11 8 68 81 60 102 25 13 41
200
1
9.5 8 65 79 68 97 28 12.5 43
200
2
11 - 71 77.
5
- 99 29 - 43.5
200
3
9.5 - 70 76 - 95 33 - 45
200
4
9 - 86 75.
5
- 94 31 - 41
200
5
10 - 70 66 - 92 30.
5
- 36.5
200
6
9 - 65 69.
5
- 81 26 - 33
200
7
9 - - 70 -
25 -

16
Total Factor Productivity relative to US level
US TFP=100 at each year
Year T
able
8:
Basi
c m
etal
(ISIC
27)
Iran Turkey S. Korea
Table
9:
Fabri
cate
d m
eta
l pro
duct
s, m
ach
iner
y an
d e
quip
men
t, t
ransp
ort
equip
men
t (I
SIC
28
-35)
Iran Turkey S. Korea
1980 14 - 19 4.5 - 19.5
1981 10.5 - 23 6 - 22
1982 15 - 26 7 - 23
1983 18.5 - 31 7 - 26
1984 22.5 - 29 6.5 - 26
1985 28 - 32 6.5 - 26
1986 24 - 39 5 - 28
1987 28.5 - 40 5 - 26.5
1988 37.5 - 37 5.5 - 27
1989 25 - 36 6 - 26
1990 34 - 37 19 - 28
1991 34 - 36 14.5 - 28
1992 57 - 36 11 - 28
1993 32.5 - 37 10 - 29
1994 34 - 35 11.5 - 30
1995 32 36 37 9 22.5 32.5
1996 26 34 37 11 22 33
1997 37 51 39 12 25 33
1998 37.5 29 38 9 22.5 35.5
1999 34 27 40 12 21 41
2000 35 31 41 13 24 43
2001 42 36 42 19 25 47.5
2002 40 - 42 14 - 48.5
2003 42 - 43 21 - 48.5
2004 51 - 45 18 - 53
2005 47 - 46 19.5 - 51.5
2006 42 - 41 19 - 50.5
2007 47 - - 16 - -

17
References
-2005 International Comparison Program: Tables of Final Results. (2008). Retrieved from
world bank: http://siteresources.worldbank.org/ICPINT/Resources/ICP_final-results.pdf
-Ark, B. v. (1996). Issues in Measurement and International Comparison of Productivity- An
overview. GGDC Research Memorandum with number 199628 .
-Ark, B. v., & Pilat, D. (1993). Productivity Levels in Germany, Japan, and the United States:
Differences and Causes. Brookings Papers: Microeconomics , 2, 1-69.
-Ark, B. v., & Timmer, M. (2001). PPPs and International Productivity Comparisons:
Bottlenecks and New Directions. Joint World Bank–OECD Seminar on PPPs. Washington D.C:
OECD.
-Ark, B. v., & Wagner, K. (1996). International Productivity Differences: Measurement and
Explantations.
-Caves, D. W., Christensen, L. R., & Diewert, E. W. (1982). Multilateral Comparisons of
Output, Input, and Productivity Using Superlative Index Numbers. Economic Journal , 92 (365),
73-86.
-Caves, D. W., Christensen, L. R., & Diewert, E. W. (1982b). The Economic Theory of Index
Numbers and the Measurement of Input, Output, and Productivity. Econometrica , 1393-1414.
-Diewert, W. E. (1981b). The Theory of Total Factor Productivity Measurement in Regulated
Industries. New York: Academic Press.
-Dollar, D., & Wolff, E. N. (1993). Competitiveness, Convergence, and International
Specialization. Cambridge, MA: MIT Press.
-Harrigan, J. (1997). Cross-Country Comparisons of Industry Total Factor Productivity: Theory
and Evidence. Federal Reserve Bank of New York Research Paper no. 9734 .
-Harrigan, J. (1999). Estimation of Cross-Country Differences in Industry Production. Journal of
International Economics , 47, 267–293.
-Hulten, C. R. (2001). Total Factor Productivity: A Short Biography. NBER Working Paper, 1-
47.
-Islam, N. (1999). International Comparison of Total Factor Productivity: A Review. Review of
Income & Wealth , 45 (4), 493-518.
-Jorgenson, D., & Nishimizu, M. (1978). U.S. and Japanese Economic Growth: An International
Comparison. Economic Journal , 707-726.
-Kravis, I., Heston, A., & Summers, R. (1982). World Product and Income: International
Comparisons of Real Gross Domestic Product. Baltimore, MD: Johns Hopkins University.
-Maskus, K. E. (1991). Comparing International Trade Data and Product and National
Characteristics Data for the Analysis of Trade Models.
-O’Mahony, M. (1996). Conversion factors in relative productivity calculations: theory and
practice. OECD.
-OECD. (2008). ISDB 96: International Sectoral Database, 1960-1995 (OECD, Paris).

18
-OECD. (2001). Measuring Productivity: Measurement of Aggregate and Industry-Level
Productivity Growth- OECD Manual. Organization for Economic Co-operation.
-Pilat, D. (1996). Labour productivity levels in OECD countries: estimates for manufacturing
and selected service sectors. OECD Economics Department Working Papers .
-Schreyer, P. (1996). International Comparison and Measurement Issues. OECD Expert
Workshop On Productivity.
-Solow, R. M. (1957). Technical Change and the Aggregate Production Function. The Review of
Economics and Statistics , 39, 312-320.
- Statistical Center of Iran.(2009).
-Turkish Statistical Institue.(2008). Statistical Indicators, 1923-2007.