Embed Size (px)
Citation preview
The analysis of Time Series gene expression data
Sun Kim
Bioinformatics Institute Computer Science and Engineering Seoul National University

Time-Series
• A series of values of variables taken in successive periods in time
• Time points
• Sampling intervals (constant/inconstant)

Gene expression is highly dynamic
• Biological processes are highly dynamic and are observed through the change of gene expressions
• To understand the molecular biological dynamics of specific biological process, gene expression must be observed at the most crucial time points
• A series of such gene expression snapshots is defined as Time-Series data
Power of Time Series Data Analysis
• Capture the molecular biological dynamics to understand the model of specific biological processes involved with transient expression change
• Transient expression change is observed in • developmental or cycling processes • perturbation-response experiments
• Such information is important for understanding
• the sequence of events (activation of genes causality) • detect temporal pattern of a response • the dynamic use of transcriptional networks
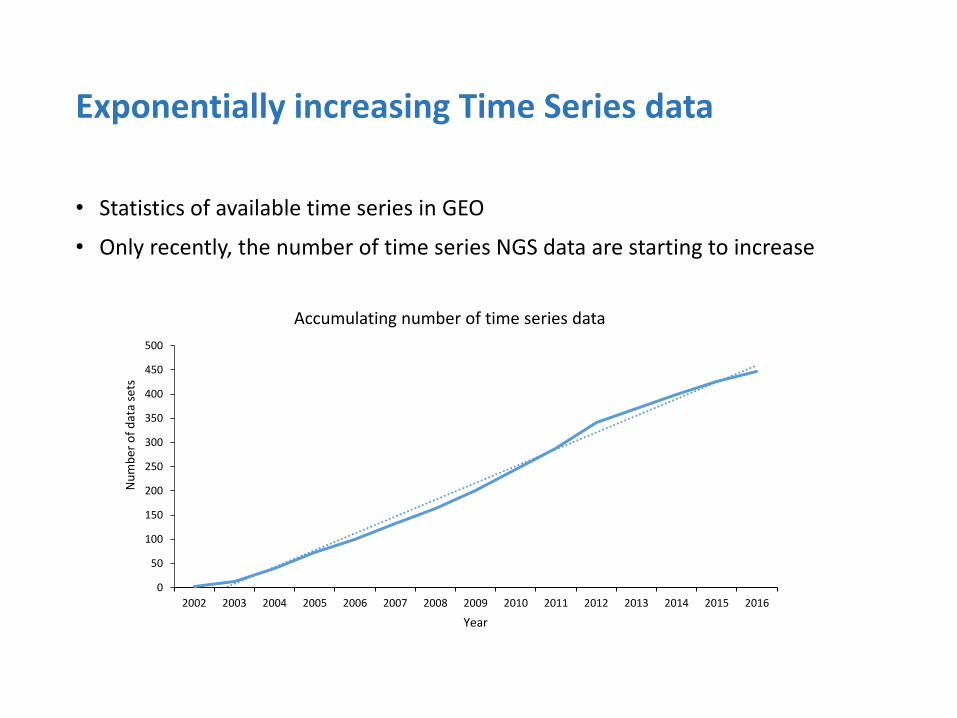
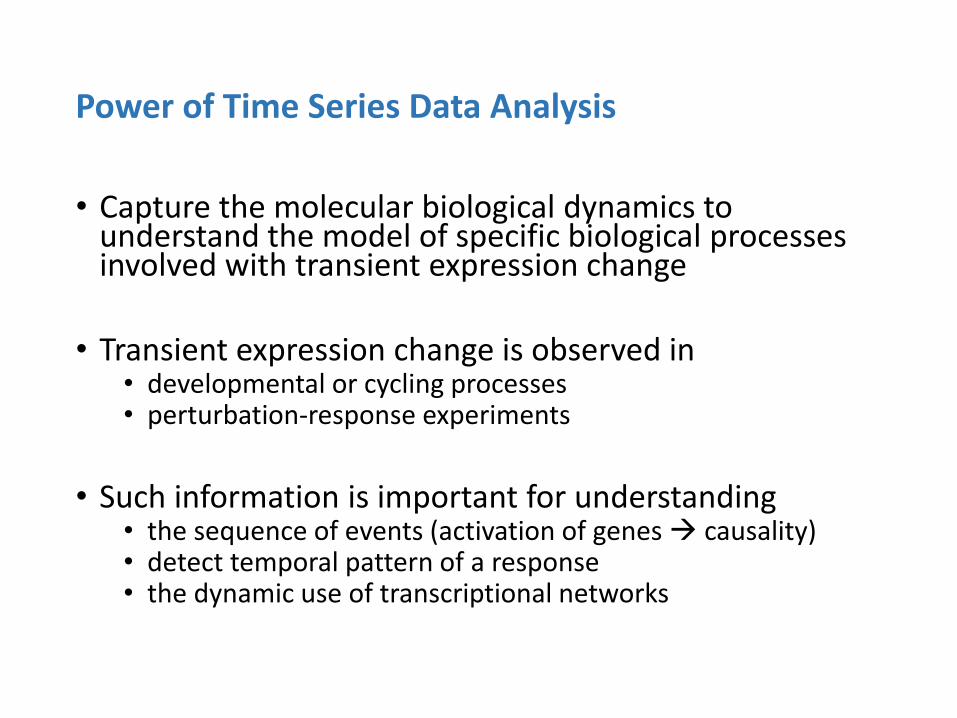
Exponentially increasing Time Series data
• Statistics of available time series in GEO
• Only recently, the number of time series NGS data are starting to increase
0
50
100
150
200
250
300
350
400
450
500
2002 2003 2004 2005 2006 2007 2008 2009 2010 2011 2012 2013 2014 2015 2016
Nu
mb
er o
f d
ata
sets
Year
Accumulating number of time series data
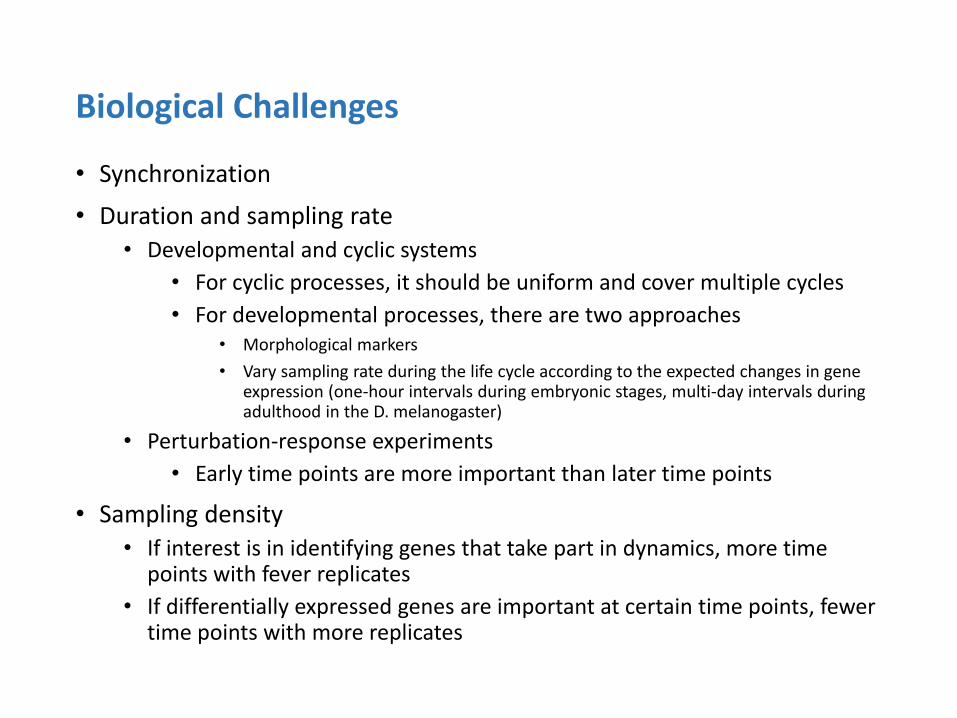
Biological Challenges
• Synchronization
• Duration and sampling rate • Developmental and cyclic systems
• For cyclic processes, it should be uniform and cover multiple cycles
• For developmental processes, there are two approaches • Morphological markers
• Vary sampling rate during the life cycle according to the expected changes in gene expression (one-hour intervals during embryonic stages, multi-day intervals during adulthood in the D. melanogaster)
• Perturbation-response experiments
• Early time points are more important than later time points
• Sampling density • If interest is in identifying genes that take part in dynamics, more time
points with fever replicates
• If differentially expressed genes are important at certain time points, fewer time points with more replicates
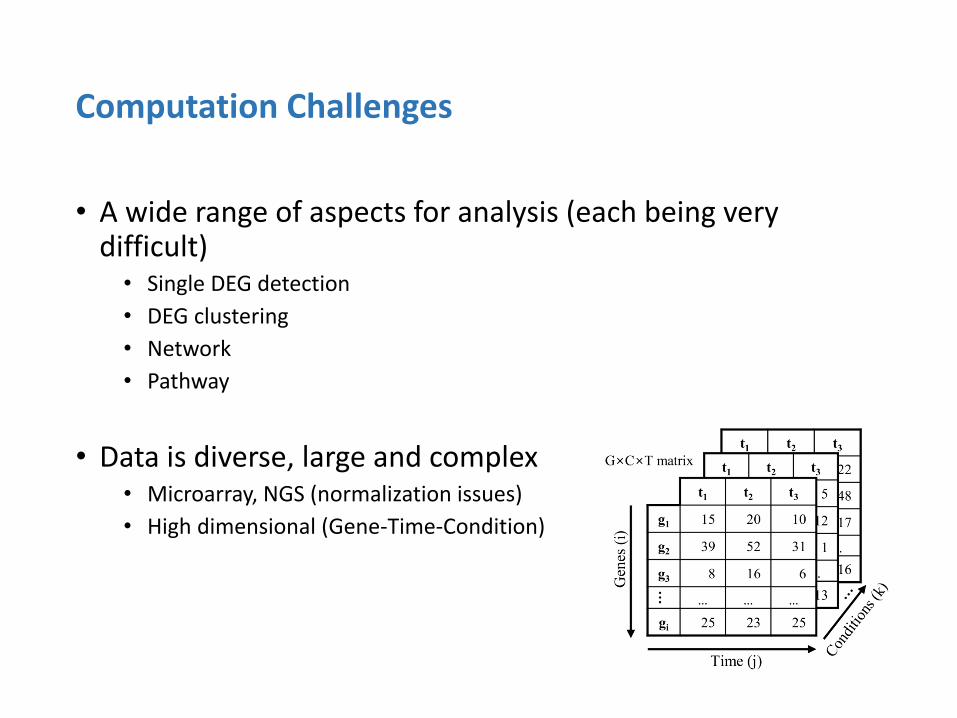
Computation Challenges
• A wide range of aspects for analysis (each being very difficult)
• Single DEG detection
• DEG clustering
• Network
• Pathway
• Data is diverse, large and complex • Microarray, NGS (normalization issues)
• High dimensional (Gene-Time-Condition)
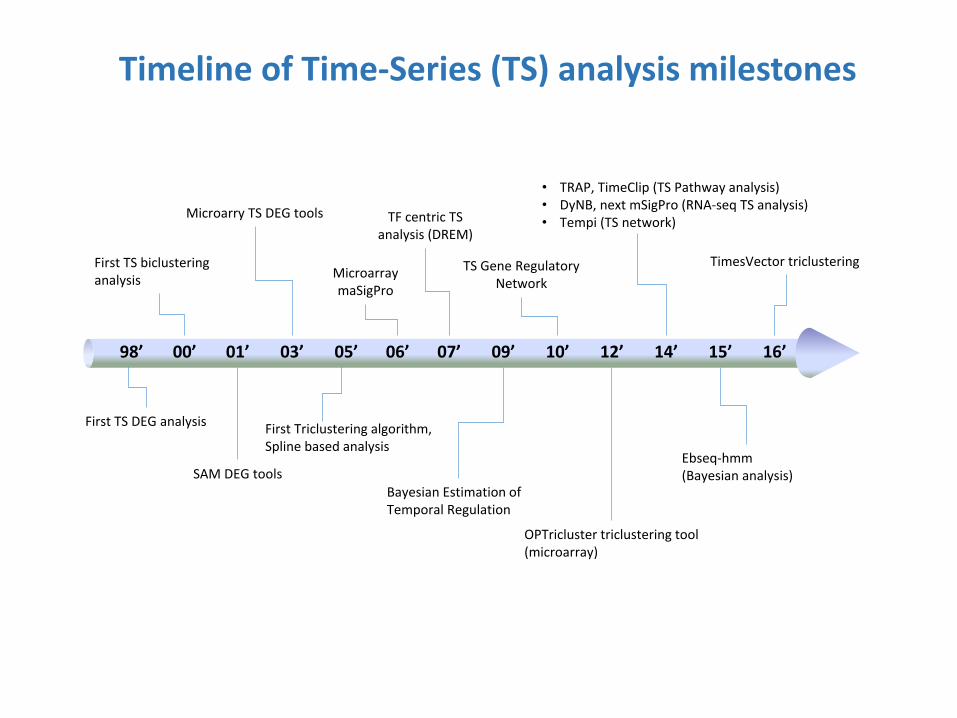
Timeline of Time-Series (TS) analysis milestones
98’
First TS DEG analysis
00’ 01’
SAM DEG tools
03’ 05’
Microarray maSigPro
06’ 07’
OPTricluster triclustering tool (microarray)
09’ 10’
• TRAP, TimeClip (TS Pathway analysis) • DyNB, next mSigPro (RNA-seq TS analysis) • Tempi (TS network)
12’ 14’ 15’ 16’
First TS biclustering analysis
Microarry TS DEG tools
First Triclustering algorithm, Spline based analysis
TF centric TS analysis (DREM)
Bayesian Estimation of Temporal Regulation
TS Gene Regulatory Network
Ebseq-hmm (Bayesian analysis)
TimesVector triclustering
Influence maximization in time bounded network identifies transcription factors regulating perturbed pathways
Kyuri Jo1, Inuk Jung2, Ji Hwan Moon2 and Sun Kim1,2,3,* 1Department of Computer Science and Engineering, 2Interdisciplinary Program in Bioinformatics, 3Bioinformatics Institute, Seoul National University *Corresponding author: [email protected]

• An ordered series of molecular events that leads to a new molecular product, or a change in a cellular state
Background: Biological Pathway
List of pathways (KEGG database)
…
PI3K/AKT signaling pathway (KEGG database)
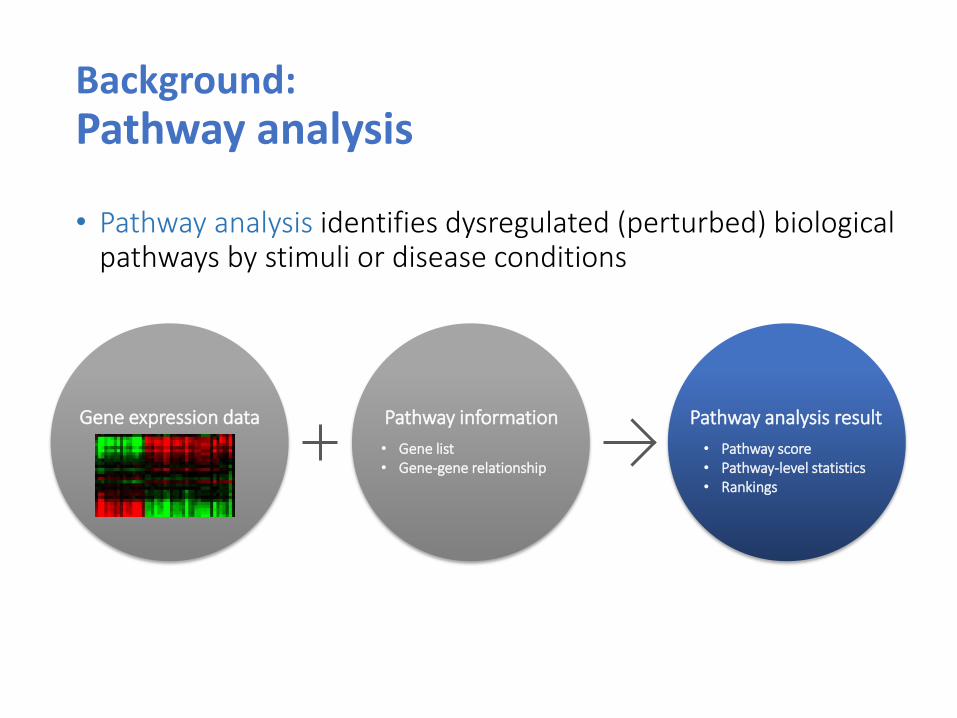
• Pathway analysis identifies dysregulated (perturbed) biological pathways by stimuli or disease conditions
Background: Pathway analysis
Gene expression data Pathway information
• Gene list • Gene-gene relationship
Pathway analysis result
• Pathway score • Pathway-level statistics • Rankings
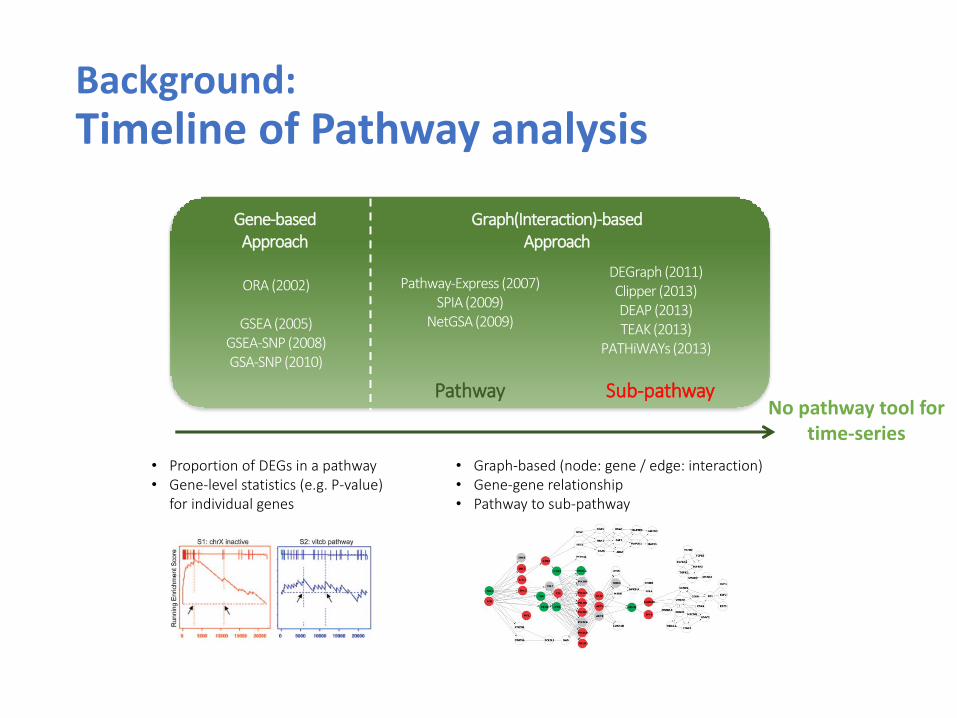
Background: Timeline of Pathway analysis
Pathway-Express (2007) SPIA (2009)
NetGSA (2009)
ORA (2002)
GSEA (2005) GSEA-SNP (2008) GSA-SNP (2010)
Pathway Sub-pathway
Gene-based Approach
Graph(Interaction)-based Approach
DEGraph (2011) Clipper (2013) DEAP (2013) TEAK (2013)
PATHiWAYs (2013)
• Proportion of DEGs in a pathway • Gene-level statistics (e.g. P-value)
for individual genes
• Graph-based (node: gene / edge: interaction) • Gene-gene relationship • Pathway to sub-pathway
No pathway tool for time-series

• Q1. Sub-pathways from time-series transcriptome data ?
Motivation
Transcriptome data Time-series Transcriptome data
?
• Mapping DEGs in the pathway
• DEGs from each time point or whole time points?
• How to detect expression propagation along time?
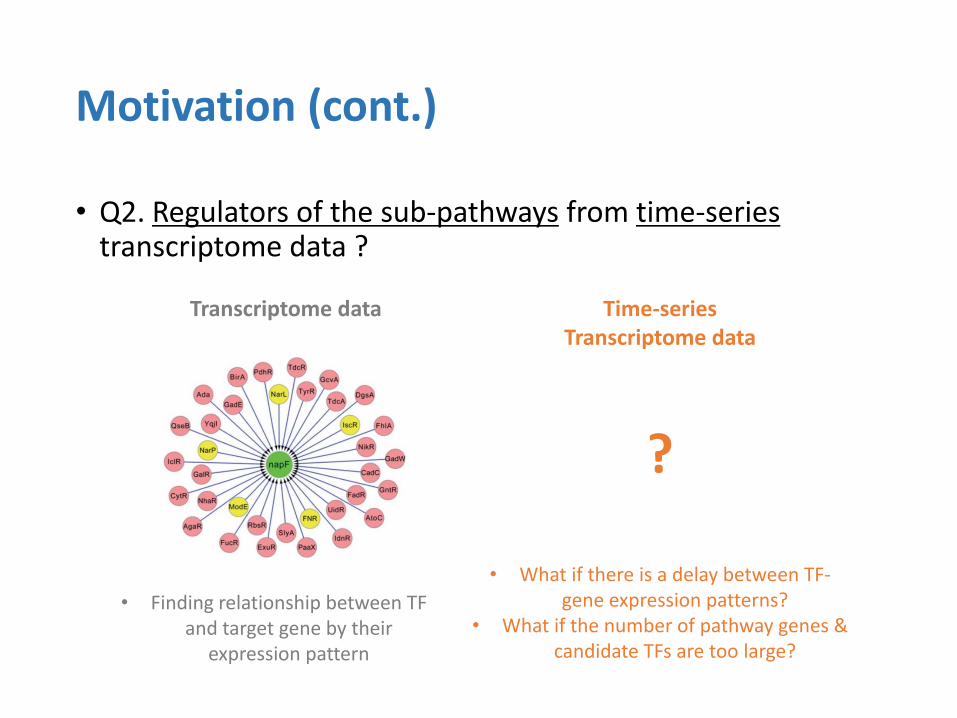
• Q2. Regulators of the sub-pathways from time-series transcriptome data ?
Motivation (cont.)
Transcriptome data Time-series Transcriptome data
?
• What if there is a delay between TF-gene expression patterns?
• What if the number of pathway genes & candidate TFs are too large?
• Finding relationship between TF and target gene by their
expression pattern
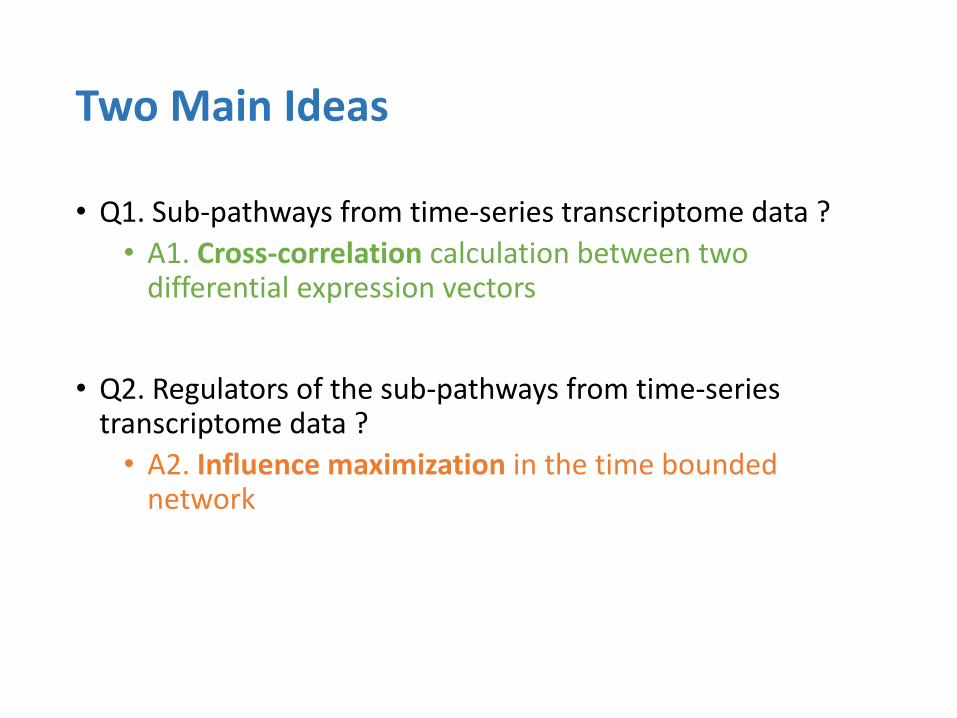
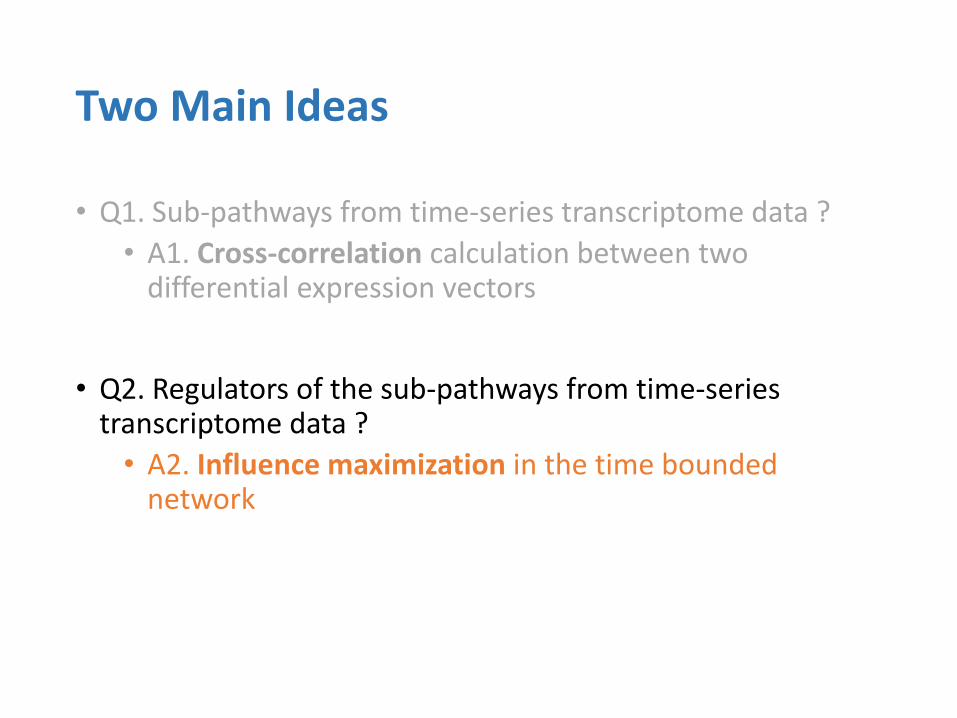
Two Main Ideas
• Q1. Sub-pathways from time-series transcriptome data ?
• A1. Cross-correlation calculation between two differential expression vectors
• Q2. Regulators of the sub-pathways from time-series transcriptome data ?
• A2. Influence maximization in the time bounded network
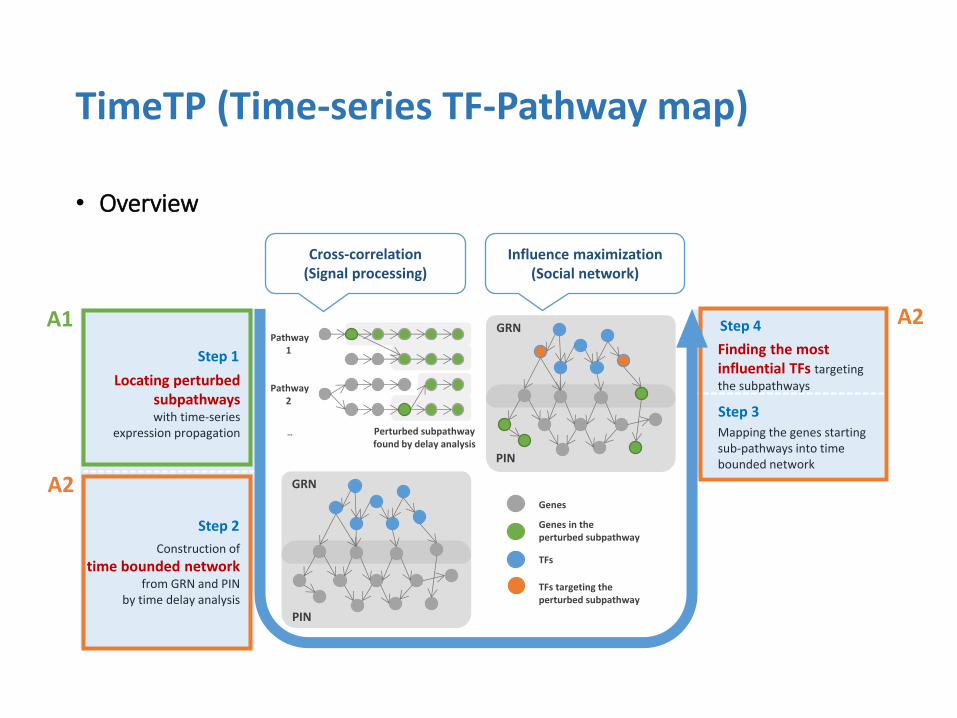
• Overview
TimeTP (Time-series TF-Pathway map)
Step 1
Step 4
Step 2
Step 3
Genes in the perturbed subpathway
TFs
Genes
TFs targeting the perturbed subpathway
Construction of
time bounded network from GRN and PIN
by time delay analysis
Locating perturbed subpathways with time-series
expression propagation Mapping the genes starting sub-pathways into time bounded network
Finding the most influential TFs targeting
the subpathways
GRN
PIN
Pathway 1
Perturbed subpathway found by delay analysis
Pathway 2
…
GRN
PIN
Cross-correlation (Signal processing)
Influence maximization (Social network)
A1
A2
A2

Two Main Ideas
• Q1. Sub-pathways from time-series transcriptome data ?
• A1. Cross-correlation calculation between two differential expression vectors
• Q2. Regulators of the sub-pathways from time-series transcriptome data ?
• A2. Influence maximization in the time bounded network
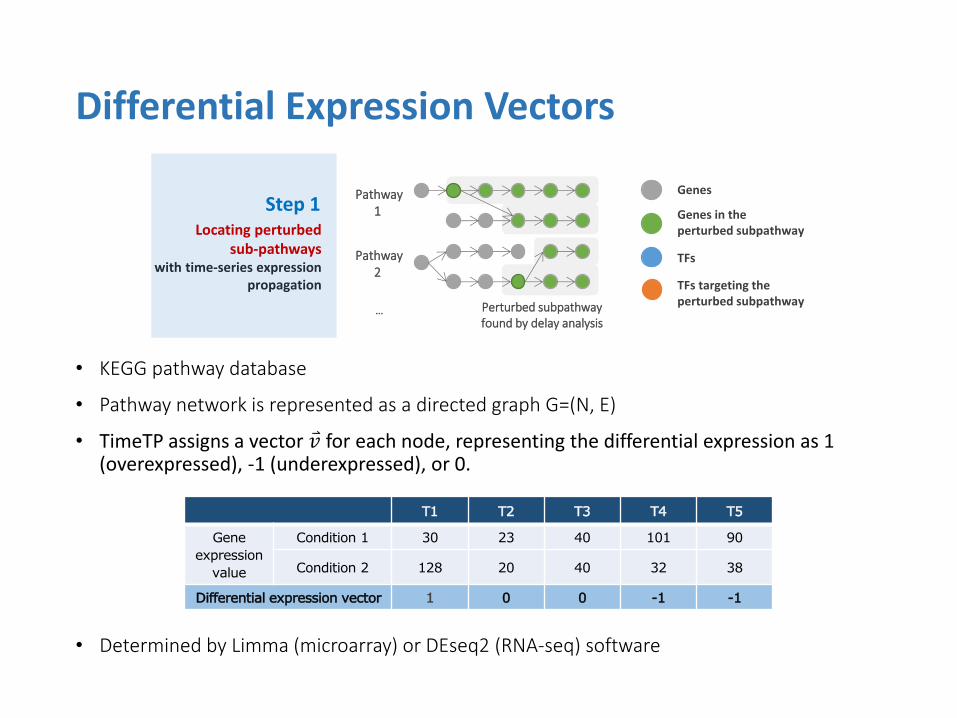
• KEGG pathway database
• Pathway network is represented as a directed graph G=(N, E)
• TimeTP assigns a vector 𝑣 for each node, representing the differential expression as 1 (overexpressed), -1 (underexpressed), or 0.
• Determined by Limma (microarray) or DEseq2 (RNA-seq) software
Differential Expression Vectors
Step 1 Locating perturbed
sub-pathways with time-series expression
propagation
Pathway 1
Perturbed subpathway found by delay analysis
Pathway 2
…
Genes in the perturbed subpathway
TFs
Genes
TFs targeting the perturbed subpathway
T1 T2 T3 T4 T5
Gene
expression
value
Condition 1 30 23 40 101 90
Condition 2 128 20 40 32 38
Differential expression vector 1 0 0 -1 -1
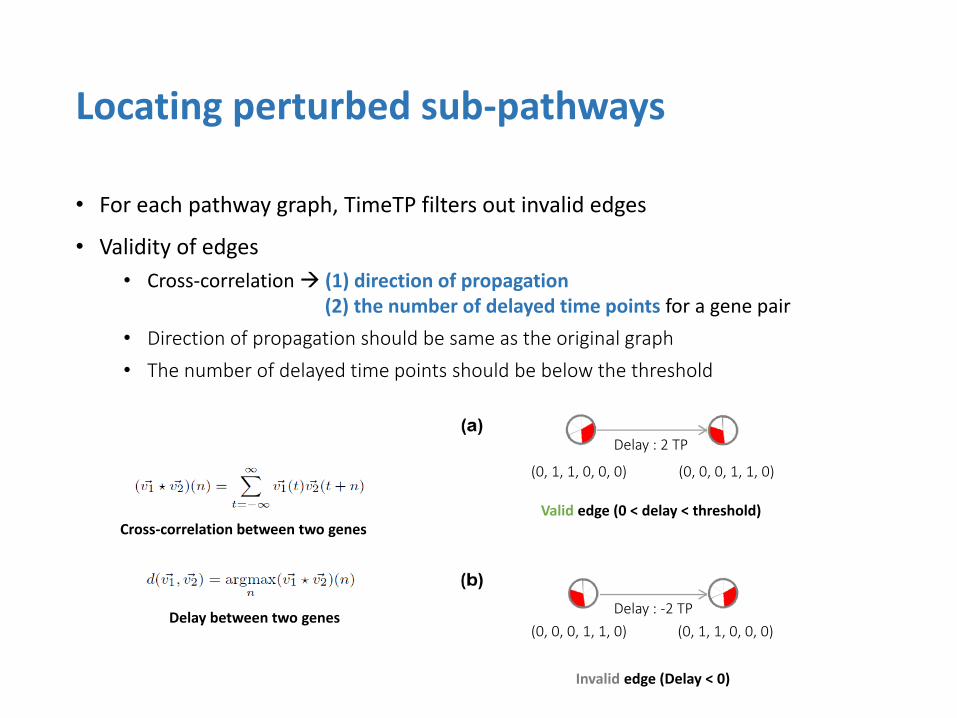
• For each pathway graph, TimeTP filters out invalid edges
• Validity of edges
• Cross-correlation (1) direction of propagation (2) the number of delayed time points for a gene pair
• Direction of propagation should be same as the original graph
• The number of delayed time points should be below the threshold
Locating perturbed sub-pathways
Valid edge (0 < delay < threshold)
Invalid edge (Delay < 0)
Cross-correlation between two genes
Delay between two genes
(0, 1, 1, 0, 0, 0) (0, 0, 0, 1, 1, 0)
Delay : 2 TP
Delay : -2 TP
(0, 0, 0, 1, 1, 0) (0, 1, 1, 0, 0, 0)
Two Main Ideas
• Q1. Sub-pathways from time-series transcriptome data ?
• A1. Cross-correlation calculation between two differential expression vectors
• Q2. Regulators of the sub-pathways from time-series transcriptome data ?
• A2. Influence maximization in the time bounded network

• Integration of GRN and PIN
• To search for upstream regulators of perturbed sub-pathways, gene regulatory network (GRN) and protein-protein interaction network (PIN) are integrated.
• HTRIdb (6 public databases and literature) and STRING database
• Invalid edges are filtered by the cross-correlation
Time-bounded network construction
Step 2 Construction of
time bounded network from GRN and PIN
by time delay analysis
GRN
PIN
Genes in the perturbed subpathway
TFs
Genes
TFs targeting the perturbed subpathway
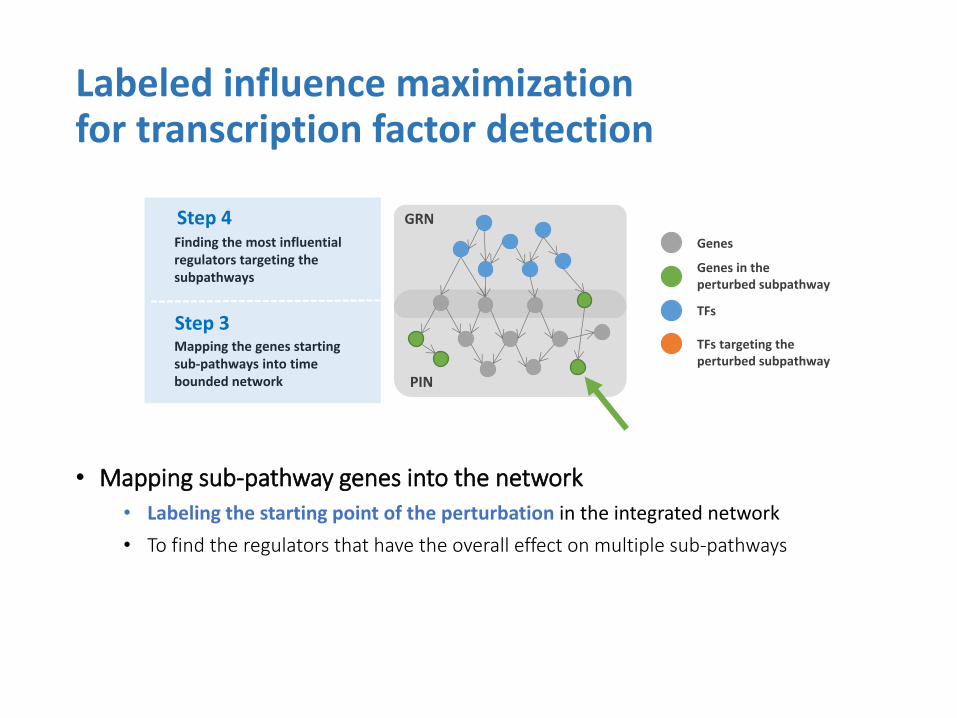
• Mapping sub-pathway genes into the network
• Labeling the starting point of the perturbation in the integrated network
• To find the regulators that have the overall effect on multiple sub-pathways
Labeled influence maximization for transcription factor detection
Step 4
Step 3 Mapping the genes starting sub-pathways into time bounded network
Finding the most influential regulators targeting the subpathways
GRN
PIN
Genes in the perturbed subpathway
TFs
Genes
TFs targeting the perturbed subpathway
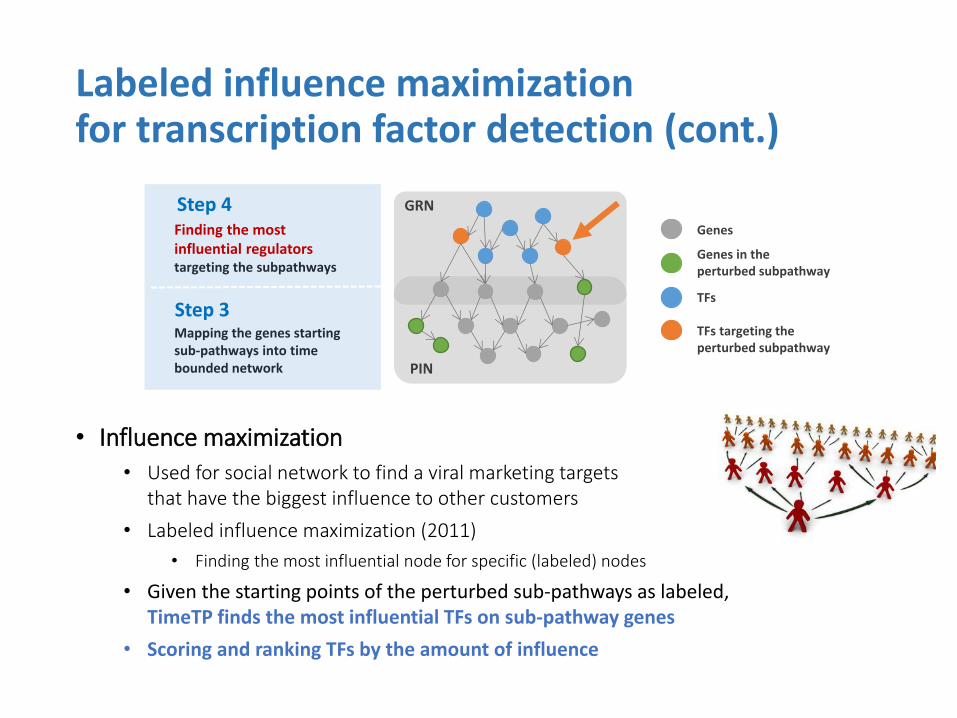
• Influence maximization
• Used for social network to find a viral marketing targets that have the biggest influence to other customers
• Labeled influence maximization (2011)
• Finding the most influential node for specific (labeled) nodes
• Given the starting points of the perturbed sub-pathways as labeled, TimeTP finds the most influential TFs on sub-pathway genes
• Scoring and ranking TFs by the amount of influence
Labeled influence maximization for transcription factor detection (cont.)
Step 4
Step 3 Mapping the genes starting sub-pathways into time bounded network
Finding the most influential regulators targeting the subpathways
GRN
PIN
Genes in the perturbed subpathway
TFs
Genes
TFs targeting the perturbed subpathway
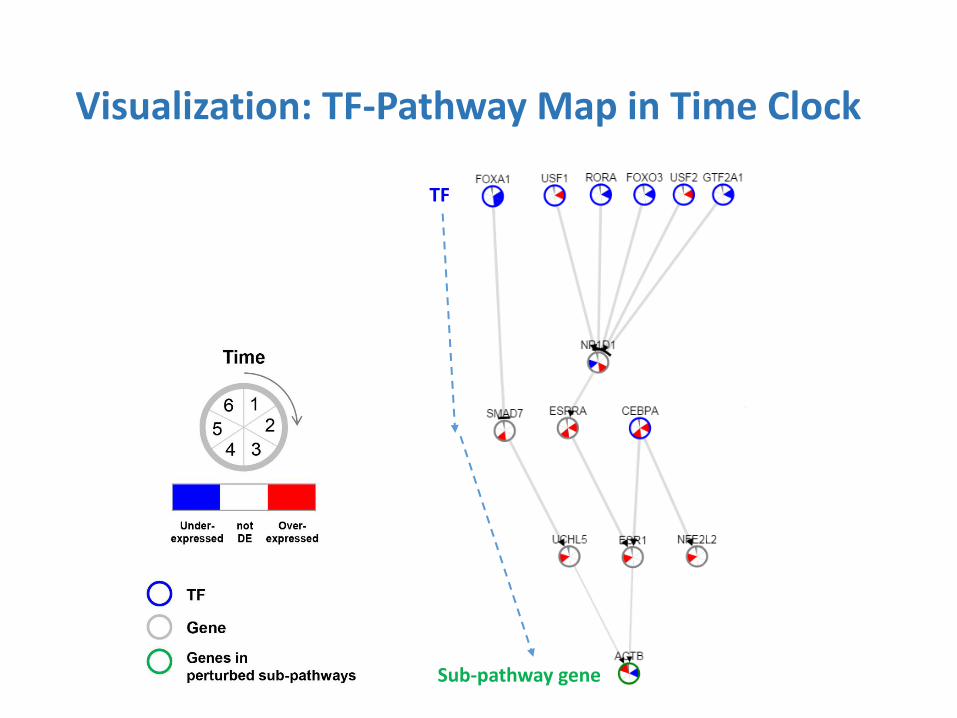
Visualization: TF-Pathway Map in Time Clock
TF
Sub-pathway gene
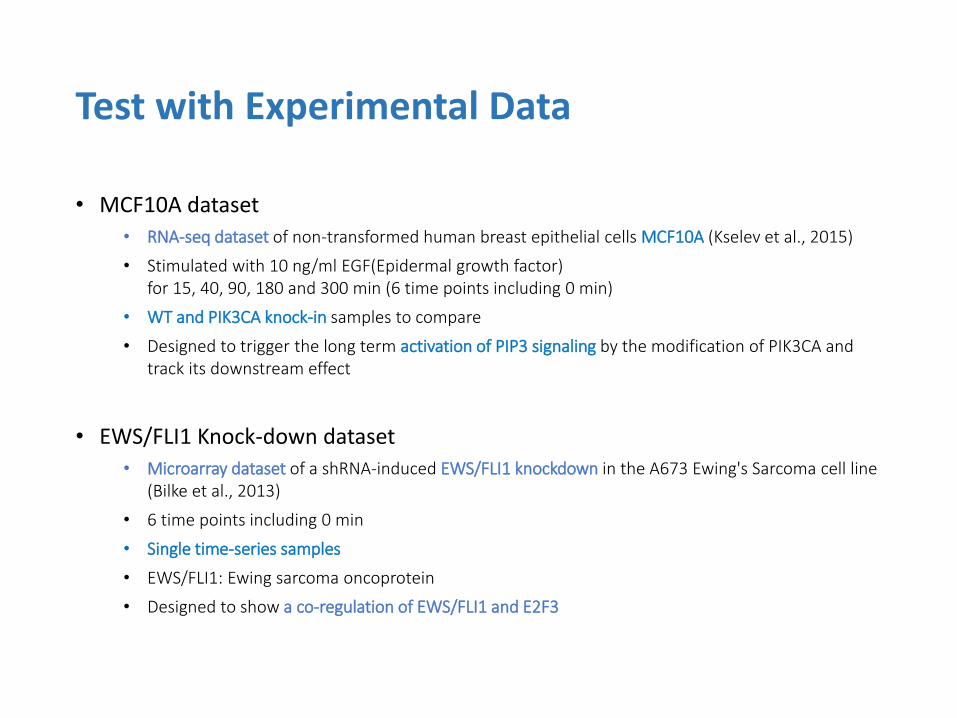
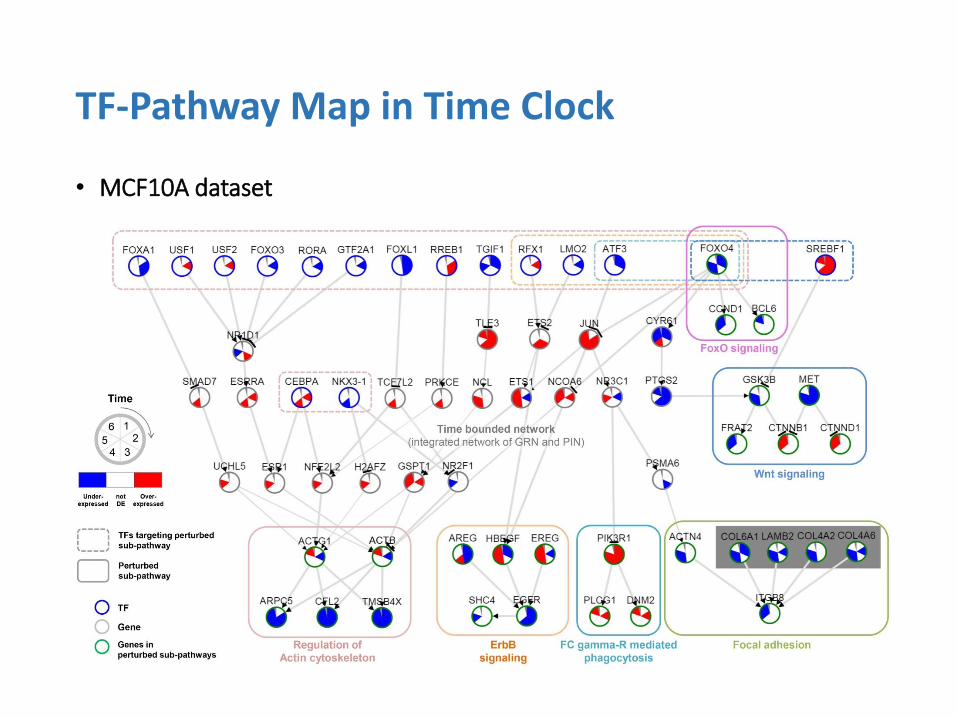
• MCF10A dataset
• RNA-seq dataset of non-transformed human breast epithelial cells MCF10A (Kselev et al., 2015)
• Stimulated with 10 ng/ml EGF(Epidermal growth factor) for 15, 40, 90, 180 and 300 min (6 time points including 0 min)
• WT and PIK3CA knock-in samples to compare
• Designed to trigger the long term activation of PIP3 signaling by the modification of PIK3CA and track its downstream effect
• EWS/FLI1 Knock-down dataset
• Microarray dataset of a shRNA-induced EWS/FLI1 knockdown in the A673 Ewing's Sarcoma cell line (Bilke et al., 2013)
• 6 time points including 0 min
• Single time-series samples
• EWS/FLI1: Ewing sarcoma oncoprotein
• Designed to show a co-regulation of EWS/FLI1 and E2F3
Test with Experimental Data
• MCF10A dataset
TF-Pathway Map in Time Clock
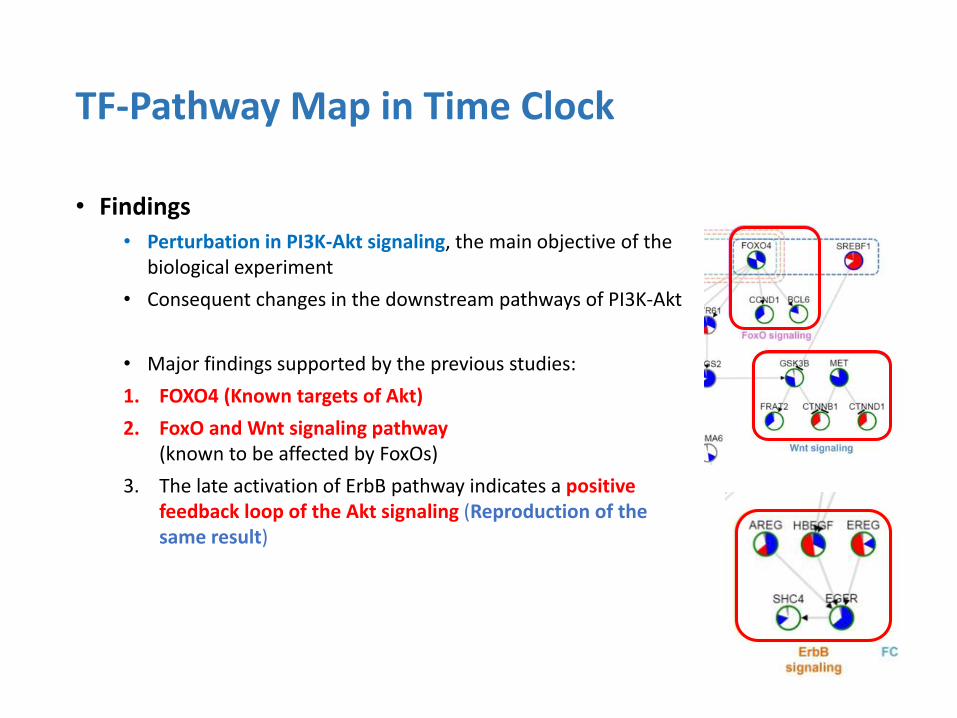
• Findings
• Perturbation in PI3K-Akt signaling, the main objective of the biological experiment
• Consequent changes in the downstream pathways of PI3K-Akt
• Major findings supported by the previous studies:
1. FOXO4 (Known targets of Akt)
2. FoxO and Wnt signaling pathway (known to be affected by FoxOs)
3. The late activation of ErbB pathway indicates a positive feedback loop of the Akt signaling (Reproduction of the same result)
TF-Pathway Map in Time Clock
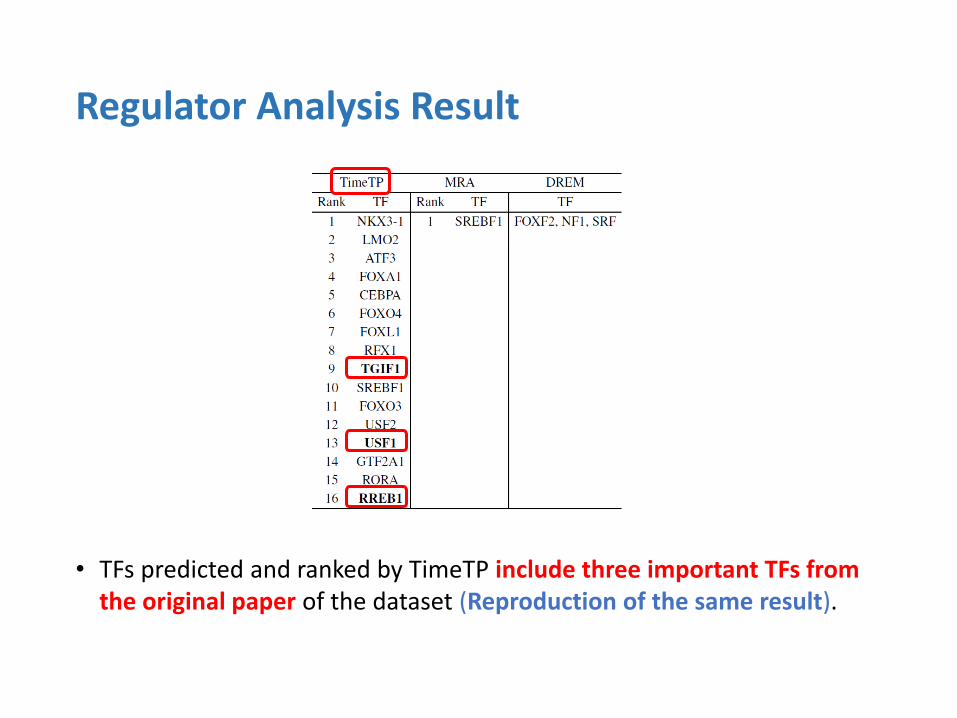
• TFs predicted and ranked by TimeTP include three important TFs from the original paper of the dataset (Reproduction of the same result).
Regulator Analysis Result
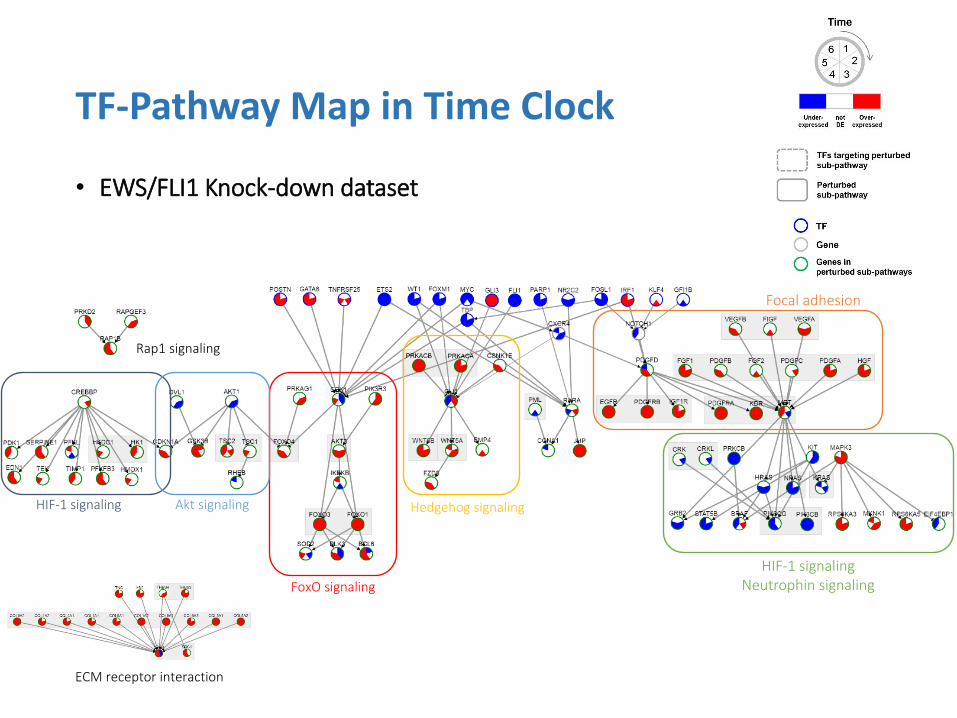
• EWS/FLI1 Knock-down dataset
TF-Pathway Map in Time Clock
Focal adhesion
HIF-1 signaling Neutrophin signaling
Hedgehog signaling
FoxO signaling
Akt signaling HIF-1 signaling
Rap1 signaling
ECM receptor interaction
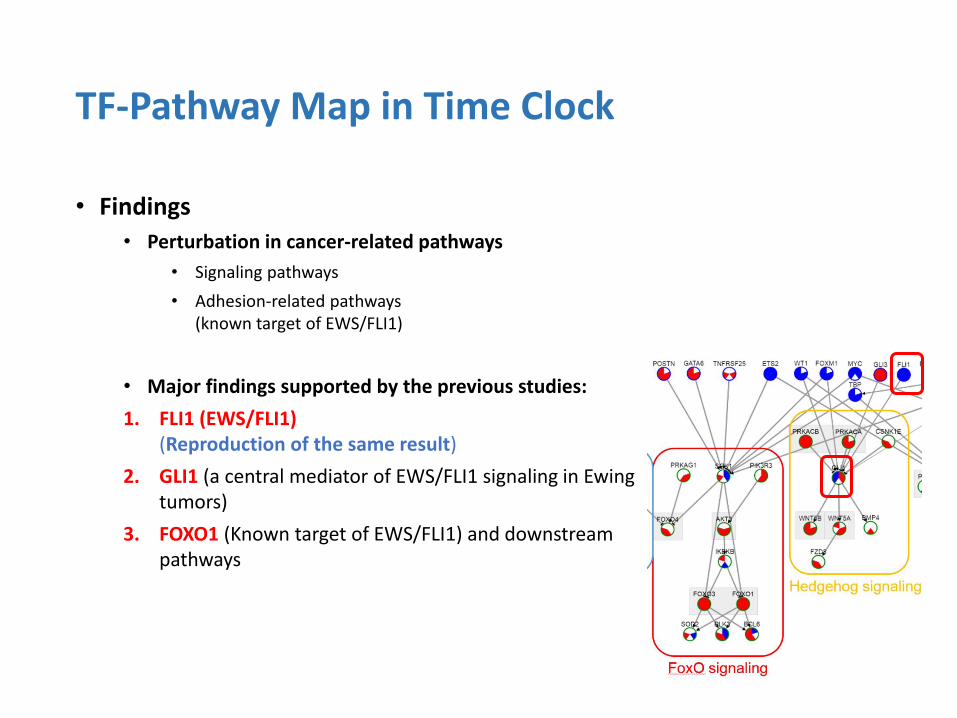
• Findings
• Perturbation in cancer-related pathways
• Signaling pathways
• Adhesion-related pathways (known target of EWS/FLI1)
• Major findings supported by the previous studies:
1. FLI1 (EWS/FLI1) (Reproduction of the same result)
2. GLI1 (a central mediator of EWS/FLI1 signaling in Ewing tumors)
3. FOXO1 (Known target of EWS/FLI1) and downstream pathways
TF-Pathway Map in Time Clock
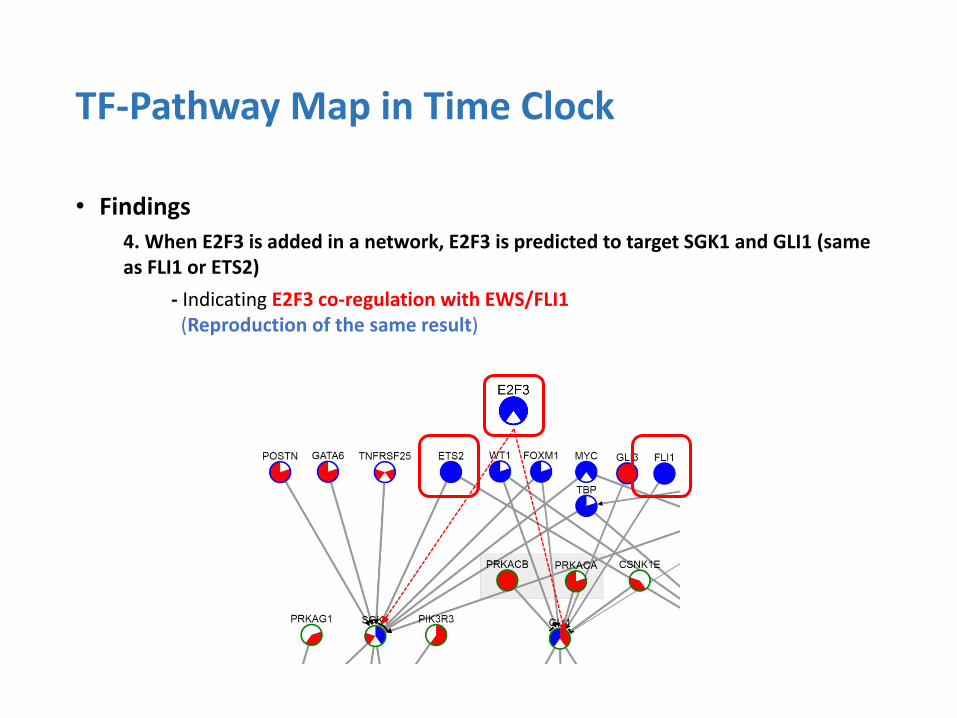
• Findings
4. When E2F3 is added in a network, E2F3 is predicted to target SGK1 and GLI1 (same as FLI1 or ETS2)
- Indicating E2F3 co-regulation with EWS/FLI1 (Reproduction of the same result)
TF-Pathway Map in Time Clock
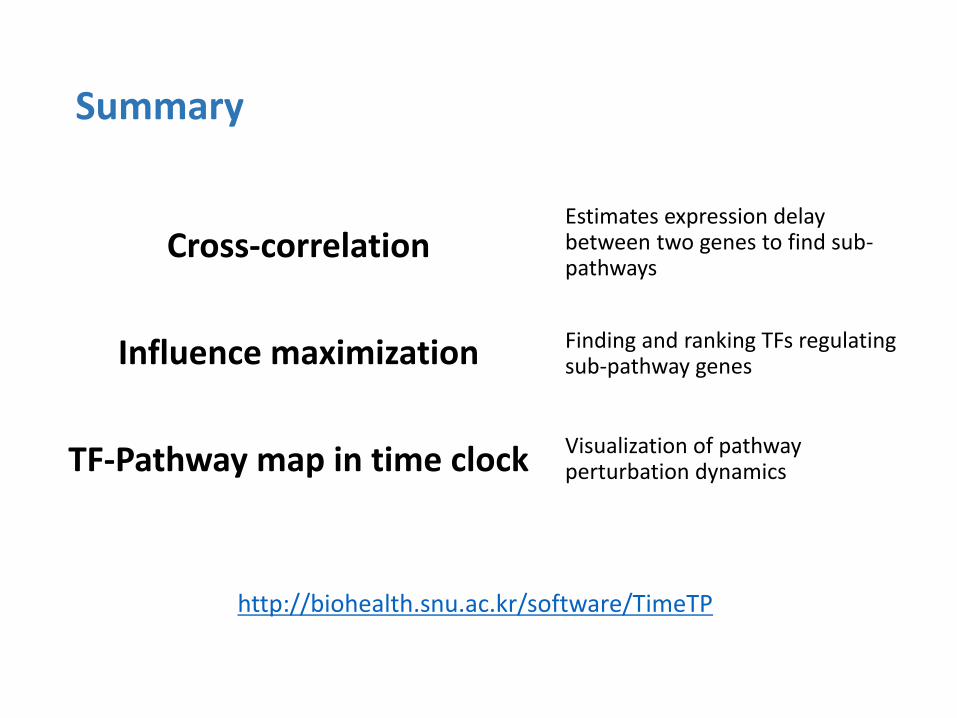
Cross-correlation
Influence maximization
TF-Pathway map in time clock
Summary
Estimates expression delay between two genes to find sub-pathways
Finding and ranking TFs regulating sub-pathway genes
Visualization of pathway perturbation dynamics
http://biohealth.snu.ac.kr/software/TimeTP
• Lab members • Sun Kim (Advisor)
• Inuk Jung
• Ji-Hwan Moon
• Sangsoo Lim
• Benjamin Hur
• Funding • Next-Generation Information Computing Development Program through the National
Research Foundation of Korea (NRF) funded by the Ministry of Science, ICT and Future Planning (NRF- 2012M3C4A7033341)
• Collaborative Genome Program for Fostering New Post-Genome industry through the National Research Foundation of Korea (NRF) funded by the Ministry of Science, ICT and Future Planning (NRF-2014M3C9A3063541)
• Korea Health Technology R&D Project through the Korea Health Industry Development Institute (KHIDI), funded by the Ministry of Health & Welfare, Republic of Korea [grant number:HI15C3224].
• Travel funding to ISMB 2016 was generously provided by HiTSeq
Acknowledgement
TimesVector: A vectorized clustering approach to the analysis of time series transcriptome data from multiple phenotypes
Inuk Jung1, Kyuri Jo2, Hyejin Kang3, Hongryul Ahn2, Youngjae Yu2 and Sun Kim1,2,4,* 1 Interdisciplinary Program in Bioinformatics, 2Department of Computer Science and Engineering, 3Department of Applied Biology and Chemistry, 4Bioinformatics Institute, Seoul National University *Corresponding author: [email protected]
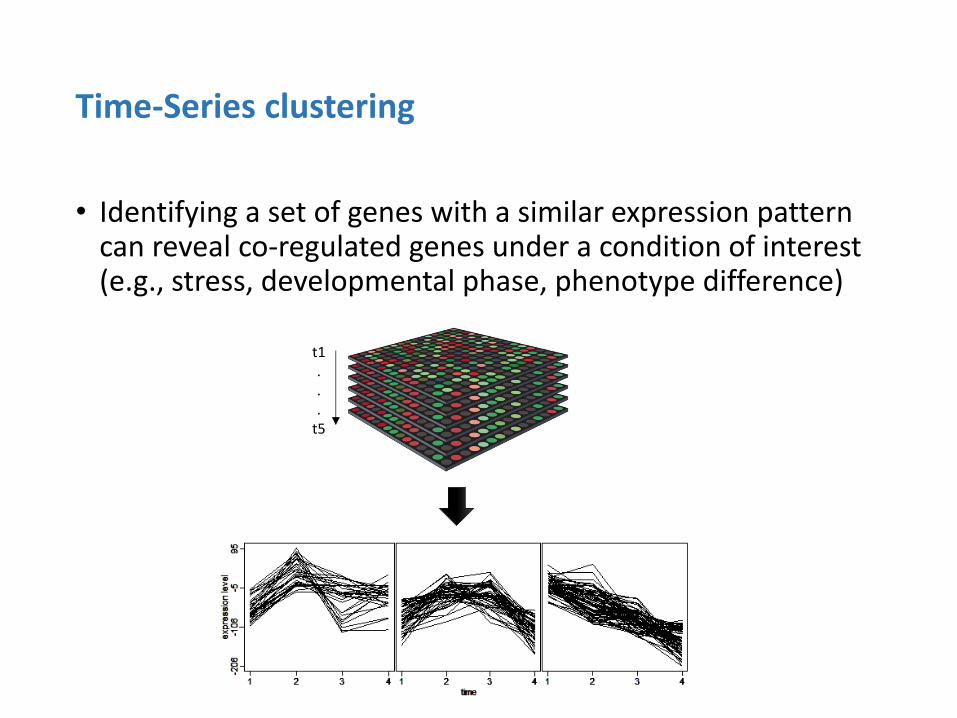
• Identifying a set of genes with a similar expression pattern can reveal co-regulated genes under a condition of interest (e.g., stress, developmental phase, phenotype difference)
Time-Series clustering
t1 . . .
t5
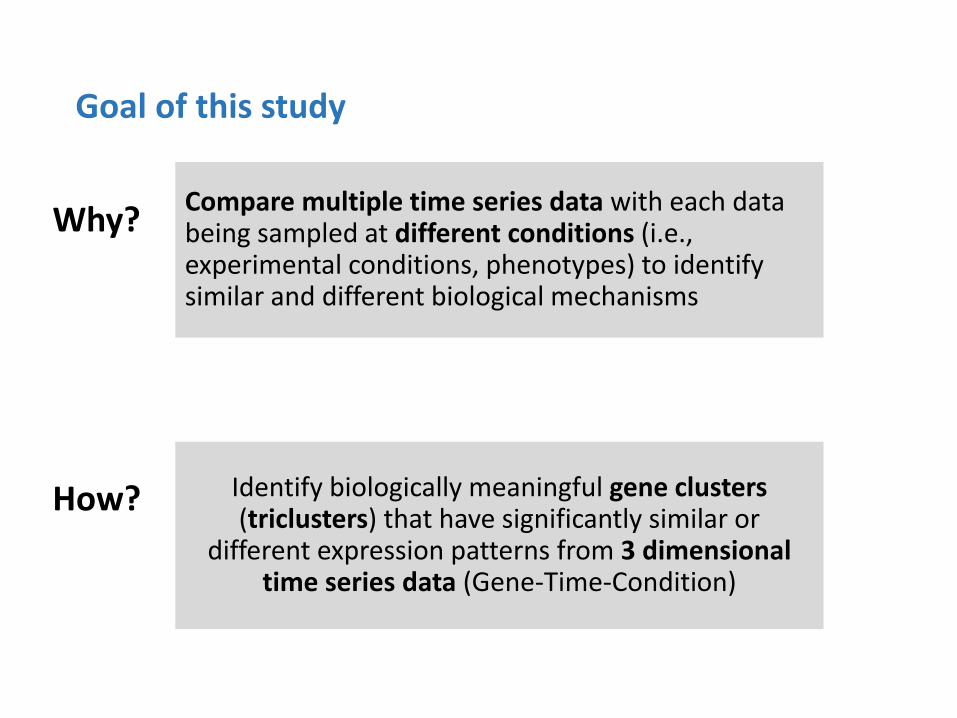
Identify biologically meaningful gene clusters (triclusters) that have significantly similar or
different expression patterns from 3 dimensional time series data (Gene-Time-Condition)
Goal of this study
Compare multiple time series data with each data being sampled at different conditions (i.e., experimental conditions, phenotypes) to identify similar and different biological mechanisms
Why?
How?

• Clustering methods can be classified by the dimension of the time series data
• 1 Dimensional – Single time point (static) gene expression data
• 2 Dimensional – Multiple time points gene expression data
• 3 Dimensional – Multiple time points and conditions gene expression data
Backgrounds: Methods for time series gene clustering
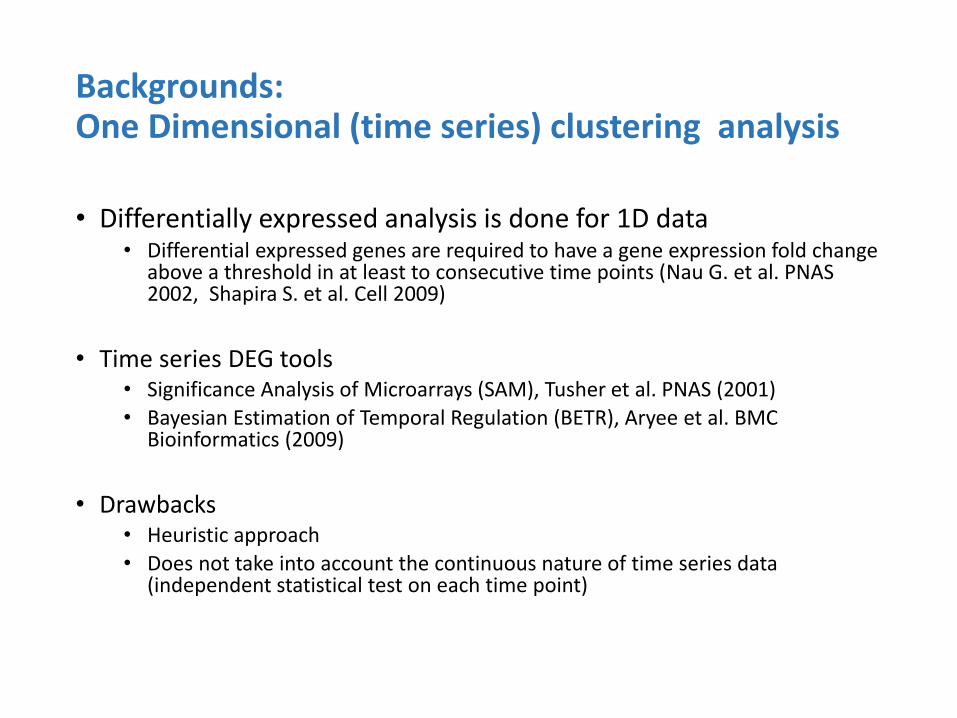
• Differentially expressed analysis is done for 1D data • Differential expressed genes are required to have a gene expression fold change
above a threshold in at least to consecutive time points (Nau G. et al. PNAS 2002, Shapira S. et al. Cell 2009)
• Time series DEG tools • Significance Analysis of Microarrays (SAM), Tusher et al. PNAS (2001)
• Bayesian Estimation of Temporal Regulation (BETR), Aryee et al. BMC Bioinformatics (2009)
• Drawbacks • Heuristic approach
• Does not take into account the continuous nature of time series data (independent statistical test on each time point)
Backgrounds: One Dimensional (time series) clustering analysis
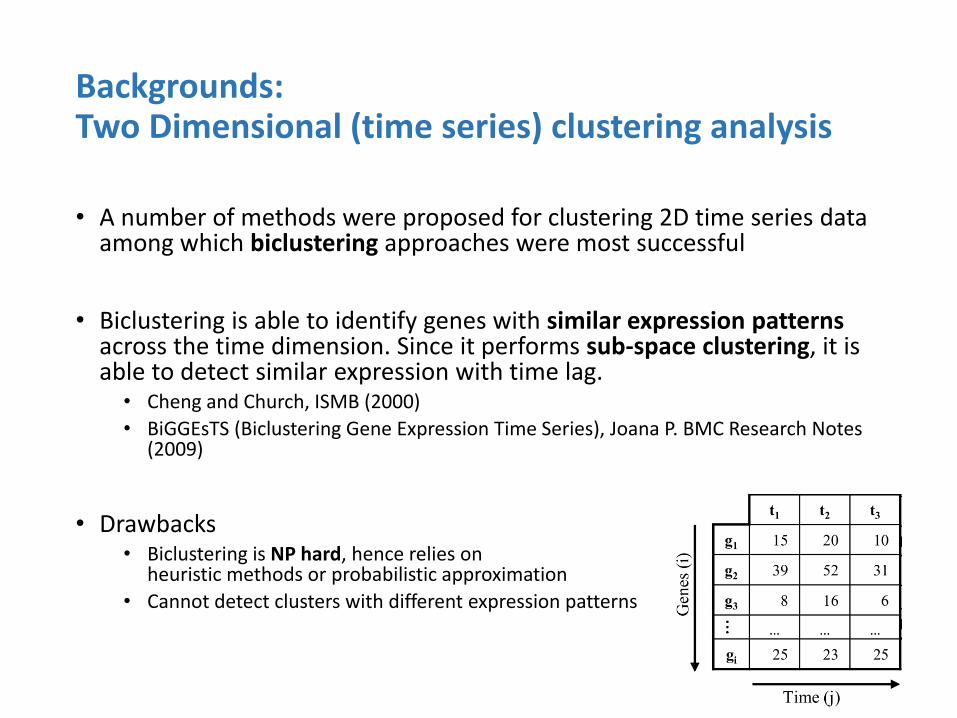
• A number of methods were proposed for clustering 2D time series data among which biclustering approaches were most successful
• Biclustering is able to identify genes with similar expression patterns across the time dimension. Since it performs sub-space clustering, it is able to detect similar expression with time lag.
• Cheng and Church, ISMB (2000)
• BiGGEsTS (Biclustering Gene Expression Time Series), Joana P. BMC Research Notes (2009)
• Drawbacks • Biclustering is NP hard, hence relies on
heuristic methods or probabilistic approximation
• Cannot detect clusters with different expression patterns
Backgrounds: Two Dimensional (time series) clustering analysis
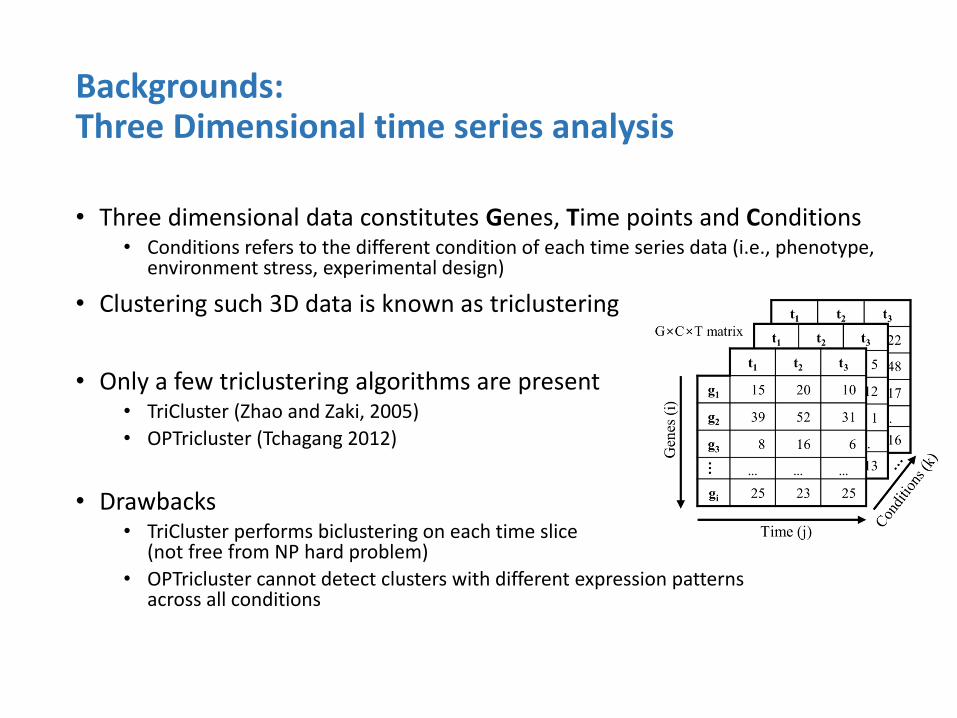
• Three dimensional data constitutes Genes, Time points and Conditions • Conditions refers to the different condition of each time series data (i.e., phenotype,
environment stress, experimental design)
• Clustering such 3D data is known as triclustering
• Only a few triclustering algorithms are present • TriCluster (Zhao and Zaki, 2005)
• OPTricluster (Tchagang 2012)
• Drawbacks • TriCluster performs biclustering on each time slice
(not free from NP hard problem)
• OPTricluster cannot detect clusters with different expression patterns across all conditions
Backgrounds: Three Dimensional time series analysis
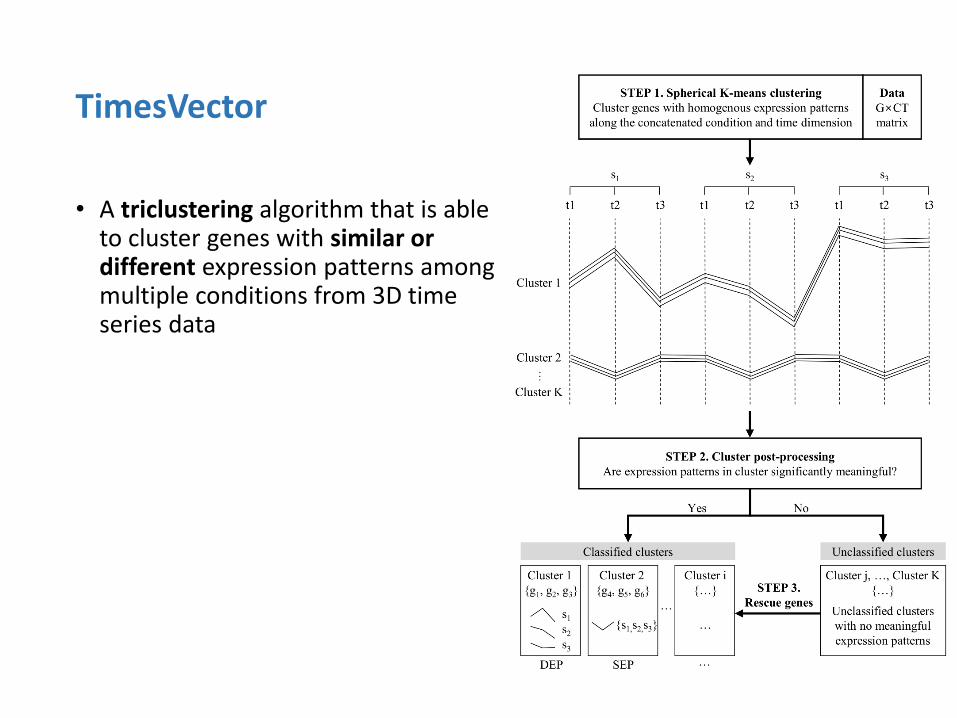
• A triclustering algorithm that is able to cluster genes with similar or different expression patterns among multiple conditions from 3D time series data
TimesVector
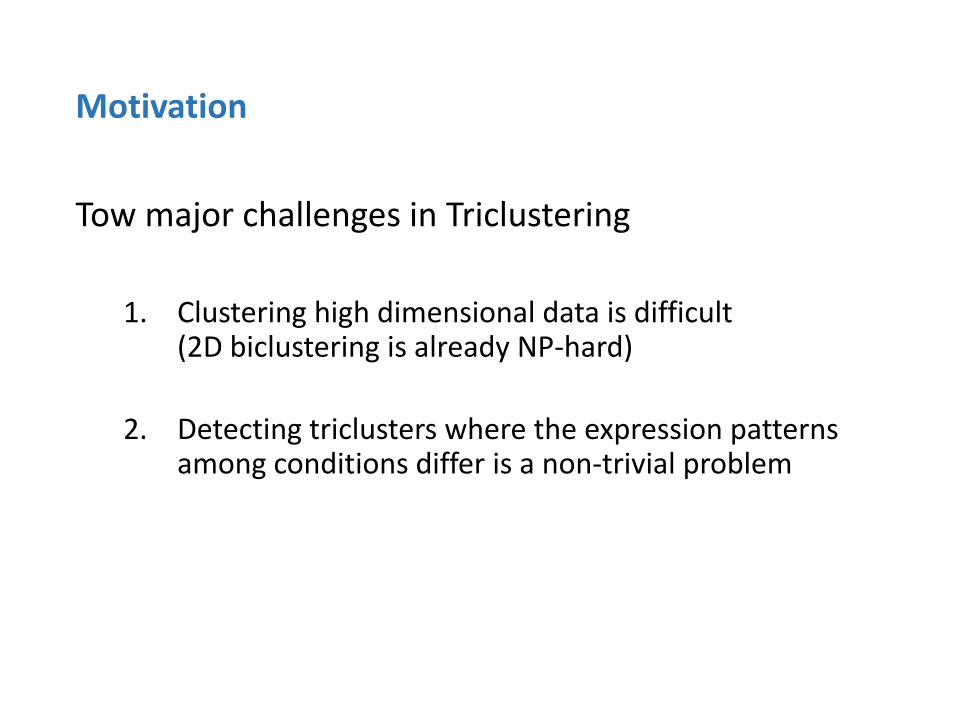
Tow major challenges in Triclustering
1. Clustering high dimensional data is difficult
(2D biclustering is already NP-hard)
2. Detecting triclusters where the expression patterns among conditions differ is a non-trivial problem
Motivation
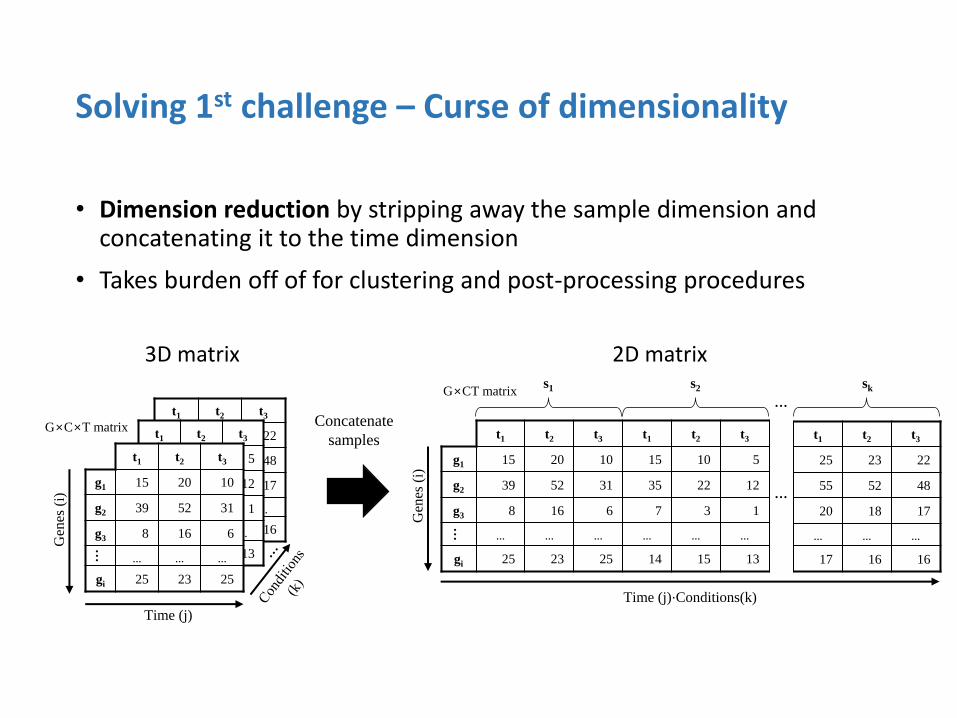
• Dimension reduction by stripping away the sample dimension and concatenating it to the time dimension
• Takes burden off of for clustering and post-processing procedures
Solving 1st challenge – Curse of dimensionality
t1 t2 t3
25 23 22
48
17
…
16
t1 t2 t3
5
12
1
…
13
t1 t2 t3
g1 15 20 10
g2 39 52 31
g3 8 16 6
… … … …
gi 25 23 25
Gen
es (
i)
Time (j)
G×C×T matrix t1 t2 t3 t1 t2 t3
g1 15 20 10 15 10 5
g2 39 52 31 35 22 12
g3 8 16 6 7 3 1 …
… … … … … …
gi 25 23 25 14 15 13
s1 s2 sk G×CT matrix
t1 t2 t3
25 23 22
55 52 48
20 18 17
… … …
17 16 16
…
…
Concatenate
samples
Gen
es (
i)
Time (j)⋅Conditions(k)
3D matrix 2D matrix
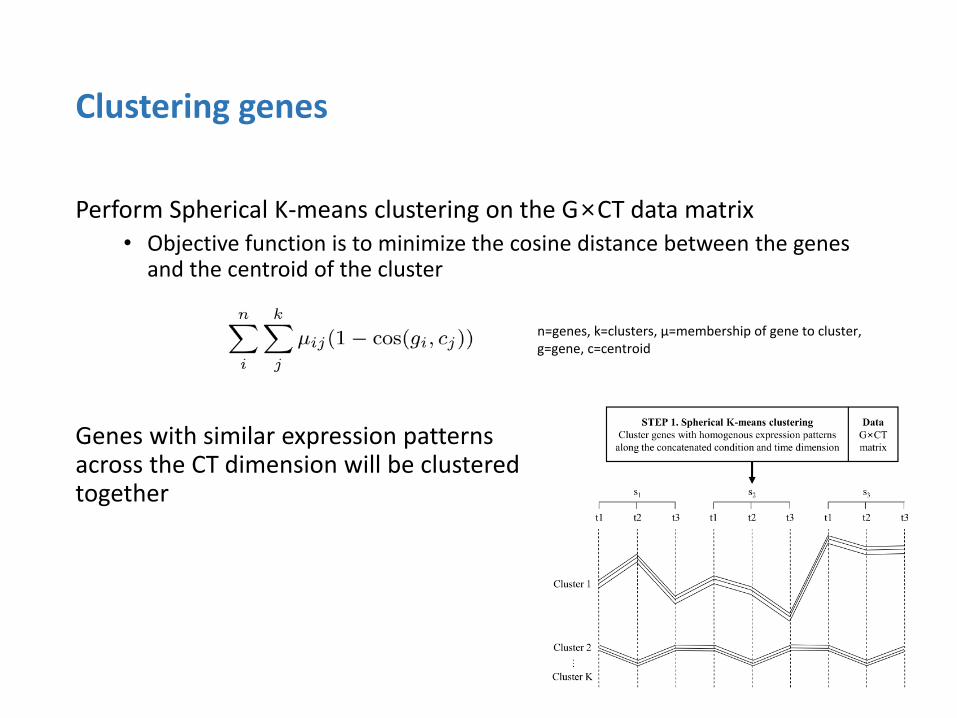
Perform Spherical K-means clustering on the G×CT data matrix • Objective function is to minimize the cosine distance between the genes
and the centroid of the cluster
Genes with similar expression patterns across the CT dimension will be clustered together
Clustering genes
n=genes, k=clusters, μ=membership of gene to cluster, g=gene, c=centroid
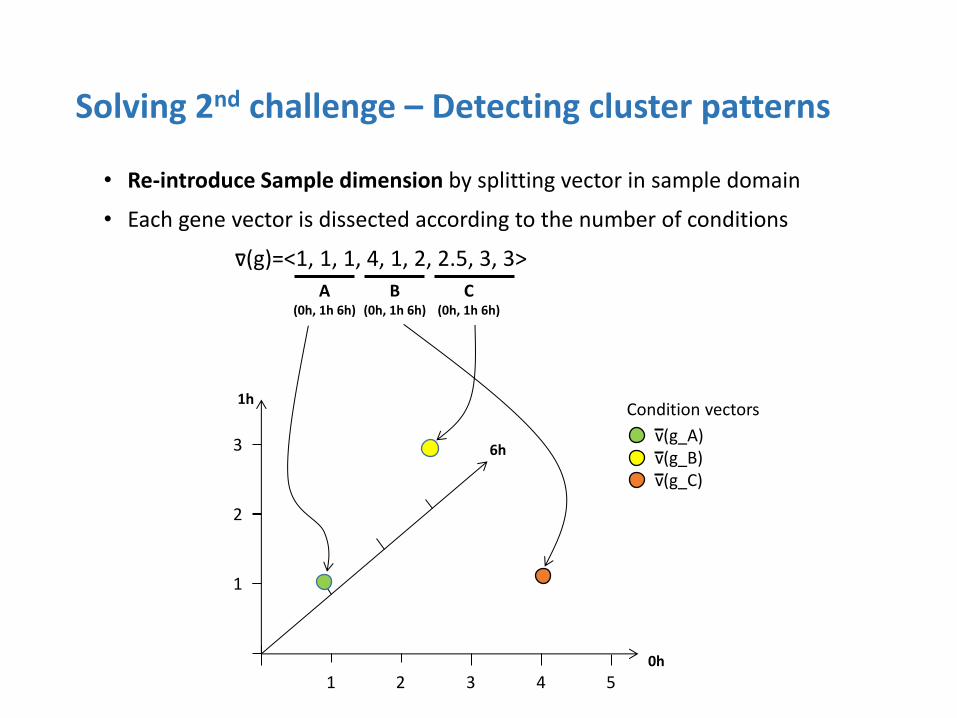
Solving 2nd challenge – Detecting cluster patterns
• Re-introduce Sample dimension by splitting vector in sample domain
• Each gene vector is dissected according to the number of conditions
v(g)=<1, 1, 1, 4, 1, 2, 2.5, 3, 3>
0h
1h
6h v(g_A) v(g_B) v(g_C)
1 2 3 4 5
1
2
3
A (0h, 1h 6h)
B (0h, 1h 6h)
C (0h, 1h 6h)
Condition vectors

DEP (Differentially Expressed Pattern)
• All samples in a cluster have different expression patterns
ODEP (One Differentially Expressed Pattern)
• One sample in a cluster have different expression from the others
SEP (Similarly Expressed Pattern)
• All samples have similar expression pattern in a cluster
Solving 2nd challenge – Detecting cluster patterns
Compute mutual information to see if the pattern of each condition correlates well with the condition label
Perform ANOVA on the condition vector’s cosine distance to see if one pattern is significantly different
Statistically test if within cluster cosine distance is significantly tight (i.e., pattern is similar)
K-means suffers from the problem of pre-defined K clustering
Hence, some genes may be wrongly clustered, which cluster is rejected due to insignificance
Each gene in rejected clusters are reassigned to accepted clusters and rescued if the fitness of the cluster improves
• Approximately 2.5% of rejected genes were rescued in average
Rescuing genes
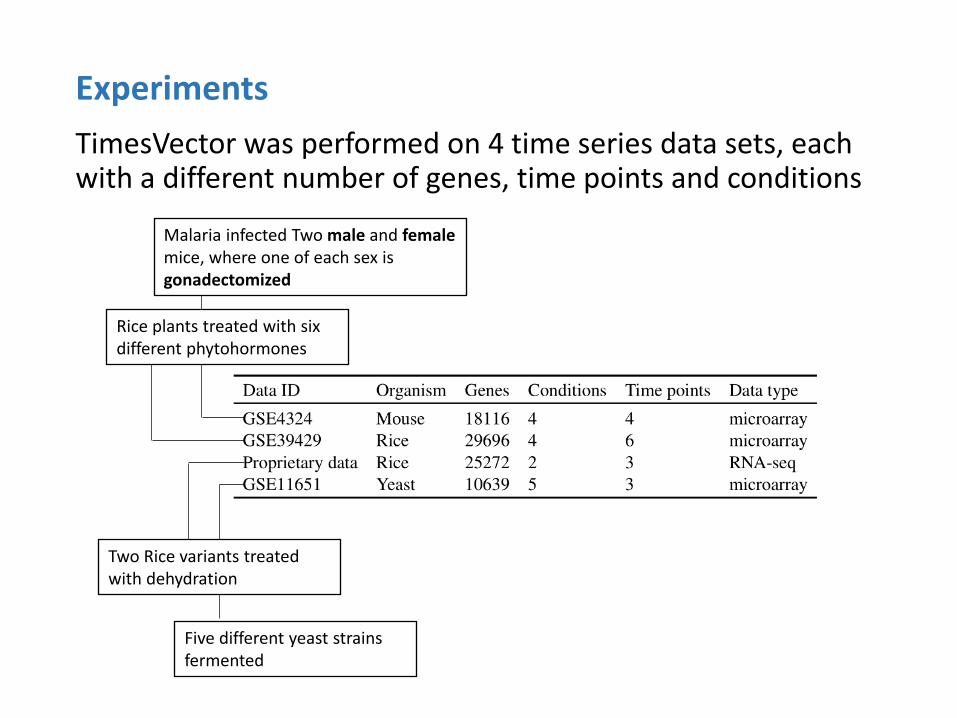
TimesVector was performed on 4 time series data sets, each with a different number of genes, time points and conditions
Experiments
Malaria infected Two male and female mice, where one of each sex is gonadectomized
Five different yeast strains fermented
Rice plants treated with six different phytohormones
Two Rice variants treated with dehydration
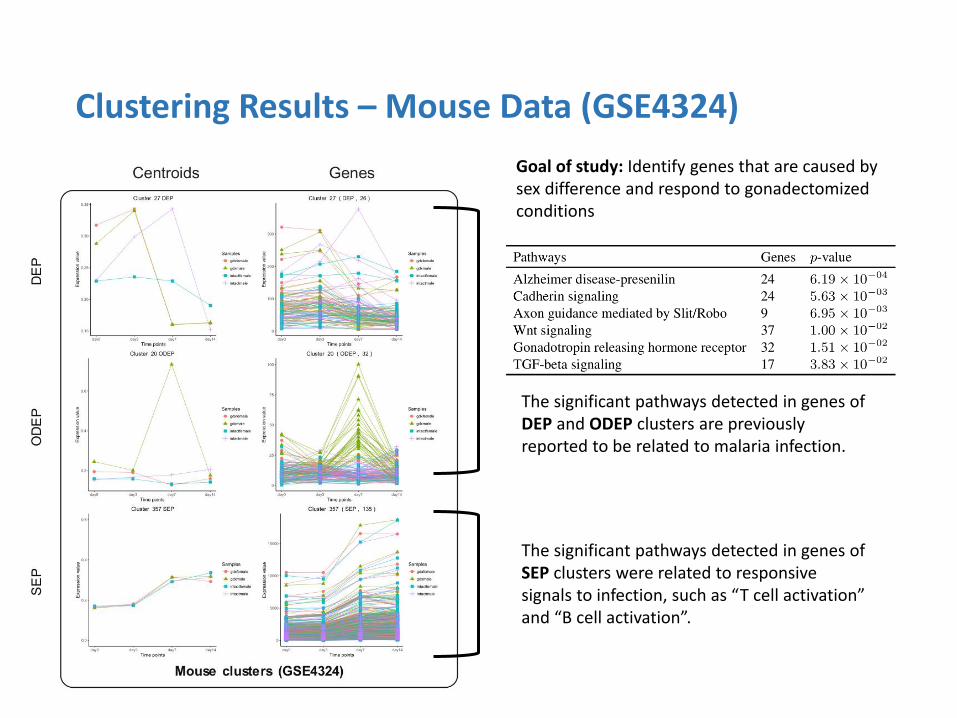
Clustering Results – Mouse Data (GSE4324)
Goal of study: Identify genes that are caused by sex difference and respond to gonadectomized conditions
The significant pathways detected in genes of DEP and ODEP clusters are previously reported to be related to malaria infection.
The significant pathways detected in genes of SEP clusters were related to responsive signals to infection, such as “T cell activation” and “B cell activation”.
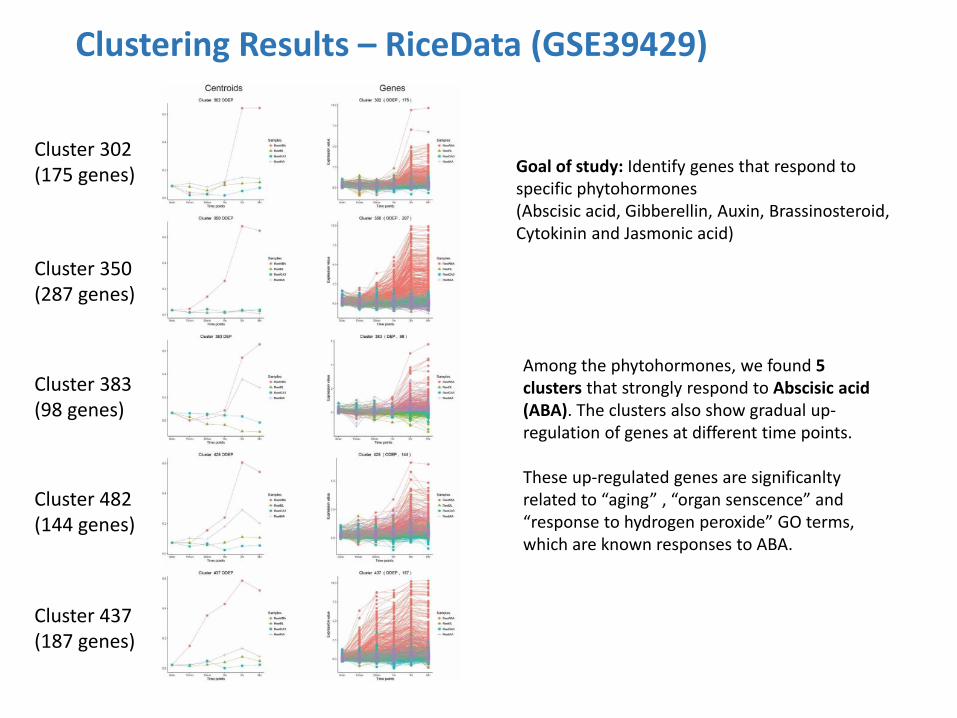
Clustering Results – RiceData (GSE39429)
Goal of study: Identify genes that respond to specific phytohormones (Abscisic acid, Gibberellin, Auxin, Brassinosteroid, Cytokinin and Jasmonic acid)
Among the phytohormones, we found 5 clusters that strongly respond to Abscisic acid (ABA). The clusters also show gradual up-regulation of genes at different time points. These up-regulated genes are significanlty related to “aging” , “organ senscence” and “response to hydrogen peroxide” GO terms, which are known responses to ABA.
Cluster 302 (175 genes)
Cluster 350 (287 genes)
Cluster 383 (98 genes)
Cluster 482 (144 genes)
Cluster 437 (187 genes)
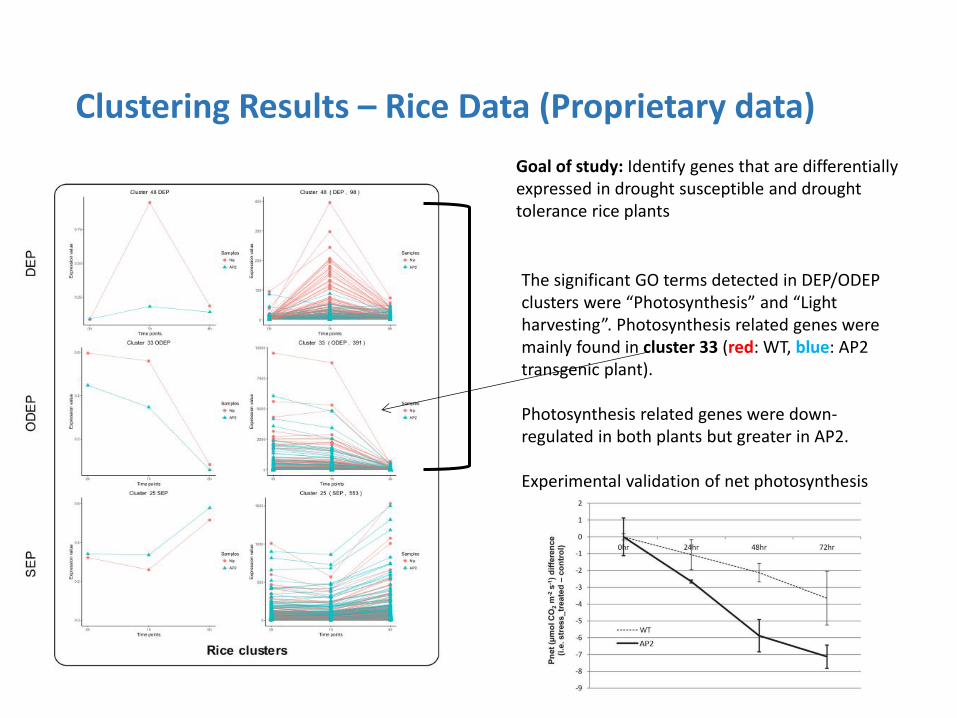
Clustering Results – Rice Data (Proprietary data)
Goal of study: Identify genes that are differentially expressed in drought susceptible and drought tolerance rice plants
The significant GO terms detected in DEP/ODEP clusters were “Photosynthesis” and “Light harvesting”. Photosynthesis related genes were mainly found in cluster 33 (red: WT, blue: AP2 transgenic plant). Photosynthesis related genes were down-regulated in both plants but greater in AP2. Experimental validation of net photosynthesis
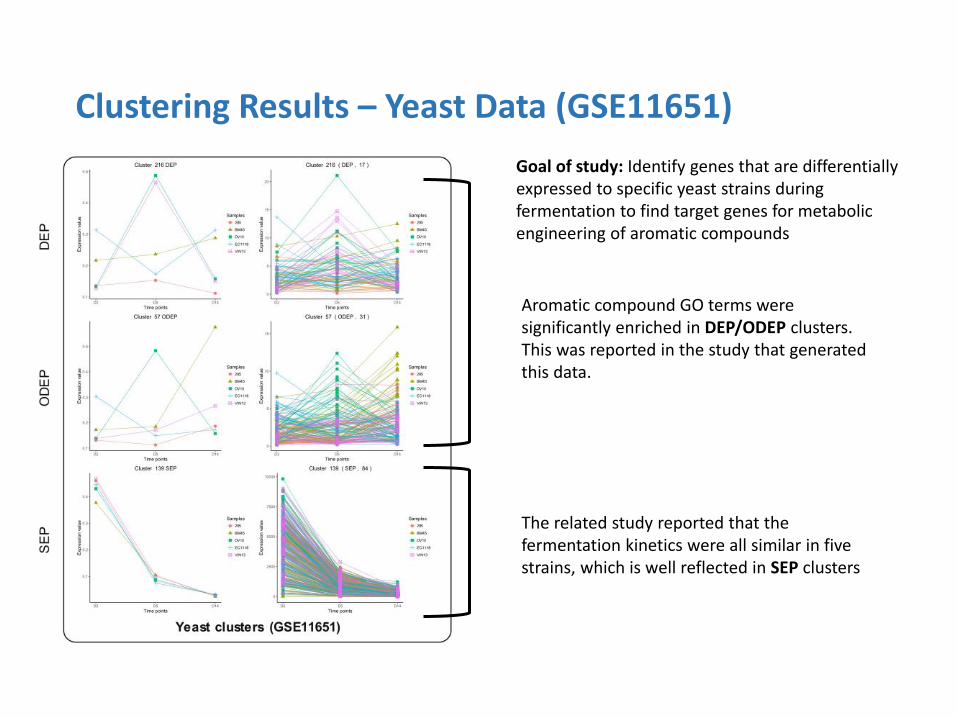
Clustering Results – Yeast Data (GSE11651)
Goal of study: Identify genes that are differentially expressed to specific yeast strains during fermentation to find target genes for metabolic engineering of aromatic compounds
The related study reported that the fermentation kinetics were all similar in five strains, which is well reflected in SEP clusters
Aromatic compound GO terms were significantly enriched in DEP/ODEP clusters. This was reported in the study that generated this data.
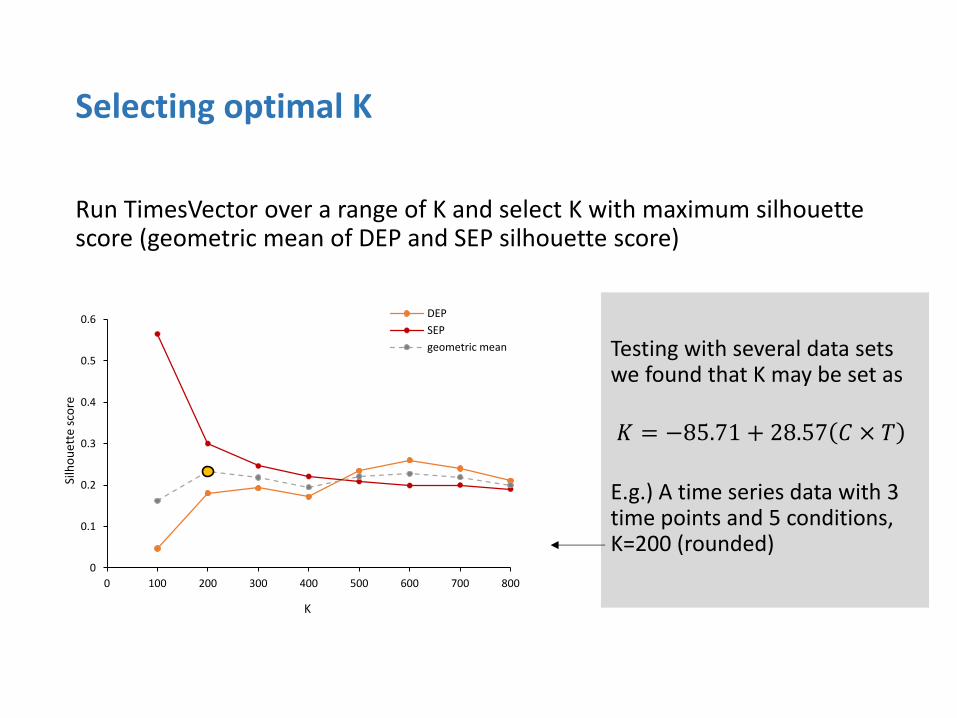
Run TimesVector over a range of K and select K with maximum silhouette score (geometric mean of DEP and SEP silhouette score)
Selecting optimal K
0
0.1
0.2
0.3
0.4
0.5
0.6
0 100 200 300 400 500 600 700 800
Silh
ou
ette
sco
re
K
DEP
SEP
geometric mean
Testing with several data sets we found that K may be set as
E.g.) A time series data with 3 time points and 5 conditions, K=200 (rounded)
𝐾 = −85.71 + 28.57 𝐶 × 𝑇

Compare the clustering results of TimesVector with TriCluster and OPTricluster in terms of weighted silhouette score and within cluster cosine distance
Comparing clustering performance
0
0.05
0.1
0.15
0.2
0.25
0.3
DEP SEP DEP SEP DEP SEP DEP SEP
Mouse Rice_hormone Rice Yeast
Wit
hin
clu
ster
co
sin
e d
ista
nce
TimesVectorOptriclusterTricluster
X 0
2
4
6
8
10
12
14
DEP SEP DEP SEP DEP SEP DEP SEP
Mouse Rice_hormone Rice Yeast
Wei
ghte
d s
ilho
uet
te s
core
TimesVectorOptriclusterTricluster
X
Testing how well clusters are separated Testing tightness of cluster
• Lab members
• Sun Kim (Advisor)
• Kyori Jo
• Hyejin Kang
• Hongryul Ahn
• Youngjae Yu
• Funding
• Cooperative Research Program for Agriculture Science & Technology Development (Project No. PJ01121102) Rural Development Administration
• Bio & Medical Technology Development Program of the National Research Foundation (NRF) funded by the Ministry of Science, ICT & Future Planning (2012M3A9D1054622)
• Korea Health Technology R&D Project through the Korea Health Industry Development Institute (KHIDI), funded by the Ministry of Health & Welfare, Republic of Korea (HI15C3224 )
Acknowledgement
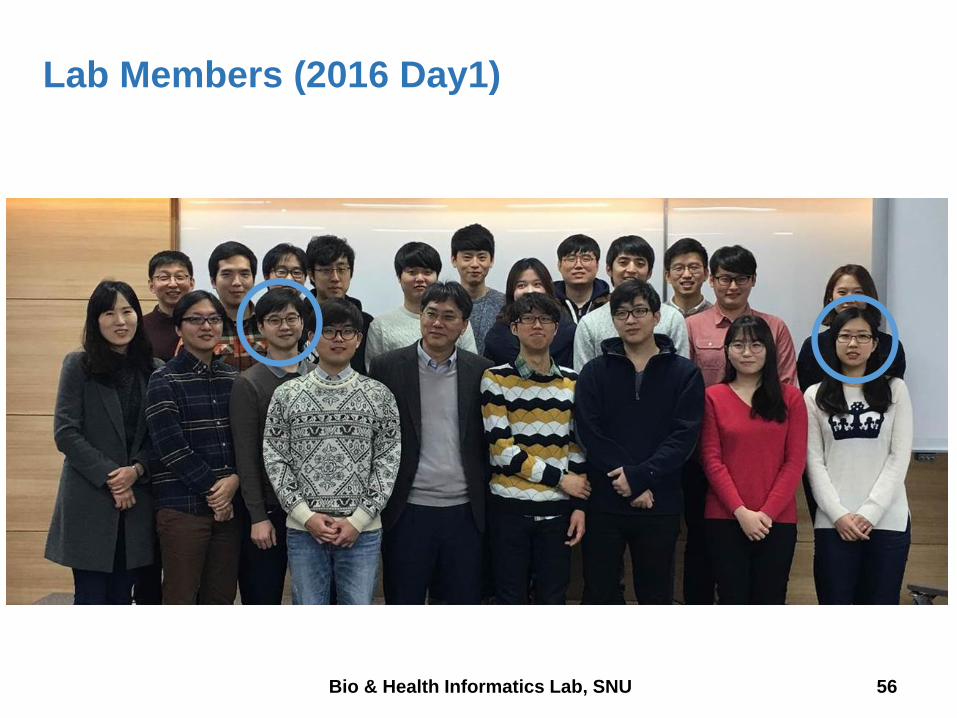
Lab Members (2016 Day1)
56 Bio & Health Informatics Lab, SNU

감사합니다.
Thank you!