Embed Size (px)
Citation preview

The analysis of salt resistant surfactants used in enhanced oil recovery.
BENOMAR, Salim Hmda.
Available from Sheffield Hallam University Research Archive (SHURA) at:
http://shura.shu.ac.uk/19338/
This document is the author deposited version. You are advised to consult the publisher's version if you wish to cite from it.
Published version
BENOMAR, Salim Hmda. (2001). The analysis of salt resistant surfactants used in enhanced oil recovery. Doctoral, Sheffield Hallam University (United Kingdom)..
Copyright and re-use policy
See http://shura.shu.ac.uk/information.html
Sheffield Hallam University Research Archivehttp://shura.shu.ac.uk

REFERENCE
ProQuest Number: 10694219
All rights reserved
INFORMATION TO ALL USERS The quality of this reproduction is dependent upon the quality of the copy submitted.
In the unlikely event that the author did not send a com ple te manuscript and there are missing pages, these will be noted. Also, if material had to be removed,
a note will indicate the deletion.
uestProQuest 10694219
Published by ProQuest LLC(2017). Copyright of the Dissertation is held by the Author.
All rights reserved.This work is protected against unauthorized copying under Title 17, United States C ode
Microform Edition © ProQuest LLC.
ProQuest LLC.789 East Eisenhower Parkway
P.O. Box 1346 Ann Arbor, Ml 48106- 1346

The Analysis of Salt Resistant Surfactants Used in Enhanced Oil
Recovery
Salim Hmada A, Benomar
A thesis submitted in partial fulfilment of the Requirements ofSheffield Hallam University
for the degree of Doctor of Philosophy
June 2001

:\D HALLAM UA//J

Abstract.
Commercial nonylphenol ethoxysulphonate (NPEOS), octylphenol ethoxysulphonate
(OPEOS) surfactant formulations and mixtures of alkyl aryl sulphonate and NPEOS
surfactant formulations, are used for enhanced oil recovery (EOR). The surfactants have
been analysed by liquid chromatography (LC), liquid chromatography-mass spectrometry
(LC-MS) and matrix assisted laser desorption ionization mass spectrometry. Mixed
mode Cl 8/SAX and C8/SAX columns were used for both liquid chromatography and
liquid chromatography-mass spectrometry analyses of NPEOS and OPEOS. NPEOS and
alkyl aryl sulphonate surfactant mixtures were separated using a mixed-mode C4/SAX
column.. Matrix assisted laser desorption ionization mass spectrometry (MALDI-MS)
spectra were obtained using either alpha-cyano-4-hydroxycinnamic acid or 2,5-
dihydroxybenzoic acid as matrix with the addition of lithium chloride to simplify the
mass spectra obtained. Data obtained from each method indicate that the NPEOS
formulation has an ethoxymer chain length ranging from 2-13 units with average of 6.26.
This is in broad agreement with earlier studies, although the range was reported as 2-15.
However, the data obtained suggest that the OPEOS formulation has an ethoxymer chain
length ranging from 1-8 ethoxymer units with an average chain length of 3.67. This is in
contrast to earlier studies carried out by LC only, which suggested that the chain length
ranged from 2 to 6 ethoxymer units with an average of 3.6. A method for the extraction
of NPEOS and OPEOS from sea-water and reagent water, and alkyl aryl sulphonate from
sea-water only, using graphitised carbon black (GCB) solid phase extraction (SPE)
cartridges has also been developed.
In the last section of this thesis the chemical oxidation of NPEOS used Fenton’s reagent
and biological oxidation of NPEOS using a microorganism (Paracoccus
halodenitrificans) is reported. The intermediate products formed in the chemical
oxidation have been identified and characterized by LC, LC-ES-MS and MALDI/MS
techniques. The major products formed are dicarboxylic acids and single carboxylic
acids. The aerobic biodegradation of NPEOS was carried out over five days. The

oxygen uptake was measured each day. The biodegradation intermediate products were
analysed by LC and data indicate that the same products were formed as those from the
chemical oxidation of NPEOS.

In the Name o f God’ Most Merciful, M art Compassionate
The author wishes to express his sincere gratitude to Dr. Malcolm Clench for his
supervision, constant advice, encouragement and support throughout this project. A
special thanks go to Professor David Allen for his scientific advice and encouragement. I
would also like to thank the technical staff within the Divisions of Chemistry and
Biomedical Science at Sheffield Hallam University. A special thank you to Matthew,
Maria, Peter, Edward, Marinela, Anna and Michael for their friendship and valuable
support.
I would like also to gratefully acknowledge to the Libyan Petroleum Research Centre
(PRC) for offering the sponsorship which has made this work possible.
My gratitude also goes out to my family and my friends. Special thanks go to my parents
who have supported me, with words of encouragement, throughout my education and I
would not have made it this far without them.

To : my parents,
my wife,
my daughters Noha , Nihad and
my son Mohammed.

Table o f Contents
C hapter One: Enhanced Oil Recovery............................................................ 1
1.0 Petroleum History............................................................................................................ 2
1.1 Oil Recovery...................................................................................................................... 8
1.1.1 Primary Oil Recovery.......................................................................................... 8
1.1.2 Secondary Oil Recovery.......................................................................................9
1.1.3 Tertiary Oil Recovery.........................................................................................10
1.2 Enhanced Oil Recovery.................................................................................................. 11
1.2.1 Enhanced Oil Recovery Methods.......................................................................12
1.3 Surfactants in Enhanced Oil Recovery.......................................................................... 19
References............................................................................................................................... 29
C hapter Two: Surfactants and Methods for Their Analysis................................... 36.
2.0 Chemical Structures of Surfactants................................................................................ 37
Introduction.....................................................................................................................37
2.1 Types of surfactant...........................................................................................................40
2.1.1 Anionic Surfactants.............................................................................................42
2.1.1.1 Carboxylates.........................................................................................42
2.1.1.2 Sulphonates...........................................................................................43
2.1.1.3 Sulphates...............................................................................................46
2.1.2 Non-ionic Surfactants......................................................................................... 47

2.1.2.1 Polyoxyethylene Alcohols and Polyoxylethylene
Esters of Fatty acids...............................................................................48
2.1.2.2 Alcohol Ethoxylates...............................................................................49
2.1.2.3 Alkylphenol ethoxylates........................................................................49
2.1.3 Cationic Surfactants........................................................................................51
2.1.4 Amphoteric Surfactants.................................................................................. 51
2.2 Introduction-The Analysis of Surfactants.....................................................................53
2.2.1 Non-Specific Methods................................................................................... 54
2.2.1.1 Anionic Surfactants.......................................................................... 55
2.2.1.2 Non-ionic Surfactants......................................................................56
2.2.1.2.1 Cobaltothiocyanate Active Substances..............................57
2.2.1.2.2 Potassium Picrate Active Substances.................................58
2.2.1.2.3 Bismuth Active Substances.................................................58
2.2.2 Specific Analytical Methods....................................................................59
2.2.2.1 Gas Chromatography..................................................................59
2.2.2.1.1 Anionic Surfactants...................................................... 59
2.2.2.1.2 Non-ionic Surfactants..................................................63
2.2.22 High Performance Liquid Chromatography..............................67
2.2.2.2.1 Anionic Surfactants......................................................... 67
2.2.2.2.2 Non-ionic surfactants...................................................... 69
22.2.2.3 Simultaneous Determination of Anionic
and Non-ionic Surfactants...........................................72

2.2.2.3 Capillary Electrophoresis............................................................................74
2.2.2.4 Liquid Chromatography-Mass Spectrometry...........................77
2.2.2.5 Other Mass Spectrometry Techniques..................................... 81
References............................................................................................................................... 90
C hapter Three: Determination of Alkylphenol Ethoxysulphonates and Related
Surfactant Mixtures in Reagent Water and Sea-water by
Solid Phase Extraction and HPLC................................................100
3.0 Introduction...................................................................................................................101
3.1 Experimental..................................................................................................................105
3.1.1 Reagents and Materials.......................................................................................105
3.1.2 Sample Pretreatment......................................................................................... 105
3.1.3 Sample Preparation............................................................................................106
3.1.4 Solid Phase Extraction Methodology............................................................... 106
3.1.5 HPLC instrumentation and conditions............................................................. 107
3.2 Results and Discussion................................................................................................. 109
3.2.1 Alkylphenol ethoxylate sulphonates................................................................109
3.2.2 Mixtures of ethoxylated and non-ethoxylated surfactants............................. 118
3.3 Conclusion.....................................................................................................................123
References............................................................................................................................. 125
Chapter Four : A comparison of LC-MS and MALDI/MS Methods for
Analysis of NPEOS and OPEOS Surfactant Formulations............ 127
4.0 Introduction..................................................................................................................128

4.1 Experimental..................................................................................................................132
4.1.1 Reagents and Materials....................................................................................132
4.1.2 Sample Pretreatment........................................................................................ 132
4.1.3 HPLC Instrumentation and conditions...........................................................133
4.1.4 Liquid Chromatography-Mass Spectrometry................................................ 133
4.1.5 MALDI-MS......................................................................................................133
4.2 Results and Discussion................................................................................................. 134
4.3 Conclusion....................................................................................................................147
References............................................................................................................................. 148
Chapter Five : A study of the Degradation of Nonylphenol Ethoxysulphonate
Surfactants by Chemical and Biological Oxidation...........................150
5.1 Chemical Oxidation of Nonylphenol Ethoxysulphonates (NPEOS)Surfactants 151
Introduction........................................................................................................................... 151
5.1.1 Experimental..................................................................................................... 156
5.1.1.1 Reagents and Materials........................................................................156
5.1.1.2 Sample Pretreatment........................................................................... 156
5.1.1.3 HPLC instrumentation and conditions...............................................157
5.1.1.4 Liquid Chromatography-Mass Spectrometry................................... 157
5.1.1.5 MALDI-MS.........................................................................................158
5.1.1.6 Reaction conditions............................................................................. 158
5.1.1.7 Sample Preparation............................................................................. 159
5.1.2 Results and Discussion............................................................................. 160
5.2..Biological Oxidation of Nonylphenol Ethoxysulphonate
(NPEOS) Surfactants.................................................................................................... 169
Introduction.......................................................................................................................... 169
5.2.1 Biodegradation of Non-ionic Surfactants...................................................... 174
5.2.1.1 Environmental Effects................................................................................ 175
5.2.1.2 Metabolites of APEO in the Marine Environment................................... 179
5.2.1.3 Toxicity........................................................................................................ 181
5.2.1.4 Oestrogenic Properties of Alkylphenol Ethoxylate.................................. 182
5.2.2 Biodegradation of Anionic Surfactants.......................................................... 183
5.2.2.1 Environmental Effects/ Toxicity.................................................................185
5.2.2.2 Biodegradation of NPEOS in Sea-water.................................................... 188
5.2.3 Experimental.................................................................................................... 189
5.2.3.1 Reagents and Materials............................................................................... 189
5.2.3.2 Culture conditions for Paracoccus halodenitrificans
and Bacterium T-52..................................................................................... 189
5.2.3.2.1 Paracoccus halodenitrificans.......................................................... 189
5.2.3.2.2 Bacterium T-52..................................................................................190
5.2.3.3 Sample Pretreatment....................................................................................190
5.2.3.4 HPLC instrumentation and conditions....................................................... 191
5.2.3.5 Biodegradation of NPEOS using Paracoccus species.............................. 191
5.2.3.6 Biodegradation of NPEOS using Bacterium T-52 species.......................192
5.2.3.7 Sample Preparation......................................................................................192
5.2.3.8 Method for the Determination of Dissolved Oxygen (DO)......................192
v

5.2.4 Results and Discussion................................................................................... 194
Conclusion....................................................................................................................198
References ..........................................................................................................200
Chapter Six: General Conclusions and Future Work............................................... 205
6.0 Conclusion................................................................................................................... 206
6.1 Future Work....................................................................................................209
\i
Glossary of terms used in this thesis
ABS = alkylbenzene sulphonates.
ACN = acetonitrile.
AE = alcohol ethoxylate.
APCI = atmospheric pressure chemical ionisation.
APEC = alkylphenol carboxylic acid.
APEO = alkylphenol ethoxylate.
APEOS = alkylphenol ethoxylatesulphonate.
API = atmospheric pressure ionisation.
BiAS = bismuth active substance.
BOD = biochemical oxygen demand.
Cig = octadecyl silyl- a stationary phase used in HPLC columns.
CO2 = carbon dioxide.
Cl = chemical ionisation.
CMC = critical micelle concentration.
CTAS = Cobalto Thiocyantate Active Substance.
ECI = electron capture detector.
El = electron impact ionisation.
EM = emission wavelength.
EOR = enhanced oil recovery.
EX = excitation wavelength.
FAB = fast atom bombardment.

GC = gas chromatography.
GC/MS = gas chromatography/ mass spectrometry.
GCB = graphitised carbon black.
HFBA = heptafluorobutyric anhydride.
HPLC = high performance liquid chromatography.
IFT = interfacial tension.
LAEC = linear alkylphenoxy carboxylic acid.
LAS = linear alkylbenzene sulphonates.
LC/MS = liquid chromatography/ mass spectrometry.
LC50 = the “Lethal Concentration” of a substance at which 50% of species die.
LD50 = lethal dose.
m/z = mass to charge ratio.
MBAS = Methylene Blue Active Substance.
MS = mass spectrometry.
MTBE = methyl-tertiary-butyl ether.
NCI = negative chemical inoisation.
NOEC = no observed effect concentration.
NP = nonylphenol.
NPEC = nonylphenol carboxylic acid.
NPEO = nonylphenol polyethoxylate.
ODE = oil displacement efficiency.
OECD = organisation for economic cooperation and development.
OPEO = octylphenol ethoxylate.

PB = Particle Beam interface.
PFBCI = pentafluorobenzyl chloride,
ppb = parts-per-billion.
PPAS = potassium picrate Active Substance,
ppm = parts-per-million.
RMM = relative molecular mass.
RSD = relative standard deviation.
SAX = strong anion exchange.
SDS = sodium dodecyl sulphate.
SPC = sulphophenyl carbxylate.
SPE = solid phase extraction.
STPs = sewage treatment plants.
TIC = total ion chromatography.
TMS = trimethyl sily-a stationary phase for HPLC.
TSP = thermospray interface.
UV = ultra-violet light.
VSD = volumetric-sweep efficiency.

CHAPTER ONE
Enhanced Oil Recovery

1.0 Petroleum History
All over the world, at various depths beneath land and sea, there are accumulations of
crude oil formed long ago by the decomposition of animal and vegetable remains. Crude
oil is an extremely complex and variable mixture of compounds containing thousands or
tens of thousands of different chemical species. Many are hydrocarbons varying from
simple aliphatics and aromatics to complex, multi-ring structures of high molecular weight.
However, within crude oil these are also compounds which contain sulphur, nitrogen,
oxygen and other elements. The proportion of these many components varies widely in
different deposits: generally, the higher the content of short chain compounds the lighter
and more mobile the crude. Viscous heavy oils, and even more so bitumens, are deficient
in the light fractions, possibly reflecting the extent of in-situ maturation or the result of
their loss over geological time by evaporation or microbial action. Some components of
crude oil are known to be susceptible to microbiological attack: they tend to be the lower
molecular weight materials and an attack on pure hydrocarbon always seems to require the
involvement of molecular oxygen. A few bacterial species may be capable of anaerobic
metabolism on compounds containing elements additional to carbon and hydrogen but not,
it seems, on pure hydrocarbons. Viscosity is of course, highly dependent on temperature
so that the effective mobility of the crude oil in the reservoir is the result both of its
composition and of the local temperature. The physical properties of the oil in any
particular location thus reflect its history as well as its environment.
2

In its widest sense, the term “petroleum” embraces all hydrocarbons occurring naturally in
the earth. However, in its narrower, commercial sense, “petroleum” is usually restricted
to the liquid deposit i.e. crude oil, gaseous products being termed “natural gas” and the
solid ones “bitumen” “asphalt” or “wax” according to their composition. Another type of
deposit “oil sands” is unconsolidated sandstone deposit containing very heavy crude oil
termed bitumen. Bitumen is chemically similar to conventional crude oil but has a greater
density and a much greater viscosity.
Accumulations of crude oil are found throughout the world in the interstices of porous
sandstone and within fine fractures and pores of limestone and chalk (Figure 1.1).
Reservoirs occur at all depths, from the surface to the limit of contemporary drilling
technology at several kilometers and presumably beyond: the environmental conditions
within each reservoir will naturally reflect its location. Temperature is directly related to
depth although the thermal gradient does vary in different regions. Before the extraction ofj
oil begins, reservoirs are commonly under considerable pressure, largely from dissolved
gas but often with a contribution from an underlying aquifer which communicates
ultimately with surface water and is thus subject to a hydrostatic head of pressure
corresponding to depth.
t .
Most crude oils, in fact, contain gaseous and solid hydrocarbon in solution. The gases
come either out of solution on the release of pressure as the crude oil is produced or
during the first stage of refining. This contributes to total natural gas production. Some
of the solids are recovered during refining as bitumen and wax, some stay in solution in the
3

liquid oil products. Natural gas is also found associated with crude oil as a gas cap above
the oil or on its own, unassociated with oil.
Production
Figure 1.1 Water-driver reservoir
Crude oil and natural gas are the raw materials of the petroleum industry. It is the
business of the industry to find them, to win them from the ground, to manufacture
technically useful products from them and to sell the products in the markets of the world.
The origins of the modem petroleum industry lie in the rapid growth in the demand for
artificial light that occurred early in the nineteenth century. Buildings were more spacious
and were used more for leisure activities. Factories with their new expensive machinery
had to work night shifts. Railroads and steamboats needed light to run after dark. An

important part of the rapidly increasing demand for light was supplied by gas made from
coal. The fact that a combustible gas can be produced by heating coal was known as early
as 1700, but the first practical use of coal gas was by William Murdoch in Birmingham,
England, about 1800. In 1816 the use of coal gas was common in London and by 1825 it
was used for lighting streets in most of the large cities of the U.S. However, it had been
noticed early that the manufacture of gas from coal resulted in the formation of some
condensable liquids, which were oily and could be used for illumination. The first practical
manufacture of illuminating oil from mineral source was by James Young of Manchester
who patented his process in England in 1850. Elis process was originally the fractional
distillation of petroleum, although he later made oil from a type of oil shale.
However, the modern era of oil production is generally considered to have begun on
Aug. 27,1859 in Titusville (Pennsylvania) when Edwin L. Drake discovered crude oil and
drilled the first well to be sunk specifically for oil. He struck oil at 69.50 ft and production
(1.6mVd) began. Within the year, a further 175 oil-wells had been drilled in Pennsylvania,
and within two years other wells were drilled that produced thousands of barrels per day
[1] The search for petroleum spread rapidly to other parts of North America. Although
this is generally taken as the start of the modern petroleum industry, small quantities of oil
were being produced in Russia by 1856 and in Romania by 1857. Developments followed
in other countries and by the year 1900, the world annual output of the crude oil was 141x
106 barrels, from 11 countries [2], and production was averaging just over 40, 000 barrels
a day (as shown in Table 1.1).
5

Country Barrels/day
Russia 206310
USA 173830
East indies 9090
Poland 6410
Romania 4920
India and Burma 2950
Japan 2380
Canada 1940
Germany 980
Peru 830
Italy 30
Total 409670
Table 1.1 World production of petroleum in 1900 [2].
By 1920, in spite of the devastation caused by World War I, world output had increased to
695xl06 barrels. By 1946, just after the end of World War II, world output had increased
to 2,750xl06 barrels. In the years that have elapsed since then, the output of crude oil has
continued to increase at an average annual rate of growth of more then 7%, equivalent to
the doubling of production every ten years. By 1973, commercial oil production was
being obtained from 62 countries and totaled 19.9x10⁹ barrels, roughly 140 times the
output in 1900. However, it is interesting to note that, since man-made frontiers have
little relationship to the geological factors which control the size and productivity of
individual oil-fields, 85% of the total output comes from only 12 countries [2]. World
production capacity by region and country in 1999 was as shown in Table 1.2.
6

Country MM Brl % of total
Indonesia 1,207.1 1.9
United Arab Emirates 2,048.8 3.2
Saudi Arabia 7,564.7 11.8
Iran 3,439.0 5.4
Venezuela 2,800.4 4.4
Kuwait 1,872.7 2.9
Libya 1,287.2 2.0
Nigeria 1,939.8 3.0
Qatar 608.5 0.9
Iraq 2,719.8 4.3
Algeria 749.6 1.2
OPEC 26,237.7 41.0
North America 7,268.6 11.4
Latin America 9,213.0 14.4
Eastern Europe 7,606.1 11.9
Western Europe 6,141.2 9.6
Middle East 20,289.0 31.7
Africa 6,517.9 10.2
Asia and Far east 6,286.0 9.8
Oceania 634.9 0.9
World Total 63,956.8 100
Table 1.2 Principal Oil-Producing Countries and Regions, 1999 [3].
7

1.1. Oil Recovery
Oil recovery, traditionally, has been subdivided into three stages (Figurel.2): primary,
secondary, and tertiary. These stages describe the production from a reservoir in a
chronological sense.
Recovery Mechanism
Primary Recovery
Artifical Lift pump, g a s lift e tc .
SecondaryRecovery
Natural Flow
ThermalSteam, in situ combustion
ChemicalPolymer, Micellar polymer
Alkaline
GasHydrocarbon gas, miscible,
immiscible CQ2, N2, Flue gas
OthersFoam Mining Microbal
Conformance adjustment
PressureMaintenance
w ater, g a s reinjection
TertiaryRecovery
Waterflood
Figure 1.2. Recovery Mechanism
1.1.1 Primary Oil Recovery
Oil is produced using the natural reservoir energy to drive the oil through the complex
pore network to the producing well by three main mechanisms
• Expansion of the oil, gas (if present), connate water and the compaction of rock as the
pressure falls.
8

• As the reservoir pressure falls to below the bubble point during production, some of
the more volatile components are released and come out of solution as small gas
bubbles. The bubbles are initially trapped in the pores and displace oil as they expand
(solution gas drive). As the pressure falls further the individual bubble increase in size,
join together and the gas can begin to flow. Depending on the vertical permeability
some of the gas may segregate to the gas cap at the top of the reservoir, or if no gas
cap is present, it forms a secondary gas cap. This gas cap can expand, and in doing so
displace more oil (gas cap drive).
• If the oil reservoir is part of a much larger aquifer system, substantial quantities of
water may flow into the oil zone, so displacing oil
The pressure is usually high enough initially to lift the oil up the producing wells to the
surface, but as oil is produced, the reservoir pressure declines and the rate of oil
production falls. Production can be maintained for a time by these primary mechanisms by
pumping the production wells, but the recovery factor is small unless there is good aquifer
drive, and most of the oil remains in the reservoir.
1.1.2. Secondary Oil Recovery
When the natural pressure decreases, energy must be supplied to the reservoir in order to
recover some of this residual oil. This extra energy can be introduced by injection of
water or gas or by supplying heat. This stage of production is termed secondary oil
recovery, or more specifically water flooding, gas injection or thermal methods. Thermal
9

methods would be in the context of secondary recovery for viscous heavy oils since
increasing the oil’s temperature lowers its viscosity.
Powered water flooding is very common nowadays. For example, the majority of North
Sea fields have such facilities on their platforms, and also around 50% of the current US
annual production is aided by water flooding. It moves oil to the production wells by
keeping the reservoir pressure usually to about that of bubble point. This ensures that no
gas blocks the pores. Also at the bubble point, the hydrocarbon thermodynamics dictate
that the oil will have its lowest viscosity and largest formation volume factor, so that the
most oil will be displaced under the smallest pressure gradients
1.1.3. Tertiary Oil Recovery
Primary and secondary crude oil recovery processes frequently leave substantial quantities
remaining in place in the reservoir. Estimates range from 50-70% [4] of the original
reservoirs. During secondary recovery, continuous water injection results in ever
increasing production of water and eventually only injected water is produced, leaving
behind “residual oil”. The oil remaining after water flooding is retained in the pore space
of reservoir rock at lower concentration than original and exists as ganglia trapped in
individual pore clusters. It may also remain as films partly coating the pore walls or as a
continuous phase in the pores which were not invaded during water flooding. Capillary
and viscous forces are mainly responsible for the retention of residual oil. Capillary forces
dominate in water-wet reservoirs. The residual oil becomes discontinuous and forms
ganglia because of high interfacial tension between oil and water. Since the oil droplet
diameter is larger than the pore throat, oil does not move towards the producing well.
10

Viscous forces may prevent oil movement and injection fluid with low viscosity overtakes.
The relation between capillary and viscous forces is given by capillary number which
varies directly as the viscosity of the injected fluid and inversely as the interfacial tension
between the injected fluid and the reservoir fluid.
The extent of oil recovery by injection fluid is also dependent upon (a) the fraction of oil in
the reservoir that is contacted by the fluid, called volumetric-sweep efficiency (VSE), (b)
the fraction of oil that is displaced from pores invaded by the fluid, called oil displacement
efficiency (ODE). Total oil recovery efficiency is controlled by the product VSE x ODE.
1.2. Enhanced Oil Recovery
Enhanced oil recovery (EOR) refers to any method used to recover more oil from a
reservoir than would be produced by primary recovery [5], The development of enhanced
oil recovery (EOR) processes has been ongoing since the end of world war II, when
operators who owned reservoirs with declining reserves recognized that significant
quantities of oil remained in their reservoirs after primary and secondary recovery (primary
water flooding). Research and field activity increased as production from major reservoirs
declined, worldwide consumption of oil increased, and discoveries of major new reservoirs
became infrequent. Intense interest in EOR processes was stimulated in response to the
oil embargo of 1973 and the following energy “crisis”. The collapse of oil prices in 1981
has resulted in significant rapid changes in EOR field technology, development and field
testing.
11

Worldwide production from EOR projects at the start of 1994 remained about 1.9 million
barrels per day (1.9xl06 brl/d) or about the same as at the beginning of 1992. The 1.6x10⁶
brl/d represents about 3.2% of the worlds oil production. In 1994, US, EOR production
of 709,000bbl/d represented about 10% of the total production [6],
1.2.1 Enhanced Oil Recovery (EOR) Methods
The intent of enhanced oil recovery methods [7] is to>
• Improve sweep efficiency by reducing the mobility ratio between injected and in-place
fluid.
• Eliminate or reduce the capillary and interfacial forces and thus improve displacement
efficiency.
• Act on both phenomena simultaneously.
Overall, these three effects lead to an increase in the efficiency of oil recovery.
Oil recovery mechanisms are dependent on two principles: increasing volumetric sweep
efficiency of the injected fluid and increasing oil displacement efficiency by injected fluid.
In both, chemicals are used to modify the properties of an injected fluid whether water,
steam, a miscible gas such as C 02 or natural gas, or an immiscible gas, usually nitrogen.
Poor reservoir volumetric sweep efficiency is the greatest obstacle to increasing oil
recovery [8],
Wettability is defined as the tendency of one fluid to spread on or adhere to a solid surface
(rock) in the presence of another immiscible fluid [9], As many as 50% of all sandstone
reservoirs and 80% of all carbonate reservoirs are oil-wet [10]. Strongly water-wet
12

reservoirs are quite rare [11]. Rock wettability can affect fluid injection rates, flow
patterns of fluid within the reservoir, and oil displacement efficiency [11]. Rock
wettability can strongly affect its relative permeability to water and oil [9,12], When a
rock is water-wet, water occupies most of the small flow channels and is in contact with
most of the rock surfaces as a film. Crude oil does the same in oil-wet rock wettability,
hence adsorption of polar material, such as surfactants and corrosion inhibitors, or
adsorption of polar oil crude oil components [13], can strongly alter the behavior of the
rock [1 2 ].
When water is injected into a water-wet reservoir, oil is displaced ahead of the injected
fluid. Injection water preferentially invades the small-and medium-sized flow channels or
pores. As the water front passes, uncovered oil is left in the form of spherical,
unconnected droplets in the center of pores or globules of oil extending through
interconnected rock pores. In both cases, the oil is completely surrounded by water and is
immobile. There is little oil production after injection water breakthrough at the
production well [9], In an oil-wet rock, water resides in the larger pores, oil exists in the
smaller pores or as a film on flow channel surface. Injected water preferentially flows
through the large pores and only slowly invades the smaller flow channels, resulting in a
higher produced water/oil ratio and a lower oil production rate than in the water-wet case.
Chemical methods of enhanced oil recovery are characterized by the addition of chemicals
to water in order to generate fluid properties or interfacial conditions that are more
favorable for oil displacement. Polymer flooding, using polyacrylamides or
13

polysaccarides, is conceptually simple and inexpensive, and its commercial use is
increasing despite the fact that it raises potential production by only small amounts.
Surfactant flooding is complex, requiring detailed laboratory testing to support field
project design. Addition of surfactants to the injection water [14,15] can displace the oil
remaining near the well (Figure 1.3). The concentration of surfactant in the injection
water is relatively high (1-3%). However, the total amount of surfactant used is not great
because it is necessary only to displace the oil from a 2-3 m radius around the injection
well. It is also expensive and is used in few large-scale projects. Alkaline flooding has
been used only in those reservoirs containing specific types of high-acid-number crude
oils.
Production well 1
Injectionpump
Injectioni well -
Figure 1.3. Surfactant process
14

Miscible methods have the greatest potential for enhanced oil recovery of low-viscosity
oils. Among these methods, injecting gases miscible with reservoir crude oil can result in
low interfacial tension promoting a high oil displacement efficiency [16]. The process of
miscible gas flooding using carbon dioxide is depicted in Figure 1.4. Other suitable gases
include natural gas and flue gas. Carbon dioxide is of most interest in the United States;
hydrocarbon miscible projects represent 80% of Canadian EOR production [5],
Supercritical CO2 [16] and various hydrocarbon injectants [16,17] undergo physical
interactions with crude oil that result in stripping out of the low molecular weight
components, which increases oil production. The rapid or gradual development of
miscibility with remaining crude oil constituents results in oil mobilization. Either partial
or complete miscibility with the oil may be developed, depending on the nature of the
injectant, crude oil properties, and reservoir conditions, particularly temperature.
However, interaction of the injectant with the crude oil can alter rock wettability and thus
reduce injection rates and decrease oil recovery.
15

Water injection pump
Produced fluids (oil, gas and water) separation and storage facilities
P rod u ction w ell
C arb on d io x id e
Injection w e
Figure 1.4. Carbon dioxide miscible process
Another method of using CO2 is called cyclic CO2 stimulation or “huff n’ puff’ [18]. A
limited amount of CO2 is injected into a reservoir over hours or days. The well is then
shut in for a soak period of day to weeks to allow the CO2 to interact with the crude oil,
swelling the oil and reducing its viscosity. The well is then opened, the CO2 provides a
solution gas drive, and oil mobilization by the CO2 soak is produced. Nonmiscible gases
such as nitrogen have also been used as EOR injection fluids.
Thermal methods provide a driving force and add heat to the reservoir to reduce oil
viscosity and / or vaporize the oil. This makes the oil more mobile, so that it can be more
16
efficiently driven to producing wells. In heavy oil fields, water flooding is often omitted
and steam injection is begun immediately after primary production (Figure 1.5). Steam
injection temperatures of typically 175-230 °C have been used in California oil fields since
the early 1960s, whilst injection temperature can reach 300 °C in Canadian and
Venezuelan EOR projects. The performance of steam injection EOR can be estimated
with less uncertainty than other methods. In-situ combustion is normally applied to
reservoirs containing low-gravity oil, but has been field tested under a wide variety of
reservoir conditions. Only a few projects have proven economical enough to advance to a
commercial scale. To date, in situ, combustion has been most effective for the recovery of
viscous oils in moderately thick reservoirs. The basic principles of the most promising
EOR methods used are given in Table 1.3.
17

ProductionW ell
Production fluids (oil, g a s an d w ater) S ep aration and S to ra g e FacilitiesS tack G a s
Scrubber
S tea m G enerator
In jec tio lW e ll1
Figure 1.5. Steam flooding process
Method Used Basic Principle
Chemical methods Polymer-augmented water flooding,
surfactant flooding; alkaline
flooding; immiscible C 02
displacement
Improvement of sweep efficiency,
improvement of displacement.
Miscible methods Miscible fluid displacement using
C02, nitrogen, alcohol, LPG or rich
gas dry gas.
Improvement of displacement
efficiency.
Thermal methods Cyclic steam injection; steam drive,
in situ combustion.
Improvement of both sweep
efficiency and displacement
efficiency.
Table 1.3. Methods of enhanced Oil Recovery [7].
18

Other technologies for EOR also exist. Microbial-enhanced oil recovery (MEOR) involves
injection of carefully chosen microbes. Subsequent injection nutrient is sometimes
employed to promote bacterial growth. The main nutrient source for the microbes is often
the crude oil in the reservoir. A rapidly growing microbe population can reduce the
permeability of thief zones improving volumetric efficiency. Microbes, particularly species
of Clostridium and Bacillus, have also been used to produce surfactant, alcohol, solvents,
and gas in situ [19]. These chemicals improve water flooding oil displacement efficiency.
Microbes adsorb and grow on reservoir rock surfaces fed injected nutrient [20] and may
have application in plugging thief zones near injection well-bores. Controlling the rate and
location of bacterial growth and chemical production can be difficult. Bacterial growth
near well-bores has been a common problem causing reduced injection rates and
productivity.
1.1 Surfactants in Enhanced Oil Recovery
Our dependence on oil has increased tremendously. Oil has no longer remained a dirty
business but has become a business of billion of dollars. New fields are being explored and
technologies are being developed to exploit the areas which were earlier inaccessible. At
the same time, attempts are being made to economize the existing processes and to
recover maximal crude oil from established and producing reservoirs. Chemicals are used
in various operations of the oil industry. However, a particular class of chemical, the
surface-active agents (surfactants), has found wide ranging application in petroleum
industry. Drilling, work-over, primary, secondary and tertiary recovery and environmental
production, all use surfactants in one or other form.
19

As previously noted surfactants are used in enhanced oil recovery. In other areas of
petroleum production, they are used in;-
• Drilling fluids: emulsification of oils, to disperse solids, and to modify the rheological
properties of drilling and completion fluids.
• Mist drilling: convert intrusion water to foam in air drilling.
• Work-over of producing wells: emulsify, and disperse sediment in clean-out of well,
modify wetting of formation at producing zone.
• Producing wells: demulsify crude petroleum and inhibit corrosion of well tubing
storage tanks, and pipeline.
• Secondary recovery in flooding operation, release crude oil from the formation
surface, i.e. preferential wetting.
• Refined petroleum products-detergent, sludge dispersant, and corrosion inhibitor in
fuel oil, crankcase oil and turbine oil.
In the primary recovery stage, when crude oil is produced, it is often accompanied by gas
and water (brine). The three components i.e. gas, oil and water are separated before
despatching crude oil to refineries. The gas can form a foam with crude oil in the presence
of carboxylic acids and phenols of low molecular weight [21], This can cause loss of
valuable crude oil in gas. Defoamers are used to break foams and thus prevent loss of oil.
Lower alcohols like propanol and butanol, organic polar molecules, sorbitan monolaurate,
sorbitan trioleate, PLURONIC type non-ionic surfactants, polypropylene glycols and their
derivatives, mineral oils blended with surfactants and silicones alone or blended with
surfactants are used as defoamers [22], Callaghan et al [21], in their laboratory studies,
20

observed that two defoamers, one a silicone glycol and another unsubstituted polydimethyl
siloxane worked well with aged crude oil while with fresh oil, only the silicone glycol
worked.
Water is generally produced along with crude oil in the form of a water-in-oil emulsion
and this has to be broken down for various commercial and operation reasons.
Asphaltenes, resins, wax, solid and metalloporphyrins stabilize such emulsions. Water has
been encountered with oil since the beginning of the petroleum industry and since then all
sorts of available chemicals such as soda, soap, phenols, fatty acids and their salts have
been used to demulsify crude oil emulsion.
Water flooding is by far the most economical and widely practised of secondary recovery
processes. Water injected through the injection wells supplements the depleted energy of
the reservoir and drives oil towards the production well/wells. The interfacial tension
(IFT) between crude oil and injected water is high and the viscosity of the injected water is
low. Therefore, a major portion of oil is still retained in the reservoir. Much of this
uncovered oil is in the form of discontinuous globules trapped in pore spaces. These
discrete droplets cannot deform themselves due to high interfacial tension and are unable
to pass through the pore throat. Surfactant addition to water can lower interfacial tension
between oil and water and permit droplets to deform so that they can pass through pore
channels and reach producing wells. Interfacial tension of the order of 10' 2 mN/m is
generally accepted to be desirable for good recovery by surfactant-aided water flooding.
21

Surfactant use for oil recovery was thought of even as early as 1920s when DeGroot [24]
described water-soluble surfactants such as a polycyclic sulphonic compound and wood
sulphite liquor in concentrations of 25 to 1000 ppm for use during water flooding.
Laboratory tests have indicated that dilute surfactants solutions remove more oil than
water alone [25,26], Surfactants which have been used with some success in water
flooding, either in the laboratory or in the field, include Igepal CA (as octyl phenyl ether,
non-ionic) [27], sodium sulphoresinoleate, oleoglcerol sulphates, Gardinal WA (sodium
lauryl sulphate), Igepon T (sodium N-methyl-N-oleoyl taurate, an anionic), Ninol 55 (an
amide, non-ionic), a cationic condensation product of fatty acids and ethanolamines, and
OT (dioctyl sodium sulphosuccinate, an anionic). Cox and Hancock [27] have patented a
formulation of sulphated polyoxyethylene alcohol which can be used to enhance the
efficiency of water flooding.
Amphoteric surfactants also find application in water flooding [28], For example,
Hydrocarbyl dimethyl ammonium propane sulphonate, and Hydrocarbyl dihydroxyethyl
ammonium propane sulphonate
Downs and Hoover [29] used alkoxylated substituted phenol formaldehyde resin of
relatively high molecular weight to recover additional oil during water flooding. This
surfactant acted by wettability alteration. The loss of surfactant by adsorption and by
interaction with reservoir rock had been considered a serious impediment to the process
since the beginning. The surfactants also lose their effectiveness under reservoir
22

temperatures and salinity. Anionic surfactants may be precipitated by interaction with
divalent cations such as, Ca2+, Mg2+.
In tertiary oil recovery, additives such as polymers and surfactants are also used. These
help in a number of ways: (i) by lowering the oil/water interfacial tension: (ii) by the
spontaneous emulsification of the oil; and (iii) by increasing the wettability of the oil-
bearing rock. Overall, these three effects lead to an increase in the efficiency of oil
recovery. The modification of the wetting characteristics of the oil-bearing rock by the
addition of surfactants is a major area of research into enhanced oil recovery[30].
Much of the success of surfactant flooding depends on the ability of the surfactant to
reduce oil-water interfacial tension (IFT) to very low values (10'2- 10° mN/m). Whereas
in laboratory experiments this can be accomplished quite easily with relatively small
surfactant concentrations (as low as 0 .1% by weight), in field applications, the efficiency
of the surfactant is drastically reduced by interaction with reservoir rock (adsorption) and
by interaction with reservoir fluids affecting oil-brine surfactant phase behavior[31]. The
latter effect is especially important when the brine salinity is high and, particularly, when
divalent ions (Ca2+, Mg2+) are present.
As a consequence of the above considerations, the following main properties must be
taken into account when considering a surfactant for potential application in enhanced oil
recovery:-
• Solubility in hard water
23

• Long-term chemical stability and resistance to bacterial attack.
• Sensitivity of phase behavior to the variation in salinity that may arise from
interactions with rock surface and, in particular, clay-type minerals
• Sensitivity of phase behavior to the variation in surfactant concentrations.
• Adsorption onto reservoir rock.
• Cost.
Surfactant flooding can lower interfacial tension between oil and injected fluid to 1 0 °
mN/m or even lower. Thus they increase capillary number and oil displacement efficiency.
Terms like micellar-microemulsion-detergent-surfactant-soluble oil-ultra low tension and
chemical-flooding have been used to describe enhanced oil recovery by surfactants. The
process involves injection of a micellar solution of oil, water, surfactant, co-surfactant (to
modify solvency of surfactant) and salts into the formation and it is in turn replaced by a
mobility control buffer solution, which in turn is displaced by injection water. Preflooding
may or may not be needed. Oil and water are displaced ahead of the micellar slug and a
stabilized oil and water bank develops. Micellar flooding can be low concentration or high
concentration. In low concentration surfactant flooding, low surfactant concentration
micellar solution is injected at large pore volumes (15-60%) and in high concentration
surfactant flooding, surfactant concentration is high and pore volume is low (3-20%). The
latter process is known to give better efficiency than the former.
Displacement by micellar solutions is in fact one of the most important tertiary recovery
processes. This process is known in the petroleum industry by several names. Hill et al
24

[32], Larson et al [33], Shah et al [34], and Van Poollen [35], name the process as
“surfactant flooding” . The term “micellar flooding” was used by Davis et al [36],
Gogarty et al [37-40], Farouq ali et al [41], Gupta et al [42]. Sayyouh et al [43] and
Trusenaki et al [44], Based on interfacial tension criteria, Foster [45], and Bleakly [46],
used the term “low tension water flooding”. The term “microemulsion” was introduced by
Healy et al [47-50], Holm [51] used the term ‘soluble oil flooding. Bleakly [46] and
Danielson [52] named the process “Maraflooding”. The “Maraflooding” process was first
introduced by Gogarty and Tosch [53],
Oil displacement tests in water wet Berea sandstone cores containing residual crude oil
flooded with water have shown that high tertiary recoveries can be obtained using the
sodium salts of readily available carboxylic acids. Using a 10% pore volume surfactant
slug containing 3.0% sodium isostearate and 3.0% isopentyl alcohol, followed by a
polyacrylamide mobility buffer, resulted in a 92% tertiary oil recovery, which compares
well with recoveries using petroleum sulphonates. Oil recoveries were highly dependent
on pH and added base. Aliphatic Ci8 carboxylates give higher recoveries at lower pH
using sodium bicarbonate as the added base (pH 8.5) rather than sodium hydroxide,
sodium carbonate or sodium orthiosilicate (pH 11-13). In contrast, aromatic carboxylate
e.g. sodium P(pentylnonyl) benzoate, gave higher recoveries at higher pH using sodium
carbonate rather than sodium bicarbonate. Carboxylates with branched alkyl groups, e.g.,
isostearate, gave higher tertiary oil recoveries than unbranched carboxylates, e.g., oleate
or stearate. Carboxylates were found to give good oil recoveries even when significant
amounts of calcium ion were present [54],
25

Since the 1970s, when the oil supply shortage was felt all over the world, there have been
many attempts at micellar flooding. Petroleum sulphonates, being cheap, were the first to
be used in this process [55,56]. Surfactants considered practical for EOR applications
have some water-solubility. Petroleum sulphonates are soluble because of the ionic
sulphonate group SOY Petroleum sulphonate solutions have been found to produce low
interfacial tension (IFT) under appropriate condition of surfactant and salt concentration
[57-59], However, the limitation of petroleum sulphonate is that the surfactant solutions
become unstable and phase separation occurs when salt concentration is increased beyond
2 or 2.5% NaCl [60], In general, petroleum sulphonates with high polysulphonate content
are not good EOR candidates. Also, as a rule of thumb relative to solubility, Gale and
Sandvik [61] state that petroleum sulphonates with equivalent weights above 450 are
normally oil-soluble and not water-soluble. Lower-equivalent-weight sulphonates tend to
be water-soluble. Later on, the emphasis shifted to more effective surfactants and since
then various types of anionic and non-ionic surfactants have been used to improve oil
displacement efficiency of the slug. A few such formulations are: alcohol ethoxylates,
alkylphenols [62], ethoxylated sulphates, sulphonates or carboxylates [63-65], alpha-olefin
sulphonates of general formula R-CH=CH-(CH2)n-S0 3 ‘Na+ [66,67], alpha-sulphonated
fatty acid esters [6 8 ], alkyl (or alkylaryl) ethoxylated sulphonates [69], alkylaryl alkoxy
sulphate [70], alkylaryl ether sulphates [71], carboxymethylated ethoxylates [72], and
branched carboxymethylated alcohol ethoxylates [73], ethylene oxide condensates with p-
diisobutylene phenol, p-tripropylene phenol and p-n dodecyl phenol with mean degree of
ethoxylation 3,5 and 8 [74], ethoxylated C12-15 alcohols with 75% linearity, C13-14 alcohols
with 40% linearity and degree of ethoxylation 3,5 and 8 [74], Increasing the length of an
26

ethoxy chain reduces critical micellar concentration (CMC) [75], Cosurfactant
requirement can be minimized by using a surfactant having a short-branched hydrophobe
or branched (vs linear) alkyl substituent on an aromatic group [76]. Blends of surfactants
optimized for sea-water or reservoir brine include linear alkyl xylene sulphonate/ alcohol
ether sulphate mixtures [77], Alpha-olefin sulphonates have been found to possess good
salt tolerance and chemical stability at elevated temperature, and appear to exhibit good oil
solubilization and low interfacial tension over a wide range of temperatures [78], While
being less salt tolerant, alkyl aromatic sulphonates exhibit excellent chemical stability. The
nature of the alkyl group, the aryl group and ring isomer distribution produced in the
Friedel-Crafts alkylation of the aromatic compounds can be adjusted to optimize
surfactant performance under a given set of reservoir conditions. Ethoxylated alcohols
have also been added to some anionic surfactant formulations to improve interfacial
properties [79],
Neuman et al [80] have studied the following salt tolerant surfactants and found mixtures
of then to be useful :-
1. Fatty alcohol polyethoxylated propylene sulphonates with formulae
Ci3H27/ C15H31O (CH2CH20)xCH2CH2CH2S0'3K+
i-C 13H270(CH 2CH20 )xCH2CH2CH2 s o 3k +
2. Nonylphenol polyethoxylated propylene sulphonates with formulae
C9H19-C6H40(CH2CH20)xS0 3-K+
X=2,3,4,6,9.5
3. Petroleum sulphonates with mean molar masses in the range 416-496, active
27

substance 60% weight by weight and oil content 30%.
4 Nonylphenol ethoxymethylene carboxylates with EO = 6.
5. Fatty alcohol ethoxymethylene carboxylates with EO = 6.
6. Tributylphenol ether sulphonate, EO = 8.
Schmidt et al [81] used mixture of surfactants containing (a) ether sulphonates, (b)
polyglycol ethers (c) primary or secondary C8-i2 alkane sulphonates, petroleum
sulphonates, olefin sulphonates, alkylbenzene sulphonates or a mixture of these for tertiary
recovery of petroleum. Kalpakci and Yvonne [82] used a mixture of two sulphonates
(a) C6H13C8H17CHCH2(OCH2CH2)2SO-3Na+
(b) C20H4 i(OCH2CH2)3SO-3Na+
in a range of concentrations. The method is claimed to be useful in achieving of high
temperature ( more than 120°C), high pressure, high divalent ion concentration and high
salinity. High concentrations (1-10%) of lignosulphonates have sufficient interfacial
activity to increase oil recovery from unconsolidated sands [83] and have been shown to
interact synergistically with petroleum sulphonates to produce an ultra low interfacial
tension [84], Low molecular weight ethoxylates, sulphated or sulphonated lignin phenols
have been used alone in surfactant floods [85] and were found to recover more than 75%
of the oil remaining after waterflooding. Naae and Debons [86] prepared an alkylphenol
lignin surfactant by the reaction of alkylphenol with Kraft lignin and used it for oil
recovery.
28

References
1. Dickey P. A. “The first oil well” J. Pet. Technol. (Jan., 1959) 14.
2. Hobson G. D., Tiratsoo E. N. “ Introduction to Petroleum Geology” Scientific Press
Ltd.(1975) 22.
3. OPEC Annual Statistical Bulletin 1999.
4. Clint J. H., Neustadter E. L. and Wheeler P. A.; Colloids and Surfaces, 11 (1984) 129.
5. Hayes H J “Enhanced Oil Recovery” Pet Council Washington, DC (Dec. 1976) 3.
6 . Moritis G. “Production Report” Oil & Gas J. (Sept. 26, 1994) 51.
7. Latil M., Enhanced Oil Recovery (Houston, TX: Gulf, 1980), p. 206. National
Petroleum Council, Enhanced Oil Recovery (Washington, D, C.; U.S. Department of
Energy, June 1984).
8 . Technical Constraints Limiting Application of Enhanced Oil Recovery Techniques to
Petroleum Production in the United States, U.S. Dept, of Energy, DOE/ BETC/ RI-
83/ 9 (DEB4003910), Washington, D.C., Jan 1984.
9. Craig F. F.; The reservoir Engineering Aspects of water Flooding , SPE, Monograph
No. 3, Dallas, Tex., 1971, p. 19-22.
10. Chilinger G. V., Yen T. F.; Energy Sources 7 (1983) 67.
11. Morrow N.R.; J. Pet. Technol. 42 (1990)1476.
12. Anderson W. G.; J. Pet. Technol. 39 (1987)1453.
13. Anderson W. G.; J. Pet. Technol. 38 (1986)1125.
14. U. S. Pat.4,690,217 (Sept. 1, 1987), D. L. Taggart and E. W. Heffern (to Amoco
Corp).
15. Dymond P. F.,SpurrP. R.; SPE reservoir Eng. 3 (1988)165.
29

16. Stalkup F. I., Lr., Miscible Displacement, Monograph Vol. 8 , SPE, Dallas, Tex.,
(1983) 62.
17. Johansen R. T. ; in “Improved Oil Recovery”, Interstate Oil Compact Commission,
Oklahoma City (1983) 91.
18. Bardon C., Corlay P., Longeron D. and Miller B.; SPE Reservoir. Eng. 9 (1994) 92.
19. Jenneman D. M., Knapp R. M., Mclnerney M. J., Menzie D. E. and Revus D. E.; Soc.
Pet. Eng. J. 24(1984)31.
20. Nitzman D. O., Microbial Enhancement of Oil recovery- Recent Advances, Elsevier
Science Publishing Co., Inc., New York (1991) 11.
21. Callaghan I. C., Mckechnie A. L., Ray J. E. and Wainwright J. C.; Soc. Pet. Eng. J.
(April, 1985) 171.
22. Fujimoto T. “New Introduction to Surface Active Agents” Sanyo Chemical Industries
Ltd., Kyoto, Japan, 1985.
23. Callaghan I. C., Hickman S. A., Lawrence F. T. and Melton P. M. in “Industrial
Applications of surfactants”, Special publication No. 59 ,KarasaD. R., ed., The Royal
Socity of Chemistry, Lankro Chemicals Limited, Manchester, UK. (1987) 48.
24. DeGroot M.; U. S. Patent 1,823,439, (1929).
25. Dunning H. N., Hsiao Lun and Johansen R. T., Oil & Gas J. (Aug. 16, 1954) 133 and
Pet. Eng. , (Jan., 1954) 535.
26. Breston J. N. and Johnston W. E., Paper presented at 5th Technical Conf. On Petrolum
Production. The Pennsylvania State College, (Oct., 1951) 24.
27. Cox T. and Hancock R.; U. S. Patent, 4,199,207, (1980).
28. Stournas S.; U. S. Patent, 4,216,097, (1980).
30

29. Downs H. and Hoover P.; in “ACS symposium series 396, Oil-Field Chemistry,
Enhanced Oil Recovery and Production Simulation” Borchardt, John K. and Yen T.,
ed., American Chemical Society, Washinton D. C, 1989, p.577.
30. Atia A. A. and RadwanN. R., Adsorption Sci. Technol. 15 (1997) 619.
31. HornofV.; Cellulose Chem. Technol. 24 (1190) 407.
32. Hill, H. J., Reisberg, J. and Stegemeier, G. L , J. Pet.Technol. 25 (1973) 186
33. Larson, R.G. and Hirasaki, G., Soc. Pet. Eng. J. (Feb. 1978) 42.
34.. Shah, D. O. and Schechter, R. S., “Improved Oil Recovery by Surfactant and
PolymerFlooding”, Academic Press. Inc. (1977) 115.
35.. Van Poollen, K. H., “Fundamentals of Enhanced Oil Recovery”, Penn Well Books,
(1981)20.
36.. Davis J. A., Jr. and Jones, S. C., J. Pet. Technol. (Dec. 1968) 1415.
37. Gogarty, W. B. and Tosch, W. C, J. Pet. Technol. (Dec., 1968) 1407.
38. Gogarty, W. B. Meadbon, H. P. And Milton, H. W., J. Pet. Technol., 22 (1970) 141.
39. Gogarty W. B. and Surkals, H., J. Pet. Technol., (Sept., 1972) 1161.
40. Gogarty W. B.; J. Pet. Technol. (Jan ,1976) 93.
41. .Farouq Ali, S. M. and Stahi, C. D., “Tertiary recovery of the bardford crude oil by
micellar solution from linear and two-dimensional porous meia”, paper SPE 3994
presented at the 47th Annual fall Meeting of SPE-AIME, Texas (1972).
42. Gupta, S. P. and Trushenski, S. P , Soc. Pet. Eng. J. (Feb. 1978) 5.
43. Sayyouh, M. H., Farouq Ali, S. M. and Stahi, C. D , Soc. Pet. Eng. J. (August 1981)
469 .
31

44. Trushenski, S. P., Dauben, D. L. and Parrish, D. R., Soc. Pet. Eng. J. (Dec., 1974)
633.
45. Foster, W. R„ J. Pet. Technol. 25 (1973) 205.
46. Bleakley, E. B., Oil and Gas J. (Nov. 29, 1971) 49.
47. Healy, R. N. and Reed, R.L., Soc. Pet. Eng. J. 14 (Oct., 1974) 491.
48. Healy, R. N. and Reed, R. L., and Carpenter, S., A.; Soc. Pet. Eng. J. (Feb., 1975)
87.
49. Healy, R. N. and Reed, R.L., and Stenmark, D. G.; Soc. Pet. Eng. J. (June, 1976) 147.
50. Healy, R. N. and Reed, R.L.; Soc. Pet. Eng. J. (April, 1977) 129.
51. Holm, R. W.; J. Pet. Tech. (Dec., 1971) 1475.
52. Danielson, H. H., Paynter, W. T. and Milton, H. W. Jr., Tertiary recovery by the
maraflood process in the bardford field, Paper SPE 4753 presented at the symposium
on Improved Oil Recovery, Tulsa (April, 1974).
53. Gogarty, W. B. and Tosch, W. C., Miscible type water flooding oil recovery with
micellar solution, J. Pet. Technol. (Dee., 1968) 1407.
54 James E. Shaw, JAOCS 61 (1984) 1389.
55. Bradford R. A., Compton J. D. and Hollis P. R. , Paper presented at Production
Operation Symp., Oklahoma, 25-27(Feb., 1979).
56. Graciaa A., Fortney L. M., Scheter R. S., Wade W. H. and Yiv S.; Soc. Pet. Eng. J.
20 (1982) 743.
57. Foster W. R., J. Pet. Technol. 25 (1973) 205.
58. Cayias J. L., Schecter R. S. and Wade W. H., J. Colloid interface Sci. 31 (1977) 59.
32

59. Wilson P. M., Murphy C. L. and Foster W. R., SPE 5812 presented at SPE Improved
Oil recovery Symp., Tulsa, Oklahoma (1976).
60. Bansal V. K. and Shah D. O.; J. Colloid and interface 65 (1978) 451.
61. Gale W. W. and Sandvik E. I.; SPEJ (April ,1982) 597.
62. Lewis S. J., Verkruyse L. A., Salter S. J.; “Selection of Non-ionic Surfactants for
Minimized Adsorption and Maximized Solubilization” Paper 14910 presented at the
SPE/ DOE Fifth Symposium on Enhanced Oil Recovery, Tulsa, OK (April, 1986).
63. Capelle A.; Tenside Detergents 20 (1983)124.
64. Bansal V. K. and Shah D. O.; J. Colloid Interface Sci. 85(1978) 451.
65. Balzer D.; “Carboxymethylated Ethoxylates as EOR Surfactants” Second European
Symosium on Enhanced Oil Recovery, Paris, France (November 1982).Edition
Technip,21-28.
6 6 . Barakat Y. , Fortney L. N., Schechter R. S., Wade W. H. and Yiv S.; “Alpha-Olefm
sulphonates for Enhanced Oil Recovery , Paris, France (November 1982) Editions
Technip, 11-20.
67. Baviere M., Bazin B., Noik C.; “ Surfactants for EOR: Olefin sulphonate Behavior at
High Temperature and Hardness”, Paper 14933 presented at the SPE/ DOE Fifth
Symposium on Enhanced Oil recovery, Tulsa, OK(April 1986).
6 8 . Mileo J. C., Sillion B.: “Procede de recuperation du pertole employant des tensio-
actifs anioniques de la famille des esters d’acidees alpha-sulfocarboxyliques” Petent Fr
2,549(1983) 524.
33

69. Baviere M.,Bazin B. and Labrid J.; “Chemical Stability of surfactants for micellar
flooding Under North Sea Condition”4th European Symposium on EOR, Hamburg,
Germany, October 27-29,1987.
70. Chiu Y. C. and Hwang H. J.; Colloid Surface 28 (1987) 53.
71. Capelle A.; Tenside Detergent 20 (1983) 124.
72. Balzer D.; “Phase Behaviour, Core Flooding and Retention Studies of
Carboxymethylateed Ethoxylates Blended with Sulphonates”, Paper presented at 4th
European symposium on EOR, Hamburg, October 27-29, 1987.
73. Abe M., Schechter R. S., Selliah R. D., Sheikh B. and Wade W. H. ;J. Dispersion
Sci. Technol. 8 (1987) 157.
74. Capelle A.; Tenside Detergent 20 (1983) 124.
75. Abe M., Schechter D., Schechter R. S., Wade W. H., Weerasooriya U. and Yiv S.;
J. Colloid Interface Sci. 114 (1986) 342.
76. Puerto M. C. and Reed R. L.; Soc. Pet. Eng. J. 23 (1983) 669.
77. Belsman T. A. B. M. and Daane G.J. R. ; SPE Reservoir Eng. 1 (1986) 53.
78. Baviere M., Bazin B. and Niol C.; SPE Reservoir Eng. 3 (1988) 597.
79. Gale W. W. and Sandvik E. I.; Soc. Pet. Eng.. J..( Aug , 1973) 191.
80. Neuman H. J., Pusch G., Kraft Ing. H. and Tunc S.; “Evaluation of Surfactant
Flooding Media, Stable to Salt for Enhanced Oil Recovery” , DMGK-Report, West
Germany, 1987.
81. Dennis M., Manfred S., Arno H., Halasz V. and Peter S.; Eur. Patent 3, 807, 945
(1989).
82. Bayram K. and Yvonne J. ,U. S. Patent 4, 811, 945 (1986).
34

83. Bansal B. B., Homof V, and Neale G.; Caa J. Chem.Eng. 57 (1979) 203.
84. Manasrah K., Neale G, H. and Homof V.; Cellulose. Chem. Technol. 19 (1985) 291.
85. Babu D. B., Neale G. and Homof V.; Cellulose. Chem. Technol. 20 (1986) 663.
86. Naae D. G. and Debons F. E.; U. S. Patent 4, 781, 251 (1988).
35

CHAPTER TWO
Surfactants and Methods for Their Analysis

2.0 Chemical Structures of Surfactants
Introduction
The term “surfactant” is a convenient shortening of the terms “surface-active agent” and
“interface active agents”. Surfactants have great impact on all aspects of our daily life,
either directly, as components of household detergents and personal care products or
indirectly, in the production and processing of the materials which surround us.
Surfactants have been brought to public attention increasingly since World War II, and
have become a universally accepted term to describe organic substances having certain
characteristics of structure and properties.
The term “detergent” is often used interchangeably with surfactant as a designation for a
substance capable of cleaning. Detergents can also encompass inorganic substances
when these do in fact perform a cleaning function. More often, however, the term
detergent refers to a combination of surfactants and other substances, formulated to
enhance functional performance (specifically cleaning) over that of the surfactant alone.
The older detergents, soaps are salts of higher fatty acids, such as sodium stearate,
CnHssCOCTNa , which have been around for many years and have played an important
role in health and hygiene. However, the last forty years have seen the rise of the
synthetic surfactants. These more versatile “surface active agents” now make up a
massive market that encompasses the entire world. The global usage of surfactants
(excluding soap) currently stand at over 10 million tonnes with a value of over $14
billion.
37

Although the surfactants market is now growing more slowly in the developed countries
of Western Europe, North America and Japan, there is now a trend of significant growth
in south Asia and Latin America (Table2.1) [1],
Area 1995/ 103 tonnes 2005/ 103 tonnes % increase/ a
Western Europe 2 1 0 0 2165 0.3
North America 1800 1960 1 . 0
Japan 565 655 1.5
Latin America 1575 1785 2 . 6
Asia-Pacific 2690 4340 6 . 1
Rest of World 1645 2765 6 . 8
Total 10,220 13870 3.6
Table 2.1 Projected global surfactant usage [1].
The growth of the surfactants market in developing countries is mainly due to expansion
in the household cleaning and laundry products sectors. Global usage is predicted to
increase to 18 million tonnes by 2050, as the hygiene standards and cleaning practices of
Europe, the US and Japan are gradually adopted by the developing world. Despite this
growth in the surfactant industry, soap usage is expected to remain constant at 8 million
tonnes; this is mainly because of its relatively poor performance (for example, it
generates scum in water).
38

The surfactants market can be subdivided into main categories:-
• Cleaning products e.g. household detergents, consumer products, personal
care products and industrial and institutional cleaning.
• Processing aids products that make use of the surfactant’s surface active
properties e.g. emulsifiers for producing water-based polymer latex used in
paint and inks; formulation aids for crop protection chemicals, textile
auxiliaries and fiber lubricants, defoamers; and oil field chemicals.
Surfactants can be characterized by the following features:-
• Surfactant molecules are composed of groups of opposing solubility
tendencies, typically an oil-soluble hydrocarbon chain and water-soluble ionic
group.
• A surfactant is soluble in at least one phase of a liquid system.
• At equilibrium, the concentration of surfactant solute at a phase interface is
greater than its concentration in the bulk of the solution.
• Surfactant molecules form oriented monolayers at phase interfaces.
• Surfactants form aggregates of molecules called micelles when the
concentration of the surfactant solute in the bulk of the solution exceeds a
limiting value, the so-called “critical micelle concentration” (CMC), the value
of which is a fundamental characteristic of each solute-solvent system.
In general, it is the presence of two structurally dissimilar groups within a single
molecule that is the most fundamental characteristic of surfactants. The surface behavior
39

i. e. the surface activity of the surfactant molecule, is determined by the make-up of the
individual groups, their relative size and their location with the surfactant molecule.
These interfacial and solution properties give rise to the following, surface-active
properties :-
Emulsification/ demulsification, wetting/ re-wetting, foaming, dispersing, defoaming ,
detergency and solubilising. These properties or combinations of them have use in many
diverse areas such as the food industry, textiles, mineral extraction and processing,
agriculture, and the paper industry.
Surfactants can be produced from both petrochemical and / or oleochemical (natural)
feedstocks. It interesting to note that while 80% of Western European surfactants are
petroleum-based, 55- 65% of all surfactants in the Asia-region are oleochemical-based. It
was predicted that in 2 0 0 0 three quarters of all surfactants would be derived from
petrochemical-based intermediates [1 ],
2.1. Types of Surfactant.
Surfactants are surface active because they concentrate at interfacial regions: air-water,
oil-water, and solid-liquid interfaces, for example. The surface activity of surfactants
derives from their amphiphilic structure, meaning that their molecules contain one water-
soluble (hydrophilic) and one insoluble (hydrophobic) moiety. Surfactants are classified
into four different groups of amphiphilic molecule as shown in Figure 2.1.
40

Hydrophobe Hydrophile
Anionic
Cationic
Amphoteric
Non-ionic
Figure 2.1. The four classes of surfactant
General formulae and acronyms of the most widespread surfactants are shown in
Table2.2.
Common name (acronym) Hydrophobic group Hydrophilic group
Linear alkylbenzenesulphonates
(LAS)
C6H4-CnH2n+l n =10- 14
-S O 3
Alkylethoxylate sulphates CnfLn+l -(OCH2CH2)n-OSO~3
(AES) n =12-15 n =1-8
Alkyl sulphate
(AS)
CnfLn+l n =12-15
- OSO 3
Nonylphenol ethoxylates
(NPEO)
C9H i9-C 6H4- - (OCH2CH2)nOH n =1-40
Octylphenol ethoxylates
(OPEO)
C8H 17-C 6H4- - (OCH2CH2)nOH n =1-23
Linear alcohol ethoxylates CnLLn+l - (OCH2CH2)nOH
(AEO) n =12-18 n = 1-23
Table 2.2. General formulae and acronyms of the most widely used surfactants.
41

2.1.1 Anionic Surfactants
Anionic surfactants have been used since so long ago that most of the history of
surfactants has to be devoted to them. Event at present, they command the greater part of
surfactant consumption, indicating their reasonable cost and performance. In anionic
surfactants, the hydrophilic moiety carries a negative charge. Most anionic surfactants
(sulphonates, sulphates, carboxylates and phosphates) are polar, and water-soluble. In
dilute solutions in soft water, these groups are combined with a 12- 15 carbon chain
hydrophobe for the best surfactant properties. In neutral or acidic/ basic media, or in the
presence of metal salts, e.g. Ca2+, the carboxylate group loses most of its solubilizing
power.
Of the cations (counter ions) associated with polar groups, sodium and potassium impart
water solubility, whereas calcium, barium and magnesium promote oil solubility.
Ammonium and substituted ammonium ions give rise to both water and oil solubility.
Triethanolammonium is a commercially important example. Salts (anionic surfactants)
of these ions are often used in emulsification. Anionic surfactants are divided into the
following groups:-
2.1. J. 1 Carboxylates
Most of the commercial carboxylates are soaps. The general structure of a carboxylate
soap is RCOO- M+, where R is a straight chain hydrocarbon (C9-21) and M+ is a metal or
ammonium ion. Soaps show excellent detergency in soft water; however, bivalent metal
ions (Ca2 1 etc.) cause unsightly “scum”. For this reason, and from an economic point of
42

view, “syndets”, a combination of synthetic surfactants i.e. alkylbenzene sulphonates
(ABS) and builders i.e. pentasodium tripolyphosphate, have replaced soaps in soap
powders. Carboxylates with a fluorinated chain have also been developed. Replacement
of hydrogens on the hydrophobe by fluorine atoms has led to surfactant molecules of
unusually low surface tension.
2.1.1.2 Sulphonates
The sulphonate group, -SO3M, attached to an alkyl, aryl, or alkylaryl hydrophobe, is a
highly effective solubilizing group. Sulphonic acid surfactants are chemically stable in
nature and their salts are relatively unaffected by pH, they are stable to oxidation, and
because of the strength of the C- S bond, are also stable to hydrolysis. Sulphonates
interact moderately with the hardness cations, Ca2+ and Mg2+, but significantly less so
than do the carboxylates.
Alkylbenzene sulphonates (ABS) have been the most commercially used anionic
surfactants since their introduction in the 1940s. Alkylbenzene sulphonates are effective
surfactants which respond well to builders and foam boosters in detergent formulations.
These properties, together with the low cost and availability at consistent quality, account
for their dominant position in household laundry products. Alkylbenzene sulphonates are
manufactured as is shown in Figure 2.2.
43

RR'CHCI + C6H6HF
RR'CHC6H5 + HCI>
or
HFR'CH=CHR + C6H6 ► R'CH(CH2R)C6H5
then
RR'CHC6H5S 0 3/Air or oleum
RR'CHC6H4S 0 3H>
NaOHRR'CHC6H4S 0 3NaRR'CHC6H4S 0 3H ►
Figure 2.2. The manufacture of ABS.
Alkylbenzene sulphonates (ABS) are regarded as “hard” detergents because of their
relatively slow biodegradation rate as compared to the “soft” linear alkylbenzene
sulphonates (LAS) detergents which are more quickly degraded by common
microorganisms. The presence of significant levels of these detergents in sewage and
surface water has been known to cause foaming problems in sewage and water treatment
plant operations. The persistence of these detergents in river water can also cause
adverse effects to aquatic life. The foaming problem has led the industrialised countries
to switch in the 1960s from ABS to LAS, which has since been found to be a satisfactory
solution [2 ].
The common anionic surfactants are the linear alkylbenzene sulphonates (LAS), with a
structure shown in Figure 2.3, and possess both hydrophilic and hydrophobic
characteristics, due to the sulphonate ion and the long-chain alkyl group of the molecule.
44

Their ability to reduce the surface tension and to form micelles is the reason for the
widespread use of surfactants not only in the detergent industry but also in many other
industries like the textile, cosmetic, food and leather industries and in the flotation of ore
minerals [3], LAS which are present in commercial formulations consist of complex
mixture of Cio-Ci4 homologues and of positional isomers resulting from attachment of the
phenyl ring to the carbon atoms (from the second to the central one) of the linear alkyl
chain. LAS have a total production estimated at 290,000 tonnes per year in Western
Europe [1], This represents 25% of the total consumption of synthetic surfactants. In the
industrial world (i.e. United State, Western Europe and Japan) the figure for the total
LAS consumption is approximately one million tonnes per year.
?o3
C H 3— C H —(C H2) n — C H 3
Figure 2.3 Structure of LAS
After use, most linear alkylbenzene sulphonates (LASs) are disposed of via sewage
treatment facilities. It can be largely removed (95% for activated sludge process) during
the sewage treatment process as result of biodegradation and adsorption to solids. A
small quantity of LAS enters surface water, as part of the treated effluent, and soil, as part
of the sludge when the latter is applied in agriculture as fertilizer. The presence of
surfactants in the environment causes disturbances in the ecological equilibrium. These
45

surfactants have a toxic impact on aquatic organisms, due to interactions with
biomembranes [3],
2.1.1.3 Sulphates
The sulphate group, -OSO3M, where M is a cation, represents the sulphuric acid half
ester of an alcohol and is more hydrophilic than the sulphonate group because of the
presence of an additional oxygen atom. Attachment of the sulphate group to the
hydrophobe through the C-O-S linkage limits hydrolytic stability, particularly under acidic
conditions. Usage of alcohol sulphate (AE) and alcohol ethoxylate sulphate (AES)
systems has expanded dramatically since the 1970s as the detergent industry has
reformulated consumer products to improve biodegradability, lower phosphate content,
and to move from powered to liquid products.
Commercial production of alcohol sulphates (AS) started in Europe in the 1930’s and
these products have become well established in specialty markets. The hydrophobes are
predominantly of petrochemical origin, although in the 1990’s some shift is evident to
oleochemical hydrophobes obtained by reduction of fatty acids and esters. Alcohol
ethoxylate sulphate products have experienced dramatic growth since the 1960’s. Most
of the increase has come from expanded usage in consumer detergent products, resulting
from expanding availability of relatively low cost primary straight-chain alcohols from
petrochemical sources; superior biodegradability of alcohol ethoxylate sulphates
compared to corresponding alkylphenol ethoxylate sulphates; the necessity of hardness-
insensitive surfactants in heavy-duty laundry detergents brought about by phosphate
46

content reduction; expansion of reliable, inexpensive sulphation technology; and use of
the less expensive ethylene oxide, which lowers overall cost. Alcohol ethoxylate
sulphates have several advantages over alcohol sulphates including lower sensitivity to
hardness with respect to foaming and detersive effectiveness, less irritation to skin and
eyes, and high water solubility. Alcohol ethoxylate sulphates generally contain from 10
to 40% ethylene oxide calculated on the weight of the starting alcohol. These are offered
commercially as light-colored, odorless liquids containing 30-70% of the active
ingredients.
2.1.2 Non-ionic Surfactants
Non-ionic surfactants carry no discrete charge when dissolved in aqueous media.
Hydrophilicity in non-ionic surfactants is provided by hydrogen bonding with water
molecules [4], Oxygen atoms and hydroxyl groups readily form strong hydrogen bonds,
whereas ether and amide groups form hydrogen bonds less readily. Hydrogen bonding
provides solubilization in neutral and alkaline media. In a strongly acid environment,
oxygen atoms are protonated, providing a quasi-cationic character. Each oxygen atom
makes only a small contribution to water solubility and therefore more than a single
oxygen atom is needed to solubilize a non-ionic surfactant in water. Non-ionic
surfactants are compatible with ionic and amphoteric surfactants, because the
polyoxyethylene group can easily be introduced by the reaction of ethylene oxide with
any organic molecule containing an active hydrogen atom, and so a wide variety of
hydrophobic structures can be solubilized by ethoxylation. Non-ionic surfactants are
usually prepared by the addition of ethylene oxide to compounds containing one or more
47

active hydrogen atoms, such as alkylphenols, fatty acids, fatty alcohols, fatty mercaptans,
fatty amines and polyols. The alkylphenol poly ethoxylates (APEO) are manufactured by
a base-catalysed reaction of ethylene oxide with alkylphenol (AP). Nonylphenol
polyethoxylates (NPEOs) are therefore made by the reaction of nonylphenol (NP) with
ethylene oxide. NP is produced from phenol and nonene using acid catalysis. The NP
produced almost is completely substituted in the para position. As nonene is a branched
nine carbon containing olefin made by trimerizing propylene, many isomers of APEO are
obtained during manufacture. Also as the manufacturing process produces a mixture of
ethylene oxide oligomers which follow a Gaussian distribution (generally from 1 to 30),
APEO commercial formulations are very complex in nature.
Many of these reactions used for the manufacture of non-ionic surfactants produce a
complex mixture of compounds. The most common classification of non-ionic
surfactants is into the following types:-
2.1.2.1 Polyoxyethylene Alcohols and Polyoxyethylene Esters o f Fatty Acids
These are surfactants with the general structure:-
RO-(CH2CH2 0 )XH or RC00-(CH 2CH20 )xH
Poly(ethylene oxide) surfactants (ethoxylates) are by far the most important group of
alkoxylated non-ionic surfactants. Poly(ethylene oxide) surfactants (ethoxylates) were
introduced into the U.S. as a textile chemical shortly before the 1940’s. The water
solubility of these compounds arises from recurring ether linkages in the polyoxyethylene
chain. A single oxyethylene group contributes slightly more to hydrophilicity than single
48

methylene CH2 contributes to hydrophobicity, so that complete miscibility with water
occurs when 65-70% of the molecule by weight is polyoxyethylene. The surface active
properties of the ethoxylates are not adversely influenced by water hardness.
2.1.2.2 A Icohol Ethoxylates(AE)
Alcohol ethoxylates have emerged as the principal non-ionic surfactants in the consumer
detergent product market. They are cheap to manufacture and highly biodegradable.
They vary in physical from (liquid to waxes) depending on their ethylene oxide content.
Alcohol ethoxylates are polydisperse with respect to ethylene oxide chain length. An AE
containing nominally eight ethylene units actually contains significant amounts of other
ethoxylates ranging from 0 - 2 0 oxyethylene units.
2.1.2.3 Alkylphenol ethoxylates (APEOs)
The physical and performance properties of these surfactants are similar to those of AE.
They are derived mostly from alkylphenols (APs) containing branched alkyl side chains,
typically nonyl and octyl groups. This branching leads to a decrease in biodegradability
in comparison to the alcohol ethoxylates. However, water solubility and dispersive
properties are increased as a result of branching.
Commercial alkylphenol ethoxylates are usually produced by the base-catalysed
ethoxylation of alkylated phenol. As phenols are slightly more acidic than alcohols, their
reaction with ethylene oxide to form the mono-adduct is faster. The product therefore
does not contain unreacted phenols, and thus the distribution of individual ethoxylates in
49

the commercial mixture is narrower and alkylphenol ethoxylates are more soluble in
water. The general formula for APEO is shown in Figure 2.4.
R- \\ // 0(CH2CH20)nH
Figure2.4. The general formula for APEO.
Nonylphenol ethoxylates (NPEOs) are the most commonly used APEO. The molecule
has an alkyl chain (R= C9H 19) containing nine carbon units and an ethoxylate chain that
can vary from one to forty units (Figure2.5)
OH
Figuer2.5. Structure of nonyl phenol ethoxylates.,
There is increasing concern with regard to the world-wide usage of APEO, because of
their relatively stable and toxic biodegradation intermediates [5], Many European
countries are now looking at alternative formulations, and in the UK, a voluntary ban has
been introduced on their domestic usage.
50

2.1.3 Cationic Surfactants
The hydrophobic moiety of cationic surfactants carries a positive charge which resides on
an amino or quaternary nitrogen. The positive charged cationic surfactants are more
strongly adsorbed than anionic or non-ionic surfactants on a variety of substances
including textiles, metal, glass, plastic, minerals, and human tissue, which can often carry
a negative surface charge. The only cationic surfactant found in any quantity in the
environment is ditallow dimethylammonium chloride (DTDMAC), which is a group of
quaternary ammonium salts of distearyldimethylammonium chloride (DSDMAC) [6 ],
Cationic surfactants have antibacterial properties and are frequently used in disinfectants.
Their antistatic and substantive properties make them ideal for use in fabric conditioners,
and their ability to “hydrophobe” a surface makes them ideal emulsifiers, such as in
bitumen emulsion for road repair.
2.1.4 Amphoteric Surfactants
Amphoteric surfactants contain both an acidic and basic hydrophilic group. Ether or
hydroxyl groups may also be present to aid the hydrophilicity of the surfactant molecule.
Examples of amphoteric surfactants include amino acids and their derivatives in which
the nitrogen atom tends to become protonated with decreasing pH of the solution. Amino
acid salts, under these conditions, contain both a positive and a negative charge on the
same molecule. In alkyldimethyl betaine RCH(CH3)(CH3)2N+CH2COO', discrete
opposing charges are present in the molecule at all pH values. Because of their mildness
and high foaming properties, amphoteric surfactants are generally found in toiletries and
51

cosmetic formulations. They are also used in industrial applications where a high stability
foam profile is needed.
The relatively low usage of cationic and amphoteric surfactants (Table2.3) makes them
much less environmentally significant.
Class Sales 1996 / 103 tonnes Sales 2005/ 103 tonnes
Anionic 760 765
Non-ionic 1015 1140
Cationic 190 2 0 0
Amphoteric 50 60
Total 2070 2165
Table 2.3. Current and projected sales of surfactants by type[l].
52

2.2. Introduction-The Analysis of Surfactants
There are many problems which can be encountered by the analytical chemist when
determining surfactants in the different matrices in which they are found, i.e. river, water,
sludge, raw sewage, sea, etc. The complete analysis of surfactants of all types is tedious
and time-consuming. Problems are encountered due to differences between the four
classes of surfactants, and, particularly because many commercial surfactants are not
specific structures but homologous series with similar repeating structures, or complex
mixtures consisting of homologues, oligomers and positional isomers. For example, the
anionic surfactant LAS may contain as many as thirty-five different homologues and
phenyl positional isomers. The alkyl chain can vary from ten to fourteen methylene
units, and the phenyl group is distributed quite evenly along all of the positions on the
chain (with the exception of the two end groups). This last phenomenon is due to the
manufacturing processes used in industry.
The various biodegradation products of these surfactants further complicate analysis.
Recent concern over the effects of surfactants and their biodegradation intermediates on
the environment means that any analytical method must be capable of providing
information about the different isomers.
Not only is it necessary to classify the type of surfactants present in a sample, it is also
necessary to determine its structure and provide quantitative information down to the
53

parts-per-billion (ppb) level or less. Many investigators have attempted to find suitable
tools of analysis [7-14],
2.2.1 Non-Specific Methods
The need to determine routinely low concentrations (0.2 mg/L) of surfactants in
laboratory test liquors and environmental samples has led in the first place to the
development of analytical methods capable of assessing the important members of the
main surfactant classes (e.g. the colorimetric methylene blue procedure for anionics
[15,16] and the Wickbold [17] potentiometric titration method for alkoxylated non-ionic
surfactants). The chemistry of these summary methods is such that the determinations
are not specific for surfactants alone. These methods give fairly accurate results for clean
samples and some of the methods are now standard for legislative biodegradation test
protocols. However, the lack of specificity and sensitivity of these non-specific methods
means that their application to the determination of surfactants in environmental samples,
where concentrations are generally lower and many more interferences are encountered,
is less satisfactory. At best they only provide conservative estimates of surfactants. In
addition, these methods are usually unable to cope with the complete range of
environmental matrices, e.g. sludge, sediment and soil samples. The need to demonstrate
the distribution and fate of major chemicals in the environment is increasingly important
for assessments of their environmental safety.
54

2.2.1.1 Anionic Surfactants
In the determination of trace amounts of anionic surfactants, and in particular LAS, the
methylene blue analytical method is by far the most widely used. Methylene blue
(Figure2.1) is a cationic dye, which in the form of a salt with an inorganic anion such as
chloride or sulfate is insoluble in many organic solvents.
M e 2N N M e,Cl
Figure 2.1 Methylene blue chloride
In the presence of an anionic surfactant, an ion-pair is formed between the methylene
blue cation and the surfactant that is less soluble in water than the individual components
and can therefore be separated into an organic solvent. The complex forms a blue colour
that is readily determined by colorimetry, the intensity of the colour is relative to the
amount of surfactant in the system. This analytical method depends on two factors. The
first is the ability of the anionic hydrophilic group to combine with the methylene blue
dyestuff and the second that the overall complex is then sufficiently hydrophobic to be
extracted into chloroform from an aqueous medium.
As the name MBAS (methylene blue active substance) suggests, the procedure is not
specific to anionic surfactants. The method was originally published by Longwell and
Maniece in 1955 [16] and subsequently modified by Abbott in 1962 [18]. Other
developments for the analysis of environmental samples by the MBAS techniques
55

involve the isolation of the surfactant by the foam sublation technique of Wickbold [17].
The methylene blue method is responsive not only of anionic surfactants, but generally of
any material containing a single strong anionic centre, strong enough to form a stable ion-
pair with the methylene blue cation, and at the same time containing a hydrophobic group
sufficiently lipophilic to be more soluble in the organic layer. Other commonly occurring
compounds can give partial responses with methylene blue, thus causing positive
interference. These are 17,900 ppm NaCl at pH. 1.8 which gives the same colour as
lOppm alkyl sulphate surfactants, as does 1040 ppm of nitrate or 40 ppm thiocyanate
[19]. Whilst careful choice of method can reduce the interference, such species can still
cause falsely high results. Limits of detection using this method are around 0.01-
0.02mg/L in favorable conditions.
2.2.1.2 Non-ionic Surfactants
The historical methods for the analysis of non-ionic surfactants in waters and sewage
have been reviewed by Longman in 1975 [20] and by Heinerth in 1966 [21] and all
involve essentially two stages. The first stage is the extraction procedure to separate the
non-ionic surfactant into an organic solvent and the second stage is the estimation of the
extracted surfactant using chemical methods which, in general, involve reaction with the
hydrophilic portion of the surfactant. The extraction procedures used fall into two broad
classes, the first standard solvent extraction procedure and the second, which is now
much more widely used, the solvent sublation procedure of Wickbold [17].
56

The development of analytical methodology has been very much focused on the two
major alkoxylated non-ionics, i.e. alcohol ethoxylates (AEO) and alkylphenol ethoxylates
(APEO) to determine them in laboratory tests of biodegradability and toxicity and their
environmental monitoring. The three methods detailed below all depend upon the
complex formation between the ethoxylated chain of the non-ionic surfactant and either
inorganic metal or organic salts. As with the anionic MBAS methods, the chemistry of
these complex formation reactions is such that they cannot be specific for non-ionic
surfactant determinations without suitable clean-up of samples.
2.2.1.2.1 Cobaltothiocyanate Active Substances (CTAS) [22,23]
The basis of the CTAS method is similar to that for MBAS; a complex is formed between
ammonium cobaltothiocyanate and the ethoxylate chain which can be extracted from an
aqueous phase into a solvent and this is followed by colorimetric estimation. In common
with all of the non-specific methods for non-ionic surfactants described here, little or no
reaction is obtained for surfactants containing on an average of less than three to four
ethoxy units.
The CTAS method and Wickbold [17] solvent sublation technique are used to
concentrate and separate intact surfactant from non-surfactant materials that can interfere
in their subsequent material estimation. With this technique surface-active materials
including the non-ionics are removed form dilute aqueous samples (containing 1 0 %
sodium chloride and 0.5% sodium bicarbonate) into an overlying layer of ethyl acetate by
bubbling a gas (air or nitrogen) through it. Separation is achieved by adsorption of the
57

surfactant on the surface of the bubbles and its subsequent transfer to the liquid-liquid
interface where it is allowed to partition into the organic solvent. Any anionic surface-
active materials in the resulting extract are removed by non-aqueous ion-exchange. The
limit of detection for the CATS method is approximately 0. lmg/L.
2.2.1.2.2 Potassium Pier ate Active Substance (PPAS) [24]
The basis of this method is the interaction of the ethoxymer chain with a large excess of
potassium ions in aqueous solution to form positively charged complexes which are
readily extractable into 1,2-dichloroethane as picrate ion-association compounds The
concentration of non-ionic surfactant is determined by the absorbance of the picrate ion at
378nm. The technique is well suitable for the determination of low concentration of non
ionic surfactants in marine and surface water, with a limit of detection of 2 -2 0 0 pg/L-
2.2.1.2.3 Bismuth Active Substance (BiAS)
The BiAS procedure, reported by Wickbold [17,25] is the European standard method for
determining alcohol ethoxylate in biodegradation test liquors. This method is based on
two solvent sublation steps with ethyl acetate, cation-exchange chromatography, and
precipitation of the non-ionic surfactant with modified Dragendorff reagent (barium
chloride-potassium tetraiodobismuthate (III)). The resulting non-ionic surfactant
complex precipitate is then dissolved and the liberated bismuth ion is titrated
potentiometrically with pyrrolidine dithiocarbamate complexone as measure of non-ionic
surfactant. This method provides a good estimate for the concentration of total non-ionic
surfactants (AEO and APEO) present in raw sewage, but still leads to a significant
58

overestimation of the concentration of non-ionics in the final effluent of sewage treatment
plants (STP) and river water samples [26,27], The liberated bismuth can also be
determined by atomic absorption (A.A) or Ultraviolet (UV) spectroscopy. The BiAS
method has gained the same status for non-ionic surfactants as the MBAS method has for
anionic surfactant. The limit of detection of the method is 0.05-0.1 mg/L.
2.2.2 Specific Analytical Methods
2.2.2.1 Gas Chromatography
2.2.2.1.1 Anionic Surfactants
In recent years good progress has been made towards developing analytical
methodologies for the specific determination of individual anionic surfactants in support
of environmental testing. This is particularly well illustrated for LAS, the major anionic
surfactant in use, which can now be determined at low concentration (as well as its many
homologues and phenyl positional isomers) in almost any testing laboratory for any
environmental matrix.
Gas chromatography (GC) is a technique based upon the principle that each component
of a mixture undergoes its own characteristic partition between the gas phase and
stationary (liquid or solid) phase packed in a column. The degree of separation of the
sample components is determined mainly by the partition coefficients of the substance
(solutes). These in turn are functions of the solute interaction with stationary phase and
of the vapor pressure of the solute at the column temperature. There are some other
59

factors which affect the separation of the solutes and the appearance of the subsequent
chromatogram, such as solute diffusion, carrier-gas, velocity, mass transfer effect, etc. It
will be readily appreciated that the sample components require lull vaporization prior to
the partition so that the carrier-gas flow can drive them into the column; this is the first
step of gas chromatography. Then one may suppose that the higher the volatility of the
sample, the easier the gas chromatography and in general this is true . In this connection,
it is logical that gas chromatography was first applied to the analysis of volatile materials
such as petroleum products and only later to that of organic substances of little or no
volatility such as drugs and polymers, and of some inorganic compounds. In the case of
substances of little or no volatility (which includes surfactants), the samples require
pretreatment by chemical reaction or thermal decomposition in order to permit GC
analysis.
Gas chromatography has played an important role in the analysis of surfactants; it is an
important application of GC to separate complex mixtures, especially of alkyl
homologues and their isomers. However, there is a difficulty in the practical application.
As mentioned above, samples need to be vaporized before separation in the column, and
in order to achieve this surfactants have to be converted to characteristic non-surfactive
hydrophobic oils by derivatisation, which can then be subjected to GC analysis.
The gas chromatographic procedure is useful as it allows the determination of the
individual LAS homologues and all phenyl positional isomers. It is very sensitive and
specific and can accurately determine pg amounts of LAS in a broad range of
60
environmental matrices. It requires, however, complicated and tedious sample
pretreatment and is therefore less appropriate for routine work. Due to the presence of
the sulphonate group, an LAS salt is involatile, and therefore some form of derivatisation
procedure must be performed prior to analysis by gas chromatography (GC).
Derivatisation techniques offer an alternative approach to desulphonation for increasing
the volatility of LAS for GC analysis. There have been several successful derivatisation
methods for LAS reported in the literature. These include desulphonation in boiling
phosphoric acid [28] and conversion to the sulphonyl chloride [29] or methyl sulphonate
[30], Modern GC methods tend to utilise mass spectrometric detection (GC-MS) rather
than flame ionization detectors (FID) or electron capture detector (ECD); this is mainly
because of the enhanced selectively and sensitivity available from mass spectrometry.
Hon-nomi and Hanya [30] have, however, described improvement of the sulphonate
derivatisation techniques for the analysis of low concentration of LAS in river water by
GC and GC/ MS. The LAS was concentrated from river water by extraction into
chloroform as its methylene blue complex. The methylene blue cation was removed by a
non-aqueous cation-exchange step. The resulting LAS material was treated with
phosphorus pentachloride and methanol to give the corresponding methyl sulphonate
derivative. As a final clean-up step, the methylene sulphonate derivative was then
purified by passage through a silica gel column, to remove interfering organic material,
prior to GC or GC/MS analysis. Calibration was performed by external standardisation
with dodecylbenzene sulphonate. Analysis of the river Tama in Japan showed the level
of LAS to be greater then 3 ug/L.
61

Trehy et al [31] have reported the results of a study on a method for the determination of
LAS and Dialkyltetralin sulphonate (DATS) in environmental water and sediment
samples at low microgram per liter concentration by GC/MS. LAS and DATS (minor
components present in LAS) were extracted using Cs solid phase extraction (SPE)
cartridge. Following extraction, the resulting analytes were allowed to react with
phosphorus pentachloride and then trifluoroethanol added to form their trifluoroethyl
sulphonate derivatives, which they claim is an improvement on the methyl sulphonate
method developed by Hon-nami et al [30], Trifluoroethyl sulphonates are prepared
instead of methyl esters in order to enhance sensitivity and selectivity for electron capture
negative chemical ionization GC/MS. The limit of detection for the method was found to
be ca. O.OOlmg/L for both LAS and DATS. LAS concentrations in the influent and
effluent of a trickling filter wastewater treatment facility in Utah, USA were found to be
2.7mg/L and 0.14mg/L receptively. DATS concentration were 0.22 and 0.052mg/L.
Further studies on the concentration of LAS and DATS, in influents and effluents of 10
US domestic wastewater treatment plants were conducted by Trehy et al [32], The
derivatisation electron capture/ gas chromatograph /mass spectrometry (GC/MS) method
was employed. Two types of sewage treatment plant ( STP) were studied; activated
sludge and trickling filter. The activated sludge process removed > 99% LAS and around
95% of DATS. The trickling filter was shown to be less efficient, with 85% removal of
LAS and 65% DATS. Concentrations of LAS in receiving water downstream of the ten
sites ranged from < 0.001 to 0.094mg/L and < 0.001 to 0.023 mg/L for DATS.
62

2.2.2.1.2 Non-ionic Surfactants
The determination of the environmentally significant non-ionic surfactant alkylphenol
ethoxylate (APEO) suffers from a similar volatility problem to LAS. APEO with a short
poly ethoxy late chain are amenable to direct determination using GC. Quantitative GC
analysis of non-ionic surfactants of a higher degree of ethoxylation, therefore, requires
derivatisation reactions to transform the APEO into more volatile compounds. APEO
analysis by GC without derivatization has mainly been used on the volatile
biodegradation products of APEO, namely NP2EO, NP1EO, and NP.
GC coupled to MS becomes more and more an important method for the determination of
APEO/ AP in environmental matrices because of its sensitivity and selectivity . GC/MS
provides the basis for the reliable identification of these analytes by their fragmentation
pattern apart from quantitation of these compounds. Giger et al [33,34] have successfully
applied GC/MS in the electron ionisation (El) mode for the analysis of NP2EO, NP1EO
and NP in wastewaters and river waters. Quantitation was performed by addition of
tribromophenol [33] or n-nonylbenzene [34] as internal standards to the extracts just
before the GC determination. Detection limits for both methods ranged between 1.0 and
10.0 pg/L.
Jobst and Fresenius [35] have performed determinations of NP from soil samples by
GC/MS in the selected ion monitoring (SIM) mode for sensitive detection (0.05- O.lmg/
kg soil) and selective identification. The internal standard 4-n- nonylphenol not included
63

in technical NP was added to the original sample to correct for non-quantitive recoveries
during isolation.
Blackburn and Waldock [36] have determined the concentrations of nonylphenols (NP)
and octylphenol (OP) in rivers and estuaries of England and Wales. Extraction was
performed by Cg SPE cartridge, the resulting extracts were analysed directly by GC/ MS
without any derivatisation procedure. The survey included six rivers, the final effluent
from twelve sewage treatment works, six estuaries and one harbour-mouth. The highest
concentration of nonylphenol was found in the effluent from a sewage works and was
found to be 330pg/L. The works in question serves an area with a large amount of textile
industry nearby. The concentration of NP in the river Aire into which the treated effluent
was discharged was 180pg/L, which is approaching the LC50 for Daphnia (300pg/L).
The majority of the river sampled contained < 0.2- 5pg/L NP,the highest recorded being
lOpg/L. Estuarine concentrations were lower as a result of dilution and dispersion
processes caused by tidal flow. The highest concentrations were recorded in the outer
Tees estuary (5.2pg/L nonylphenol, and 13pg/L octylphenol) and in the Mersey. Over
80% of the estuarine samples contained < 0.1 pg/L NP. Concentrations of octylphenol
(OP) were less than lpg/L at all sites, reflecting the low use of
octylphenolpolyethoxylates in the U.K. Detection limits using this method were 30-
200pg/L for nonylphenol and 50- 250pg/L for octylphenol.
GC/EI-MS is used for mass spectral characterization of individual nonyl chain isomers of
NP, NP1EO and NP2EO. By use of high-capillary GC/EI-MS, Wheeler et al [37] were
64

able to separate 22 isomers of technical NP. Analysis of the corresponding mass spectra
indicated the presence of five distinct groups of octylphenol ethoxylate (OPEO) and
OPEC and give very reliable information on the molecular weight of the analytes due to
the presence of the adduct ions [M+H]+and [M+C2H5]" [ 38,39], Thus, GC/CI-MS is a
suitable method for the selective identification of these compounds in environmental
matrices.
Derivatisation of NP and NPEO with pentafluorobenzyl chloride (PFBC1) or
heptafluorobutyric anhydride (HFBA) provides derivatives with high electron affinities
which can be specifically and sensitivity-analyzed by GC coupled to an electron capture
detector (ECI), El- MS, or negative chemical ionisation (NCI) MS.
Walhlberg et al [40] have used a GC/MS method for the determination of nonylphenol
(NP) and nonylphenol ethoxylate (NPEO) in sewage sludge as their
pentafluorobenzoates. The detection limits were 0.1 mg/kg for nonylphenol and 0.4, 1
and 2mg/kg respectively for NPl-3EOs. Following extraction from the various matrices
by solvent extraction, levels of nonylphenol in sludge samples were found to range from
ca. 25- llOOmg/kg. Level of NPEOs were much lower, ranging from less than the limit
of detection to 125mg/kg.
The acidic biodegradation products of APEO, namely APEC, have been also identified
by GC/MS after derivatization. Methylation of APEC with diazomethane [41], a 10%
solution of BF3 in methanol [34] or 1 M solution of HC1 in methanol [34] or silylation of
65

APEC with BSTFA [42] yields derivatives which can be easily chromatographed on
fused silica capillary columns.
Field et al [43] have developed methods for quantitative determination of nonylphenol
ethoxycarboxylate biodegradation intermediate products from nonylphenol ethoxylate
(NPEO) by GC/MS in paper mill effluents, municipal sewage treatment plant effluents,
and river water samples. The analytes were extracted from samples by a strong anion-
exchange (SAX) extraction disk and following derivatization with methyl iodide, samples
were spiked with 2-chloroepidine as internal standard. The detection limit for this
method was found to be 0.2, 0.4, 2.0 and 2.0pg/L respectively for (NP1EC, NP2EC,
NP3EC and NP4EC). The total concentration of NPEC in paper mill effluents ranged
from below the limit of detection to 1300pg/L, effluents typically containing less than
lOOpg/L NPECs. Over half of the paper mill effluents contained only NP1EC and
NP2EO, and in all cases, NP2EC was the dominant oligomer. The average proportions of
NPECs in paper mill effluents were NP1EC (16%), NP2EC(72%), NP3EC (10%), and
NP4EC (2%). All NPEC oligomers were detected in all the municipal sewage treatment
plants effluents tested with the average proportion of NPECs as follows: NP1EC (7%),
NP2EC (54%), NP3EC(31%) and NP4EC (8 %), indicating that municipal STPs on
average have a higher percentage of NP3EC and NP4EC relative to NP1EC. Of the eight
US river samples tested, five gave concentrations for NP1EC and NP2EC above the limit
of detection for the method, and again, NP2EC was the dominant oligomer.
66
2.2.2.2 High Performance Liquid Chromatography
High performance chromatography (HPLC) is a widely used technique in surfactant
analysis as it is able to distinguish these charged compounds on the basis of their
hydrophobicity. It is therefore used to analyse complex mixtures of non-volatile anionic
or neutral surfactants (which may not need prior derivatization). The major advantage of
HPLC is the ability to separate and quantitate the various homologues and oligomers by
the length of the alkyl and ethoxylate chains.
2.2.2.2.1 Anionic Surfactants
High performance liquid chromatography (HPLC) has been reported [44-46] as a simple
and efficient analytical method for determining linear alkylbenzene sulphonate (LAS) in
environmental samples. HPLC does not have the superior resolution of GC but it allows
the separation of the main LAS homologues without preliminary derivatization. It offers
a practical tool for environmental monitoring by combining selectivity and speed of
analysis. The method presented by Matthijs and De Henan [44] has been widely applied
to determine LAS in samples of sewage treatment plants[44,47,48], river waters [44,49],
sediments [44] and sludge-amended soils [50,51], LAS is isolated from environmental
matrices by methanol extraction. Sample clean-up is achieved by anionic-exchange
chromatography followed by solid phase extraction (SPE). The sensitivity for total LAS
is lOpg/kg in aqueous samples and lOOpg/kg in solid samples [52],
Kikuch et al [52] developed the necessary concentration and clean-up procedures to
allow the determination of LAS by HPLC in a range of environmental samples including
67

river and sea water, sediment and fish tissue samples. They combined trace enrichment
and clean-up of LAS on Cg reversed-phase mini-columns with an HPLC fluorescence
detection determination (Aex=231nm, Xem =288nm). To recover LAS from aqueous
samples, samples were filtered and methanol added to the filtrate. Sediment samples
required repeated methanol extraction and fish tissue was homogenised with methanol.
All filtrates and extracts were, as required, diluted with distilled water to reduce their
methanol contents to below 1 0 % prior to passage through Cig reversed-phase mini
columns. The samples were then analysed using HPLC with an ODS column at 40°C
using a mobile-phase of 0.1 M sodium chlorate in acetonitrile/water (60:40). The
detection limits for this method, were approximately O.lpg/L, 0.03pg/g and 0.3pg/g for
sea water, sediment and fish samples respectively.
LAS in environmental matrices can be extracted by solid phase extraction (SPE) and then
analysed by HPLC on a Cig column using an acetonitrile /0.33M sodium perchlorate
mobile phase. When this method was applied to sewage treatment plant (STP) the
amounts in influent and effluent detected were 0.4 and 0.14mg/L LAS, respectively [54],
Other HPLC phases used for the separation of LAS include C4 (55),
polystyrenedivinylbenzene [56] and Ci[57],
Matthijs et al [44] also developed method for determination of LAS from aqueous
samples, sediment, sludge and soil using a Cig solid phase extraction column. The extract
was then further purified over a strong anion-exchange column and analysed by HPLC
68
using fluorescence detection. The method allowed the determination of the individual
alkyl chain lengths.
2.2.2.2.2 Non-ionic Surfactants
The need to determine and differentiate between the two largest groups of non-ionic
surfactants, (i.e. APEO and AEO), for the purposes of environmental testing has led to
the development of specific methods for these materials. To date, particular emphasis has
been given to the determination of APEO, used almost exclusively in industrial cleaning
applications, which are generally considered as less environmentally acceptable.
Surfactants are complex mixtures consisting of various homologues and oligomers by
variations in the length of the alkyl and ethoxylate chain. Consequently, HPLC
separation of APEO into individual molecules is a two-dimensional problem best solved
by using different HPLC stationary phases. Polar normal-phase columns separate non
ionic surfactants by their interaction with the hydrophilic polyethoxylate chain without
resolving the hydrophobes, while nonpolar reversed-phase columns separate them by
their interaction with the hydrophobic chain only, eluting the ethoxymers as a single
peak. The ring chromophore in APEO molecules enables direct and sensitive UV or
fluorescence detection. Therefore, normal and reversed-phase HPLC provide a quite
simple and suitable technique for the environmental analysis of APEO and their
metabolites. Recently three reviews [5,58,59] have described the enormous amount of
data published on the determination of non-ionic surfactants ( particularly of the APEO
type) by HPLC over the last fifteen years or so.
69

Normal-phase HPLC is mostly applied to obtain information about the ethoxylate chain
distribution of APEO. Therefore, quantitative determinations of APEO in samples from
waste water, sewage treatment, and the aquatic environment are often performed by
normal-phase HPLC to reveal the changes in the APEO composition due to
biodegradation. Ethoxylate distribution has also been determined by several different
normal-phase systems. Giger et al [60,61] used an aminopropyl column for the
determination of NPEO and their biodegradation intermediates NP, NP1EO and NP2EO
in waste water and river water. The authors used a hexane/ isopropanol gradient system
coupled to UV detection (277nm). Samples were extracted by steam distillation and
solvent extraction; the resulting analysis showed river water from the Glatt river in
Switzerland to contain 3.9pg/L NP, 23.4pg/L NP1EO, 9.4pg/L NP2EO and 0.8-2.3pg/L
NPEO. A digested municipal sewage sludge was found to contain 1.6g/kg NP. Rothman
[62] also used an aminopropyl column for the determination of OPEO and NPEO with
UV detection. The method used a gradient mobile-phase system isooctane,
dichloromethane and methanol. The same method was used by for the determination of
NPEO around the Krka river estuary, Croatia [63], Following extraction by Ci8 SPE,
untreated municipal waste water was found to contain 70-2960pg/L NPEO, with
estuarine concentrations ranging between 0.7 and 17pg/L.
Boyd-Boland and Pawliszyn [64] have been developing a new method for the
determination of APEO in environmental samples by coupled solid phase microextraction
(SPME) with HPLC. The authors found that the best SPME phase for the extraction of
70

APEO was Carbowax/ divinylbenzene. This method was used simply to quantitatively
determine the presence of alkylphenol in the sewage sludge to level of lOpg/L.
In order to increase sensitivity and selectivity, another method for the determination of
APEO in water samples using an aminopropyl column has been developed by Holt et al
[65]. Extraction and purification of APEO in sewage-influent and sewage- effluent
samples was carried out by sublation, ion-exchange and alumina chromatography. The
resulting extracts were analysed by HPLC using a gradient mobile phase system of
methyl tetra-butyl ether ( MTBE) and acetonitrile/ methanol (containing 0.1% acetic
acid) with fluorescence detection (Xex=230nm, A-em =302nm). A detection limit of 0.2ng
for each individual homologue of APEO was achieved. The total APEO in influents from
two sewage treatment plants in South East England varied from 126 to 4 lOpg/L and in
effluent levels from 40 to 228pg/L.
Lee et al [66] have reported a method of analysis for APEO in river water and sediment
samples. They also used an amino-propyl column but with isocratic elution and
fluorescence detection. The detection limits of APEO were , 0.02pg/L and 0.015pg/g
d.w. respectively. Ethoxylate distributions have also been determined on silica [67-69],
alumina [70], cyano [71], 10 pac [72], porous graphitic carbon (PGC) [73] and Ci (TMS)
[73] columns to good effect.
Reversed-phase HPLC can be used as a complementary method to normal-phase HPLC.
It is able to separate the homologous compounds OPEO and NPEO but not the coeluting
71

ethoxylate oligomers. Thus, the quantitative analysis of NP and NPEO from waste water,
river water or sewage sludge can be performed on C% column with isocratic methanol/
water elution and UV detection at wavelength 277nm. Reversed-phase HPLC has been
used to provide information on the identity of the alkyl chain and also to determine the
overall concentrations of APEO and as a rapid screening method [74,68,60,61],
2.2.2.2.3 Simultaneous Determination o f Anionic and Non-ionic Surfactants
The determination of two classes of surfactant in one chromatographic run has been
described by a number of groups. Marcomini and co-workers [75] were the first to
describe a simultaneous technique to determine both anionic LAS and non-ionic APEO
surfactants by reversed-phase EGPLC on Cs and Ci8 columns with acetonitrile and water
gradient elution containing 0.02 M sodium perchlorate (NaC104) and 5% isopropanol for
the determination of LAS and NPEO in laundry detergent. As would be expected from a
reversed-phase method, the LAS and APEO surfactants were separated according to their
alkyl chain length. The Ci8 column was also able to resolve the LAS positional isomers
as well. However, for information on ethoxylate distribution, a separate normal-phase
experiment was required.
Another method was developed by Marcomini and Giger [76] for the determination of
both LAS and APEO, (i.e. 4-octylphenolpoly ethoxy lates [OPEO], and
nonylphenolpolyethoxylates [NPEO] ), and 4-nonylphenol (NP) in sewage sludges and
river sediments by reversed-phase HPLC on Cs columns using water/ acetonitrile gradient
elution. LAS are separated according to their alkyl chain length, and coelution of NPEO
72

and NP is observed in contrast to the separation of NPEO and OPEO. Samples were
extracted by soxhlet extraction. Recoveries of 85 to 100% were found for LAS, APEO,
and NP. Results showed sewage sludge to contain 7.3g/kg LAS, 1.2g/kg NP, 0.22g/kg
NP1EO and 0.03g/kg NP2EO. River water sediment contained 5.6g/kg LAS, 0.9g/kg
NP, 0.80g/kg NP1EO and 0.70g/kg NP2EO. The NP, NP1EO and NP2EO
concentrations were determined by normal-phase HPLC. No higher NPEO ethoxylates
were found in any of the samples.
The method developed by Marcomini and co-workers has also been used for the
determination of LAS and APEO in the marine environment [77], and applied to the
analysis of the carboxylic biodegradation intermediates of LAS and APEO as well [78],
Di Corcia et al [79] have been developing methods which allow the simultaneous
extraction of LAS and its sulphophenyl carboxylate (SPC) biodegradation intermediates,
and NPEO and their corresponding NPEC and NP biodegradation intermediates, using
three different elution systems. The samples were extracted using a SPE cartridge filled
with graphitised carbon black (GCB). Recoveries of all compounds were in the range 89-
99%. The method was used for the determination of all the above compounds in raw and
treated sewage of mechanical-biological treated plant. The analysis method used was that
developed by Marcomini and co-workers [78],
Graphitised carbon black (GCB) is an adsorbing medium which is produced by heating
carbon blacks at 2700- 3000 °C in an inert atmosphere. GCB is an essentially non
specific, non-porous sorbent. A range of GCB is available with surface areas ranging
73

about between 8 and 100m2/g, depending on the type of starting material submitted to the
graphitisation process. GCBs are capable of acting as both reverse-phase and anion
exchange sorbents. The anion exchange sites are relatively few in number. They are
thought to have a chromene-like structure, that is a burnt-off residue left over from the
heating of carbon blacks [80] in producing graphitic carbon. In the presence of water and
particularly of acid, this surface group is rearranged to form benzpyrylium salts (see
Figure 2.2). The presence of these positively charged chemical impurities on the GCB
surface enable it to act as both an anion-exchanger and a non-specific sorbent.
Figure 2.2 Rearrangement of chromene-like structure to benzpyrylium salt in graphitised carbon black.
Scullion et al [81] have published a method for the simultaneous determination of LAS
and APEO using Ci HPLC column. The method was an improvement on that developed
by Marcomini and co-works [75] as it enables the resolution of the LAS positional
isomers (if needed) and also the APEO ethoxymers in the same run. The issue of
carboxylic biodegradation intermediates of these surfactants was not addressed.
2.2.2.3 Capillary Electrophoresis
Capillary electrophoresis (CE) is a relatively new separation technique [82], which has
increasingly been applied for the analysis of ionic surfactants during the past few years
[3,83-86], The analytes are separated according to their electrophoretic mobilities
74

(determined by charge and size of the ion). Several buffer parameters, such as pH, ionic
strength, and organic solvent content, can be varied to influence the migration behavior,
leading to an improved peak resolution. Neutral surfactants do not possess an
electrophoretic mobility. Therefore, additional interactions with buffer constituents are
necessary for the CE separation of non-ionic compounds. In micellar electrokinetic
capillary chromatography (MECC), micelle-forming agents, usually sodium
dodecylsulfate (SDS), supply the possibility for such an interaction [87], Hydrophobic
substances with similar structure are difficult to resolve in MECC owing to their low
solubility in water and high partition coefficients into the micellar phase. For that reason,
another separation mode has been developed [88], With the addition of organic modifiers
in concentrations higher than 20% to electrophoretic buffers containing charged micelles,
micelle formation will be inhibited, but the surfactants and nonionic analytes can still
interact The interaction between nonionic analytes and surfactants is called solvophobic
association. Separation is based on differences in the strength of analyte-surfactant
association complexes, which results in differences in effective electrophoretic mobilities.
Non-ionic surfactants of the alkylphenol type have been analyzed using solvophobic
association with sodium dodecyl sulfate (SDS) in buffers with high contents of
acetonitrile and other organic solvent [89-91]
Another possibility is the derivatization to anionic compounds with phthalic anhydride,
which has been carried out for alkylphenol ethoxylates before separation by capillary
electrophoresis [92], This method does not require any further interactions in the
electrolyte system for electrophoretic migration of analytes and could be very useful for
75

the analysis of fatty alcohol ethoxylates (FAE). The nonabsorbing FAEs have to be
transformed into chromophoric components to carry out UV detection. The reaction with
phthalic anhydride leads to both absorbing and anionic analytes, allowing a less
problematical electrophoretic separation.
Capillary electrophoresis (CE) analyses of technical nonylphenol ethoxylate (NPEO) and
octylphenol ethoxylate (OPEOs) using fused-silica capillary(57cm x75pm i.d) and UV
detection were performed to separate the surfactants into individual EO oligomers
[90,91], In systematic investigations, the separation efficiency could be considerably
improved by addition of sodium dodecyl sulfate (SDS) and high amounts of acetonitrile
(20-40%) to the electrophoretic buffer. Despite these results, the applicability of CE to
the determination of non-ionic surfactants is limited because of the insufficient peak
resolution of low and higher ethoxylates and relatively low detection sensitivity.
Heinig et al [93] have shown CE to be useful for the determination of the fatty alcohol
ethoxylate (FAEs) surfactants in laundry detergent. Before separation, surfactants were
derivatised with phthalic anhydride to render them suitable for UV detection at 200 nm.
The authors found the method to be an excellent tool for the rapid finger printing of
technical products and household formulations, and the results were comparable to those
obtained by a standard HPLC method.
Bullock [89] has reported a CE method for the analysis of Triton X-100 (an octylphenol
ethoxylate surfactant) standard. Excellent resolution of the X-100, which indicated about
76

20 oligomers, was achieved using 25mM boric acid buffer pH 8.6 in a (35:65)
acetonitrile/water solution containing 50 mM sodium dodecyl sulphate (SDS) solution.
The analytes were determined by UV detection at 200nm. The authors suggested a
solvophobic mechanism for the separation which involves the association of the
hydrophobic portions of the Triton ethoxymers with the hydrophobic portions of the SDS
molecule.
Shamsi and Danielson [94] have used CE with indirect photometric detection for the
simultaneous determination of mixtures of tetralkylammonium cationic surfactants and
alkanesulphonate anionic surfactants. Salimi-Moosav and Cassidy [85] have also
reported the separation of alkanesulphonates, but this time the method utilised non-
aqueous EC with direct UV detection at 214nm.
2.2.2.4 Liquid Chromatography-Mass Spectrometry
Chromatographic analysis of surfactants and their biodegradation products is an
analytical problem which is typically solved by different methods of liquid
chromatography (LC). However, these methods lack sufficient specificity to identify
without doubt the presence of traces of surfactants in complex matrices. Even when
analyzing commercial mixtures of surfactants, MS data can be of support for assigning
definitive identity to chromatographic peaks. Thus, coupling liquid chromatography to
mass spectrometry is the key to the future of many LC methods. Research in
methodologies in MS, notably LC-MS, has greatly benefited from such an international
need and now can serve to fulfil the goals initially sought by such a technique, that is the
77

monitoring of non-volatile and polar target compounds with a specificity and sensitivity
similar to GC-MS.
In the past 20 years, a large variety of interfaces have been developed to make the high
vacuum of the mass analyzer compatible with the large amounts of liquids exiting from
the LC column. LC-MS offers an excellent combination technique to achieve on-line
separation as well as molecular weight and structural information on separated
compounds. LC-MS has been extensively reviewed in the past years. Several books and
review papers [95-101] which illustrate the principles, instrumentation and applications
of LC-MS have been published. LC-MS is widely used in environmental sample analysis
and has recently been applied to analysis of trace organic compounds in water [102-105]
and specifically to surfactants in water [106-110].
The electrospray (ES) interface is the most important device introduced for LC-MS
coupling. ES has opened new and exciting perspectives to the LC-MS technique. It is
sufficient to say that the ES interface enables LC-MS analysis of compounds having
molecular masses up to 400 OOOu (unified atomic mass units) [111 ] as the ES process is
able to form multiply charged ions depending on the acid-base chemistry and hydration
energy of the molecules. The ability to increase charge (z) permits the analysis of large
molecular masses on a conventional quadrupole which have a limited m/z range of about
4000. The versatility of this interface is making it extremely popular among both
analytical chemists and biochemists.
78

In the ES process, gas-phase ions are softly generated leading to formation of [M+H]+
(positive-ion mode) or [M-H]' (negative-ion mode) even for the most thermally labile and
non-volatile compounds. Spectra from non-basic analytes may also display intense
signals for Na+,K+, NELf adduct ions. These cations are always present as impurities in
organic solvents used as organic modifiers of the LC mobile-phase.
A very interesting option offered by the ES-MS system, which is not often practised, is
that, by raising the electrical field in the desolvation chamber, the quasi-molecular ion
can be accelerated to such a point that multiple collisions with residual molecules from
the drying gas generate characteristic fragment ions. Provided the target compound is
not coeluted, “in source” collision-induced dissociation (CID) spectra closely resemble
those obtained by the more costly tandem MS technique [112]
Various interfaces have been used for the determination of surfactants by LC-MS. Escott
and Chandler [113] proposed a LC-TS-MS procedure for analyzing simultaneously LAS
and polyethoxylate-based non-ionic surfactants. They pointed out that the use of
ammonium acetate had a dual role as a chromatographic ion-pair-forming agent for
anionic species, such as LAS, and as a volatile electrolyte for TS-MS detection.
Popenoe et al [114] have developed a method using LC-ES-MS for monitoring for alkyl
sulphates (AS) and thirty six alkylethoxylate sulphates (AES) in STP influents and
effluents as well as in receiving water. Detection was performed in the ion-negative
mode. Chromatographic separation was attained by Cs column with gradient elution.
Although the mobile-phase contained 0.3 mM ammonium acetate, sufficiently well
79

shaped peaks for the negative charged analytes were obtained. The surfactants were
extracted from the aqueous matrices by SPE, C2 cartridge. The effectiveness of using the
ES-MS arrangement as a LC detector was fully evidenced by the fact that, although
coeluted with AS, quantitation of AS could be achieved by extracting ion chromatograms
at m/z relative to their [M-H]' ions from the TIC chromatogram. Limits of detection for
AES in river waters were reported to be about 500 and 10 ng/L in the full-scan and SIM
modes, respectively.
A very sensitive analytical procedure for determining AEO and NPEO in influent and
effluents of STP, river water and drinking waters samples by SPE with a GCB cartridge
followed by LC-ES-MS, has been developed by Marcomini et al [115]. Although the
mobile-phase was acidified with 0.1 mM of TFA, analytes were detected as [M+Na]+
adduct ions. The behavior can be explained by considering that polyethoxylate-
containing compounds have a great tendency to form stable complexes with inorganic
cations. Chromatography was adjusted in order to elute all the oligomers of NPEO and
AEO homologues as single peaks. Analyte quantification was performed by the internal
standard method, using A10EO6 as internal standard. This compound is found in
negligible amounts in commercial AEO mixtures. Under these conditions, the limit of
detection (S/N =3) was estimated to be 20pg/ component injected into the column or 0.6,
0.02, 0.02 and 0.0002 pg/L of each analyte in the influents and effluents of STP, river
water and drinking water, respectively.
80

2.2.2.S Other Mass Spectrometry Techniques
Organic MS has been a tool of analytical chemistry for more than 30 years; but has been
applied to the analysis of surfactants only over past few years, in conjunction with GC
but mainly with LC [116]. MS relies on creating charged ions for detection and consists
of many variations, including the following: (i) electron ionisation [117], (ii) chemical
ionisation [118], (iii) field ionisation, (iv) field desorption [119], (v) collisionally
activated dissociation [120], (vi) fast-atom bombardment [121-125], (vii)
photoionisation, and (viii) surface emission. MS is also used in combination with other
methods such as GC-MS [126,127] LC-MS, and MS-MS with two different units in
tandem. Electron ionisation (El) is by far the most common method used for sample
ionization in MS
MS is an unambiguous method for the determination of the molecular structure of the
parent ions, and can give directly the weight distribution of surfactant oligomers.
Fragmentation patterns yield information about the kind of the isomers, such as the
location of side chains and degree of branching.
MS and, in particular, tandem mass spectrometry (MS-MS) allows determination of
complex mixtures without prior derivatisation and chromatographic separation.
However, the benefits that mass spectrometry provides such as simple preparation and
short analysis times have to be balanced against the high cost of the instrumentation and
cost of day to day running. However, some new ionisation techniques have been applied
81
to the direct identification of APEO and their degradation products in environmental
samples
Fast atom bombardment (FAB) is useful for the identification of APEO, especially the
higher oligomers, and its metabolites in environmental matrices. Ventura et al [128]
produced a method for the identification of surfactants and their acidic metabolites in raw
and drinking water by fast bombardment mass spectrometry (FAB-MS) and FAB-
MS/MS. The surfactants were extracted from samples using an XAD-2 resin, followed
by fractionation into acids, bases and neutrals. The acidic components were then
derivatised to form the methyl ester by reaction with BFs/MeOH. Analysis of the
fractions by FAB-MS showed that non-ionic surfactants of the alkylphenol and alcohol
ethoxylate types were the most abundant type of surfactant in both the raw and drinking
water of the Barcelona area in Spain. The presence of their acidic biodegradation
products NPEC in raw water, and bromononylphenol ethoxylates and brominated NPEC
in drinking water, was also identified. The presence of brominated compounds in both
raw and river water was thought to be due to the high concentration of bromide ions in
discharges from salt mines located in the upper course of the river. The anionic
surfactant LAS was also identified along with small amounts of cationic surfactants. The
authors also used accurate mass measurements and tandem MS to aid identification
where needed.
Borgerding and Hiles [129] also have developed a quantitative method for the analysis of
LAS in a wastewater treatment plant by FAB-MS. The surfactants were extracted by Ci8
82

disks. The method allowed the simultaneous analysis of all LAS homologues by
examining the parent ions of m/z 183, which is a product ion common to all LAS
homologues when subjected to collisionally induced dissociation (CID). It was also
possible to determine branched alkylbenzenesulphonate (ABS) by examining the parent
ions of m/z 197. Analysis time was approximately four minutes, because no
chromatographic separation was required. The limit of detection was determined to be
0.5ug/L based in a 1L sample.
Evans et al [130] have developed a method to determine AEO in river water and effluents
from STP, based on LC-TS-MS. Samples were extracted by a Cg, SPE cartridge and
aliquots of the final extracts were then injected into a Cig HPLC column. This was
operated isocratically with a mobile-phase composed of a water-tetrahydrofuran
(55:45,v/v) solution. By using this mobile-phase, the column was able to separate AEO
according to the lengths of both the alkyl and ethoxy chains as well as the highly
branched AEO compounds from essentially linear ones. A continuous post-column
addition of aqueous ammonium acetate was done before TS-MS detection. Individual
AEO were identified by both [M+H]+ and [M+NH4]+adduct ions. To compensate for
variations in the instrumental response due to ionization efficiency, quantification was
performed by an internal standard procedure. An AnEO mixture with an average of 9
ethoxy units, which is virtually absent in commercial detergent formulations, was used as
internal standard. Although not applied to the analysis of unspiked real water samples,
this method has the potential to quantify concentrations of AEOs at levels of 25-100ppb
and less than 3ppb for individual homologues
83

Levsen et al [131] analyzed OPEO, NPEO and AEO by LC-MS with electron ionisation
(El). As an interface, a moving-belt device was used. While El spectra from aromatic
surfactants showed distinct peaks for the molecular ion, these were absent in spectra from
the nonaromatic AEO surfactants. For these species, the El ionization process produced
abundant amounts of fragment ions with the general formula [(CH2CH20 )nH]+.
Branched NPEO could be distinguished from linear ones, as decomposition of the former
compounds produced abundant amounts of a fragment at m/z 131 due to the loss of the
hexyl radical. Abundant production of quasi-molecular ions from the surfactants
considered was achieved by a much softer ionization technique, i. e. chemical ionisation
(Cl) with isobutane as reagent gas. For NPEO and OPEO homologues with up to six
ethoxy units, Cl spectra displayed intense signals relative to daughter ions formed as a
result of the loss of nonene (NPEO) or octane (OPEO). The Cl spectra of higher
homologues showed fragment ions at m/z 291 (NPEO) and 277 (OPEO) formed by the
cleavage of the C-0 bond at the level of the second oxyethylene unit. Conceivably, the
moving-belt interface, which involves a thermal desorption step from the belt to the ion
source, discriminated analytes on the basis of their volatilities, this resulting in distortion
of the apparent relative abundances of the various oligomers. The moving-belt interface
is no longer used today.
In any case, the same MS data could be achieved by using a commercially available
interface, e.g. PB, since even this interface serves to link LC with an El ion source.
Probably, however, the same negative effect cited above could again occur with the PB
interface.
84

Pattanaargsorn et al [132] have used atmospheric pressure chemical ionization (APCI)
mass spectrometry for the determination of the oligomer distribution of APEO and fatty
alcohol ethoxylate (FAEO). The instrument was operated in positive ion mode, and
protonated molecular ions were seen for both types of surfactants. This method again
showed the ability of mass spectrometry for the determination of mixtures of surfactants
without the need for prior chromatographic separation. In this case the method was not
used for the analysis of environmental samples.
Strife et al [133] used ion trap mass spectrometry for the analysis of the surfactant
components of a shampoo. The authors operated the mass spectrometer in MS mode to
provide a greater insight into the molecular structure of complex mixture than would be
available by MS/MS alone.
In the last years, matrix-assisted laser-desorption/ ionization mass spectrometry (MALDI/
MS) was established as a powerful technique for the determination of the mass of large
biomolecules and synthetic polymers [134-138], MALDI is still a relatively new method
of ionization in mass spectrometry. However, it is an extremely powerful tool when
combined with time-of-flight (MALDI-TOF) detection, for the analysis of high molecular
weight biopolymers with high sensitivity. MALDI-TOF mass spectrometry is a recently
introduced [134,139] soft ionization technique that allows desorption and ionization of
very large molecules even if in complex mixtures, such as the wide molecular weight
distribution (MWD) present in synthetic and natural macromolecules. MALDI has
evolved from the older technique of laser desorption/ ionisation (LDI) which involved the
85

irradiation of a solid sample with short, intense pulses from a laser in the IR or UV
region, to produce quasi-molecular ions from thermally labile molecules. LDI however,
has a number of important limitations, as it tends to be most efficient when the laser
wavelength matches an intense absorbance band in the analyte molecule and then tends to
lead to fragmentation with the loss of important molecular weight information [140],
The process of using a matrix to aid laser desorption of intact protein molecular ion was
reported almost simultaneously and independently by Tanaka and co-workers [138] and
Karas and Hillenkamp [134], Tanaka’s group used a liquid matrix of a fine powder of
cobalt (300 A) suspended in glycerol to produce LDI spectra of proteins and polymers
with molecular weights up to 25 kDa, and multiply charged lysozyme quasi-molecular
ions of 100 kDa. Karas and Hillenkamp [134] produced spectra using a solid UV
absorbing organic matrix. Equal volumes of a very dilute solution of analyte (10° M)
and nicotinic acid (10'3 M) were mixed, and a drop of the mixture applied to a metallic
substrate. After air drying, spectra of various proteins such as |3-lactoglobulin (MW
18277 Da) and albumin (MW 67000 Da) were recorded.
Since then, considerable attention has been paid to the various factors involved in
obtaining good quality MALDI spectra, which include the laser ion source, choice of
matrix, the solvent evaporation technique and method of detection.
MALDI-TOF has now become the method of choice (along with electrospray mass
spectrometry) for molecular weight analysis of large biopolymers, a significant
86

achievement being the analysis of a singly charged human immunoglobulin species
(MW= 1 Mda) [141].
There have been only a few papers published on the MALDI-MS of surfactants. Just and
co-workers [142] have compared the use of MALDI with supercritical fluid
chromatography (SFC) for molar mass determination of some APEO surfactants. They
produced good MALDI spectra of these surfactants using 2,5-dihydroxybenzoic acid
(DHB) as the matrix. Spectra of the APEO showed a mixture of [M+Na]^ and [M+K]+
adducts. Direct comparison between SFC and MALDI-MS proved that MALDI-MS
provided a much better differentiation in the higher mass range but seemed to cause some
discrimination in the lower mass region, with lower intensities than expected observed for
lower molecular weight ethoxymers.
Thomson et al [143] produced MALDI-MS spectra for three classes of surfactant - non
ionic, anionic and cationic. The anionic surfactants, sodium dodecylsulphate (SDS) and
sodium dodecylbenzene sulphonate, were successfully analysed to produce negative ion
spectra, either simply as an aqueous solution allowed to dry on the metal probe, as in the
case of SDS, or dispersed in ethylene bis [3-(2-naphthyl)acylate] as in the case of the
latter anionic surfactant. Cationic surfactants, cetyldimethylethylammonium bromide,
cetylpyridinium chloride and benzalkonium chloride produced good quality, intense
spectra either neat or dispersed in DHB. Good spectra of the NPEO surfactants IGEPAL
CO-850, CO-880 and CO-890 were produced as their sodium adducts by dispersal in
DHB with NaCl added as a source of cations.
87

Parees et al [144] have briefly compared electrospray, FAB and MALDI ionisation
techniques for the analysis of some commercial nonylphenol ethoxylate (NPEO)
surfactants. Their findings seemed to indicate that the data obtained from the two
methods are comparable for lower average molecular weight surfactant mixtures.
However at higher average molecular weights, although the electrospray and MALDI
results were similar, the FAB data exhibited distinctly lower molecular weight
distributions than electrospray and MALDI, possibly due to fragmentation.
Another comparison has been made between MALDI, reversed phase HPLC and thin-
layer chromatography (TLC) for the analysis of non-ionic surfactants. In this work
Cumme and co-workers [145] compared the molecular weight information given by
MALDI, TLC (using mass spectrometry to analyse the fractions) and HPLC. The
MALDI spectra were obtained using DHB as the matrix, and the HPLC analysis was
performed using a Ci8 column with an isocratic iospropanol : water (45:55) mobile phase
containing 0.1% TFA. The results from these experiments did not show any major
discrepancy between the average molecular weight found by HPLC and TLC with that
found by MALDI. However the authors [145] state that for MALDI, ethoxymers with
masses below 405 Da were not included in the results because of interferences from
matrix ions.
Recently Willetts et al [146] have reported a method for the determination of
nonylphenol ethoxylates in surface water by MALDI/MS [146]. Following
extraction/preconcentration by C18 solid phase extraction, the sample was mixed with a
88

standard MALDI matrix (2,5-dihydroxybenzoic acid) with the addition of LiCl. The limit
of detection was 40 pg/L based on a 250 ml sample.
Of the methods described for determination of surfactants in reagent-water and sea
water, HPLC and mass spectrometry have the advantage of being the most versatile and
efficient and here were chosen as the methods for use in the initial part of the
investigation described in this thesis.
89
Reference
1. Karsa D. R.; Chemical and Industry 17 (1998) 685.
2. Sweeney W. A. and Anderson R. G.; JAOCS. 60 (1989) 1844.
3. Vogt C.K., Heinig K., Langer B., Mattusch J., Werner G. and Fresenius J.; Anal.
Chem. 352 (1995) 508.
4. Ferguson L. N.; J. Am. Chem. Soc. 77 (1955) 5288.
5. Kiewiet A. T. and de Voogt; J. Chromatogr. A. 733(1996)185.
6. Aboul-Kassim A. T. and Simoneit B.R; Critical Reviews Environ. Sci. Technol. 23
(1993) 325.
7. Jones J. H.; J. Assoc. Offic. Agric. Chemists 28 (1945) 398.
8. Epton S. R.; Trns. Faraday Soc. 44 (1948) 226.
9. Evans H. C.; J. Soc. Chem. Ind. 69 (1950) 76.
10. Lester W. F. and Raybould R. D.; J. Inst. Sew. Purif. (1950) 393.
11. Degent P. N ., Evans H. C., Kommer J. D. and Winsor P. A.; J. Appl. Chem. 3 (1953)
54.
12. Lewis G. R. and Herndon L. K.; Sewage Ind. Wastes 24 (1952) 1456.
13. Rosen M. J. and Gold Smith H. A., Systematic Analysis of surface active agents,
interscence 1972 NY.
14. Hummel D., Identification and analysis of surface active agent by IR and chemical
methods wiley interscience 1972 NY.
15. Water J. and Taylor C. G.; “In anionic Surfactants Chemical analysis”,ed. J. Cross.
Marcel Dekker, New York, (1977) 193..
16. Longwell J. and Maniece W. D.; Analyst. 80 (1955) 167.
90

17. Wickbold R.; Tenside Surfactants Detergents. 8 (1971) 61.
18. Abbott D. C.; Analyst. 87 (1962) 286.
19. . Swisher R. D.; Surfactant Biodegradation Vol. 2. Marcel DekkerNy. 1987.
20. Longman G. F.; “The Analysis of Detergents and detergent products”, Wiley , New
York, (1975).
21. Heinerth E.; Tenside Surfactants Detergents. 3 (1966) 109.
22. Morgan D. J.; Analyst. 87 (1962) 233.
23. Crabb N. T. and Persinger H. E.; JAOCS. 41 (1964) 752.
24. Favretto L., Stancher B. and Tunis F.; International. J. Environ. Anal. Chem. 14
(1983)201.
25. Wickbold R.; Tenside Surfactants Detergents 9 (1972) 173.
26. Brown D., De Henau H., Garrigan J. T., Gerike P., Holt M., Keck E., Kunkel E.,
Matthijs E., Water J. and Watkinson R.; Tenside Surfactants Detergents 23 (1986)
190.
27. Brown D., De Henau H., Garrigan J. T., Gerike P., Holt M.,., Kunkel E., Matthijs E.,
Water J. and Watkinson R.; Tenside Surfactants Detergents 24 (1987) 14.
28. Knight J. O. and House R.; JAOCS. 36 (1959) 195.
29. McEnvoy J. and Giger W.; Environ. Sci. Technol. 20 (1986) 376.
30. Hon-Nami H. and Hanya T.; J. Chromatogr. A. 161 (1978) 205.
31. Trehy M. L., Gledhill W. E. and Orth R. G.; Anal. Chem. 62 (1990) 2581.
32. Trehy M. L., Gledhill W. E., Mieure J. P.,Adamove J. E., Nielson A. M., Perkins H.
O. and Eckhoff W. S.; Environ. Toxicol. Chem. 15 (1996) 3 323.
33. . Stephanou E. and Giger W.; Environ. Sci. Technol. 16 (1986) 800.
91

34. Ahel M., Conrad T. and Giger W.; Environ. Sci. Technol. 21 (1987) 697.
35. Jobst H. and Fresenius Z.; Anal. Chem. 328 (1987) 644.
36. Blackburn M. A. and Waldock M. J.; Water Research. 29 (1995) 1623
37. Wheeler T. F., Heim J. R , LaTorre M. R. and Janes A. B.; J. Chromatogr. Sci 19
(1997) 35.
38. Stephanou E., Reinhard M. and Ball H. A.; Biomed. Environ. Mass Spectrom 15
(1988) 275.
39. Stephanou E.; Chemosphere 13 (1984) 510.
40. Wahlberg C., Renberg L. and Widequist U.; Chemosphere. 20 (1990) 179.
41. Reinhard M., Goodman N. and Mortelmans K. E.; Environ. Sci. Technol. 16 (1982)
351.
42. Stephanou E.; “In Organic Micropollutants in the Aquatic Environment” Bjoerseth
A., Angeletti G., Eds D.; Reidel Publ.: Dordrecht, The Netherlands, (1986) 155.
43. Field J. A. and Reed R. L.; Environ. Sci. Technol. 30 (1996) 3544.
44. Matthijs E. and De Henau H.; Tenside Surfactants Detergents 24 (1987) 193.
45. Marconmon A. and Giger W.; Anal. Chem. 59 (1987) 1709.
46. Kikuchi M., Tokai A. and Yoshida T.; Water Research 20 (1986) 643.
47. De Henau H., Matthijs E. and Hopping W.D.; International J. Environ. Anal. Chem.
26(1986) 279.
48. Bema J. L., Ferrer J, Moreno A., Prats D. and Ruiz Bevia F.; Tenside Surfactants
Detergents 26 (1989) 101.
49. Gerike P., Winkler K., Schneider W. and Jakob W. Tenside Surfactants Detergents
26(1989) 136.
92

50. Holt M. S., Matthijs E. and Water J.; Water research 23 (1989) 749.
51. Water J., Holt M. S. and Matthijs E.; Tenside Surfactants Detergents 26 (1989) 129.
52. Matthijs E. and Hennes E. C.; Tenside Surfactants Detergents 28 (1991) 22.
53. Kikuchi M., Takai A. and Yoshida T.; Water Research 59 (1982) 152.
54. Tong S. L. and tan C. B.; Intern. J. Environ. Anal. Chem. 50 (1993) 73.
55. Yokoyama Y. and Sato H.; J. Chromatogr. A. 555 (1994) 155.
56. Chen S. and Pietrzk D.; J. Chromatogr. A. 671 (1994) 73.
57. Castles M. A., Moore B. L. and Ward S. R.; Anal. Chem. 61 (1989) 2534.
58. Miszkiewicz W. and Szymanowski ; J. Critical Reviews in Anal. Chem. 25 (1996)
203.
59 Thiele B., Gunther K. and Schwuger M.; J. Chem. Rev. 97 (1997) 3247.
60. Ahel M. and Giger W.; Anal. Chem. 57 (1985) 1577.
61. Ahel M. and Giger W.; Anal. Chem. 57 (1985) 2584.
62. Rothman A. M.; J. Chromatogr. A. 253 (1982) 283.
63. Kvestak R., Terzic S. and Ahel M.; Marine Chemistry. 46 (1994) 89.
64. Boyd-Boland A.A. and Pawliszyn J.B..; Anal. Chem. 68 (1996) 1521.
65. Holt M.S., McKerrell E. H., Perry J. and Watkinson R. J.; J. Chromatogr. A.
362(1986)419.
66. Bennie D. T., Sullivan C. A., Lee H. B.,Peart T. E. and Maguire R. J.; Sci. Total
Environ. 193 (1997)263.
67. Kudoh M., Ozawa H., Fudano S. and Tsuji K.; J. Chromatogr. A.287 (1984) 337.
68. Anghel D. F.,Balcan M., Voicu A. and Elian M.; J. Chromatogr. A. 668 (1994) 375.
69. Ibrahim NMAand Wheals B.B.; J. Chromatogr. A 731 (1996) 171.
93
70. Forgecs E. and Cserheti T.; Analytical Letters 29 (1996) 2 321.
71. Pile J. A. and Sermon P. A.; J. Chromatogr. A. 398 (1987) 3745.
72. Fytianos K., Pegiadou S., Raikos N., Eleftheriadis I. and Toukali H.; Chemosphere.
35 (1997)7 1423.
73. Nemeth-Kiss V.; J. Liq. Chrom. Rel. Technol. 19 (1996) 2217.
74. Chee K. K., Wong M. K. and Lee H. K.; J. Liq. Chrom. Rel. Technol. 19 (1996)2
259.
75 Marcomini A., Filipuzzi F. and Giger W.; Chemosphere. 17 (1988) 853.
76. Marcomini A. and Giger W.; Anal. Chem. 59 (1987) 1709.
77. Marcomini A., Stelluto S. and Pavoni B.; Int. J. Environ. Anal. Chem. 35 (1989) 207.
78. Marcomini A.,Di Corcia A., Samperi R. and Capri S.; J. Chromatogr. A. 644 (1993)
59.
79. Di Corcia A., Samperi R.and Marcomini A.; Environ. Sci. Technol. 28 (1994) 850.
80. Di Corcia A., Marchese S. and Samperi R.; J. Chromatogr. A. 642 (1993) 163.
81. Scullion S. D., Clench M .R., Cooke M. and Ashcroft A. E. J. Chromatogr. A. 733
(1996) 207.
82. Li S.F. Y., Capillary Electrophoresis, Practice and Application; J. Chromatography
Library 52; Elsevier. Amsterdam, 1992.
83. Desbene P. L., Rony C. M., Desmazieres B.and Jacquier J. C.; J. Chromatogr. A. 608
(1992)375.
84. Altria K. D., Elgey J. , Lockwood P. and Moore D.; Chromatographia 42 (1996) 332.
85. Salmi-Moosavi H and Cassidy R.; Anal. Chem. 68 (1996) 293.
86. Lin C. E., Chion W. C.and Lin W. C.; J. Chromatogr. A. 722 (1996) 345.
94

87. Vindevogel J., Sandra P.; “Introduction to Micellar Elecotrokinetic
Chromatography”; Huthig Verlag; Heidelberg, 1992.
88. Walbroehl Y. and Jorgenson J.; Anal. Chem. 58 (1986) 479.
89. Bullock J.; J. Chromatogr. A. 645 (1993) 169.
90 Heinig K., Vogl C., Werner G.and Fresenius J.; Anal. Chem. 357 (1997) 695.
91. Heinig K., Vogl C.and Werner G.; Anal. Chem. 754 (1996) 281.
92. Wallingford R. A.; Anal. Chem. 68 (1996) 2541.
93. Heinig K., Vogl C., and Werner G..; Anal. Chem. 70 (1998) 1885.
94. Shamsi S. A. and Danielson N. D.; Anal. Chem. 67 (1996) 4210.
95 Yergey A. L., Edmonds C. G., Lewis I. A. S. and Vestal M. L.; “Liquid
Chromatography-Mass spectrometry, Techniques and Applications”, Plenum Press,
New York, 1990.
96. Brown M. A. (Ed); Liquid chromatography-Mass Spectrometry, Applications in
Agriculture Pharmaceutical and Environmental Chemistry, ACS Symposium Series,
Vol.420, American Chemical Society-Washington, DC, 1990.
97. Niessen W. M. and Van der Greef J.; Liquid Chromatography-Mass spectrometry,
Chromatographic Science Series, Vol.58, Marcel Dekker, New York, 1992.
98. Lamoree M. H., Ghijsen R. T., Brinkman U. A. and Barcelo D.; “Environmental
Analysis, Techniques, Applications and Quality Assurance”, Elsevier, Amsterdam,
(1993)521.
99. Voyknser R. D. and Keever J., in: Stan H. J. (Ed), Analysis of Pesticides in Ground
and Surface Water, Spinger-Verlage, Berlin Heeidelbery (1995) 110.
95

100. Volmer D.and Levsen K., in: Stan H. J. (Ed), Analysis of Pesticides in Ground and
Surface Water, Spinger-Verlage, Berlin Heeidelbery (1995) 133.
101. Barcelo D. (Ed), Application of Liquid Chromatography-Mass Spectometry in
Environmental Chemistry, J. Chromatogr. Library, Vol. 59, Elsevier Science,
Amsterdam, 1996.
102. Clark L.B., Rosen R. T., Hartman T. G., Alaimo L. H., Louis J. B., Hertz C., Ho C.
T. and Rosen J. D.; Res. J. Water Pollut. Control. Fed. 63 (1991) 104.
103. Miles C. J., Doerge D. R.and Bajic S.; Arch. Environ. Contam. Toxicol. 22 (1992)
247.
104. Brown M. A., Stephens R. D. and Kim T. S.; Trends Anal. Chem. 10 (1991) 330.
105. Kim I. S., Sasinos F. I., Rishi D. K., Stephens R. D. and Brown M. A.; J.
Chromatogr A. 89 (1992) 177.
106. Clark L. B., Rosen R. T., Hartman T. G., Louis J. B.and Rosen J. D.; Int. J. Environ.
Anal. Chem. 45 (1991) 169.
107. Clark L. B., Rosen R. T., Hartman T. G., Louis J. B. ,Suffet H., II, Lippincott R. L.
and Rosen J. D.; Int. J. Environ. Anal. Chem. 47 (1992) 180.
108. Schroeder H. F.; DVGW-Schriftenr; Wasser 108 (1990) 121(Neue Technol.
T rinkwasserversorg.)
109. Schroeder H. F.; Water Sci. Technol. 23 (1991) 339.
110. Schroeder H. F.; J. Chromatogr. A.554 (1991) 251.
111. Fenn J.B.; J. Am. Soc. Mass Spectrom4 (1994) 524.
112. Voyskner R. D. and Pack T.; Rapid Commun. Mass Spectrom 5(1991)263.
113. EscottR. E. A. and Chandler D. W.; J. Chromatogr. Sci. 27 (1992) 134.
96

114. Popenoe D.D., Morris S. J., Ill, Horm P. S. and Norwood K. T.; Anal. Chem. 66
(1994) 1620.
115. Crescenzi C., Di Corcia A., Marcomini A.and Samperi R.; Anal. Chem. 34 (1995)
1797.
116. Infante R. and Torres A.; Gas Chromatography-Mass Spectrometry Capillary
Column for Environmental Applications LC-GC 10 (1992) 120.
117. Trehye M. L.Gledhill W. E. and Orth R. G.; Anal. Chem. 62 (1990) 2581.
118. Rudewicz P. and Munson B.; Anal. Chem. 58 (1986) 674.
119. Schneider E. and Levsen K.; Marcel Dekker, New York (1986) 512.
120. Schneider E., Levesen K., Boerboom A. J. H., Kistemaker P., McLuckey S. A. and
Przybylski M.; Anal. Chem. 56 (1984) 1987.
121. Field J. A., Barber L. B., n, Thurman E. M., More B. L., Lawrence D. L. and Peake
D. A.; Environ. Sci. Technol. 26 (1992) 1140.
122. Hunt S. L., Behr F. E.and Winter L. D.; Anal. Chem. 59 (1987) 2653.
123. Simms J. R., Keough T., and Ward S. R ; Anal. Chem. 60 (1988) 2613.
124. Ventura F., Caixach J. Figueras A. Espadaler I., Fraise D. and Rivera J.; Water
Research 23 (1989) 1191.
125. Siegel M. M., Rushung T. and Oppenheimer S.; Anal. Chem. 62 (1990) 322.
126. Catelani D. and Vandoni M.; Riv. Ital. Sost. Grasse 51 (1971) 13.
127. Message G. M., Practical Aspects of Gas Chromatography-Mass spectrometry,
Wiley-Interscience, New York 1984.
128. 129 Venura F., Caixach J., Romero J. and Espadaler I.; Water Sci. Technol. 25
(1992) 11.
97

129. Borgerding A. J. and Hites R. A.; Anal. Chem. 64 (1994) 1449.
130. Evans K. A., Dubey S. T., Kravetz L., Dzidic I., Gumulka J., Mueller R. and Stork
R.; Anal. Chem. 66 (1994) 699.
131. Levsen K., Wagner-Redecker W., Schaefer K. H., Dobberstein P.; J. Chromatogr.
A. 323 (1985) 135.
132. Pattanaargson S., Sangvanich Petson A. and Roengsumran S.; Analyst. 120 (1995)
1573.
133. Strife R. J., Ketcha M. M. and Schwartz; Mass Spectrom. 32 (1997) 1226.
134. Karas M. and Hillenkamp F.; Anal. Chem. 60 (1988) 2299.
135. Bomsen K. O., Schar M. and Gassmann E.; Biol. Mass Spectrum, 20 (1991) 471.
136. Cotter R. J.; Anal. Chem. 64 (191992) 1027.
137. Just U. Holzbauer H.,-R. and Resch M.; J. Chromatogr. A’ 667 (1994) 354.
138. Tanaka K Waki H., Ito Y, Akita S., Yoshida Y. and Yohida T.; Rapid Commun.
Mass Spectrom 2 (1988) 151.
139. Hillenkamp F., Karas M., Beavis R. C. and Chait B. T.; Anal. Chem. 63 (1991)
1193 A.
140. Karas M., Bachmann D., Bahr U. and Hillenkamp F.; Int. J. of Mass Spectrometry
and Ion Processes. 78 (1987) 53.
141. Nelson R. W., Dogruel D. and Williams P.; Rapid Commun. Mass Spectrom. 8
(1994) 627.
142. Just U., Holzbauer H. R. and Resch M.; J Chromatogr.A.667 (1994) 354.
143. Thomson B., Wang Z., Paine A., Rudin A and Lajoie G.; JOACS 72 (1995) 11.
144. Parees D. M., Hanton S. D., Willcox D. A.and Cornelic- Clark P. A.; Polymer Prep.
98

37(1992) 321.
145. Cumme G. A., Blume E., Blublitz R., Happe H. and Horn A.; J. Chromatogr. 791
(1997) 245.
146. Willetts M., Clench M. R., Greenwood R., Mills G . and Carolan V.; Rapid
Commun. Mass Spectrom. 13 (1999) 251.
99

C H A PT E R TH REE
Determ ination o f A lkylphenol Ethoxysulphonates and Related Surfactant M ixtures in R eagent W ater and Sea-
W ater by Solid Phase Extraction and H PLC .
3.0 Introduction
Anionic and non-ionic surfactants have been widely used for Enhanced oil recovery
(EOR) processes. Non-ionics have been used primarily as co-surfactants to improve the
behavior of surfactant systems. Non-ionics are much more tolerant of high-salinity brine,
but their surface-active properties (in particular reduction of interfacial tension (ITF)) are
not generally as good as those of anionics. Anionic surfactants have been the most
extensively used type of surfactant in EOR since they have good surfactant properties,
are relatively stable, exhibit relatively low adsorption on reservoir rock, and can be
manufactured economically. However, the very low cost anionic surfactants such as
petroleum sulphonates cannot be used for off-shore reservoirs where sea-water is the only
source of injection water, since they are not sufficiently salt tolerant [1].
Many papers have shown that it is possible to synthesize anionic surfactants that tolerate
high concentrations of multivalent cations [2-5], Anionic surfactants containing multiple
units of ethylene oxide (EO) and/ or propylene oxide (PO) in their mid-section were
found to satisfy many of the desired conditions. Commercial anionic surfactants of the
propoxy and ethoxy type are polydisperse in the PO- and EO-groups. Ethoxylated
anionic sulphonates are also fairly stable with respect to desulphonation by breaking of
the C-S bond, under ordinary reservoir conditions [6], Water solvolysis, F f catalyzed
hydrolysis, and nucleophilic (HS' and Cl') displacement reactions have , however, been
observed. Each and every one of these reactions can dominate the decomposition rate
under different conditions.
101

Although EO-sulphates are cheaper than the corresponding EO-sulphonates, they are
hydrolysed at high temperatures and low pH. The pH of injected seawater is normally
changed from about 8 to 4-6 due to the solubilization of CO2 and ion-exchange between
water and the reservoir rock. At 60 °C, the half life time for EO-sulphates is estimated to
be about 7 and 30 years at pH=5 and pH =8, respectively [7], The rate of hydrolysis
increases exponentially with increasing temperature.
Alkylphenol ethoxylatesulphonates (APEOS) (Figure 3.1a and b) are a class of anionic
surfactants. When the ethoxymer chain length of an APEOS is greater than three it is
completely soluble in sea-water [8], The development of APEOS and also alkylaryl
sulphonates (Figure3.1c) that are able to tolerate both hard water and high salinities is
therefore of great interest to the oil industry. Mixtures of these surfactants can be used
for the chemical flooding of off-shore oil reservoirs with the use of sea-water as the
injection fluid. Mixing the expensive APEOS with the less expensive alkyl aryl
sulphonates leads to a reduction in the cost of chemical flooding in comparison to the use
of APEOS alone [9], This is, according to Rosen [10], due to synergism in mixed micelle
formation. Usually, oilfield connate waters as well as the injection water for off-shore
situations , have a relatively high content of divalent cations.
102

Figure 3.1 Structure of (a) Nonylphenol Ethoxylatesulphonate. (b) Octylphenol Ethoxylatesulphonate. (c) A typical alkyl aryl sulphonate.
The use of alkyl aryl sulphonates for chemical flooding has been suggested by Puerto and
Reed [11]. For off-shore reservoirs, where sea-water is the only source of injection
water, low cost surfactants such as petroleum sulphonates cannot be used. These
materials are not sufficiently salt-tolerant. However, ethoxylated sulphonates have
proved to be more resistant toward multivalent cations, and hence there is current interest
in these surfactant systems [12,13].
The traditional method for the determination of anionic surfactants is based on a color
forming reaction with methylene blue [14,15], The method is, however, non-specific and

incapable of differentiating among individual compounds within the homologous series
of anionic surfactants.
High performance liquid chromatography (HPLC) is the most widely used technique in
surfactant analysis. Shamsi and Danielson [16] have compared the separation of long
chain-alkyl sulphate, alkanesulphonate and alkyl phosphate anionic surfactants on three
mixed-mode (RP8, RP4 and RP phenyl / anion-exchange) stationary phases. They
suggested that the RP phenyl /anion mixed-mode column is the most suitable for the
separation of a mixture of alkyl sulphate, alkane- sulphonate and alkyl phosphate
surfactants due to short analysis times and high peak efficiencies [17].
Fjeld and Austed [8] have reported a HPLC method for the separation of nonylphenol
ethoxylatesulphonate (NPEOS) and octylphenol ethoxylatesulphonate (OPEOS)
surfactants at sea-water salinity using two different mixed-mode reversed-phase/ion-
exchange columns (Cg/ SAX and Cig /SAX columns). They were able to separate the
different APEOS oligomers up to degree of ethoxylation of at least 15. Furthermore, the
oligomers of unconverted ethoxylated alcohols could be qualitatively detected and
impurities of the type R-(EO)-R could be analysed in one chromatographic
determination. They concluded that HPLC was an excellent quality test for commercial
APEOS.
104

3.1 Experimental
3.1.1 Reagents and Materials
A commercial NPEOS formulation manufactured by Hoescht and an OPEOS formulation
manufactured by PPG industries were gifts from Dr Tor Austad (Rogaland University
centre, Norway). Synthetic sea-water was purchased from BDH (Poole, Dorset, U.K.).
Graphitised carbon black (GCB) cartridges (500mg) were purchased from Supelco
(Poole, Dorset, U.K.). Strong Anion-Exchange (SAX) cartridges (200mg) were
purchased from Varian (Frampton Avenue, Harbor City, USA).
All solvents used were HPLC grade and were purchased from Fisher Scientific
(Loughborough, U.K.). All water used was Milli-Q grade. Ammonium acetate was
HPLC grade (Fisher Scientific). Acetic acid used was HPLC grade (Fisher Scientific).
3.1.2 Sample Pretreatment
In order to simplify the chromatograms obtained from the surfactant formulations,
residual non-ionic starting material was selectively removed by the use of SAX solid
phase extraction cartridges. The surfactant solutions were acidified to pH 3-4 with
glacial acetic acid. The cartridge was washed with methanol (5ml) and distilled water
(10ml). The acidified surfactant solution was passed through the cartridge which was
subsequently washed with 2% acetic acid in methanol (5ml) to selectively elute the non
ionic surfactants. The cartridge was then washed with methanol (5ml) before elution of
the anionic fraction in 2 M HC1 in methanol:water (50:50) (15ml). This was evaporated
105

to dryness and the now “pure” NPEOS and OPEOS were dissolved in the appropriate
solvent for further analysis.
3.1.3 Sample Preparation
All surfactants NPEOS, OPEOS and DBS were dissolved in synthetic sea-water/ distilled
water.
3.1.4 Solid Phase Extraction Methodology
NPEOS and OPEOS were dissolved in synthetic sea-water and distilled water. The
surfactant solutions were acidified to pH=3 (with conc. HC1) prior to extraction/
preconcentration by solid phase extraction (SPE). SPE was performed using a GCB
cartridge method based that developed by Di Corcia et al [18]. The method uses three
eluents:-
Eluent A. Dichloromethane/ methanol (70:30)
Eluent B. 25 mmol/L formic acid in dichloromethane/ methanol (90:10)
Eluent C. 5 mmol/L tetramethylammonium hydroxide (TMAOH) in
dichloromethane/methanol (90:10).
The extraction procedure was as follows:-
1. The cartridge were first washed with dichloromethane (DCM) (50ml),
methanol (MeOH) (50ml) and acetonitrile (ACN) (50ml) and left to
stand in ACN overnight.
2. Condition cartridge with:-
106

7ml eluent C.
7 ml methanol
30 ml acidified water (pH 2, with conc. HC1)
3. Sample added to cartridge
4. Cartridge washed with>
7 ml water
Air dried for 1 min
2 ml methanol
Air dried
5. Analytes extracted with:-
7 ml eluent A
7 ml eluent B
7 ml eluent C
The fractions obtained with eluent C were evaporated to dryness under steady steam of
N2 gas and redissolved in 1ml HPLC mobile phase (eluents A and B were discarded).
3.1.5 HPLC instrumentation and conditions
All HPLC analyses were performed on a Waters 600-MS gradient HPLC system. The
columns used were Alltech (Carnforth, Lancashire, U.K.) mixed-mode reversed-
phase/ion-exchange columns, mixed-mode RP8/ anion 100A, 7pm (150x4.6mm) and
mixed-mode RP18/ anion 100A, 5pm (150x4.6mm) and mixed-mode RP4/ anion 100A,
5pm (150x4.6mm). Fluorescence detection was carried out using a Jasco FP-920
(Cheltenham, U.K.) fluorescence detector, ^ex=225nm and ^em=295nm. Data were
107

output to a Hewlett Packard HP 3396A integrator. Injections (lOOpl) were made using a
Perkin-Elmer ISS-101 autosampler.
The mobile phase gradient used is shown in Table 3.1. All analyses of NPEOS were
completed using the C8/SAX column described above and all analyses of OPEOS were
completed using the C l8/ SAX column.
Time
(min.)
Flow Rate
(ml/min.)
Solvent A
Vol. %
Solvent B
Vol. %
Gradient
Curve
0 1 60 40 6
20 1 70 30 6
30 1 80 20 6
40 1 60 40 6
Table 3.1 Solvent A: Acetonitrile (ACN). Solvent B: Distilled water containing 0.1M Ammonium acetate (pH=4.7).
108

3.2 Results and Discussion
Austad and Fjelde [8,9] describe three HPLC methods based on mixed-mode reversed-
phase / ion-exchange columns of C4, Cg and Cig types for the analysis of alkylphenol
ethoxylatesulphonates and alkyl aryl sulphonates. These were used to quantify each of
the three surfactant groups at sea-water salinities. The HPLC gradient program they
employed is shown as Table 3.2.
Time
(min.)
Flow Rate
(ml/ min.)
Solvent A
Vol. %
Solvent B
Vol. %
Gradient
Curve
0 2 60 40 6
10 2 70 30 6
20 2 80 20 6
80 2 60 40 6
Figure 3.2 Solvent A: Acetonitrile. Solvent B: Distilled water containing 0.02 M Potassium dihydrogen Phosphate (KH2P 0 4(pH=4.7)).
3.2.1 Alkylphenol ethoxylatesulphonates
High performance liquid chromatography (HPLC) is an ideal technique for the analysis
of small molecules (mol. wt. <1000). This technique offers the speed and resolution of
gas chromatography without the need for the analytes to be volatile. Reversed-phase
high performance liquid chromatography (RP-HPLC) with a buffered mobile phase is a
powerful technique for separation of both neutral and ionic compounds. In the present
work, in order to extend the life time of all columns used and to make separation
109

compatible with the electrospray interface of the Quattro I mass spectrometer (which is
incompatible with the use of phosphate buffers), potassium dihydrogen phosphate
(KH2PO4), was replaced by ammonium acetate buffer solution. Ammonium acetate is a
good choice as a buffer system for LC-MS since it is>
(i) Chemically stable, non-toxic, inexpensive and readily available; (ii) a good buffering
medium in the pH range most useful for RP-HPLC; (iii) highly soluble in methanol and
acetonitrile (ACN); (iv) an excellent masking agent for residual silanol groups on
chromatographic media leading to greatly improved separation; (v) fully ionized and
almost neutral in water; (vi) compatible with all commonly used HPLC detectors (UV-
Vis, fluorescence, electrochemical); (vii) able to accelerate rates of proton equilibrium,
important for ionic compounds; and (viii) relatively volatile and easily removed when
used in conjunction with a mass spectrometer [19].
A secondary (and unexpected) benefit of the change of buffer system was a reduction in
the retention times for the individual ethoxylate oligomers, in comparison to the
published separations [8,9], without any adverse effect on their chromatographic
resolution. Thus the analyses of nonylphenol ethoxylatesulphonate and octylphenol
ethoxylatesulphonate were achieved with the simple ammonium acetate buffer system
and this was employed for all subsequent HPLC and LC-MS analyses.
Figure 3.2 shows a typical HPLC fluorescence chromatogram for NPEOS obtained
using the mobile phase conditions given in table 3.1 and a Cg/SAX mixed-mode column.
The chromatogram shows excellent resolution of NPEOS ethoxymers. The peak at
110

retention time (tr) = 25.46 min is NP2EO, (using the nomenclature NPxEO where x
represents the number of ethylene oxide units in the hydrophilic chain) and the peak at
6.61 min is NP13EO. The advantage of this system is that it utilises solvents which are
compatible with reversed-phase conditions.
5EO6EO
7EO 4EO
8EO
3EO
9EO
2EO
0 5 10 15 20 25
Retention time (min)
Figure 3.2 HPLC chromatogram of NPEOS on C8/SAX column.
I l l

Figure 3.3 shows the typical chromatogram obtained for OPEOS using the gradient
program given in table 3.1 with the Cis/SAX column. The OPiEOS peak had a retention
time (rt) =27.69 minutes and the largest ethoxymer (OPgEOS) had a retention time of (rt)
=7.27min.3EO
4EO
5EO
6EO
7EO 8EO JU
10 20 30Retention time (min)
Figure 3.3 HPLC chromatogram of OPEOS on CVSAX
Figure 3.4 indicates that calculating an average of the values obtained from the HPLC
chromatogram of the NPEOS formulation gives an ethoxymer chain length ranging from
112

2-13 units with an average of approximately 6.00. An approximation of the mole fraction
of each ethoxymer indicated by the HPLC technique was calculated measuring the peak
height of individual ethoxymers in the HPLC data and quoting it as a percentage of the
total height (these calculations were also carried out using peak areas and no differences
were observed). The average number of ethoxymers was then calculated as a weighted
average based on these data. This is obviously a very approximate way of handling the
data in terms of calculating accurate mole ratios of individual ethoxymers but does enable
a simple comparison between the data obtained from HPLC and other techniques. This is
in broad agreement with earlier studies although the range of ethoxymer units was
reported in these to be from 2-15.
Figure 3.5 indicates that the average number of EO units calculated from the HPLC
chromatogram of OPEOS, approximately 3.87, is in broad agreement with the earlier
studies carried out HPLC only which gave an average EO number of 3.6 [8], The
calculated average number of EO units for OPEO was determined as above. However in
our studies, the range of EO units for the OPEOS was found to be from 1-8, and this is
not in agreement with the earlier work carried out by HPLC only, where the range was
reported to be from 2-6 units. The discrepancy does appear to arise from the assignment
of peaks in the HPLC chromatogram, with Austad and Fjelde [8] appearing to have
misidentified the peaks in their tentative assignment. The misidentification results from
the lack of pure ethoxymer standards (Austad and Fjelde are, in fact, cautious in their
peak assignments in the paper) and this result is a clear demonstration of the advantage of
the use of mass spectrometry either as MALDI or LC-MS in the analysis of polymers.
113

HPLC
%
16
0.220.442.87 1.111.05 8.1818.34 15.4518.7815.250.77 7.51MEO
Figure 3.4 Graph showing the average number of ethoxymer units calculated from the HPLC chromatogram for NPEOS.
4 0
3 5
3 0
2 5
2 0
1 5
1 0
2.1 93 0 .7 7 1 5.9 3 6 .593 5 .1 61 . 6 6IMEO
Figure 3.5 Graph showing the average number of ethoxymer units calculated from the HPLC chromatogram for OPEOS.
114

The method developed by Di Corcia et al [18] for the extraction of aromatic surfactants
and their biodegradation intermediates from raw and treated sewage worked successfully,
for APEOS on decreasing the concentration of the ion pair reagent,
tetramethylammonium hydroxide (TMAOH), to 5mmol/L. Excellent recoveries were
obtained for the extraction of APEOS from both reagent water and sea-water. The
recovery data for extraction of NPEOS and OPEOS from each of these matrices are
shown in Tables 3.3 and 3.4. As can be seen, excellent and reproducible recoveries were
obtained for both surfactants from distilled water and seawater. These are the first data
reported showing the extraction of these surfactants from sea-water by SPE and the good
sensitivity and recoveries do suggest that SPE followed by HPLC with fluorescence
detection is the method of choice for the determination of these compounds in surface
water samples.
Type of water Added in ppm Found in ppm Recovery % RSD %
Distilled water 1.50 1.52 101 6.9
(3 replicates) 0.61 0.60 98 1.25
Sea-water 1.51 1.62 106 0.96
(3 replicates) 0.61 0.63 103 0.08
Table 3.3. Recoveries of NPEOS from sea-water and reagent water using GCB, SPE cartridges and extraction method of Di Corcia [18].
Figures 3.6 (a,b) show calibration curves obtained for the analysis of standard solutions
of NPEOS, containing 0.90,1.20, 1.50, 1.80 and 2.00ppm dissolved in reagent water and
sea-water. A plot of NPEOS concentration against peak area gives a linear relationship
115

(R2=0.9693 and R2=0.9852). These data are based on five different concentrations of
NPEOS and the recovery is an average of three replicates.
COCDs_<COCDCL
3 0 0 0 0
2 5 0 0 0
0
0
0
0
00 0 .5 1 1 .5 2 32 .5
C o n c e n t r a t i o n p p m
<uCD
<COCD
CL
200000
150000
100000
50000
y = 88959xR = 0.9852
0.5 1 1.5 2
Concentration ppm
(b)
2.5
Figures 3.6 Calibration curves and unknown concentrations of NPEOS in (a) sea-water; (b) distilled water.
116

Type of water Added in ppm Found in ppm Recovery % RSD %
Distilled water
(3 replicates)
1.56 1.55 99 8.55
Sea-water
(3 replicates)
1.51 1.56 103 1.86
Table 3.4. Recoveries of OPEOS from sea-water and reagent water using GCB, SPE cartridges and the extraction method of Di Corcia [18].
Figures 3.7 (a,b) show calibration curves from five different concentrations of OPEOS in
(a) sea-water, and (b) distilled water. A plot of OPEOS concentration against peak area
in each of these matrices gives a good linear relationship (R2=0.9994 and R2=0.9975).
The average of three replicates when measuring from these calibration curves indicates
good results for OPEOS. As can be seen from Table 3.4, excellent recoveries of OPEOS
were obtained for reagent and sea-water samples at the 1.5 ppm level.
y = 230043X R2 = 0.9994500000
400000
300000
200000
100000
2.50.5
C o n c e n tr a tio n ppm
117
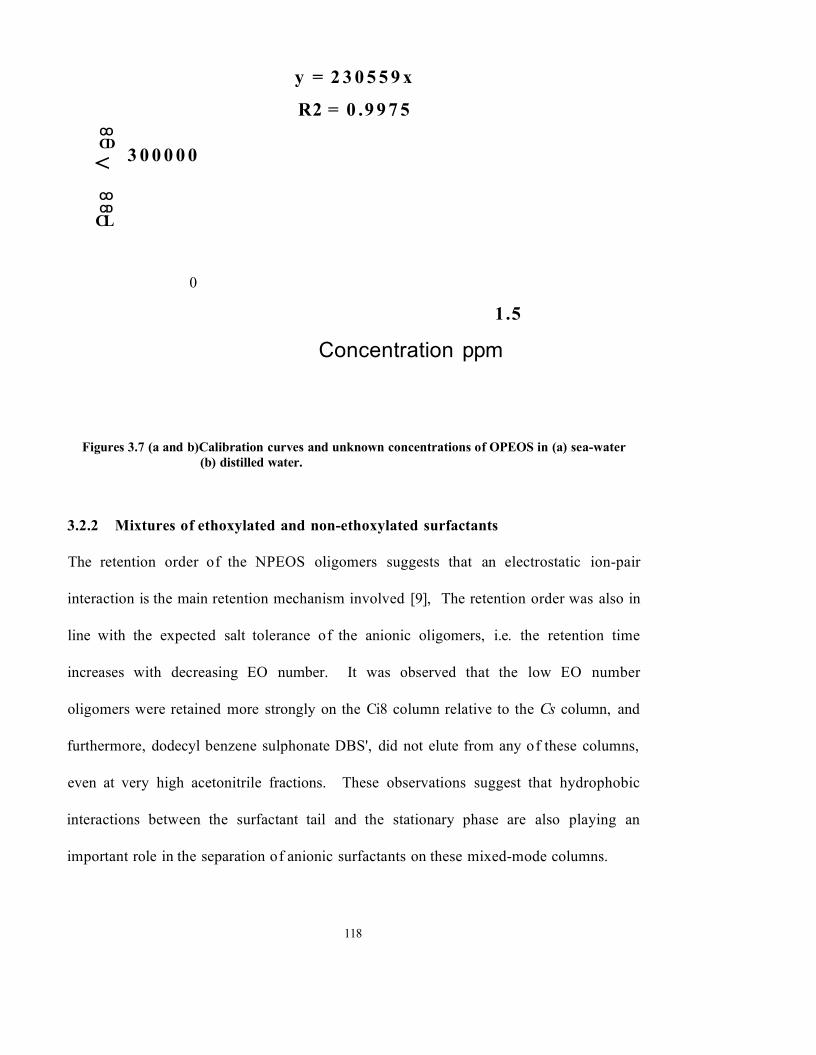
COCD<COCDCL
y = 2 3 0 5 5 9 x
R2 = 0 .9 9 7 5
3 0 0 0 0 0
0
1.5
Concentration ppm
Figures 3.7 (a and b)Calibration curves and unknown concentrations of OPEOS in (a) sea-water (b) distilled water.
3.2.2 Mixtures of ethoxylated and non-ethoxylated surfactants
The retention order of the NPEOS oligomers suggests that an electrostatic ion-pair
interaction is the main retention mechanism involved [9], The retention order was also in
line with the expected salt tolerance of the anionic oligomers, i.e. the retention time
increases with decreasing EO number. It was observed that the low EO number
oligomers were retained more strongly on the Ci8 column relative to the Cs column, and
furthermore, dodecyl benzene sulphonate DBS', did not elute from any of these columns,
even at very high acetonitrile fractions. These observations suggest that hydrophobic
interactions between the surfactant tail and the stationary phase are also playing an
important role in the separation of anionic surfactants on these mixed-mode columns.
118

In order to lower the hydrophobic interaction, Fjelde and Austad [9] used a C4/SAX
mixed-mode column for the separation of a mixture NPEOS and DBS'. The gradient
system used is shown in Table 3.5. The mobile phase contained 0.02 M potassium
dihydrogen phosphate (KH2PO4) and phosphoric acid (pH 4.7) as buffer, in order to
protonate the bonded amino-group, -NR2H+.
Time
(min.)
Flow Rate
(ml/min)
Solvent A
Vol. %
Solvent B
Vol. %
0 2 20 80
20 2 20 80
45 2 70 30
80 2 70 30
Table 3.5 Solvent A: Acetonitrile. Solvent B: distilled water containing KH2P04 as buffer (pH4.7).
In the present work we also replaced KH2PO4 by ammonium acetate as buffer to increase
the life-time and efficiency of the column. The solvent gradient used is shown in table
3.6.
Time Flow Rate Solvent A. Solvent B Gradient
(min.) (ml/min) Vol. % Vol. % Curve
0 1 60 40 6
35 1 80 20 6
40 1 60 40 6
Table 3.6 Solvent A: acetonitrile ; Solvent B: distilled water containing ammonium acetate as buffer (pH4.7).
119

Figure 3.8 shows the typical chromatographic separation obtained for a mixture
containing NPEOS and DBS" using the C4/SAX column. The resolution of individual
homologues of DBS' is not as sharp as that of the ethoxymers of NPEOS. The resolution
of the NPEOS oligomers is good and comparable to the previous results obtained using
the Cg mixed-mode column. The NPEOS distribution begins with the peak at 4.00 min
(NP13EOS) and ends with the peak at 20.51 min. DBS distribution begins with the peak
at 24.14 min and ends with the peak at 31.47 min.
C11C 12
C 10
C 13C96EO
5EO7EO
C 144EO8EO9EO
3EO10EO-13EO
10 20 30R etention time (min)
Figure 3.8 HPLC chromatogram of mixture of DBS and NPEOS using C4/SAX
The method previously described (Section 3.1.4) was used for the extraction of a mixture
of NPEOS and DBS' at a mole ratio of 1:3 from sea-water. The recovery data for the
extraction of these mixtures are shown in Table 3.7. These data are the mean of three
recoveries.
120

Surfactants Added Found Recovery % RSD %
(3 replicates) ppm ppm
DBS 1.83 1.60 87 5
NPEOS 0.61 0.63 103 0.08
Table 3.7 Recoveries of mixture of the DBS and NPEOS from sea-water using GCB, SPE cartridges and extraction method of Di Corcia [18].
Figures 3.9 (a and b) show calibration curves made by injecting standard solutions of
DBS' containing different concentrations of 1.20, 1.502, 1.703, 1.9 and 2.102 ppm and of
NPEOS containing 0.40, 0.50, 0.56, , 0.60, 0.63 and 0.70 ppm, dissolved in sea-water.
Plots of DBS' and NPEOS concentrations against peak area give linear relationships
(R2=0.9986 and R2=0.9861). These results were obtained from five different
concentrations of DBS' and six different concentrations of NPEOS.
121

160000 140000 120000
2 100000 ^ 80000 S> 60000
4000020000
0
y=71217x
1 1.5
Oomertration ppm
90000y = 116992x R2 = 0.986180000
70000
60000
50000
ro 40000
30000
20000
10000
0.2 0.80.4
Concentration ppm0.6
Figures 3.9 (a and b). Calibration curves of standard solutions and unknowns of (a) DBS' and ( b) NPEOS dissolved in sea-water.
122

3.3 ConclusionThe aim of this work was to produce high performance liquid chromatographic and solid
phase extraction methods which would separate and extract certain commercial surfactant
formulations from sea-water. Commercial NPEOS and OPEOS consist of complex
mixtures of oligomers which vary according to ethoxymer chain length. Data obtained
from the HPLC method indicate that the NPEOS formulation has an ethoxymer chain
length ranging from 2-13 units with an average of approximately 6.00 ( calculating an
average of the values obtained from HPLC techniques). This is in broad agreement with
earlier studies, although the range of ethoxymer units was reported in these to be from 2-
15. The HPLC data obtained for the OPEOS formulation suggests that it has an
ethoxymer chain length ranging from 1 -8 ethoxymer units with an average chain length
of 3.87. This is in contrast to earlier studies carried out by HPLC only, which suggested
that the chain length ranged from 2 to 6 ethoxymer units, with an average of 3.6.
Commercial mixtures of NPEOS and alkyl aryl sulphonates can be separated and
quantitatively analyzed by use of a mixed-mode reversed-phase/ ion-exchange HPLC
method using a the C4/SAX column.. The individual oligomers of the NPEOS are
separated well in the range 2-13. The alkyl aryl sulphonates of DBS are separated well
enough to enable quantitative determination of the relative amounts.
In order to quantify surfactant concentrations in surface water and sea-water, calibration
graphs were produced using standards for each surfactant. The peak area of surfactant
oligomers from extracted each of these matrices can then be compared to the graph
123

produced from the standards, and as a result, the unknown concentration of the surfactant
formulation can be estimated. A method for the extraction of NPEOS and OPEOS
surfactants from reagent water and sea-water using graphitised carbon black (GCB) solid
phase extraction cartridges has also been developed which gives excellent recoveries
from both reagent water and sea-water at ppm levels. Since HPLC has been used to
separate the complex mixtures which are surfactant formulations, this makes it possible to
determine individual oligomer concentrations.
124

Reference
1. Green W. D. and Willhite G. P.; “Enhanced Oil Recovery” Society of Petroleum
Engineers Textbook Series Vol. 6 (1998).
2. Maerker J. M. and Gale W. W.; SPE Res. Eng. 7 (1992) 36.
3. Kalpakci B., Arf T. G., Barker J. W., Krupa A. S., Morgan I. C. and Neira R. D.;
Proceedings of the 7th Symposium on Enhanced Oil Recovery of SPE; Socity of
Petroleum Engineers: Tulsa, OK, 1990, paper SPE 20220.
4. Taugbol K., Van Ly T. and Austad T.; Colloids Surface A: Physicochem. Eng.
Aspects 130 (1995) 83.
5. Wellington S. L. and Richardson E. A.; Proceedings of the Annual Technical
Conference of SPE; Society of Petroleum Engineers: Dallas, TX, 1995, paper SPE
30748.
6. Tally L. D.; Proceedings of the International Symposium on Oilfield Chemistry of
SPE; Society of Petroleum Engineers: Houston, TX, 1989, paper SPE 18492.
7. Tally L. D.; SPE Res. Eng. 3 (1988) 235.
8. Austad T. and Fjelde I.; Anal. Lett. 25 (1992) 957.
9. Fjelde I. and Austad T.; Colloids and Surface A: Physicochemical and Engineers
Aspects 82 (1994) 85.
10. Rosen M. J. and Scamehom J. F. (Ed), Phenomena in Mixed Surfactant Systems ACS
Symposium Series 311, American Chemical Society, Washington, DC, (1986) 144.
11. Puerto M. C. and Reed R. L.; “ Three-parameter representation of Surfactant-oil -
brine intreaction” SPE/ DOC paper 10678, presented at the Third Joint Symposium
on Enhanced Oil Recovery, Tulsa, Oklahama, April 4-7 (1982).
125

12. Shinoda K., Maekawa M. and Shibata Y.; J. Phys. Chem. 90 (1986) 1228.
13. Viswanathan K. V. and Somasundaran P.; Colloids Surface A: Physicochemical and
Engineers Aspects 26 (1987) 19.
14. Water J. and Taylor C. G.; “in Anionic Surfactants-Chemical analysis”,ed. J. Cross.
Marcel Dekker, New York, (1977) 193..
15. Longwell J. and Maniece W. D.; Analyst. 80 (1955) 167
16. Shamsi S. A. and Danielson N. D.; J. Chromatogr. Sci. 33 (1995) 505.
17. Shamsi S. A. and Danielson N. D.; Chromatographia 40 (1995) 237.
18. Di Corcia A., Samperi R. and Marcomini A.; Environ. Sci. Technol. 28 (1994) 850.
19. Lim C. K. and Peters T. J.; J. Chromatogr. A. 316 (1984) 397.
126

CH APTER FOUR
A comparison of LC-MS and M ALDI/MS Methods for Analysis of NPEOS and OPEOS
Surfactant Formulations
4.0 Introduction
Electrospray ionisation (ESI) is an atmospheric pressure ionsation (API) technique.
Thus, ionisation takes place at atmospheric pressure and ions are then transferred into the
vacuum system of the mass spectrometer. Ionization is achieved during the electrostatic
nebulisation of a solution of analyte ions by a large electrostatic field gradient ( 3kV/cm)
between a spray needle and counter electrode. Highly charged droplets are formed in a
dry “bath gas” of nitrogen. These charged droplets shrink as neutral solvent evaporates
until the charge density exceeds the Rayleigh limit and coulombic repulsion causes the
droplet to divide (Figure 4.1). The Iribane-Thomson [1,2] model suggests that the
smaller droplets continue to evaporate and the process repeats until evaporation of
charged solutes occurs.
© ©©
© @
Solvent evaporates from the droplets, causing the droplet to reduce in size, until coulombic repulsion occurs, causing ions to be ejected.
Figure 4.1 Mechanism of Ion Evaporation Stage of Electrospray
The evaporation of solvent is aided through the use of nebulising and “bath gases”
(usually heated nitrogen, although the use of electron scavenging gases such as SF6, has
been suggested for negative ion electrospray, in order to prevent electrical discharges).
128

The nozzle skimmer arrangement allows the ions to be sampled from atmospheric
pressure into the high vacuum of the instrument by passing through differentially pumped
(rotary pumps) chambers. A typical commercial electrospray source is represented in
Figure 4.2.
Curtain Gas (N2)
Spray Voltage (2-5KV)Nozzle Skimmer
Stainless Steel Spray Capillary
Nebulising Gas(Nz)
Counterelectrode i
Multipole Ion Bridge
Vacuum pumpFigure 4.2 Typical Commercial Electrospray Source with Nozzle/ Skimmer
Arrangement and Drying Gas.
Electrospray ionisation was originally described by Dole et al [3,4], who examined the
intact ions of synthetic polymers in excess of 100 kDa RMM, with detection by Faraday-
cage. No other data were published in the following ten years until Fenn et al [5,6] used
ESI with a quadrupole mass analyser. Almost simultaneously, the work was
independently reproduced by a Russian group using a magnetic sector instrument. They
demonstrated the fundamental aspects of ESI, the analysis of modest molecular weight
biomolecules and its ability as an interface for combining liquid chromatography and
mass spectrometry [7].
Although the electrospray process is a “soft-ionization” method, structural information on
analytes can also be easily achieved by collision-induced fragmentation with a suitable
129

adjustment of the electrical field existing in the intermediate-pressure desolvation
chamber located between the ionization source and the mass analyzer region, so called
“cone-voltage” fragmentation.
A number of liquid chromatographic methods have been proposed for determining those
analytes of environmental interest that are not amenable to analysis by the gas
chromatography/mass spectrometry technique. However, because of the legal
implication of many environmental data, coupling liquid chromatography (LC) with mass
spectrometry (MS) is key for the future of LC procedures. Electrospray ionisation (ESI)
has rapidly emerged as a very promising technique for interfacing LC to MS. The
LC/ES/MS system has proven to be a sensitive technique for analyzing compounds of
environmental interest that exist as ions in solution [8,9],
Matrix-assisted laser desorption/ionisation-mass spectrometry (MALDI-MS) permits the
analysis of high molecular weight compounds with high sensitivity. MALDI is a method
that allows for the ionisation and transfer of a sample from a condensed phase to the gas
phase in a fashion similar to fast atom bombardment (FAB). The primary difference
between MALDI and FAB is that while FAB uses an atom or ion beam and a liquid
matrix, MALDI uses a solid matrix, and the ionising beam is laser light. Ion formation in
MALDI is accomplished by directing a pulsed laser beam onto a sample suspended or
dissolved in a matrix. The matrix plays a key role in this technique by absorbing the laser
light energy and causing the matrix material to vaporize. (The vaporized matrix will
carry some of the sample with it). Once in the gas phase, the matrix may play a role in
130

the ionisation of the analyte molecules. The charged molecules will then be directed by
electrostatic lenses from the ionisation source into the mass analyzer (Figure 4.3 shows
ionisation in a typical MALDI/ TOF instrument). Uncharged molecules will often react
with the matrix or other molecules to produce charged species, transferred
electrostatically into the mass analyzer. Once the molecules in the sample are vaporized,
time-of-flight mass analysis is often used to separate the ions according to their mass-to-
charge ratio (m/z).
Time-of -f l ight . Mass Analyser
..Extraction grid
Figure 4.3 A typical commercial MALDI-TOF system.
131

4.1 Experimental
4.1.1 Reagents and Materials
A commercial NPEOS formulation manufactured by Hoescht and an OPEOS formulation
manufactured by PPG industries were gifts from Dr Tor Austad (Rogaland University
centre, Norway). Strong Anion-Exchange (SAX) cartridges(200mg) were purchased from
Varian (Frampton Avenue, Harbor City, USA). Alpha-cyano-4-hydroxycinnamic acid
and 2,5-dihydroxybenzoic acid were purchased from Aldrich (Poole, Dorest, U.K.).
All solvents used were HPLC grade and were purchased from Fisher Scientific
(Loughborough, U.K.). All water used was Milli-Q grade. Ammonium acetate was
HPLC grade (Fisher Scientific). Acetic acid used was HPLC grade (Fisher Scientific).
4.1.2 Sample Pretreatment
In order to simplify the chromatograms and mass spectra obtained from the surfactant
formulations, residual non-ionic starting material was selectively removed by the use of
SAX solid phase extraction cartridges. The surfactant solutions were acidified to pH 3-4
with glacial acetic acid. The cartridge was washed with methanol (5ml) and distilled
water (10ml). The acidified surfactant solution was passed through the cartridge which
was subsequently washed with 2% acetic acid in methanol (5ml) to selectively elute the
non-ionic surfactants. The cartridge was then washed with methanol (5ml) before elution
of the anionic fraction in 2 M HC1 in methanol:water (50:50) (15ml). This was
evaporated to dryness and the now “pure” NPEOS and OPEOS were dissolved in the
appropriate solvent for further analysis.
132

4.1.3 HPLC instrumentation and conditions
All HPLC analyses were performed on a Waters 600-MS gradient HPLC system. The
columns used were Alltech (Carnforth, Lancashire, U.K.) mixed-mode reversed-
phase/ion-exchange columns, mixed-mode RP8/ anion lOOA, 7pm (150x4.6mm) and
mixed-mode RP18/ anion 100A, 5pm (150x4.6mm).
4.1.4 Liquid chromatography- Mass Spectrometry
All analyses were performed on a Quattro I (Micromass Manchester U.K.), mass
spectrometer, equipped with an electrospray ionisation (ESI) source. A Jasco Pu-980
intelligent HPLC pump system was used in this case. All other HPLC conditions were
as described above (see Table 3.1 in Chapter Three of this thesis for the HPLC gradient
systems employed). The mass spectrometer was operated in positive ion mode. A
capillary voltage of 3.5 kv, and a skimmer cone voltage of 30V were used. Mass spectra
were collected in full- scan mode, over the range 100- 1200 m/z at 3 s/scan. The source
temperature was maintained at 80°C. Nitrogen was used as the drying and nebulising gas.
4.1.5 MALDI-MS
All MALDI analyses were performed on a Finnigan Vision 2000 reflectron-based time-
of-flight (MALDI/TOF/MS) instrument. Nonylphenol ethoxylatesulphonates (NPEOS)
and octylphenol ethoxylatesulphonates (OPEOS) were dissolved in methanol :
water(50:50). Alpha-cyano-4-hydroxycinnamic acid (90mg/ml) and 2,5-
dihydroxybenzoic acid (90mg/ml) were dissolved in 0.1% TFA in methanol. Lithium
chloride (lOmg/ml) was dissolved in methanol. 200pl of the NPEOS or OPEOS
133

solutions , 40pl of matrix and lOjul of LiCl were mixed and 1 jul of the resulting solution
was placed on the stainless steel target of the instrument for analysis.
4.2 Results and DiscussionA study of both NPEOS and OPEOS surfactant formulations in aqueous samples has
been carried out by the combination of ion-exchange RP-HPLC and mass spectrometry.
Figure 4.4 shows the electrospray positive ion LC-MS base peak intensity chromatogram
of NPEOS, and selected mass chromatograms are given in Figure 4.5 (a)-(k). Using the
chromatographic conditions employing the ammonium acetate buffer system, the NPEOS
ethoxymers eluted between 18.32 to 31.12 minutes. Figure 4.6 (a)-(j) shows the mass
spectra obtained for each of the ethoxymers. Interestingly, the spectra for the NPEOS
oligomers in Figure 4.6 show that the peaks produced have m/z values corresponding to
NH4 adducts, the sodium ion presumably being completely displaced by the use of the
ammonium acetate in the mobile-phase. Ions corresponding to [M-Na+H+NFL^
adducts for NPEOS ethoxymers were observed at m/z 478, 522, 566, 610, 654, 698, 742,
786, 830 and 874.
Figure 4.7 shows the corresponding base peak intensity chromatogram for the analysis of
chromatograms are shown in Figure 4.8 (a)-(j). The mass spectra (Figure 4.9(a)-(h))
obtained differ by 44 Da relative to the various ethoxymers of OPEOS and the peaks
produced have m/z values corresponding to NFLf adducts. In electrospray positive ion
mode, the ions corresponded to [M-Na+H+NH4] adducts and are observable at m/z 377,
421, 465, 509, 553, 597, 641 and 685.
134

23.22
r~oo
v°
135
Figure 4.4 LC-ES-MS (positive ion) base peak intensity chromatogram of NPEOS surfactant.

06060002 Sm(Mn, 4x3) Scan ES+
Scan ES+ 830
1.48e5 Area
06060002 Sm (Mn, 4x3) 100-] 19.13
%-
06060002 Sm (Mn, 4x3)
IOO-i 19.86
06060002 Sm(Mn, 4x3)100q
% -
0
20.87
00
rTTi'iT p 06060002 Sm (Mn, 4x3)
100 ,
(g)%-l
7422.81e5
Area
22.11ScanES+
6982.84e5
A re a
06060002 Sm (Mn, 4x3)'i111 ■ i1111 r* " !'
!00i■
0-J
(d)25.93,26.60
'T ' 1' ' ' I
27.94
......... ...... ..28.48
ScanES+23.45 654
3.40e5Area
100-n 22.98.
06060002 Sm (Mn, 4x3)100-n , ' .
ScanES+ 610 ■
3.40e5 Area
24.59.25.13
06060002 Sm (Mn, 4x3)566
3.49e5Area
06060002 Sm(Mn, 4x3)100i
(c)
11' •1111" "t!06060002 Sm (Mn, 4x3)
lOOi
(b)
1
31.12
-T1-,1, , pv -r r'p - . i vp r .06060002 Sm (Mn, 4x3); Sm (Mn, 1x5) io0l - (a)
10.28
Scan ES+ 522
3.18e5 Area
Scan ES+ 478
2.45e5 Area
*' ‘ ■' 1 1 1 ■'H'1'1 ' ' I r ■" I"”*! ■ 1 ' , I23.22.^ 24A59 ^26.20
20.90 « A A A 28.21%:0.06
o-7.86,
• , n-9̂ a;■/ \ / 19.0
Scan ES+ BPI
7.2 le5 Area
31.32,/X.
^ I'' " 1 I 1 1 r1 T 1 ' " I " 1 ''I ............... 1 'T - '- '- '- l ' ' ' 1 T r l TI*1‘ " 'I I I I ....... I' M .■,r m - T r T lv r r . I . I I VI I | , I . , I , I I r t5.00 10.00 15.00 20.00 25.00 30.00 35.00 40.00 45.00
Retention Time (min.)
Figure 4.5.Individual mass chromatograms (a)-(j)and (k), the base peak mtcnsrty masschromatogram, for the positive ion LC-ES-Ms analysis of a commercial NPEOSsurfactant.
136

Scan ES+ 2.43e5
06060002 940(31.525)
100-j ....478
480
0 n i r r w n r n r ^ 06060002 849 (28.476)
lOOn
Scan ES+ 4.05e5522
06060002 783 (26.264)
IOOt 566
568
06060002 734 (24.623)
10<bScan ES+
8.4 le5610
612
06060002 705(23.651)654
06060002 659 (22.109) 100-,
%A(e)
0-f'.vr... .06060002 622(20.869) 100-
%-(d)
742
743/
06060002 592 (19.864)1111 i1 1 ■ i •
786
06060002 570(19.127)
100-,fl>)
830
363
364
■ IT'111"
831
1832
w,—06060002 543 (18.223)
■ (a)363
364
874
873'
Scan ES+
1 © 6556-
Qj„ ,.,7-.,.T.r„ , , rr. ,.,-rvfn rv,4i"l-rr i i • .
ScanES+8.21e5
Scan ES+ • j 5.43e5 I
Scan ES+
1 ( c ) 787
363
V -Vi i i‘ i i iScan ES+
!.65ei
ScanES+9.76c4
0 ■fiii) 'i' 1'> I'i'i'i'i'i fl'pM ,"|'i 1 ....100 300 -300 400 500 600 700 800 900 1000 1100 120Q
m/z
875
.876
Figure 4.6. Electrospray positive ion mass spectra for the individual oligomers (aMl) ° f a commercial NPEOS surfactant formulation.
137

<s
Os
OS
. 00
. o
o
VO
. o. o- o
-©- o
d.
00
VO•ovo'
OS
©
rf\.
138
Figure 4.7. LC-ES-MS (positive ion) base peak intensity chropiatogjrain of commercial OPEOS surfactant.
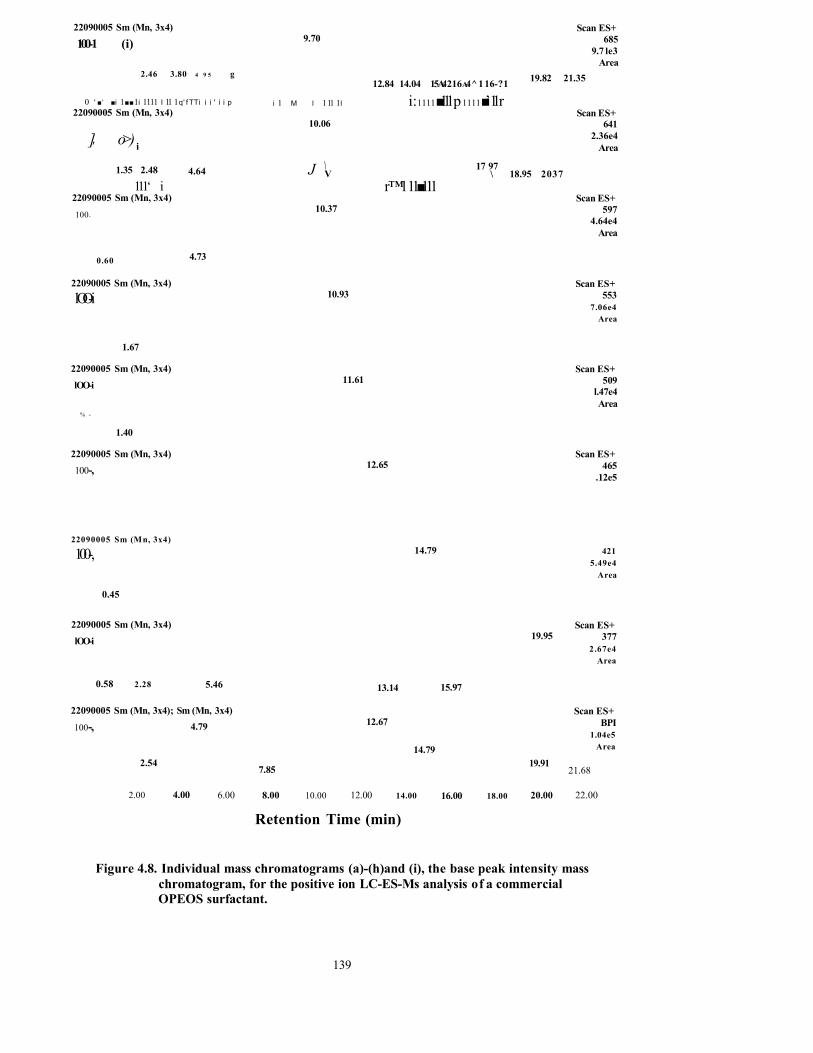
22090005 Sm (Mn, 3x4)
100-1 (i) 9.70
2.46 3.80 4 9 5 g12.84 14.04 15A4216a4^116-?1
Scan ES+ 685
9.7 le3 Area
19.82 21.35
0 ' ■ ‘ ■ i 1 ■ ■ 1 i 1111 I 11 1 q' f TTi i i ' i i p22090005 Sm (Mn, 3x4)
i 1 M l 1 11 1 l
10.06
i: 1111 ■111 p 1111 ■ ’11 rScan ES+
641
] o>)' i2.36e4
Area
1.35 2.48 4.64 J \ 17 97 V \ 18.95 2037
111 ‘ i22090005 Sm (Mn, 3x4)
r™111 ■111Scan ES+
10.37 5974.64e4
Area
100-
4.730.60
22090005 Sm (Mn, 3x4) Scan ES+10.93 553
7.06e4Area
lOO-i
1.67
22090005 Sm (Mn, 3x4) Scan ES+11.61 509
l.47e4Area
lOO-i
% -
1.40
22090005 Sm (Mn, 3x4) Scan ES+12.65 465
.12e5100-,
22090005 Sm (Mn, 3x4)14.79 421
5.49e4Area
100-,
0.45
22090005 Sm (Mn, 3x4) Scan ES+19.95 377
2.67e4Area
lOO-i
0.58 2.28 5.46 15.9713.14
22090005 Sm (Mn, 3x4); Sm (Mn, 3x4) Scan ES+12.67 BPI
1.04e5Area
4.79100-,
14.792.54 19.917.85 21.68
2.00 4.00 6.00 10.00 12.00 22.008.00 14.00 20.0018.0016.00
Retention Time (min)
Figure 4.8. Individual mass chromatograms (a)-(h)and (i), the base peak intensity mass chromatogram, for the positive ion LC-ES-Ms analysis of a commercial OPEOS surfactant.
139

22090005 456 (9.635) Scan ES+685 1.77e4lOO-i
138686196212
530 590 -711364
Scan ES+22090005 474(10.017)641 3.30e4
% - 642112 335149 538
22090005 490 (10.353) Scan ES+
lOO-i
% -
(f)597 5.63e4
120 335598/
22090005 515(10.868)
100-, 553Scan ES+
8.70e4
% -
0-
(e)554/
■pi-TpScan ES+
9.73e422090005 554(11.647)
lOOn (d)
%
509
510/
22090005 609(12.709)*rr*n Scan ES+
1.18e5lOO-i
%
465(C)
336466/
.'i-rtH-i-rfyrVrfp̂ rr-vprr TfTW ■ r *;22090005 712(14.625)
100-
(b)421
Scan ES+ 5.02e4'
%■ 292 374
I 122090005 1008(20.021)
823 841
Scan ES+377 2.84e4'lOO-i
212 248%- 378110 .249166 735 769 888 936461
Da/e300 400100 200 500 600 1000700 900800
m/z
Figure 4.9. Electrospray positive ion mass spectra for the individual oligomers (a)-(h) of a commercial OPEOS surfactant formulation.
140

MALDI-TOF mass spectrometry has been used widely in the analysis of synthetic
polymers by addition of an excess of a suitable metal cation during sample preparation
[10-15], Addition of a metal cation leads to the production of solely [M+cation]+species.
Just and co-workers [16] added an excess of lithium chloride to alkylphenol ethoxylates
before analysis by MALDI-TOF. This led to the production of almost solely lithium
adducts instead of the mixture of potassium and sodium adducts which they observed
before the addition of lithium chloride. Their reason for adding lithium to the samples
was to counteract the low-mass discrimination shown in the comparison between
MALDI-TOF and SFC.
The addition of lithium chloride had the effect of suppressing the discrimination, enabling
them to discern the lower ethoxymers. The most likely explanation of this effect is
probably due to the fact that in producing solely [M+Lif adducts, the signal due to each
ethoxymer is represented by one peak, whereas without the addition of lithium chloride,
the signal for each ethoxymer is split between two peaks (the sodium and potassium
adducts) which are much smaller in intensity than if the signal were represented by one
peak. Therefore, the addition of lithium chloride to the samples before crystallisation
should counteract this phenomenon and lead to much less complicated spectra.
Willetts et al [17] recently reported a MALDI-TOF/ MS method for the analysis of nonyl
phenol ethoxylate non-ionic surfactants by the addition of lithium chloride to produce
solely [M+Li]r adducts in surface water samples.
141

In the present work, analysis of both NPEOS and OPEOS surfactants using MALDI-MS
has been demonstrated. The addition of lOpl of a lOmg/ml solution of lithium chloride
results in a relatively simple mass spectrum for NPEOS (Figure 4.10). The spectrum
exhibits an envelope of [M-Na+2Li]+ adduct ions at m/z (429.2, 473.3, 517.7, 561.4,
605.9, 649.3, 692.5, 737.3, 781.6, 825.1, 869.0 and 912.7). Hence these data suggest that
the surfactant formulation contained molecules with between 2-13 ethylene oxide (EO)
units.
The MALDI-MS spectrum of OPEOS (Figure 4.11) obtained with addition of lithium
chloride, shows excellent resolution of individual ethoxymers in this type of surfactant.
A typical envelope of intense peaks representing [M-Na+ 2Li]" adducts for 1-8 ethylene
oxide-containing species was produced (m/z 370.9, 415.1, 459.5, 503.8, 547.9, 591.9,
636.2, and 680.5 ) with an average chain length of 3.14 units.
142

Inte
nsity
o
o- ir, ooiv~>(Noo
O r o
00VO
- ovr>csO nVO
cnONrfvo
Or ° vo
o - ol/*>
ovr,
<NON<N
oo’3"(Ncn-3rcn omNT)ro oo<N
143
Figu
re
4,10.
MAL
DI/
MS
sfpect
rpm
of p
NPEO
S su
rfac
tant
.

Inte
nsity
O ^ N
C'SsHC/2COccJ
- IT>00
I o S- o 1 00
o - oU~)oooVO
o - oVOC\o\cn
o - ovr>
O- o’nT
m
o VOVO
<n00
ooo
oo
144
Ffgu
re 4*1
1 M
ALDI
/MS
ijpec
trpm
of a
0PE
0S
surf
acta
nt.

A comparison of the results obtained from two different techniques (MALDI-MS and
LC-MS) for NPEOS and OPEOS surfactants is given in Figures 4.12 and 4.13. An
approximation of the mole fraction of each ethoxymer indicated by each technique was
calculated measuring the peak height of individual ethoxymers in the LC/MS and
MALDI/MS data and quoting it as a percentage of the total height. The average number
of ethoxymers was then calculated as a weighted average based on these data. This is
obviously a very approximate way of handling the data in terms of calculating accurate
mole ratios of individual ethoxymers but it does enable a simple comparison between the
data sets to be made. As can be seen from Figure 4.12 for NPEOS, the data obtained for
average length of the ethylene oxide chain (EO number) are in reasonable agreement,
with values of 6.46 from LC/MS and 6.32 from MALDI/MS. In earlier studies conducted
by HPLC, only the average EO number was determined as 6.19 [18]. However, in the
present study, the ranges of EO units found by LC/MS (3-12) and MALDI/MS (2-13) are
narrower than that reported in the earlier HPLC work (2-15).
Figure 4.13 indicates that the average number of EO units calculated for OPEOS by
LC/MS and MALDI/MS techniques is in broad agreement (3.72 and 3.14 respectively)
and these data are also in agreement with the earlier studies carried out by HPLC which
gave an average EO number of 3.6 [18]. However in our studies the range of EO units
for the OPEOS was found to be from 1-8 and this is not in agreement with the earlier
work carried out by HPLC only, in which the range was reported to be from 2-6 units.
145

25 -\
15-J
15C2 842 518 1.55 Q13128 1865 1658
22211.52 1.219.7 2D8 17.58565343
ED
Figure 4.12 Graph showing the average number of ethoxymer units calculated from LC-MS and MALDI/ MS chromatogram for NPEOS.
ED
Figure 4.13 Graph showing the average number of the ethoxymer units calculated From LC-MS and MALDI/ MS chromatogram for OPEOS.
146

4.3 Conclusion
The LC-ESI-MS and MALDI/MS techniques have been shown to be very useful for the
analysis of commercial NPEOS and OPEOS surfactant formulations. LC-ES-MS spectra
have shown a range of ethoxymers units for NPEOS surfactants from 3-12 and ethoxymer
units for OPEOS surfactants from 1-8.
MALDI/MS has been shown to be the most useful method for the analysis of NPEOS and
OPEOS surfactants. The addition of lithium chloride as a source of lithium ions during
sample preparation was shown to produce solely [M+Li]^ adducts, suppressing the
formation of sodium and potassium adducts and producing a much simpler spectrum.
MALDI/ MS spectra have shown a range of ethoxymer units for NPEOS from 2-13 and
average ethoxymer units for OPEOS from 1-8.
Both of the mass spectral techniques provide sufficiently precise measurements of the
molecular weight of each surfactant species. Data obtained show the average number of
ethoxymers for NPEOS to be 6.46 by LC-MS and 6.32 by MALDI/ MS. The average
for OPEOS was 3.72 by LC-MS and 3.14 by MALDI/ MS. Hence the MALDI/ MS
results agreed well with LC-MS results for NPEOS and OPEOS surfactants.
147

Reference
1. Iribane J. V. and Thomson B. A.; J. Chem. Physics 64 (1976) 2287.
2. Thomson B. A. and Iribane J. V.; J. Chem. Physics 71 (1979) 4471.
3. Dole M., Mack L.L., Hines R. L., Mobley R. C., Ferguson L. D., Alice M. B.; J.
Chem. Physics 49 (1968) 2240.
4. Mack L.L., Kralik P., Rheude A. and Dole M.; J. Chem. Physics 52 (1970) 4977.
5. Yamashita M. and Fenn J. B.; J. Chem. Physics 88 (1984) 4451.
6. Yamashita M. and Fenn J. B.; J. Chem. Physics 88 (1984) 4671.
7. Whitehouse C. , Dreyer R. N . , Yamashita M. and Fenn J. B.; Anal. Chem. 57 (1985)
675.
8. Coboy J. J., Henion J. D., Martin M. W. and Zweigeinbaum J. A. ; Anal. Chem. 62
(1990) 800.
9. Popenoe D. D., Morris S. J., Horn P. S. and Norwood K. T.; Anal. Chem. 66 (1994)
1620.
10. Bahr U., Deppe A., Karas M. and Hillenkamp F.; Anal. Chem. 64 (1992)2866.
11. Thomson B., Suddaby K., Rudin A. and Lajoie G.; Rue. Polym. J. 32 (1996) 2 239.
12. Trathnigg B., Maier B., Schulz G., Kruger R-P and Just U.; Macromol. Symp. 110
(1996) 231.
13. Danis P. O., Karr D. E., Xiong Y. and Owens K. G.; Rapid Commun. Mass Spectrom.
10(1996) 862.
14. Schriemer D. C. and Li L.; Anal. Chem. 69 (1997) 4169.
15. Chaudhary A. K., Critchley G., Diaf A., Beckman E. J. and Russell A. J.;
Macromoleculecules 29 (1996) 2213.
148

16. Just U., Holzbauer H. R. and Resch M.; J Chromatogr. A. 667 (1994) 354
17. Willetts M., Clench M. R., Greenwood R., Mills G . and Carolan V.; Rapid Commun.
Mass Spectrom 13 (1999) 25.
18. Austad T. and Fjelde I.; Anal. Lett. 25 (1992) 957.
149

CHAPTER FIVE
A Study of the Degradation of Nonylphenol Ethoxysulphonate Surfactants by Chemical and
Biological Oxidation

5.1 Chemical Oxidation of Nonylphenol Ethoxylatesulphonate
(NPEOS) Surfactants.
Introduction
In these studies, Fenton’s reagent has been used for the oxidation of commercial NPEOS
surfactant. The oxidation products have been identified using different techniques
(HPLC, MALDI/MS and LC-MS). The main aim of this investigation was to assist in the
interpretation of data that were obtained from the biodegradation of NPEOS by using
microorganisms. These data are also of interest, however, for considerations of the
potential of chemical oxidation for the treatment of waste streams containing these
surfactants.
Industrial and municipal waste waters contain a wide variety of pollutants, both organic
(phenols, aromatics, amines, chlorinated compounds) and inorganics (sulphides, heavy
metals). Technologies for the destruction or detoxification of hazardous organic wastes
are in urgent demand, particularly since growing restrictions are placed on land disposal
and the need to clean up existing waste sites. Optimal wastewater treatment is today’s
challenge. On the one hand there are very different kinds of wastewater composition, and
on the other there are many different kinds of possible treatments. Depending on final
water quality requirements and economic aspects, some processes are better suited than
others. Physical separation of suspended solids, oils and greases and biological
treatments have been shown to be very economic and reliable systems for most cases
(municipal wastewater, food and farm processing water, etc.). There are, however, cases
in which the effectiveness of these treatments drops (soluble substances for physical
151

separation, non-biodegradable and/or toxic substances for biological treatments). For this
last case, which is common in chemical processing wastewater, different chemical
processes, most of them based on oxidation-reduction reactions, are being applied.
Processes such as chlorination, ozonation, UV irradiation, electrochemical treatments and
processes based on OH*radical attack have been investigated. Although these treatments
have proved effective, they are expensive and commercially unattractive (in comparison
to physical and biological methods).
Chemical oxidation of dissolved organic compounds and micropollutants is increasingly
being considered in water and wastewater treatment because the technology has the
potential of converting harmful organic compounds to innocuous inorganic compounds
such as carbon dioxide and water. In chemical oxidation processes, structural changes
and changes in chemical properties arise as a result of oxidative degradation reactions,
and higher percentages of oxygen appear in the products, in the form of alcohols,
carboxylic acids etc. Oxidation of organic compounds with oxidants such as ozone or
OH*radicals usually yields more oxidized ones which are more easily biodegradable
[1-4]. This is the general idea that makes some investigators think of a combination of a
chemical oxidation process followed by a biological one [5,6],
Sawyer [7] has investigated in detail the chemistry associated with molecular oxygen,
particularly the reactivity of oxygen-containing reagents such as hydrogen peroxide,
oxygen radicals e.g. hydroxyl radicals OH* and the metal-induced activation of dioxygen
and its subsequent behavior.
152

The use of Fenton’s reagent (a common method to produce hydroxyl radicals) in
advanced oxidation processes (AOPs), is considered highly promising for treating
refractory compounds. In 1894 Fenton [8] first developed the chemistry of a convenient
and widely used method for the elimination of organic pollutants from aqueous solutions.
However, its application as an oxidising process for destroying toxic organic was not
practiced until the late 1960s [9], Since then, it has been used in direct oxidation of
phenolic wastes, of refractory organics in municipal waste-water, and of
nonbiodegradable industrial wastes to render them more biodegradable for aerobic and
anaerobic processes. Fenton’s reagent is one of the best known metal-catalyzed oxidation
reactions of water-miscible organic compounds. It consists of a ferrous salt such as
Fe(II)S0 4 (or any other ferrous complex), and H2O2 . The mixture, at low pH (i.e. pH
3.5), results in Fe2+ catalytic decomposition of H2O2 and proceeds via a free radical chain
process which produces hydroxyl radicals [10,11], The use of Fenton’s reagent is
convenient [12] because it does not load the system with harmful or toxic substances, it
does not lead to a salinity increment ( ferric ions are precipitated as hydroxide), and it
does not require complicated equipment. The so-called Fenton sludge, produced by
neutralization after the reaction, does create subsequent disposal problems but constitutes
the only limitation of the process.
There are mechanisms proposed for the reaction of hydrogen peroxide with Fe2+and Fe3+.
The “classical” mechanisms for these reactions involve hydroxyl radical intermediates
that can attack organic compounds. The classical reaction of Fe2 with H2O2 , known as
the Fenton reaction [13,14], generates OH* in the rate-limiting step (eql); the OH#may
153

subsequently be scavenged by reaction with another Fe2 (eq2) or they may react with an
organic compound.
Fe2++ H 20 2 ------ ► Fe3+ + OH' +HO" (1)
OH + Fe2* ► HO" + Fe3* (2 )
Fe3 catalytically decomposes H2O2 to O2 and H2O. The classical “radical chain”
mechanism proposed for the simple Fe3+(aq) system (i.e., no complexing ligands other
than water) involves OH* and hydroperoxyl radicals (H02#) and is shown in equations 3-
7 [13,15,16]:
Fe + H20 2 Fe— OOH2+ H + (3)
Fe-OOH -► H02 + F e2+ (4)
F e % HO' > Fe + H02 (5)
Fe3" + HOz — ► Fe2++ H+ + 0 2 (6)
o h " + h2o2 ► h2o +ho2 (7)
In the presence of excess peroxide, [Fe2 ] is small relative to [Fe3+], since reaction 4 is
generally much slower than reaction 1 [16]. As can be seen in equation 7, H2O2 can act
as an OH* scavenger as well as an initiator. Due to the formation of Fe3 during the
reaction, it is normally accompanied by the precipitation of Fe(OH)3. The reaction can
154

also lead to the cleavage of C-C bonds and in some cases complete mineralization, giving
rise to CO2 and H2O. For this reason, Fenton’s reagent has been extensively applied in
the waste water treatment of resistant pollutants.
Molecular oxygen is generally not a strong enough oxidant to oxidize most organic
compounds. However, wet air oxidation (WAO) and advanced oxidation reactions may
be successfully used for the treatment of wastewater. These techniques use dissolved
oxygen at elevated temperature and pressure to enhance the oxidation process and Fenton
chemistry can be used to catalyse these reactions [17].
Surfactants belong to a class of organic pollutants resistant to biological degradation [18]
and consequently they have received increasing attention [19] in the last few years
because of their large-scale domestic and industrial use, resulting in significant
environmental problems [20]. Hence there is interest in methods for their disposal and
catalysed WAO offers one such route.
155

5.1.1 Experimental
S. 1.1.1 Reagents and Materials
A commercial NPEOS formulation manufactured by Hoescht was gifted from Dr Tor
Austad (Rogaland University centre, Norway). Hydrogen peroxide solution (30% v/v)
was purchased from BDH (Poole, Dorset, U.K.). Iron(II)sulfate heptahydrate (99 %)
was purchased from Sigma-Aldrich (Gillingham, Dorset, UK). Strong Anion-Exchange
(SAX) cartridges (500mg) were purchased from Varian (Frampton Avenue, Harbor City,
USA). All solvents used were HPLC grade and were purchased from Fisher Scientific
(Loughborough, U.K.). All water used was Milli-Q grade. Ammonium acetate and
acetic acid used were HPLC grade (Fisher Scientific)
51.1.2 Sample Pretreatment
In order to simplify the chromatograms and mass spectra obtained from the oxidation
products from the various formulations, residual non-ionic starting material was
selectively removed by the use of SAX solid phase extraction cartridges. The surfactant
solutions were acidified to pH 3-4 with glacial acetic acid. The cartridge was washed
with methanol (5ml) and distilled water (10ml). The acidified surfactant solution was
passed through the cartridge which was subsequently washed with 2% acetic acid in
methanol (5ml) to selectively elute the non-ionic surfactants. The cartridge was then
washed with methanol (5 ml) before elution of the anionic fraction in 2 M HC1 in
methanol:water (50:50) (15ml). This was evaporated to dryness and the now “pure”
NPEOS was dissolved in distilled water.
156
5.1.1.3 HPLC instrumentation and conditions
All HPLC analyses were performed on a Waters 600-MS gradient HPLC system. The
column used was an Alltech (Carnforth, Lancashire, U.K.) mixed-mode reversed-
phase/ion-exchange columns, mixed-mode RP8/ anion 100A, 7pm (150x4.6mm).
Fluorescence detection was carried out using a Jasco FP-920 (Cheltenham, U.K.)
fluorescence detector, Xex.=225nm and Xem=295nm. Data were outputted on a Hewlett
Packard HP 3396A integrator. Injections (lOOgl) were made using a Perkin-Elmer ISS-
101 autosampler. The mobile phase gradient used is given in Table 3.1 (Chapter Three of
this thesis).
5.1.1.4 Liquid chromatography- Mass Spectrometry
All analyses were performed on a Quattro I (Micromass Manchester U.K.), mass
spectrometer, equipped with an electrospray ionisation (ESI) source. A Jasco Pu-980
intelligent HPLC pump system was used in this case and all other HPLC conditions are as
previously described. The mass spectrometer was operated in positive ion mode. A
capillary voltage of 3.5 kv, and a skimmer cone voltage of 30V were used. Mass spectra
were collected in full- scan mode, scanning over the range 100- 1200 m/z at 3 s/scan. The
source temperature was maintained at 80°C. Nitrogen was used as the drying and
nebulising gas.
157

5.1.1.5 MALDI-MS
MALDI analyses were performed on a Finnigan Vision 2000 reflectron based time-of-
flight (MALDI/TOF/MS) instrument. The oxidation products were dissolved in methanol
: water (50:50). 2,5-Dihydroxybenzoic acid (90mg/ml) was dissolved in 0.1% TFA in
methanol. Lithium chloride (lOmg/ml) was dissolved in methanol. 200pl of the oxidation
product solutions , 40pl of matrix and lOpl of LiCl were mixed and lpl of the resulting
solution was placed on the stainless steel target of the instrument for analysis.
5.1.1.6 Reaction Conditions
The optimized Fenton oxidation procedures were used under conditions proposed by Ito
et al [21]. The reaction was carried out in a three necked-flask fitted with a pressure
equalising dropping funnel, a nitrogen inlet and an outlet. A solution of FeSCL .7 H2O
(0.0175g, 3.6 mmol) in 25 ml of acidic water (pH 2.8) (5% sulphuric acid) was added to
stirred solution of NPEOS (O.lg, 0.35mmol) in 50 ml of acidic water (pH 2.8) (5%
sulphuric acid) followed by the dropwise addition of hydrogen peroxide solution 27%
w/v (0.25g, 2.2mmol) in 25 ml of water while the reaction flask was cooled in ice. The
reactions were repeated under a nitrogen sealed system and in an open system
respectively, but both systems showed the same oxidation products. After the addition of
hydrogen peroxide solution, the oxidation reaction mixture was stirred at room
temperature for a period of time which ranged from 1 to 5 hours.
158

5.1.1.7 Sample Preparation
Once the reaction was completed, 5% ammonia solution was added to adjust the pH to 9
in order to precipitate ferric ions as hydroxide, and then the suspension was filtered. The
aqueous reaction mixture was extracted with 3x100 cm3 of ethyl acetate. The organic
layers were combined and dried using magnesium sulphate, and the extract was
evaporated on a rotary evaporator to give a greasy residue and dissolved in 5ml (50:50)
methanol and water.
159
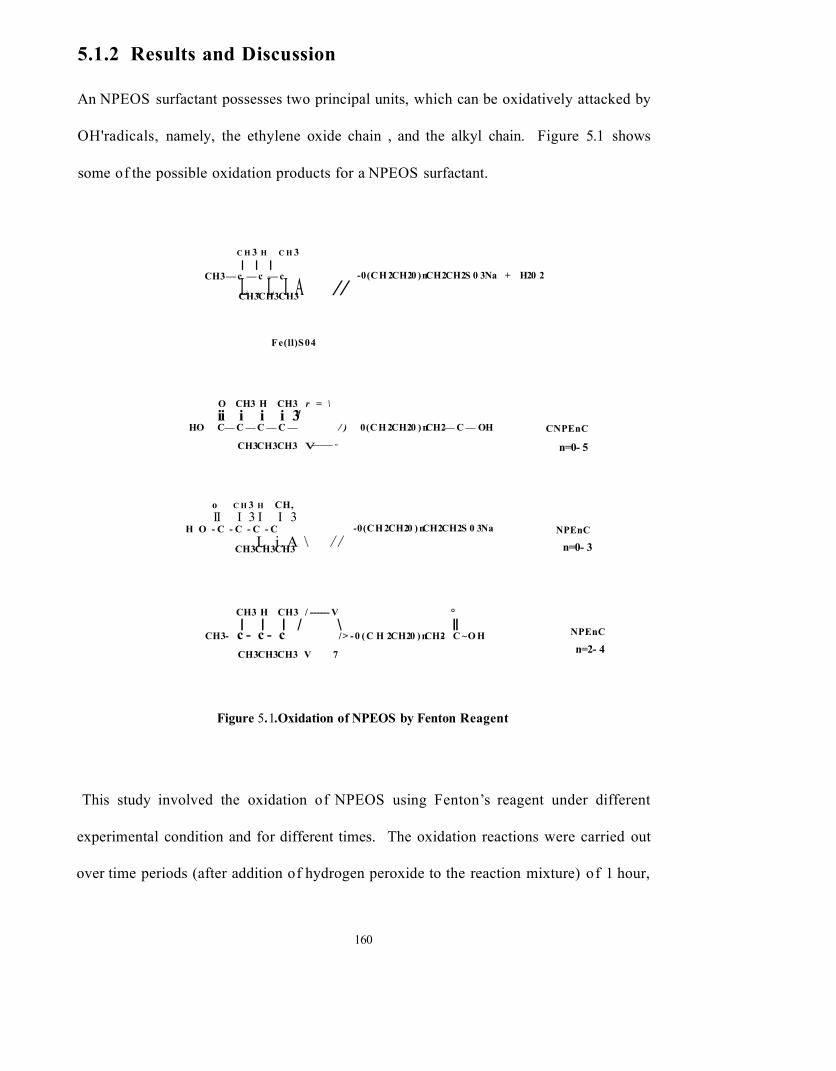
5.1.2 Results and Discussion
An NPEOS surfactant possesses two principal units, which can be oxidatively attacked by
OH'radicals, namely, the ethylene oxide chain , and the alkyl chain. Figure 5.1 shows
some of the possible oxidation products for a NPEOS surfactant.
c h 3 h c h 3 I I I
CH3 — c — c — cL . L I A //-0(CH 2CH20 )nCH2CH2S 0 3Na + H20 2
CH3CH3CH3
Fe(ll)S04
O CH3 H CH3 r = \ii i i i 3/
HO C— C — C — C — / ) 0(CH 2CH20 ) nCH2— C — OH
CH3CH3CH3 v— "
CNPEnC
n=0- 5
o c h 3 h CH,II I 3 I I 3
H O - C - C - C - CL i. A \ / /
-0(CH 2CH20 ) nCH2CH2S 0 3Na
CH3CH3CH3
NPEnC
n=0- 3
CH3 H CH3 / ------ V °I I I / \ II
CH3- c - c - c /> - 0 ( C H 2CH20 ) nCH2- C ~O H
CH3CH3CH3 V 7
NPEnC
n=2- 4
Figure 5.1.Oxidation of NPEOS by Fenton Reagent
This study involved the oxidation of NPEOS using Fenton’s reagent under different
experimental condition and for different times. The oxidation reactions were carried out
over time periods (after addition of hydrogen peroxide to the reaction mixture) of 1 hour,
160

2 hours, 3 hours, 4 hours and 5 hours respectively and the oxidation products were
observed as soon as was practicable after addition of hydrogen peroxide.
Initial identification of oxidation products formed in the oxidation reactions of NPEOS
was made by the use of HPLC techniques. Figure 5.2 (a-f) shows the variation in the
HPLC fluorescence chromatograms of the oxidation products of NPEOS obtained. The
peaks between (tr) 5.104 min and (tr) 6.840 min were tentatively identified as a mixture of
dicarboxylic acids (CNPEnC) and monocarboxylic acids (NPEnC). The oxidation
reaction of NPEOS using the Fenton reagent was monitored over five hours. A 1ml
sample was taken out every 15 minutes in the first 1 hour and dissolved in 100 ml
distilled water and analysed by HPLC, and then sampling was carried on at hourly
intervals. Complete conversion to intermediate oxidation products was observed at the
end of five hours (Figure 5.1(f)) to give what appeared to be one major set of products,
probably (based on the regular pattern of peaks) members of the same homologous series.
The tentative identification was based on the work of DeVoogt et al [22] who have
proposed a new biodegradation pathway for nonylphenol ethoxylate (NPEO) surfactants.
Analyses of spiked river water samples using LC-ES-MS after extraction using Cig
cartridge SPE revealed relatively fast primary degradation of NPEO, with > 99%
degradation observed after 4 days. The generally proposed degradation pathway of EO is
via chain shortening. It was shown that the initiating step of the degradation is
co-carboxylation of the individual ethoxylate chains, leading to the formation of
metabolites with long carboxylated EO chains (NPEC). Further degradation was found to
161

proceed gradually into short-chain carboxylated EO with the most abundant species being
NPE2C. The oxidation of the nonyl chain proceeded concomitantly with this degradation,
leading to metabolites which contained both a carboxylated ethoxylate and a carboxylated
alkyl chain, of varying length (CAPEC). The identity of the CAPEC metabolites was
confirmed by the fragmentation pattern obtained with LC-ES-MS/MS.
162
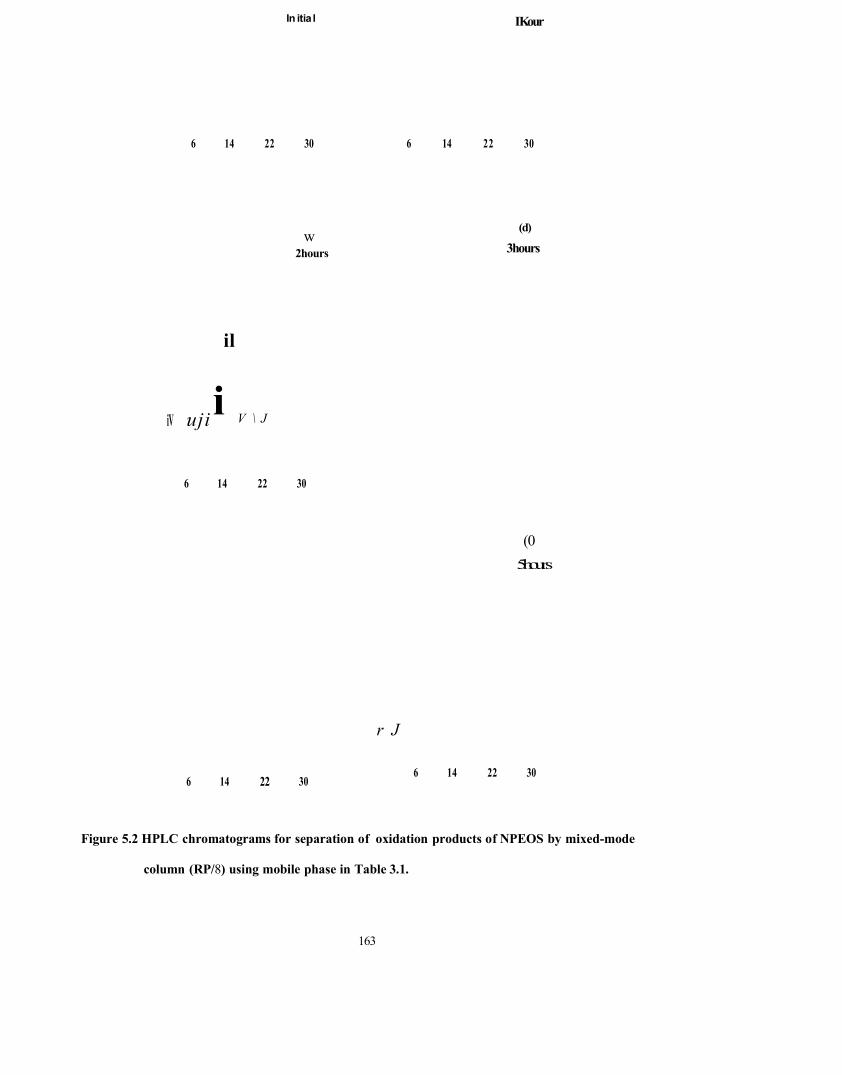
In itia l IKour
6 14 22 30 6 14 22 30
w2hours
il
iV ujii V \ J
6 14 22 30
6 14 22 30
(d)
3hours
(05hours
r J
6 14 22 30
Figure 5.2 HPLC chromatograms for separation of oxidation products of NPEOS by mixed-mode
column (RP/8) using mobile phase in Table 3.1.
163

The oxidation products of NPEOS were further studied by MALDI/ MS and electrospray
mass spectrometry to confirm their identities.
The MALDI/MS spectrum of oxidation intermediate products of NPEOS (Figure 5.3)
obtained with addition of lithium chloride shows excellent resolution of individual
ethoxymers in this type of oxidation product. An envelope of intense peaks representing
[M+Li] 1 adducts for 0-4 ethylene oxide units containing dicarboxylic acid species was
typically produced (m/z 315.0, 359.0, 403.2, 447.0 and 491.1). Ions corresponding to the
monocarboxylic acid can be m/z 329.0, 372.9, 416.9, 461.0 and 504.9. Hence these data
suggest that the intermediate oxidation products formulation contained molecules with
between 0 -5 ethylene oxide (EO) units and were a mixture of products as suggested by
HPLC data.
The electrospray positive ion mass spectra of the oxidation products were obtained by
direct infusion of the diluted reaction mixtures. The spectra obtained (e.g. Figure 5.4)
exhibit ions corresponding to both single and dicarboxylic acids species. Ions
corresponding to [M+NH4 ] species for the dicarboxylic acids can be seen at m/z 326,
370, 414, 458, 502 and 546. The corresponding series of [M+H]+ ions can be seen at m/z
309, 353, 397 and 441.
Ions corresponding to [M+NH4]+ species for the monocarboxylic acids produced by
oxidation of the ethoxylate chain can be seen at m/z, 384, 428, 472 and 516. Ions
corresponding to [M+NH4] ’ species for the monocarboxylic acids produced by oxidation
of the hydrocarbon chain can be seen at m/z, 375, 419, 463 and 507.
164

Intensity
o££0
so«L03
165
Figure 5.3 MALPI/MS of oxidation intermediate products from oxdation of NPEOS

166
(m/z)
Figure 5,4 LC-MS of oxidation intermediate products from oxidation of NPEOS.

The data obtained from the three different techniques indicate that there is mixture of
three different types of product formed from the oxidation of NPEOS. The MALDI/MS
data appears to suggest that the formation of NPEOS intermediates bearing a carboxylic
group on opposite side chains (dicarboxylic acid) was the major product type. From these
data, the oxidation reactions of NPEOS can be divided into three stages. The first
process is a rapid co-oxidation of the ethoxylate chain that occurs without any observable
time-lag. The next stage occurs more slowly, in which the long-chain NPEnC are
degraded to short-chain, mainly, CNPEnC (n = 0-5). The third stage is the oxidation of
the alkyl chain that starts as soon as NPEnC is being formed.
The m/z values correspond to [M+Li]1 ions expected from dicarboxylic acids. The peak
of m/z 315 corresponds to the [M+Li]+ ion formed for a dicarboxylic acid species where
both the alkyl chain and the first ethoxylate group have been carboxylated i.e. the
compound shown Figure 5.5 has been formed.
O CH3 H CH3 _ \HO— c — c — c — c V XN
CH3 CH3 CH3
H OI ii
-O— c — c —OH + Li
IH
Figure 5.5. CNPE0C MALDI/MS ion for peak m/z 314.8.
The formation of this product is also confirmed by the ES-MS data where the peak of m/z
326 corresponds to the [M+NFLJ* ion formed for the dicarboxylic acid species where
167

both the alkyl chain and first ethoxylate group have been carboxylated i.e. as shown in
Figure 5.5.
The data obtained from the chemical oxidation of NPEOS anionic surfactants shows both
a carboxylated ethoxylate and a carboxylated alkyl chain. This leads to the formation of
dicarboxylic acids (CNPEnC (n=0-5)) and two types o f monocarboxylic acids (ethoxylate
chains or nonyl chain carboxylated) to give NPEnC (n=0-3 and n=2-5). Thus, the
oxidation of NPEOS appear to follow the same pathways as NPEO.
168

5.2 Biological Oxidation of Nonylphenol Ethoxylatesulphonate
(NPEOS) Surfactants
Introduction
In the atmosphere currently prevailing at the Earth’s surface, the most stable form of
carbon is its fully oxidised state, CO2. The atmosphere contains 2.6x 10¹² tonnes of
carbon as CO2, which is in equilibrium with even larger amounts (1.3 x 10¹⁴ tonnes) in
solution in the rivers, lakes and oceans [23]. From this pool of oxidised carbon begins a
series of complex biological processes driven primarily by solar energy, which lead to the
reduction of CO2 to C-C, C-H and other bonds in an enormous variety of organic
compounds that collectively constitute the biosphere. In effect, photosynthetic
organisms, predominantly the green plants and marine algae, are the primary producers
which transduce solar energy into chemical energy by converting CO2 into complex
assemblies of reduced organic compounds. These materials constitute the base of
numerous interrelated food-chains involving herbivores, carnivores and omnivores.
During the flux of carbon through these routes, some is oxidised by the consuming
organisms to drive energy, while the resulting CO2 is returned to the atmosphere.
However, much organic material enters the soils, water and sediments in the environment
either during senescence of plants or the excretions from, or death of, higher organisms.
The deposition of organic compounds in the environment provides another pool, this time
of reduced carbon compounds which, in the presence of CO2, are thermodynamically
unstable with respect to CO2 under aerobic conditions.
169

An integral part of the evolutionary process that has produced this plethora of organic
compounds is the evolution of microorganisms that are able to utilise these materials as
nutrients. Microorganisms use organic compounds (and other elements such as N and S)
in the environment not only as sources of the carbon from which to build cell
components, but also for the energy they need to achieve that biosynthesis in order to
maintain the low entropy state embodied in the highly organised structures characteristic
of biological systems. This energy is also used to accomplish other functions such as
motility and bioluminescence. Thus, environmental deposits of organic compounds serve
as nutrients and as an energy source for microorganisms which ultimately complete the
re-oxidation of carbon to CO2 in the atmosphere and surface waters, thereby closing the
cycle.
Most of the surfactants reaching the environment (soil and natural waters) do so from
consumer products via the use of sewage sludge on land, effluents from wastewater
treatment plants (WWTP) and industrial discharges into freshwater and marine sites.
Other sources of surfactant contamination are from the use of surfactant dispersants for
fuel oil spillages and surfactant-enhanced remediation of subsoil after spillage and
contamination with non-aqueous liquids.
Historically, potential surfactant contamination of the environment followed the shift
from the use of soap-based detergents to synthetic surfactants. Over the past 45 years, a
number of factors caused significant change in the detergent industry. The first of these
took place in 1965, when the industry voluntarily switched its anionic workhorse
170

surfactants, branched alkylbenzenesulphonates (ABS), to linear alkylbenzenesulphonates
(LAS) upon the discovery that the less biodegradable ABS was largely responsible for
excessive foaming in receiving water. During the 1960s, phosphorus, present as
phosphate builders in household laundry and some institutional detergents, was found to
be a limiting nutrient in the eutrophication of lakes and streams. This finding has resulted
in a number of states and municipalities enacting legislation limiting the use of
phosphates in detergent products. Phosphates, in the form of sodium tripolyphosphate or
potassium pyrophosphate, were the only low-cost builder capable of reducing water
hardness concentrations to levels where hardness-sensitive LAS would perform a good
cleaning job.
The fate of a substance in an environmental compartment is related to its susceptibility to
degradation. This degradation may occur by abiotic physical chemical processes such as
hydrolysis or photolysis or by the action of living organisms, in the process known as
biodegradation. In practice, this is by far the most important process by which the
majority of substances are degraded in the environment. Biodegradation may take place
in the presence of oxygen (aerobic) or in the absence of oxygen (anaerobic). The aquatic
and terrestrial environments are generally aerobic although anaerobic conditions may
exist in aquatic sediments and sub-soil environments. Biodegradation of surfactants in
wastewater, in treatment plants, and in the ultimate receiving bodies is primarily the
result of bacterial action, just as is the case with the other organic components of the
waste. The biochemical metabolic reactions involved appear to be much the same
whether surfactant or not, although there are certain characteristic features exhibited in
171

surfactant biodegradation which arise from the nature of surfactants themselves i.e.
strongly hydrophilic and strongly hydrophobic groups joined together in the same
molecule.
Biodegradation is the molecular breakdown of an organic substance by the enzymatic
action of living microorganisms which use the substance for food. Conversion of the
substance occurs stepwise with the formation of metabolites and biodegradation
intermediates. These may degrade further at faster or slower rates compared to their
precursors [24], The processes involved are described as >
(i) Primary biodegradation which means biodegradation of a substance to an extent
sufficient to remove a characteristic property of the original intact molecule. For
surfactants, this has been measured by loss of foaming capacity or ability to reduce
surface tension. Primary biodegradation can leave high levels of organic residues altered
in form from the original material.
(ii) Ultimate biodegradation is biodegradation which proceeds through a sequence of
enzymatic attacks to ultimately produce the simplest structures possible in the
biodegradation media. In aerobic biodegradation, such as that which consumes oxygen in
the aeration sections of sewage treatment plants, CO2, H20 , methane and mineral salts of
other elements are formed. In practice, ultimate biodegradability is generally assessed in
an aerobic system by measuring carbon dioxide, the oxygen consumed during the
biodegradation process (“biochemical oxygen demand” or BOD) or by measuring the
level of organic carbon remaining in solution during the course of the biodegradation
study. Each such method has its own intrinsic problem leaving aside any experimental
172

problems associated with the measurements themselves. The measurement of carbon
dioxide production or the expression of BOD is a positive indication that some measure
of ultimate degradation has occurred. However, microorganisms, like higher organisms,
use biodegradable organic materials not only as an energy source but also as a food
source to build up their cellular mass. Depending on the nature of the substance in
question and the food supply available to the microorganisms (the more food, the more
they ‘put on weight’), only approximately 60-70% of the theoretical carbon dioxide
production or BOD will be found for even a very easily biodegradable substance such as
sodium acetate.
The measurement of dissolved organic carbon (DOC) in solution as an indication of
ultimate degradation can both in principle and in practice indicate high levels of
biodegradation since any of the substance converted into cellular biomass will be
removed by filtration or centrifugation. However, it is not applicable to substances which
are sparingly soluble in water or strongly sorptive, and can also be misleading where
sparingly soluble or sorptive metabolites are formed.
To the best of this author’s knowledge, no data on the biodegradation of APEOS type
surfactants has been published. It was felt important to examine their biodegradation
since it appeared that they have the potential to biodegrade to toxic/ endocrine-disrupting
intermediates in a similar manner to APEO. This could have important consequences for
their use in EOR. The data from the chemical oxidation of NPEOS reported earlier in
this chapter support this hypothesis. Although the biodegradation of APEOS has not
173

been studied, the biodegradation of APEO and LAS has been extensively examined.
Since each of these classes of surfactants have structural features of APEOS it was felt
important to examine the literature.
5.2.1 Biodegradation of Non-ionic Surfactants
Non-ionic surfactants biodegrade in a very complex manner. They can be attacked at
three different points by microorganisms, the position of which is dependent upon the
structure of the surfactant. In aerobic conditions, the three different points of attack are
summarised below [25].
■ Central Fission Mechanism
The hydrophobic unit is cleaved from the hydrophilic unit. (3-Oxidation is then
responsible for the further conversion of the linear chain to carbon dioxide and water.
■ co-Hydrophobe Attack
The far end of the hydrophobe is firstly oxidised to an acid. Biodegradation then
proceeds via (3-oxidation of the alkyl chain.
■ (o-Hydrophile Attack
This occurs via the oxidation of the polyoxyethylene chain initially to carboxylic acid.
However, the mechanism is not fully understood.
The pathway and rate of biodegradation is dependent upon the type of microorganism
present and the structure of the intact surfactant. Linear alcohol ethoxylates (LAE)
biodegrade to water and carbon dioxide by the central fission mechanism (Figure 5.6)
[25].
174

LAE h 3c — (CH2) o — (CH2CH20 ) — c h 2c h 2o h
yLAnEC HO O C— (CH2) n O — (CH2CH20 ) m— CH2CH2OHn = 0,1
Y
Acetyl-CoA+ Polydiol
yc o 2 + h 2o
Figure 5.6. The biodegradation pathway of LAE [25].
5.2.1.1 Environmental Effects
The major problems of surfactants in the environment arise from the two classes of
materials LAS and APEO but in the case of the APEO the environmental problems relate
more to the biodegradation products rather than to the APEO themselves. Primary
biodegradation of APEO is by stepwise removal of ethylene oxide monomers and is
understood to be facilitated by bacterial metabolism of the hydrophilic ethoxylate chain
[25]. Numerous studies have investigated the biodegradation of APEO and reported a
wide range of degradation rates depending on the kind of test system and conditions
employed [26], While ultimate biodegradation results in the complete mineralisation of
the aromatic structure of APEO, most studies have indicated that only primary
175
biodegradation is particularly rapid, resulting in an accumulation of persistent metabolites
such as nonylphenol (NP) or octylphenol (OP), short chain mono-, di- and tri-ethoxylates
(i.e. NP1EO, NP2EO, NP3EO) and phenoxy carboxylates (i.e. NP1EC, NP2EC) [27-29],
which have greater aquatic toxicity than the original, fully ethoxylated NPEO [30],
The biodegradation of APEO by bacteria in sea water polluted with urban sewage is
brought about by bacteria of the pseudomonas genus of marine origin. Few other species
of Gram-negative bacteria are able to degrade APEO with nine or ten ethoxymer groups.
Pseudomomas strains degrade only down to four or five ethoxymer groups, although
other species of bacteria which are unable to degrade the long chain APEO are able to
degrade the APEO with four or five ethoxymer units down to the two ethoxy group
compounds [31].
A number of internationally standardized test methods have been established for
assessment of the biodegradability of surfactants, and some studies have been conducted
to investigate the environment fate of APEO, by the introduction of NPEO into sewage
treatment plants, and subsequently monitoring the plant output into river water.
In a study of the Glatt River [32] Ahel et al found that while STPs were indeed reducing
the amount of long ethoxylate chain species, the elimination rate of all nonylphenolic
compounds (70 ± 15 %) was significantly lower than the elimination of BOD
(biochemical oxygen demand) (86 ± 9 %), indicating that nonylphenolic compounds are
not the most biodegradable fraction of sewage. No net elimination of NP1EO and
176

NP2E0 was seen in the results, indicating that their formation during activated sludge
treatment was faster than their degradation. In addition, the concentrations of NP1EC
and NP2EC in secondary effluents were 2.1-7.6 time higher than in primary effluents,
indicating significant formation in this class of compound during aerobic biological
treatment (Table 5.1). Thus, while sewage treatment effectively degrades the long
ethoxylate chains, the resulting shorter chains and carboxylic degradation products
(which are much more resistant to biodegradation) remain and are present in the final
effluent from the treatment plants.
NP13-20 EO NP1-2 EO NP N P -2 E C
Primary
Effluent
82.4 % 11.5% 3% 3.1 %
Secondary
Effluent
28% 21.8% 3.9% 46.1 %
Table 5.1 The influence of sewage treatment on non-ionic surfactants and their degradation products [data from ref. 32].
Ahel et al [33] have reported the results of another study of the Glatt River in
Switzerland which receives effluents from several sewage treatment plants. Results
indicated that the biodegradation products NPEC were the most abundant APEO type
compound (2 -7.1 pg/L) and, as would be expected, and intact NPEO were the least
abundant (1 -7 .7 pg/L). Ratios of APEO and their biodegradation products were found
to resemble those of secondary effluents. These types of compound were seen to undergo
177

significant changes due to the biodegradation process. Contribution from intact NPEO
decreased from 21 % to 3.5 % of the total; in contrast, NPEC increased from 51 to 85 %.
Mann et al [34] have evaluated the biodegradability of OPEO by field trials with a
trickling filter sewage treatment plants. Biodegradability rose from 26 % in March to a
level of about 80 % in late August and September. During November and December
biodegradation fell until by the end of January it was only 20-25 %. The decrease in
biodegradation was attributed to low biological activity during the cold winter months.
Stiff et al [35] have studied the effect of temperature on the removal of OPEO on a
laboratory scale. Tests were carried out at 8,11 and 15 °C using the “porous pot”
activated sludge technique over a period of 122 days. At 20 mg/L the percentage
removal was high during the period at 15 °C but at 11- 12 °C and at 8 °C it varied
between 40- 95% and 20- 80%, respectively, indicating that at low temperatures, stable
populations of microorganisms adapted to OPEO could not be maintained.
Rudling et al [36] reported a study of the biodegradation of NPEO, using the
Organisation for Economic Cooperation and Development (OECD) screening test.
NPnEO (n = 8, 10, 14) were degraded to an extent of more than 90% within 12 days.
Fifty percent of the predominantly formed degradation product NP2EO was eliminated at
20 °C after 28 days, while at 15 °C, no degradation was observed.
178

Schoberl et al [37] have investigated NPEO in pond water and sea water at different
temperatures over a period of 50 days. The extent of primary biodegradation of NPEO at
20 - 23 °C was 33 - 36% in pond water and 95% in sea water. At 3 - 4 °C they were
degraded to a maximum of 37% in pond water and to only 15% sea water.
Trocme et al [38,39] have studied the biodegradability of NP in sludge-amended soil and
in a compost-sand stone mixture spiked with 100 and 1000 mg/kg technical NP. In both
cases, biodegradation of NP was approximately 90% after 100 mg/kg treatment but only
approximately 60% after 1000 mg/kg treatment within 40 days. A rapid decrease in the
respiration rates of the soils in 1000 mg/kg samples by the fourth day indicated a toxic
effect of NP on the microorganisms. Kirchmann et al [40] have spiked soil samples with
10 and 500 mg/kg NP and determined the soil respiration by measurement of the CO2
evolution. At high concentrations of NP respiration was significantly higher compared
with the untreated control, whereas no effect was measured at the lower concentration of
10 mg/kg. In both cases the concentration of NP reached the detection limit of 0.02
mg/kg after 20 days. These results are apparently contrary to those of Trocme et al
[38,39], but a reason for that may be the different concentration levels and experimental
conditions.
5.2.1.2 Metabolites of APEO in the Marine Environment
Studies have been conducted on the environmental behavior of sewage released into the
marine environment. Waters and sediments from the Venice Lagoon were analysed as it
receives treated and untreated domestic and industrial effluents [41].
179
NP, NP1E0 and NP2EO were detected in the range 0.15- 13.7 pg/g (dry weight basis) in
the first 0.01 to 13.7 mm of the sediment layer in the lagoon (using a portable re-
suspending device). This was equivalent to a five-fold increase in concentration
compared with the underlying 5 cm of sediment. The amount of NP and short chain
NPEO bound to re-suspending sediment showed a seasonal dependence. In April and
July, twice as much material was found compared to that in February. However, in
February, the total concentration of biodegradation product per unit of sediment surface
was one order of magnitude higher, possible due to the growth of micro algae. On
average, the micro algae contained NP, NP1EO and NP2EO at concentration of 0.25 +/-
0.15 pg/g (dry weight). In water APEO oligomers (up to thirteen ethoxylate units) were
found in an average concentration of 0.6 - 4.5 pg/L.
If toxic metabolites of APEO can be found in sludge, it is a possibility that bottom-
feeding animals, such as mussels, may consume these compounds. McLeese and co
workers [42] studied the uptake and excretion of aminocarb (containing nonylphenyl
formulations) by mussels. They suggested that significant contamination of bivalves
does not occur if the concentrations of the aminocarb and nonylphenol in water are less
than 0.01 mg/L.
Wahlberg et al [43] reported concentrations of between 0.2 and 0.4 pg/L nonylphenol,
0.075-0.275 pg/L NP1EO, 0.04-0.125 pg/L and 0.03-0.04 pg/L NP3EO in blue mussels
(Mytilus Ednlis). The study was carried out by putting mussels in cages at different
depths and distances down the coast from a manufacturer of surfactants in Sweden.
180

5.2.1.3 Toxicity
The biodegradation products of NPEO such as NP, NP1EO and NP2EO have a high
degree of lipophilic character, and therefore, bioaccumulate in aquatic organism. Hence,
the effect of APEO in the environment is a very important issue, especially because of
their persistence and the toxicity of their biodegradation products, in particular,
alkylphenols.
A survey of the literature by Thiele et al [44] showed that most studies of APEO toxicity
have concentrated on nonylphenol. McLeese et al [45] determined the LC50 (the
concentration that kills 50% of a population) of NP for various species living in the sea
(Table 5.2).
Species Test Duration (h) LC50 (mg/L)
Freshwater clam 144 5.0
Shrimp 96 0.4
Soft-shelled clam 144 >1.0
Lobster 96 0.2
Salmon 96 0.9
Table 5.2 NP LCS0 data for various marine organisms [45].
181

Terrestrial animals are much less sensitive than aquatic species to surfactants. For
example the median lethal dose (LD50) for oral ingestion by mammals generally lies in
the range 500-5000 mg of surfactant per kg of body weight, which is comparable to
sodium chloride or sodium bicarbonate [25],
5.2.1.4 Oestrogenic Properties of Alkylphenol Ethoxylates
The majority of APEO are used in aqueous solutions; therefore, they are discharged into
municipal and industrial waste waters which enter sewage treatment plants. During the
different steps of sewage treatment, a complex biodegradation process of APEO takes
place, leading to the formation of several biorefractory metabolites [36,46-50], The
degradation products 4-alkylphenol diethoxylate (AP2EO), 4-alkylphenol
monoethoxylate (AP1EO), [(4-alkylphenoxy)ethoxy] acetic acid (AP2EC),
(4-alkylphenoxy) acetic acid (AP1EC), and 4-alkylphenols. 4-Alkylphenols, formed by
shortening of the hydrophilic ethoxylate chains are persistent, strongly lipophilic, and
more toxic than the parent compounds. Acute toxicity data of NP to aquatic organisms
range from 0.18 to 5.0 mg/L, dependent on species and experimental conditions [45,51].
In comparison, the LC50 for NP9/10EO to fish are 5.0-11.0 mg/L [52], The release of
these highly toxic compounds via secondary effluents or sewage sludge could be harmful
to the aquatic or terrestrial environment.
Recently, toxicity results have shown that the nonylphenolic compounds are endocrine
disruptors that can pose a health risk to humans and to wildlife. According to Soto et al
[51], 10 pMNP displays similar oestrogenic effects to 30ppm 17(3-oestradiol in inducing
182

the proliferation of MCF7 human breast cancer cells; in addition, NP can cause
feminization of male fish [53] and affect adversely testicular size and spermatogenesis in
rats [55,56],
5.2.2 Biodegradation of Anionic Surfactants
LAS are generally regarded as biodegradable surfactants. Very high levels of
biodegradation (97-99%) have been found in some waste water treatment plants
(WWTP), under aerobic conditions. The biodegradation of LAS is affected by a number
of factors amongst which are the concentration of dissolved oxygen [57], complexing
with cationic surfactants [58,59], the formation of insoluble calcium and magnesium salts
[60], the presence of other organic contaminants [61,62] and the effect of LAS on the pH
during aerobic degradation [63]. In sewage-contaminated groundwater, the rates of LAS
biodegradation increase with dissolved oxygen concentration and the longer alkyl chain
homologues (C12 and C13) are preferentially biodegraded. However, the removal of LAS
was found to be 2 - 3 times greater under laboratory conditions than in field tracer studies
[57].
The rate and pathway of LAS biodegradation have been the object of many studies. These
have been reviewed by Swisher [25] and Schoberl [64], The pathway of LAS
biodegradation is shown in Figure 5.7 . Initial attack is ©-oxidation of the terminal
methyl groups of the alkyl chain. The methyl group that is further from the phenyl group
is attacked first, and the resulting oxidation products, a series of alkanoic acid that are
shortened by two carbons at a time via (3-oxidation. The resulting short-chain
183

intermediate is often called sulphenyl carboxylate (SPC). The ring structure is
hydroxylated next by oxygenases in preparation for ring cleavage. Ring cleavage is the
proposed rate-limiting step in LAS biodegradation. Dioxygenase-catalyzed ring cleavage
is proposed to occur at the 1-2 position of the ring followed by desulphonation.
Desulphonation prior to ring cleavage is another possible mechanism. Once ring opening
and desulphonation have occurred, the resulting aliphatic intermediates can enter
common pathways for further oxidation or assimilation into biomass.
■COOH
S 0 3
COOH
.COOH
COOH
COOH'OH
'OH
Ring Cleavage
COOHCOOH
Hydroxylation
SO,
OII
CH3C-SC0A
(Voxidation
Mineralisation^ q q +1-^0
Assimilation biomass
Figure 5.7. Biodegradation pathway of LAS.
184

All alkyl aryl sulphonates and petroleum sulphonates would be expected to follow the
same basic catabolic scheme: (a) terminal oxidation and shortening of the alkyl portion;
(b) ring ( phenyl or naphthyl ) hydroxylation ; (c) ring opening (cleavage) and
desulphonation ; (d) further breakdown via common intermediary metabolic pathway,
ultimately to CO2 or assimilation of intermediates into biomass. The structure of the
parent molecule has great importance for the extent of biodegradation and its rate. Other
effects of structure on biodegradability are as follows :-
• For a given homologue, the greater the distance between the sulphonate group and the
more distant terminal methyl group on the alkyl chain, the faster the degradation.
That is, internal phenyl isomers degrade slower than external (e.g. 2-,3-phenyl)
isomers.
• The effect of alkyl chain length size is uncertain. Differences in biodegradation rates
between surfactants with longer or shorter alkyl chains may actually reflect solubility
(microbial uptake) and inhibitory effects.
5.2.2.1 Environmental Effects/Toxicity
There have been several studies on the toxicity of LAS [65-67], which show that toxicity
to aquatic life increases with increasing chain length of the alkyl chain. For commercial
LAS to be acutely toxic, it must be in the environment at a concentration of between 1 -
lOmg/L. LAS biodegradation intermediates are 100 to 1000 times less toxic than the
parent compound, and are normally present in river waters at concentrations well below
threshold levels which equate to chronic effects.
185

In mammals LAS is usually excreted, before ultimate degradation, via urine and faeces.
It is absorbed and passed into the blood in the intestine and eventually arrives in the liver
where it is broken down via g> - and [3- Oxidation. The hydrophilic compounds i.e. short
chain carboxylates, are passed to the blood while LAS and longer chain sulphophenyl
carboxylates (SPC) move into bile for the whole process to continue. The short chain
SPC are finally excreted as urea from the kidneys. Any LAS which was not absorbed in
the kidneys will be found in excreted faeces [68].
In experiments using radio-labeling techniques, LAS metabolites were detected in rat
urine (40-58 % of original LAS concentration) and in the faeces (39-56 % of original
LAS concentration) over a four day period. A total of 19 % of the original LAS
concentration ingested remained intact [68],
De Henau et al [69] tested several commercial seedlings for LAS toxicity, and concluded
that foliage showed visible signs of toxic effects when the soil containing the seedlings
was sprayed with a solution of LAS at concentration of 100 mg/L and above. In all
species, no reduction in growth occurred between 0.4 and 2.2 mg/kg. These data were
collected under stress conditions and when compared to the measured concentration of
0.9 to 2.2 mg/kg in the environment, it would seem that LAS in sludge applied to soil
does not represent a hazard to terrestrial plant life.
Kimberle [70] reported LAS toxicity values as No Observed Effect Concentrations
(NOEC), and the values were used to produce a hazard data assessment model. He
186

reported that the shorter chain LAS (i.e.Cio ) is less toxic to fish and invertebrates than
LAS with longer chain lengths (i.e.C^). The NOEC for Cio was 10 mg/L compared to
0.1 mg/L for C14 . For commercial applications with average chain length of Cn.g the
NOEC was 1.2 mg/L; double the amount of those with an average chain length of C13.3.
A summary of the LC50 concentrations of LAS for various aquatic species is shown in
Table5.3.
Species Test Duration (h) L C 5 0 (mg/L)
Marine shrimp [45] 96 0.40
Lobster [45] 96 0.20
Common mussel [71] 96 3.00
Fresh water clam [45] 144 5.00
Soft shelled clam [71] 360 1.00
Common mussel [71] 360 0.50
Common mussel [71] 850 0.14
Table 5.3 LC50 concentrations of LAS for a variety of aquatic species
In study of various animals from marine and river environments, Bressan et al [72] found
that the concentration range in which LAS displayed acute effects range from 0.25 to 200
mg/kg. The tolerances observed were very dependent on the LAS concentration and the
organism in question. Among the more sensitive organisms examined were copepods
187

and embryos of the sea urchin, Pciracentrotus lividns, while among the more resistant
were the fresh water molluscs A. cygnea and U. elongatulus.
5.2.2.2 Biodegradation of NPEOS in Sea-water
Although there are many different kinds of micro-organism in sea-water (algae, bacteria,
protozoa), the most important of these are bacteria, since they have greater and faster
growth capacity than others, and can survive longer in a wider variety of substrates.
Since it is proposed that NPEOS are useful for EOR application in high salinity
environments, e.g., off-shore oilfields, their biodegradation by salt-resistant bacteria is of
interest. In this work the biodegradation of NPEOS by two different strains of salt-
resistant bacteria has been studied and the data obtained are compared with those from
chemical oxidation and from the biodegradation of NPEO. As previously discussed this
is particularly important since NPEOS would appear to have the potential to biodegrade
to endocrine disrupting metabolites.
188

5.2.3 Experimental
5.2.3.1 Reagents and Materials
A commercial NPEOS formulation manufactured by Hoescht was gifted by Dr Tor
Austad (Rogaland University centre, Norway). Synthetic sea-water was purchased from
BDH (Poole, Dorset, U.K.). Paracoccuss halodentitrificans was purchased from the
National Collections of Industrial and Marine Bacteria (NCIMB) Ltd (Aberdeen,
Scotland, U.K.). Bacterium T-52 was purchased from American Type Culture Collection
as ATCC 27042 (Manassas, Virginia, USA). Strong Anion-Exchange (SAX) cartridges
(500mg) were purchased from Varian (Frampton Avenue, Harbor City, USA). All
solvents used were HPLC grade and were purchased from Fisher Scientific
(Loughborough, U.K.). All water used was Milli-Q grade. Ammonium acetate and
acetic acid used were HPLC grade (Fisher Scientific)
5.2.3.2. Culture conditions for Paracoccus halodenitrificans and
Bacterium T-52.
5.2.3.2.1 Paracoccus halodenitrificans
The medium used for the growth of Paracoccus species contained 3.0gm yeast extract,
5.0gm peptone, 750ml filtered, aged sea-water, 250ml distilled water The temperature
was maintained at 25-27 °C and the pH to 7.3 ± 2.
189

5.2.3.2.2 Bacterium T-52
Medium (A)
The basal medium composition contained 7.5g K2HPO4, 0.8g (NH4)2 S0 4 , l.Og KH2PO4 ,
O.lg MgS0 4 .7 H20 , lO.Omg FeS0 4 . 7H20 , 1.0ml salts solution (4.4g ZnS0 4 .7 H20 , 3.0g
MnS0 4 .H20 , 6.0g CaCl2.H20, 0.2g CuC122H20 and 1.82g (NH4 )6 M0 7 O24 4H20 in
1000ml distilled water) and 70g NaCl in 1000ml distilled water and adjust pH to 6.9.
Medium (B)
The basal medium composition contained 2.44g Na2HP0 4 , 1.52g KH2PO4, 0.20g M gS04.
7H20 , 0.50g (NH4)2SO4, 0.05g CaCl2.2H20, 10ml trace element solution (0.50g EDTA,
0.20g FeS0 4 .7 H20 ), and 100ml trace element solution (0.10g ZnS0 4 .7 H20 , 0.03g
MnCl2.4H20 , 0.30g H3BO3, 0.20g CoC12.6H20, O.Olg CuC12.2H20, 0.02g NiCl2. 6H20,
0.03g Na2 M0 O4 2H20) and 34g NaCl in 1000ml distilled water and adjust pH to 6.9.
5.2.3.3. Sample Pretreatment
In order to simplify the chromatograms of the biodegradation products residual non-ionic
starting material was selectively removed from the formulation by the use of SAX solid
phase extraction cartridges. The surfactant solutions were acidified to pH 3-4 with
glacial acetic acid. The cartridge was washed with methanol (5ml) and distilled water
(10ml). The acidified surfactant solution was passed through the cartridge which was
subsequently washed with 2% acetic acid in methanol (5ml) to selectively elute the non
ionic surfactants. The cartridge was then washed with methanol (5ml) before elution of
the anionic fraction in 2 M HC1 in methanol:water (50:50) (15ml). This was evaporated
190

to dryness and the now “pure” NPEOS was dissolved in the synthetic sea-water/ distilled
water.
5.2.3.4. HPLC instrumentation and conditions
All HPLC analyses were performed on a Waters 600-MS gradient HPLC system. The
columns used were Alltech (Camforth, Lancashire, U.K.) mixed-mode reversed-
phase/ion-exchange columns, mixed-mode RP8/ anion 100A, 7pm (150x4.6mm).
Fluorescence detection was carried out using a Jasco FP-920 (Cheltenham, U.K.)
fluorescence detector, Xex.=225nm and A,em=295nm. Data were output to Hewlett
Packard HP 3396A integrator. Injections (lOOpl) were made using a Perkin-Elmer ISS-
101 autosampler. The mobile phase gradient used is as shown in Table 3.1 in Chapter
three. All analyses of the biodegradation products of NPEOS using both
microorganisms ( Paracoccus halodenitrificans and Bacterium T-52) were completed
using the C8/SAX column described above.
5.2.3.5. Biodegradation of NPEOS using Paracoccus species.
The biodegradation of high purity of NPEOS was carried out in fifteen volumetric flasks
(ca. 250 ml) containing NPEOS (1500 pg/L) dissolved in synthetic sea-water. To ten of
the flasks was added 1ml of Paracoccus halodenitrificants (250,000 cells) from the
culture samples. The other five flasks contained NPEOS dissolved in sea-water only and
were used as blanks in the measurement of biochemical oxygen demand (BOD). All
samples were kept in a water bath at constant-temperature (20± 0.5 °C) and in the dark
for 5- days. Each day, three flasks were taken. The BOD was measured, for one blank
191

and for one sample containing both microorganism and NPEOS. The second sample was
extracted and analysed by HPLC.
5.2.3.6 Biodegradation of NPEOS using Bacterium T-52 species.
The surfactant, NPEOS, ( 0.094 g/L) was added to 100 ml of medium A and medium B.
These media were held in six (<ca. 250cm3) Erlenmeyer flasks ( three contained medium
A and three medium B). These experiments were carried out for sterilized basal media
mixtures. The media were inoculated with adapted Bacterium T-52 and the flasks were
shaken on a reciprocal shaker at room temperature, which ranged from 27 to 29 °C.
Growth of Bacterium T-52 was followed by reading the optical density (OD) at X- 640
nm.
5.2.3.7 Sample Preparation
Before extraction, the aqueous samples were vigorously shaken to ensure adequate
mixing and suspension of particulate material. Analytes were extracted from the bioassay
by 3x25 ml of ethyl acetate. The organic layers were combined and dried using
magnesium sulphate, and the extract was evaporated on a rotary evaporator to give a
greasy residue which was dissolved in (50:50) methanol and water.
5.2.3.8 Method for the determination of Dissolved Oxygen (DO)
Dissolved oxygen was determined using a Russell CD400 dissolved oxygen meter. For
this instrument, standard tables give values for solubility of oxygen in pure water at
various temperatures. These values are given in mg/L (ppm) and relate to pure water in
192

equilibrium with water vapour-saturated normal air at the standard atmospheric pressure
of 760 mmHg. In this work, the table of salinity correction values, which can be used to
determine oxygen solubility in sea-water over the temperature range 0-35 °C, were used.
The value given is subtracted from the corresponding value in the solubility column for
each degree of salinity and expressed in parts per thousand (° / 00).
Thus the oxygen solubility = solubility in pure water(mg/L) -salinity of water (salinity
correction).
i?3

5.2. 4 Results and Discussion.
The biodegradability of the surfactants is mostly governed by the molecular structure of
the hydrophobe. The surfactants with branched hydrophobes are generally more resistant
to biodegradation than those with linear ones .
Basically, biodegradation is measured by exposing the test compounds to microorganisms
and analyzing the system at intervals to determine such things as the disappearance of the
test compound, the formation of degradation products or the uptake of oxygen. Many
combinations of microbiological environments with analytical methods have been used
depending on the exact objectives of the work.
Biochemical oxygen demand (BOD) is one of the oldest methods used to measure oxygen
uptake. Substrate, bacterial inoculum and oxygen are generally placed in a glass vessel
and O2 uptake determined by chemical analysis, manometrically or by an oxygen
electrode. The NPEOS surfactant biodegradation by Paracoccus halodenitrificans was
studied as a batch experiment, where the NPEOS served as the sole carbon source.
NPEOS degradation was measured in terms of oxygen uptake by the microorganism.
This is shown in Figure 5 .8, which shows the gradually decreasing value of oxygen from
the first day to the fifth day for sample mixtures containing NPEOS surfactant and
microorganism in synthetic sea-water. This clearly indicates that the bacteria were
consuming the oxygen in the solution in order to break down NPEOS to biodegradation
intermediate products.
194

■ DO
T i m e ( d a y )
Figure 5.8: Decrease in Dissolved Oxygen During the Biodegradation of NPEOS By Paracoccus
halodenitrificans.
The data for the HPLC analysis of the second set of samples are shown in Figure 5.9 (a-♦
f). As can be seen, some new peaks occur at the retention times between (tr) 4.20 and (tr)
6.00 and these are initially observed in the 6 hours sample (Fig. 5.9) and increase in
intensity over the five day study.
The retention time data obtained from chemical oxidation and biodegradation using
bacteria species for NPEOS are slightly different, because the test solutions were
analysed at different times. However, as can be seen, the emergence of a similar pattern
of peaks to that seen in the chemical oxidation experiments was observed between tr=
5.104 mins and tr = 6.840 mins.
195

(a) Initial chrom a togram
6 1 4 2 2 3 0
( c2 4 hours
22 3 06 14
n
( e)
( b )
12 hours
6 1 4 2 2 3 0
( d )
4 2 hours
i 1--------1--------h6 14 2 2 3 0
72h ou rs ( f )
9 6 hours
3 06 14 22
Figure 5.9. HPLC chromatograms for the separation of biochemical oxidation products from
biodegradation of NPEOS for 5-days.by Paracoccus halodenitrificans.
196

Ornston et al [73] have proposed pathway for metabolism of two-carbon molecules that
could be available for ethylene glycol metabolism, provided that ethylene glycol could be
oxidised to glycolate. Carlos et al [74] have reported that Bacterium T-52 can oxidise
ethylene glycol to glycolate and glyoxylate and utilize both as sole carbon sources for
growth. In this work Bacterium T-52 was found to be unable to oxidize NPEOS.
The data from the Paracoccus halodenitrificans experiments Fig. 5.9 (a)-(f), however,
show significant biodegradation of the NPEOS surfactant. Based on retention time data
and the pattern of peaks observed, it is possible to tentatively identify these peaks as a
similar mixture of CNPEnC compounds to that observed in the chemical oxidation
experiments. Hence it has been demonstrated that the biodegradation of NPEOS
surfactant does appear to follow the same pathway as NPEO, proposed by De Voogt [22].
Therefore it can be predicted that these surfactants will eventually degrade to the
endocrine disrupting substance nonylphenol. This has important implications for their
use in marine environments and further experiments should be carried out in order to
prove this.
197

Conclusion
The experiment carried out on the oxidation of the NPEOS surfactant using Fenton’s
reagent, indicated a very fast oxidation reaction to give new products, and in a few hours
NPEOS was completely converted to intermediate oxidation products. The presently
available experimental data obtained from three different techniques (HPLC, MALDI/MS
and LC-MS) for the oxidation products showed that the major intermediate oxidation
products were dicarboxylic acids, CNPEnC (n=0-5), with some traces of mono-
carboxylic acids (in two positions). For the oxidation of NPEOS, the mixture of
Fe(II)/H202 was an effective oxidation system. The proposed degradation mechanism
initially is via a hydroxyl radical attack on the ethoxylated chain (co-oxidation) and then
the second step, in which the long-chain NPXEC are degraded to mainly short-chain,
NP1EC occurs more slowly. The third steps is the attack on the terminal methylene
group of the alkyl chain. These data suggest a similar degradation pathway for NPEOS as
that for NPEO.
In the second part of this study, experiments on the biodegradation of NPEOS surfactant
were carried out by using two different type of microorganisms (.Paracoccus and
Bacterium T-52). In the experiment using the Paracoccus species with NPEOS over a 5-
day period, degradation to dicarboxylic acids (CNPEn C) and monocarboxylic acids was
observed. However, HPLC chromatograms obtained from the experiment using
Bacterium T-52 species over 45 days showed that this type of microorganism was unable
to degrade NPEOS surfactant.
198

The overall aim of the work reported in this Chapter was to identify the products obtained
from the biodegradation of NPEOS in sea-water. It is felt that strong evidence has been
obtained that the primary biodegradation of NPEOS leads to the formation of the same
intermediates as those formed from NPEO and hence further degradation to NP would be
as expected pathway. This should be investigated further.
199

References
1. Baxter R. M. and Sutherland D. A.; Environ. Sci. Technol. 18 (1984) 608.
2. Katayana A. and Matsumara F.; Environ. Sci. Technol. 25 (1991) 1329.
3. Kearney P. C., Zeng Q. and Ruth J. M.; Chemosphere 12 (1983) 1583.
4. Kong H. L. and Saler G. S.; Applied and Environmental Microbiology 46 (1983) 666.
5. Marco A., Esplugas S. and Saum G.; Water Sci. Technol. 35 (1997) 321.
6. Esplugas S. and Ollis D. F.(1993). Sequential Chemical and Biological Treatment of
Water Pollutants: a Mathematical Model. 6th Mediterranean Congress on Chemical
Engineering, Barcelona (Spain) and Chemical Oxidation for the Nineties: III
Nashville, TN (February, 1994).
7. Sawyer D. T.; Oxygen Chemistry, Oxford University Press 1991.
8. Fenton H. J. H.; J. Chem. Soc. 65 (1894) 899.
9. Huang C. P. and Tang Z.; Waste Management. 13 (1993) 361.
10. Sheldon R. A. and Kochi J. K.; Metal-catalyzed oxidation of organic compounds.
Academic Press, New York (1981) 35-38.
11. Al-Hayek N. and Dore M.; Water Res. 24 (1990) 973.
12. Prousek J.; Chemicke Listy 89 (1995) 11.
13. Walling C. H.; Acc. Chem. Res. 8 (1975) 125.
14. Barb W. G., Baxendale J. H., George K. R.; Trans. Faraday Soc. 47 (1951) 462.
15. Barb W. G., Baxendale J. H., George K. R.; Trans. Faraday Soc. 47 (1951) 591.
16. Walling C. and Cleary M.; Int. J. Chem. Kinet. 9 (1977) 595.
17. Jakeman A. P. and Powell R. L.; Hazardous Waste Treatment Technologies, Noyes
Publications, New Jersey, USA, (1991) 90.
200

18. Marcomini A., Zanette M. and Sfriso A.; Chemicke Listy 87 (1993) 15.
19. Burzio F. and Gorini S.; La Rivista Italiana delle Sostanze Grasse 60 (1983) 681.
20. Britton L. N.; J. Surfactants and Detergents 1(1998) 109.
21. Ito S., Mitarai A., Hikino K., Hirama M. and Sasaki K.; J. Org. Chem. 57 (1992)
6937.
22. Jonkers N., Knepper P. and De Voogt P.; Environ. Sci. Technol. 35 (2001) 335.
23. Schlegel H. G.; General Microbiology (1986), Cambridge University Press,
Cambridge.
24. Kravetz L.; J. Am. Oil Chemists Soc. (January 1981) 58A.
25. Swisher R.; Surfactant Biodegradation Vol. 2 Marcel Dekker NY 1987.
26. Talmage S.; Environmental and Human Safety of Major Surfactants: Alcohol
Ethoxylates and Alkylphenol Ethoxylates, Lewis Publishers , Boca Raton (Florida,
USA) 1994.
27. Field J. A. and Reed R. L.; Environ. Sci. Technol. 30 (1996) 3544.
28. Potter T. L., Simmons K., Wu J., Kostecki P. and Calabrese E.; Environ. Sci.
Technol. 33 (1997) 113.
29. Staples C. A., Williams J. B., Blessing R. L. and Varineau P. T.; Chemosphere 38
(1999) 2029.
30. Yoshimura K.; J. Am. Oil Chemists. Soc. 63 (1986) 1590.
31. Nguyen H. and Sigoillot C.; Biodegradation 7 (1997) 369.
32. Ahel M., Giger W. and Koch M.; Water Research 28 (1994) 1131.
33. Ahel M., Giger W. and Schaffiner C.; Water Research 28 (1994) 1143.
34. Mann A. H. and Reid V. W.; J. Am. Oil Chem. Soc. 48 (1971) 794.
201

35. StiffM., Culley G. and Rootham R.; Water Research 7 (1973) 1003.
36. Rudling L. and Solyom P.; Water Research. 8 (1974) 115.
37. Schoberl P. and Mann H.; Arch. Fisch. Wiss. 27 (1976) 149.
38. Trocme M., Tarradellas J. and Vedy J.; 16th Annual Symposium on the Analytical
Chemistry of Pollutant/Lausanne, March 1986.
39. Trocme M., Tarradellas J. and Vedy J.; Bio. Fertil. Soils 5 (1988) 299.
40. Kirchmann H., Astrom H. and Jonsal G.; Swed. J. Agric. Res. 21 (1991) 107.
41. Marcomini A., Pavoni B., Sffisco A. and Orio A.; Marine Chemistry 29 (1990) 307.
42. McLeese D. W., Zitko V., Metcalfe C., Sergeant D.and Burridge L.; Bulletin of
Environ. Contamin. Toxicology 24 (1980) 575.
43. Wahlberg C., Renberg L. and Wideqvist U.; Chemosphere 20 (1990) 179.
44. Thiele B, Gunther K. and Schwuger M.; Chem. Rev. 97 (1997) 3247.
45. McLeese D. W., Zitko V., Metcalfe C. and Sergeant D.; Chemosphere 9 (1980) 79.
46. Stephanou E. and Giger W.; Environ. Sci. Technol. 16 (1982) 800.
47. Reindard M., Goodman N. and Mortelmans K. E.; Environ. Sci. Technol. 16 (1982)
351.
48. Briischweller H., Gamperle H. and Schwager F.; Tenside Surfactants Detergents 20
(1983) 317.
49. Giger W., Brunner P. and Schaffiner C.; Science 225 (1984) 623.
50. Ahel M., Conrad T. and Giger W.; Environ. Sci. Technol. 21 (1987) 697.
51. Bringmann G. and Kuhn R.; Wasser Abwasser Forsch. 15 (1982) 1.
52. Schoberl P.; In Handbook of Surfactants (in German), 3rd ed:Stache H. and Kosswing
K.; Eds; Car Hanser: Munich, Germany (1990) 115.
202

53. Soto M., Justicia H, Wary W. and Sonnenschein C.; Environ. Health Perspect 92
(1991) 167.
54. Hileman B.; Chem Eng. News, 31, 72 (January, 1994)19.
55. Jobling S., Sheahan D., Osborne J., Mathiessen P. and Sumpter P.; Environ. Toxicol.
Chem. 15 (1996) 194.
56. Sharpe M., Fisher S., Millar M., Jobling S. and Sumpter P.; Environ. Health Prespect
103 (1995) 1136.
57. Krueger J., Radakovih M., Sawyer E., Barber B. and Smith L.; Environ. Sci. Technol.
32(1998)3954.
58. Utsunomiya A., Mori Y. and Hasegawa K.; Jpn. J. Toxicol. Environ. Health 44
(1998) 264.
59. Utsunomiya A., Watanuki T., Tomita I. and Matsusbita K.; Environ. Toxicol. Chem.
16(1997) 1247.
60. DeWolf W. and Feijtel T.; Chemosphere 36 (1998) 1319.
61. Abd-Allah M. and Srorr T.; Water Research 32 (1998) 944.
62. Fox K., Chapman L., Solbe J. and Brennand V.; Tenside Surfactants Detergents 34
(1997) 436.
63. Garcia P., Garcia R. Marquez S. and Alonso Q.; Chem. Biochem. Eng. Q. 10 (1996)
75.
64. Schoberl P.; Tenside Surfactants Detergents 26 (1989) 86.
65. Maki W. and Bishop E.; Environ. Contamination Toxicology 8 (1979) 599.
66. Lewis A.; J. Ecotox. Environ. Safety 1 (1983) 313.
67. Kimberle A. and Swisher R.; Water Research 2 (1977) 31.
203

68. Michael R.; Toxicology Applied Pharmacology 12 (1968) 473.
69. De Henau H.; Tenside Surfactants Detergents 26 (1989) 108.
70. Kimberle A.; Tenside Surfactants Detergents 26 (1989) 176.
71. Granmo A ., Ekelund R., Magnusson K. and Berggen M.; Environmental Pollution 59
(1989) 115.
72. Bressan M, Brunetti R., Casellato S., Fara G., Marin M., Giro P., Nerisolo P.,
Tallandini L., Thomann S., Tosoni L. and Turchetto M.; Tenside Surfactants
Detergents 26 (1989) 148.
73. Ornston L. and Ornston K.; J. Bacteriol 98 (1969) 1098.
74. Carlos F., Willaed T. and Zeitoun M.; Applied Microbiology 24 (1972) 911.
204

CHAPTER SIX
General Conclusions and Future Work

6.0 Conclusion
Alkylphenol ethoxysulphonate (NPEOS and OPEOS) and alkyl aryl sulphonate (sodium
dodecyl benzene sulphonate (DBS“N a)) anionic surfactants have been found to tolerate
high salinity water containing divalent cations. Thus, these chemicals are important
candidates for use in enhanced oil recovery (EOR) processes in off-shore reservoirs
where sea water is the injection fluid. In the work described in this thesis, three different
analytical methods (HPLC, LC-MS and MALDI/MS) for NPEOS, OPEOS and DBS’
Na^ surfactants analysis have been developed.
HPLC separation methods for NPEOS, OPEO and a mixture of 3:1 DBSXJa^and NPEOS
using C8/SAX, Cl 8/SAX and C4/SAX mixed-mode columns and a fluorescence detector
have been developed. Each method shows excellent resolution for all surfactants.
A range of extraction methods was investigated for the extraction of NPEOS and
OPEOS surfactants from distilled water and sea-water, and for the extraction DBS'Na
surfactants from sea-water only. A method reported in the literature was successfully
adapted for the extraction of these surfactants. It used graphitised carbon black (GCB)
SPE cartridges, and it was applied by decreasing the concentration of the ion pair reagent,
tetramethylammonium hydroxide (TMAOH), from that used in the published method.
The recovery data for the extraction of NPEOS (at two different concentrations) and
OPEOS from each of the matrices were excellent and reproducible. Recovery data for
the extraction of DBS'Na^ from sea-water were also excellent and reproducible. Slightly
poorer reproducibility for the extraction of NPEOS and OPEOS surfactants from distilled
206

water was observed and the reason for this is unknown. It may, however be due to the
surfactants existing in differing ionic forms in distilled water. These are the first data
reported showing the extraction of these three surfactants from sea-water by SPE and the
good sensitivity and recoveries obtained do suggest that SPE followed by LC with
fluorescence detection would be the method of choice for the determination of these
compounds in surface water samples.
A method was developed for qualitative analysis of NPEOS and OPEOS surfactants by
MALDI mass spectrometry. Solutions were mixed with a concentrated solution of either
a-cyano-4-hydroxycinamic acid (HCCA) for NPEOS or 2,5-dihydroxybenzonic acid
(DHB) as a matrix and a concentrated solution of lithium chloride was also added as a
source of lithium ions before crystallisation. The addition of lithium ions formed solely
[M+Li]^adducts, and created much cleaner, less complicated spectra.
The LC methods developed were compatible with LC-MS. In electrospray positive ion
mode, ions observed corresponded to [M-Na+H+NH4] ̂ adducts for NPEOS and OPEOS
surfactants, the original sodium presumably being completely displaced by the use of the
ammonium acetate in the mobile phase.
Data obtained from each method indicate that the NPEOS formulation has an ethoxymer
chain length ranging from 2-13 units with average of approximately 6.26 (calculating an
average of the values obtained from each technique). The NPEOS data obtained by LC-
MS indicates about one oligomer unit less than LC and MALDI/MS techniques. This is
207

in broad agreement with earlier studies, although the range of ethoxymer units was
reported in these to be from 2-15. The data for the OPEOS formulation suggests that it
has an ethoxymer chain length ranging from 1 -8 ethoxymer units with an average chain
length of 3.58.
In order to identify the intermediate products that were obtained from the biodegradation
of NPEOS using bacteria, chemical oxidation studies using Fenton’s reagent were carried
out and the intermediate oxidation products identified.
The experiment carried out on the oxidation of NPEOS surfactants using Fenton’s
reagent, indicated a very fast oxidation reaction, and in few hours NPEOS completely
converted to intermediate oxidation products. The presently available experimental data
obtained from three different techniques (HPLC, MALDI/MS and LC-MS) for the
oxidation products indicates that the major products are dicarboxylic acids CNPEnC
(n = 0 - 4) along with some traces of single carboxylic acids (NPEnC), with carboxylation
occurring at both the ethoxymer chain and alkyl chain
The biodegradation of NPEOS surfactants was investigated by using two different type of
microorganisms ( Paracoccus, and Bacterium T-52). Initial data appear to suggest that
the biodegradation of NPEOS by Paracoccus halodenitirificans also leads to the
formation of CNPEnC and NPEnC, in themselves potentially toxic substances. If this is
confirmed by further work it would prove that NPEOS has the potential to be harmful to
a marine environment.
208

6.1 Future work
It would be interesting to repeat the experiments on the biodegradation of NPEOS using
real sea-water and surface-water samples, collected from the Mediterranean around off
shore and in-shore oil fields. The extraction method developed in this work and
instruments such as LC, LC-MS and MALDI/MS could then be used to investigate and
obtain information about the effect of microorganisms living in Mediterranean sea-water
on the NPEOS surfactants, to the identification of the biodegradation products, and
potential effects on human and marine life considered.
It also would be of interest to carry out biodegradation experiment using different EOR
surfactants i.e OPEOS and alkyl aryl sulphonates. The possible effects of biodegradation
products from these types of surfactant on humans and marine organisms could then be
discussed.
The chemical oxidation work could be extended by trying to carry out further
experiments on the oxidation of OPEOS and alky aryl sulphonates by using Fenton’s
reagent. Analysis of the intermediate products by different techniques might confirm the
structure of in the biodegradation work. The complete analysis of alkyl aryl sulphonates
by LC-MS/MS and MALDI/MS could also be carried out.
209

September 1998
Meetings and Symposia Attended
BMSS—Annual Conference, University of Warwick