Embed Size (px)
Citation preview

The American University in Cairo
School of Business
The Impact of Improved Irrigation Systems on Water Scarcity and Sustainable
Development in Egypt
A Thesis Submitted to
The Economics Department
in partial fulfillment of the requirements for
the degree of Master of Arts
by Farah Deghaidy
Under the supervision of
Professor Adel A. Beshai
ii
DEDICATION
To my true blessings,
To my loving father and mentor Ahmed Zaki Deghaidy. I will always be grateful and
proud for having you as my father.
To my loving mother and best friend Hala Badr. You truly define my life with your
support and care.

iii
ACKNOWLEDGEMENTS
The completion of this thesis would not have been possible if it wasn’t for my caring
supervisor Professor Adel Beshai. It has been an honor to be his student and I have
benefited greatly from his knowledge and support. I also want to thank my readers
Professors Samir Makary and Mohamed Bouaddi. Thank you for making it possible for
me to master my topic, for teaching me and for your time and effort. It is truly an honor
to have such great professors taking part of this research.
I owe great gratitude to Professor Ahmed Kamaly for helping me take the right path and
cross over from writing a course paper to starting a thesis topic. Thank you for your
guidance, patience and support.
I am in debited to thank every great professor I had the chance to be their student. Thank
you for enlightening me.
I want to thank Mrs. Amira Bishara, Mrs. Nancy and Mrs. Heba Halim for all the help,
assistance and advising they granted.
I have found my passion in economics thanks to my first undergraduate economics
professor, Professor Hala El Hadidy.
Thanks to my family, friends and work colleagues and superiors for giving me the
strength to get where I am and motivating me to follow my dreams.

iv
ABSTRACT
The American University in Cairo
School of Business
The Impact of Improved Irrigation Systems on Water Scarcity and Sustainable
Development in Egypt
by
Farah Ahmed Zaki Deghaidy
Under the Supervision of
Professor Adel Beshai
Water plays a crucial role in the economic development of countries worldwide. Egypt is
a developing country facing serious challenges for achieving sustainable development
because of water scarcity problems especially, within the agricultural sector. Water
scarcity is limiting the agricultural development, threatening sustainability of land and
water resources and increasing water management problems. Therefore, water scarcity is
imposing constraints on the country’s economic growth, food security and economic
development of the country. To meet the increasing demand on food and water, the
government has been adopting strategies for improving water use and water management
especially in the agricultural sector. This study evaluated the impact of water scarcity on
economic growth and sustainable development in Egypt by empirically analyzing the
economic productivity, sustainability and management of land and water resources. The
study identified and analyzed the impact of water scarcity within the agricultural sector,
where the majority of water resources are allocated. The study found that during the
winter season the economic productivity of land and water resources is within average.
However, the land productivity is not achieving sufficient growth therefore, could be
imposing threats on food security. Based on evaluating water quality indicators the study
found that the irrigation water does not meet the sustainability measurements and could
affect the long run productivity and sustainability of land and water resources. Based on
evaluating water stress and undertaking location comparative analysis the study found
that there is inequity between the different locations due to inefficient use and
management of water resources. However, during the winter season and due to the reuse
of drainage water the plants do not suffer from water stress. Furthermore, this study
evaluated the impact of the irrigation improvement projects on water scarcity and
sustainable development based on testing the economic productivity, sustainability and
management of land and water resources. Based on the results obtained in this research
the study concluded that the irrigation improvement projects still did not achieve its main
goals of increasing agricultural production, improving the long run sustainability of
irrigation and improve water use and management in the agricultural sector.

v
TABLE OF CONTENTS
LIST OF TABLES………………………………………………………………………vii
LIST OF FIGURES……………………………………………………………………..ix
LIST OF ABBREVIATIONS………………………………………………………….x
I- Introduction……………………………………….……………………..……………1
II- Theoretical Background………………………………………………………….…..4
Water Scarcity, Water Management and Sustainable Development…..………..4
Egypt and the economics and politics of the Nile Water Management.…...…....4
The Major Water Scarcity Problems within the Agricultural Sector in Egypt….5
Water Management in the Agricultural Sector in Egypt……………………......6
The Research Problems and Hypotheses……………………………………......7
III- Literature Review………………………………………………………………...…8
The Problem of Water Scarcity………………………………………………....8
Effect of Water Scarcity on Development………………………………….…..9
Effect of Improving Irrigation Efficiency on Water Scarcity and Sustainable
Development………………………………………………………………….…10
Policies and Strategies for Improving Water use and Water Management in the
Agricultural Sector in Egypt…………………………………………………….12
Advantages and Disadvantages of the Current Irrigation System in Egypt….....13
The Controversy on the Impact of the Irrigation Improvement Projects on Water
Scarcity in Egypt……………………………………………………………..…15
IV- Methodology and Data……………………………………………………………...18
Methodology, Variables and Variables’ Measurements……………………......18
Data and Samples………………………….……………………………………21
Tools of Testing and Analysis…………………………………………………..23
V- Results and Analysis…………………………………………………………………25
1. Economic Productivity of Land and Water Resources…………………...…………..25
1.1 Water Productivity………………………………………...…………………….25
1.2 Yields and Water Consumption…………………………..……………………..25
2. Sustainability of Land and Water Resources…………………………………………27
2.1 Dissolved Oxygen Ratio…………………………………………..…………….27
2.2 Alkaline Ratio……………………………………………...………...………….30
2.3 Salinity Ratio………………………………………………...………………….34
3. Water Use and Management Efficiency………………………………………………36
3.1 Water Stress (relative evapotranspiration ratio)……………...…...……………..36

vi
3.2 Location Comparative Analysis………………………….………………...……37
3.2.1 Economic Productivity of Land and Water Resources….……………...……..37
Water Productivity…………………………………………………………..37
Yields………………………………………………………………………..37
3.2.2 Sustainability of Land and Water Resources………..…………………………38
Dissolved oxygen ratio………………………………………………………39
Alkaline ratio………………………………………………………………...39
Salinity ratio………………………………………………………………….40
3.2.3 Water Use and Management Efficiency…………...………………………..…41
Water stress (relative evapotranspiration ratio)………….…………………..41
4. The Irrigation Improvement Projects Analysis…………...…………………………...46
4.1 Improved and Unimproved Comparative analysis……………………………....46
4.1.1 Economic Productivity of Land and Water Resources…………………….…..46
Water Productivity…………………………………………………………..46
Yields………………………………………………………………………..46
4.1.2 Sustainability of Land and Water Resources………………………….…….....48
Dissolved oxygen ratio………………………………………………………48
Alkaline ratio………………………………………………………………...49
Salinity ratio………………………………………………………………….49
4.1.3 Water Use and Management Efficiency……………………...……….....…….50
Water stress (relative evapotranspiration ratio)…………...…………………50
Location Comparative analysis for the Improved Canals………………..…..51
o Economic Productivity of land and water resources…………………51
o Water use and Management Efficiency…………....………………..54
V- Conclusion……………………………………………………..……………………..55
References………………………………………………………......……………………61
Appendices…………………………………………………………….…………………66
Appendix A: The Branch Canals’ Names, Location and Improvement Status during the
Winter Seasons of 288/20009 and 2013/2014…………………………..……………….66
Appendix B: Economic Productivity of Land and Water Resources Indictors for
Wheat…………………………………………………………………….……………....69
Appendix C: Sustainability of Land and Water Resources Indicators Time-Series
Data………………………………………………………………………………………72
Appendix D: Water Stress Indicator for Wheat………………………….……………..80
Appendix E: Shpairo- Wilk Test Results.………………………………………………83

vii
LIST OF TABLES
Table 1: Summary of Indicators, Ratios and Variables Used……………………………21
Table 2: Summary of the Methods Applied to Test the Research Hypotheses……….…24
Table 3: Summary of the descriptive statistics of the economic productivity of land and
water resources…………………………………………………………………………..26
Table 4: Summary for the tests results for the economic productivity indicators……….26
Table 5: Summary for the descriptive statistics of the dissolved oxygen ratio………….28
Table 6: Summary for the tests results for the dissolved oxygen ratio…………………..28
Table 7: Summary for the descriptive statistics of the alkaline ratio…………………….32
Table 8: Summary for the tests results for the alkaline ratio…………………………….33
Table 9: Summary for the descriptive statistics of the salinity ratio……………………35
Table 10: Summary for the test results for the salinity ratio…………………………….35
Table 11: Summary for the descriptive statistics for the indicator of water stress………36
Table 12: Summary for the location comparative analysis descriptive statistics for winter
2008/2009………………………………………………………………………………..41
Table 13: Summary for the location comparative analysis descriptive statistics for winter
2013/2014………………………………………………………………………………42
Table 14: Summary for the test results for productivity location comparative analysis..42
Table 15: Summary for the test results for the sustainability location comparative analysis
within each branch canal………………………………………………………………..43
Table 16: Summary for the test results for the sustainability location comparative analysis
within among the branch canals…………………………………………………………44
Table 17: Summary for the test results for water stress location comparative analysis
within among the branch canals…………………………………………………………45
Table 18: Summary for the descriptive statistics for productivity improved and
unimproved comparative analysis during winter of 2008/2009…………………………47
viii
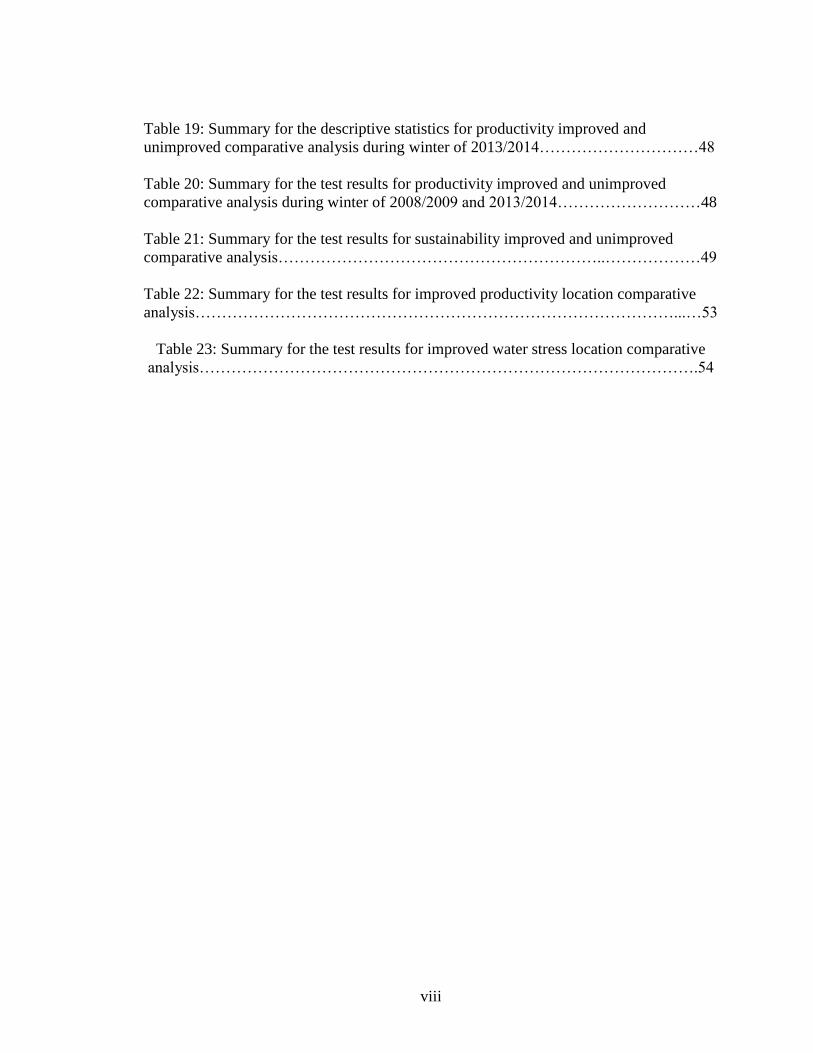
Table 19: Summary for the descriptive statistics for productivity improved and
unimproved comparative analysis during winter of 2013/2014…………………………48
Table 20: Summary for the test results for productivity improved and unimproved
comparative analysis during winter of 2008/2009 and 2013/2014………………………48
Table 21: Summary for the test results for sustainability improved and unimproved
comparative analysis……………………………………………………..………………49
Table 22: Summary for the test results for improved productivity location comparative
analysis………………………………………………………………………………...…53
Table 23: Summary for the test results for improved water stress location comparative
analysis………………………………………………………………………………….54

ix
LIST OF FIGURES
Figure 1: Illustration of the Impact of Water Scarcity on Growth and Sustainable
Development in Egypt ………………………..…………………………………………6
Figure 2: Map Adopted from Remote Sensing Study for the Impact of the Integrated
Irrigation Improvement and Management Project, by H. Peigrun, R. Kassies and M.
Voogt, 2014, Egypt: Unpublished Report by eLEAF under assignment of IIMP, MWRI,
Egypt. Copyright 2014 eLeaf and GeoMAP. Obtained from: Water Management
Research Institute, 2016…………………………………………………………………22
Figure 3: The PH Trend at the Head, Middle and Tail of Khadeega Branch Canal……..30
Figure 4: The PH Trend at the Head, Middle and Tail of Dakkalt Branch Canal ………30
Figure 5: The PH Trend at the Head, Middle and Tail of El Mashraqa Branch Canal…..31
Figure 6: The PH Trend at the Head, Middle and Tail of Bahr Semalla Branch Canal…32

x
LIST OF ABBREVIATONS
2030WRG……...2030 Water Resources Group
DO………………Dissolved Oxygen
EC……………….Electrical Conductivity
ET………………..Evapotranspiration
FAO…………… Food and Agriculture Organization of the United Nations
IMP……………..Improved
IIIMP……………Integrated Irrigation Improvement and Management Project
IIP………………The Irrigation Improvement Project
IWRM………….Integrated Water Resource Management
MENA…………Middle East and North Africa
MWRI………….Ministry of Water Resources and Irrigation
RET……………Relative Evapotranspiration
UNDP….............United Nations Development Programme
UNEP…………..United Nations Environmental Programme
UN-IMP………..Unimproved
WUA…………….Water Users Association

1
I. Introduction
Due to the uneven distribution of resources and populations, many countries across the
world are facing serious challenges in achieving sustainable development. Achieving
sustainable development is to attain the development goals and maintain the demand of
the present without imposing risks on the ability of maintaining the development and
demand of the future generations. Water is an essential resource for human life and
practically all economic activity. However, only 2.5% of Earth’s surface water is fresh
water (UNEP, 2006), making water a scarce resource. Already, around one fifth of the
world’s population is living in countries with physical water scarcity 1(UNDP, 2006).
Furthermore, environmental degradation, urbanization, increasing population and
increasing economic activity are all factors aggravating water scarcity. It is expected that
40% of the world will be facing water deficit by the year 2030 (2030 WRG, 2009). To
lessen the effect of water scarcity and achieve sustainable development, improving
efficiency of water resource management has become the focus of researchers and policy
makers around the world.
Especially in arid and semi arid developing countries, the main reason for water
scarcity is the inefficient management and use of water resources. In other words, many
developing countries are facing economic water scarcity in which underdeveloped water
systems cannot efficiently meet the demand for water by the different sectors. Although
problems of water scarcity would affect all sectors of the economy, the impact of water
scarcity is most severe within the agricultural sector. Globally, around 70% of global
water resources are directed to the agricultural sector for irrigation and food production
(UNDP, 2015). As the agricultural sector is the largest consumer of water and is essential
for food security and reducing poverty rates, the agricultural sector plays a crucial role in
the water management process and economic development of developing countries like
Egypt.
1 Physical water scarcity is the inability to meet water demand due to lack of water supply in which the
demand for water would not be satisfies even with improvement in water resource management.

2
Indeed, with 26.3% of the population below the national poverty lines as reported
for the year 2014 (UNDP, 2014), the agricultural sector plays a significant role in Egypt’s
economy. Egypt’s agricultural and arable lands account for approximately 3.8% and
2.7% of its total land area (World Bank, 2013). The agricultural sector had employed
22.6% of the labor force during 2014 (FAO, 2014) and produced 14.5% of the gross
domestic output for the year 2013(World Bank, 2013). However, due to water scarcity,
the country’s agricultural development is already limited. According to the Ministry of
Water Resources and Irrigation (MWRI), Egypt has already passed the threshold of
absolute water scarcity2 (MWRI, 2014). During 2014, the total per capita water
consumption had fallen to 6.991 m3 (AQUASTAT, 2014). In addition, climate change,
environmental degradation, increase in population, and inefficient water management are
all factors contributing to the problem of water scarcity in Egypt. Rationally, it is
expected that competition on water resources among the different sectors will increase
and less water would be allocated for the agricultural sector.
Egypt is mainly arid all year, receiving average precipitation of only 51mm
annually (World Bank, 2014). The Nile River is the single source of freshwater in Egypt.
Egypt consumes its entire fixed annual share of 55.5 billion m3, which accounts for 97%
of its annual freshwater supply (FAO, 2011). The agricultural sector is the largest
consumer of water in Egypt, where most water resources are directed for food production
and irrigation. During 2013, 86% of the country’s total annual water supply was
consumed by the agricultural sector, followed by the domestic sector and the industrial
sector consuming only 8% and 6% respectively (World Bank, 2013). To achieve
sustainable development, improving efficiency of water management especially within
the agricultural sector has become the focus of policy makers in Egypt.
Due to its arid climate, agriculture depends mainly on irrigation. Surface
irrigation3 is mainly utilized in most irrigated land area and return flows are usually
2 Falkenmark water scarcity indicators defines absolute water scarcity when water per capita falls below
500m3.
3 Under surface irrigation, water is over applied on one end of the soil surface and gradually covering the
entire field by gravity.

3
reused for irrigating the lands again. The return flows reuse leads to the high over all
water use efficiency4 in Egypt. However, over application of water under surface
irrigation and inefficient supply of water to the canals leads to the lower field irrigation
efficiency5, in which many fields suffer from water shortages. Furthermore, water reuse
and water shortages increase land degradation and salinity, which in turn, decrease land
quality and productivity. The International Center for Agricultural Research in the Dry
Areas (ICARD, 2011) reported that 35% of the irrigated lands, mainly in the north central,
western, and eastern parts of the Delta are suffering from land salinity.
With average annual population growth rate of 2% (World Bank, 2014) and high
poverty rates reaching 26.3% in 2014 (UNDP, 2014), Egypt’s government is faced with
serious challenges in order to cope with the increasing demand for food and water and
achieve sustainable development while receiving a fixed share of the Nile River. The
government had implemented several projects aimed to improve water use in agriculture,
help lessen the effect of water scarcity and maintain land and water sustainability. The
purpose of this research is to identify and analyze the major water scarcity problems
within the agricultural sector and their economic impact in Egypt. In addition, this
research aims to test and analyze the impact of the irrigation improvement projects on
water scarcity and sustainable development.
The organization of the paper is as follows, section II presents the theoretical
background and section III reviews the important theoretical and applied literature of the
mentioned research topic. Section IV presents the data and methodology. Section V
presents the results and analysis. Finally, Section VI presents the conclusion.
4 Water use efficiency is the ratio between the amount of water used and the total amount of water supplied.
5 Field irrigation efficiency is the ratio between the amount of water effectively used and the amount of
irrigation water applied.

4
II. Theoretical Background
As mentioned earlier, the concept of sustainable development implies that countries
should meet the demands of the present generations and achieve economic development,
without imposing risks for future generations to do the same. Therefore, the efficient use
of resources is mandatory in order to achieve sustainable development. However, the
problem of water scarcity complicates the process of sustainable development. Water
scarcity could be attributed to the lack of physical water, referred to as physical water
scarcity and/or the inefficient utilization of water resources, referred to as economic
water scarcity. Several internal and external factors aggravate the problems of water
scarcity. Internal factors could include the rapid population growth, increasing
urbanization and inefficient management of water resources. The external factors could
be aridity and as in many countries, the dependency on shared international rivers that
originate outside the country’s boarders for water supply as in the case of Egypt.
The Nile River is an international river shared by ten countries and governed by
international agreements for the allocation of its water resources. According to a study by
Cascao (2009), the first agreement signed by Egypt and Great Britain in 1929 had
allocated 48 billion m3, the biggest share, to Egypt. As from this agreement, Egypt and
Sudan have been securing their rights in the water supply of the river through promoting
the concept of a natural and historic right of the Nile water. Following the first agreement
was the 1959 agreement between Egypt and Sudan, which allocated 55.5billion m3 to
Egypt and 18.5billion m3 to Sudan. Both agreements were dissented by the Nile upstream
countries. The upstream countries want to replace the 1959 agreement with an agreement
that provides equity of water resources among the countries. Consequently, there has
been an on going debate on the allocation of the Nile water resources between the
upstream countries and downstream countries, Egypt and Sudan.
According to the same study, the main reason Egypt has been able to control and
receive the biggest share of the Nile water is its relative development in hydraulic
infrastructure and storage capacity mainly, determined by the construction of the Aswan
High Dam. In addition, the author defined three other reasons for Egypt’s relative

5
absolute control over the Nile water resources. The author argued that the first reason is
that Egypt had the strongest access to external political and financial support; it is the
most economically developed among the Nile River Basin countries, has strong military
base and relative political stability. Second, Egypt had strong bargaining power due to its
political and economical status and by using the concept of the country’s natural and
historic right of the Nile waters. Third, Egypt has been publicly promoting that the Nile
water security is a matter of national security. However, the changes in the economic and
political stability within the Nile basin countries could impose threats on the persistence
of the 1959 agreement and Egypt’s share of the Nile river water resources.
As the political and economic instability of the upstream countries have been
diminishing over time, the countries have been initiating several projects and agreements
to improve their utilization of the Nile water resources. After the establishment of the
East African Community regional intergovernmental organization that includes Uganda,
Tanzania, Kenya, Burundi and Rwanda, the countries have been emphasizing their rights
in the Nile waters. Furthermore, both Sudan and Ethiopia have been implementing
several projects for agricultural and hydropower developments. For example, Ethiopia
took advantage of the political instability that took place in Egypt during 2011 and
initiated the construction of a new dam for hydropower generation. So far, the political
and economic changes within the Nile basin countries have not actually affected Egypt’s
share of the Nile water. Nevertheless, as mentioned in the pervious section, because of
aridity and several internal factors Egypt is facing serious water scarcity problems
especially within the agricultural sector. Some of the major water scarcity problems
within the agricultural sector influencing Egypt’s economic growth and sustainable
development can be summed as follows,
1- Water scarcity is limiting the development of new agricultural
lands and is increasing the pressures on the fully utilized old agricultural lands
therefore, limiting the growth of land and water productivity.
2- Water scarcity increased the dependency on unconventional water
resources, which degrades land and water quality and impose threats on the
resources sustainability.

6
3- Water scarcity created water shortages in some fields and inequity
of water distribution among the branch canals and among fields, which increased
water management problems.
From the problems stated, the following figure illustrates the impact of water
scarcity on economic growth and sustainable development in Egypt
Figure 1: Illustration of the Impact of Water Scarcity on Economic Growth and Sustainable
Development in Egypt
The figure shows that each problem directly affects economic growth and
sustainable development and that all problems are directly related. To increase resilience
to water scarcity problems, Egypt’s government is adopting new policies and strategies in
managing its current water resources and improving the water network infrastructure. The
MWRI recognized that the sustainability of irrigation system would only be achieved by
the participation of water users in managing the water distribution and in sharing the
Water scarcity
Limit land and
water
productivity
Increase in
drainage reuse
Water shortage
and inequity
Degradation of land and
water quality
Threatening land and
water sustainability
Increase water
management problems
Increase Poverty
Impose risk on food
security
Limit farmers’ welfare
and income
Limit growth in
agricultural and national
output
Economic
Growth and
Sustainable
Development

7
costs of improvements, operation and maintenance of the irrigation system. Accordingly,
the government implemented irrigation improvement projects that aimed to provide
solutions for the problems affecting the productivity, sustainability and management of
land and water resources.
The irrigation improvement projects were implemented through an Integrated
Water Resources Management approach, which embedded various technical and
institutional reforms and decentralizing the governance of irrigation water resources. The
projects introduced two major physical changes to the irrigation system. The first,
replacing the rotational schedule for distribution of water by the introduction of the
continuous flow of water to the branch canals. The second, replacing the use of the
privately owned mobile diesel water pumps to channel water from the canals to the fields
with single-point water lifting. According to the MWRI, the continuous flow should
provide farmers with reliable and flexible water delivery and in return will help increase
production, decrease water loss and provide equity of water distribution. The single point
lifting would reduce pumping costs and effort, help overcoming inequity of water
distribution problems and provide land saving as it require less land capacity.
In view of the water scarcity problems and the implementation of the irrigation
improvement projects, this research will analyze the impact of water scarcity on
economic growth and sustainable development through testing the following hypotheses:
1- Water scarcity is limiting the growth of land and water productivity.
2- Deterioration of water quality is threatening the sustainability of land and
water resources.
3- Inefficiency of water use and management is creating water shortages and
inequity of water distribution.
In addition, this research will provide a detailed analysis of the impact of the
irrigation improvement project on water scarcity and sustainable development through
testing the following hypothesis:
4- The irrigation improvement projects have improved productivity, sustainability
and management of land and water resources.

8
III. Literature Review
This literature review section is divided into two main parts. The first part reviews the
important literature addressing the problem of water scarcity, the effect of water scarcity
on sustainable development, and finally, the impact of improved water use in agriculture
and irrigation on water scarcity and sustainable development. The second part reviews
important literature addressing water scarcity and water use in the agricultural sector in
Egypt.
The geographical location of regions determines the climatic conditions and
availability of water resources in countries, placing many countries in arid conditions
with limited water resources. Falkenmark et al. (1989) distinguished between natural
water scarcity that is due to arid climate and droughts and manmade water scarcity
derived by increasing water demand due to population growth. They also identified water
scarcity of land desiccation that is due to the effect of both. The authors highlighted that
the occurrence of natural and manmade water scarcity simultaneously creates severe
conditions. However, they argued that the aggravation of water scarcity problems is not
due to the natural water scarcity, but rather due to the rapid population growth and the
adoption of unsustainable economic development polices that underestimated the long
run limitations of natural resources and climatic conditions. The authors defined the most
widely used water scarcity indicators, referred to as Falkenmark6 water scarcity indicator,
where decreasing water flow per person, increases competition on water resources and
creates severe water management problems.
Due to the global increasing pressures on water resources derived by increasing
economic activities and population growth, the problem of water scarcity has its impact
on all regions of the world. Indeed, the problem of water scarcity varies across different
regions of the world. The United Nations Water programme (2006) reported that the
problem of water scarcity is most severe in arid and semi arid developing countries. In a
study by Dabour (2006), the author argued that the Arab countries are mainly arid and are
6 Falkenmark indicators define water scarcity based on annual water supply per person. If water per capita
falls below 1,700m3 the country is an indication of water stress, falling below 1,000m
3 is an indication of
water scarcity and falling below 500m3 is an indication of absolute water scarcity.

9
of the poorest in terms of water resources, receiving as low as 2.1% of the world’s
average annual precipitation and 0.3% of its annual renewable water resources.
According to this study, many Arab countries depend on water resources flowing from
outside the countries’ boarders. This leads to a high dependency ratio7 and a limited share
of annual water resources, which can cause political tension among countries and
competition on water resources among and within the countries.
The impact of water scarcity varies across regions and sectors of the economy
depending on the water use among each. Peterson and Klepper (2007) assessed the
regional economic impact of water scarcity using the water intensity indicator8. They
found that the water intensity indicator was highest in South Asia followed by the MENA
region. They also found that except for the high-income regions of the European Union
and the United States, the water intensity indicator was higher for the agricultural sector
relative to the industrial and domestic sectors. Therefore, they concluded that the
economic impact of water scarcity is the lowest in Europe and highest in South Asia and
the MENA region, mainly affecting their agricultural production. Bassi et al, (2007)
studied the impact of water scarcity among the different sectors in Europe. According to
this study, in the agricultural sector, water scarcity would impose threat on food security
and poverty by limiting agricultural development and productivity. Within the domestic
sector, water scarcity would be a cause of serious health and hygiene problems. In the
industrial sector, water scarcity would mainly affect power supply and industrial
productivity. They concluded that without efficient management of water resources in all
sectors, the impact of water scarcity would not be limited to a single sector and it would
negatively affect economic growth and sustainable development.
Although in the past, supply-side strategies that developed new water resources to
meet the demand were effective in achieving economic growth and development, the
adoption of such policies today however, is limited in many countries around the world.
Randall (1981) defined a mature water resource economy as those characterized by
7 Dependency Ratio gives the percentage of total renewable water resources originating outside the country
or region. 8 Water intensity indicator measures water use in m
3 per dollar unit of output in a sector or GDP.

10
inelastic supply of water causing high competition on water resources and in which water
scarcity is limiting the development of new water resources and new irrigated land areas.
Moving from an expansionary water economy to a mature water economy has drifted the
focus of efficient water management strategies from a supply-side to demand-side
strategies, which adjust the demand on water resources within sectors according to its
availability. As the majority of water resources are directed to the agricultural sector and
irrigation, the impact of water resource management in the agricultural sector on water
scarcity and sustainable development has been the focus of many studies on global and
national levels.
The agricultural sector plays a crucial role in eliminating poverty, maintaining
food security and economic development and is the largest consumer of water resources
in most countries. Accordingly, many studies have suggested the importance of efficient
water resource management in the agricultural sector to meet the future demand on food
and water and achieving sustainable development. For example, studies by Seckler et al.
(1998), and Kamara and Sally (2004) argued that the adoption of improved irrigation
technologies and policies, especially in countries with arid and semi-arid conditions, is
essential in order to meet the future demand on food and water. A study by de Fraiture
and Wichelns (2010) concluded that the global land and water resources would be
sufficient for maintaining future global demand for food and water only under the
condition of effective water management in the agricultural sector. As agricultural
production in most countries depends mainly on irrigation, Calzadilla et al (2011) used
computable general equilibrium analysis and found that when more countries improve
their irrigation efficiency, there would be an increase in global water savings and
agricultural production leading to higher global welfare especially in water stressed
regions. In conclusion, as suggested by many studies and Koc (2015), irrigation
management plays a crucial role in water resource management. Improving irrigation
efficiency to promote for sustainable development and lessen the impact of water scarcity
is essential especially in arid and semi-arid countries where there is high competition
among water users.

11
In many countries worldwide, the traditional surface irrigation systems has been
replaced with modernized irrigation systems such as drip irrigation and sprinkler
irrigation9 in order to improve water use efficiency and achieve sustainable development.
Cancela et al (2006) studied the impact of utilizing sprinkler irrigation systems in
Northern Spain. They argued that the adoption of sprinkler irrigation would be effective
only if the irrigation management process has critical assessment and planning based on
soil type, each crop water requirement, climatic and hydrological conditions. Tronqvist
and Jarsjo (2011) used a distributed hydrological model to simulate the impact of various
irrigation systems on water use and crop production in Central Asia. The authors
concluded that replacing surface irrigation with alternate surge flow irrigation10
followed
by drip irrigation achieves the highest increase in water savings and crop yield as
compared to other irrigation systems.
Several studies empirically tested and analyzed the factors and policies
influencing the replacement of the traditional surface irrigation systems in different
countries. Lopez-Morales and Duchin (2011) used input-output optimization model to
test the effectiveness of water fees and caps applied on water withdrawals in influencing
the adoption of drip and sprinkler irrigation systems in Mexico. They found that water
fees and water caps had positive effect on replacing surface irrigation with drip and
sprinkler irrigation especially in water scarce regions; and would yield enough
government revenue that would enable the government to subsidize the adoption cost.
Kumar (2012) studied the factors that determine the adoption of drip irrigation systems in
India using regression analysis. He found that the adoption of drip irrigation was
significantly influenced by farmers’ experience, farm size, cropping patterns and farmers’
participation in other income activities. On another note, Reinders et al (2013) argued
that the replacement of the traditional surface irrigation with modernized irrigation
systems would reduce land degradation problems, increase irrigation efficiency and crop
yield through uniformity of water application to the fields. However, Surface irrigation
9 Drip irrigation system applies water to the roots or the soil surface through a network of valves, pipes,
tubing and emitters. Sprinkler irrigation applies water by pumping water through pipes. 10
Surge flow irrigation is a type of surface irrigation that can save water through applying water in a
serious of on and off periods of constant or varying time spans.

12
systems are still the most widely used irrigation systems in many developing countries
due to the high water use efficiency from the reuse of return flows, as in the case of
Egypt.
Indeed, Egypt is one of many countries suffering from water scarcity problems.
Increasing water management efficiency in the agricultural sector has been the main
concern of policy makers and researchers in order to cope with water scarcity and achieve
sustainable development in Egypt. However, in the case of Egypt, the solution to the
problem does not simply lie in the adoption of modernized irrigation systems.
Although, Abou Kheira (2009) showed by undertaking field experiment on corn
production in the Nile Valley that the adoption of subsurface drip irrigation is most
efficient in achieving water saving and in areas with water logging problems, yet, surface
irrigation systems are the most widely adopted in the Nile valley and Delta. The
replacement of surface irrigation in Egypt is hard to implement for many reasons
including the relatively low farmers’ income level, small farm sizes, high overall water
use efficiency from return flows reuse, and high cost of modernized irrigation systems.
Most importantly, farmers have been using the same irrigation techniques for over 7,000
and therefore, great cultural and social barriers will constraint the replacement of the
traditional surface irrigation. Alternatively, many studies suggested the implementation
of various market policies to reallocate water resources in the agricultural sector, achieve
water saving and increase productivity.
A study by Malshikhia (2003) suggested that implementing water pricing on
water use in the agricultural sector would improve water use. The study suggested that
applying pricing policy on water use in agriculture would shift farmers’ crop choice to
higher value crops and crops that require less water consumption rates. In addition, it will
provide funds for irrigation improvements. Another study by He et al. (2006) also
suggested water pricing as well as input and output tax on water use in the agricultural
sector. However, imposing pricing, input and output taxes policies were found to have a

13
negative effect on some farmers’ welfare, especially those who could not adjust their
choice of crop production.
Other policies include the adoption of virtual water trade as suggested by El-
Sadek (2009). Virtual water trade implies importing goods that require large amounts of
water resources instead of producing them domestically. Although, Virtual water trade
could provide water saving, it requires dramatic change in Egypt’s agricultural
production. It also implies that Egypt would increase dependence on other countries for
food security, which could be affected by any political or economic shocks in Egypt or
the exporting countries. On another level, water trade and cap11
suggested by Gohar and
Ward (2011) were found effective in reallocating water resources and improving water
use in agriculture. Nevertheless, water trade and cap policies would be hard to implement,
as they require legal institutions that do not exist in Egypt, which can offer and govern
those water rights. As the implementation of modernized irrigation systems and the
various market policies would be hard to implement in Egypt, Egypt’s government is
facing serious challenges in order to improve water resource management and maintain
sustainable development while restricted by limited water resources. Over and above,
inefficiencies of the current irrigation systems and policies place increasing pressures on
the sustainability of land and water resources.
The Aswan High Dam in Upper Egypt manages water resources where water is
controlled along the Nile Valley and Delta by seven barrages. The barrages manage the
flow of water to the main canals and then to branch canals and then the water flows to the
distribution canals and irrigation ditches. The supply of water to the branch canals is
under the control of the MWRI and based on a rotational schedule. According to Radwan
(1997) because of the lack of coordination between the MWRI and farmers, there is
usually inadequate supply of water, especially during the summer season. This leads to
water loss when water is oversupplied and obligates farmers to use drainage water for
irrigation when water is undersupplied. In addition, it results in creating conflicts between
11
Water trade and cap policy implies that farmers would be assigned a cap, a water entitlement per unit of
land irrigated where any excess in water use would be provided through a trade of money for water from
any willing seller at certain prices.

14
farmers due to the over application of water by farmers on the head of the canals.
According to Wichelns (2002), over application of water and the inefficient management
of water delivery create severe drainage problems and obligates some farmers to depend
on drainage water for irrigation. Several studies addressed the impact of the drainage
system on irrigation management in Egypt.
The development of the drainage system in Egypt helps mitigate the drainage
problems affecting land and water resources associated with surface irrigation. On the
other hand, several studies acknowledge the consequences of over application of water
and reuse of drainage water. In addition to Metawie, Hassanin (2007) and Shaban et al
(2010) also studied the drainage water quality to evaluate the impact of reuse of drainage
water in irrigation. The studies had similar results and concluded that drainage water
contains high salinity rates and other pollutants. Therefore, they suggested that the reuse
of drainage water in irrigation is sometimes limited to only crops that have high tolerance
to salinity. However, it would still have negative effects on land and water sustainability.
Studies evaluating the impact of the current irrigation systems on irrigated lands also
concluded major problems associated with over application of water and drainage water
reuse.
Kawy (2011) and Kawy and Darwish (2012) Studied land sustainability in
different locations and concluded that the current irrigation techniques increase land
degradation, salinity, and decrease land productivity therefore, jeopardizing land and
water sustainability. Due to water shortage, official reuse of drainage water supplied by
the government and unofficial drainage water reuse practiced by some farmers are
expanding. Barnes (2012) recognizes the importance of drainage water reuse especially,
during the summer season to overcome water shortages. According to this study, drainage
water reuse represents around 20% of irrigation water resources and 10% of the country’s
water needs. However, due to the increasing deterioration of land and water resources,
the author opposes the government’s adoption of drainage water reuse as a solution to
meet water shortages and for expansion of new irrigated lands. Although, drainage water
reuse is debatable, the government integrated the development of the drainage system

15
with the expansion of new agricultural lands and other policies for improving efficiency
of the irrigation system.
In order to meet the increasing demand as a result of the rapid increase in
population and provide solutions to some of the water scarcity problems, Egypt’s
government has been implementing horizontal and vertical expansion policies in the
agricultural sector. Horizontal expansion policy is applied through the expansion of new
irrigated lands in the desert. Vertical expansion policy is applied through improving
current irrigation management techniques and infrastructure to enhance land and water
productivity in the irrigated lands. Conversely, the horizontal expansion policy was
limited by several factors and did not achieve the targeted goals. Using economic
optimization modeling, Wichelns (2002) showed that due to water scarcity, the expansion
of irrigated lands was of high water delivery costs and land productivity was low due to
poor soil quality. In addition, the water resources in the old irrigated lands were
negatively affected by the reallocation of water resources. As water scarcity is already
limiting the expansion of new irrigated lands, the pressure on existing irrigated lands is
increasing.
Due to the increasing pressures, Egypt’s government adopted an integrated water
resource management (IWRM) approach, which addresses the problem of water scarcity
from a demand side. In addition, the IWRM approach integrates several irrigation
improvement policies and encompasses the participation of all stakeholders, including
farmers, in the water management and planning process. The Irrigation Improvement
Project (IIP) was one of the first initiatives applied by the government for implementing
IWRM. The project was followed by several other projects for example, the Integrated
Irrigation Improvement and Management Project (IIIMP), which helps achieve IWRM
and give solutions to problems within previous projects.
The IIP aims to provide farmers with advising, allow them to participate in
irrigation management process, improve on-farm land and water management, and
improve water distribution and infrastructure on the farm and canal level. The
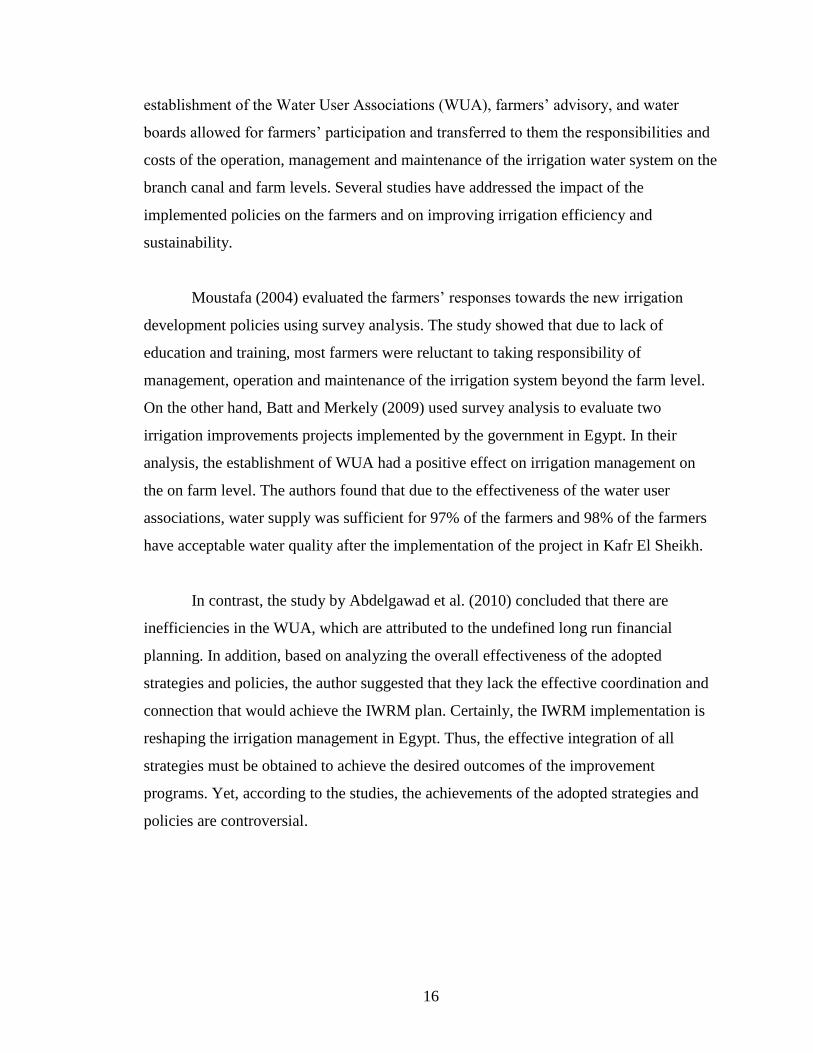
16
establishment of the Water User Associations (WUA), farmers’ advisory, and water
boards allowed for farmers’ participation and transferred to them the responsibilities and
costs of the operation, management and maintenance of the irrigation water system on the
branch canal and farm levels. Several studies have addressed the impact of the
implemented policies on the farmers and on improving irrigation efficiency and
sustainability.
Moustafa (2004) evaluated the farmers’ responses towards the new irrigation
development policies using survey analysis. The study showed that due to lack of
education and training, most farmers were reluctant to taking responsibility of
management, operation and maintenance of the irrigation system beyond the farm level.
On the other hand, Batt and Merkely (2009) used survey analysis to evaluate two
irrigation improvements projects implemented by the government in Egypt. In their
analysis, the establishment of WUA had a positive effect on irrigation management on
the on farm level. The authors found that due to the effectiveness of the water user
associations, water supply was sufficient for 97% of the farmers and 98% of the farmers
have acceptable water quality after the implementation of the project in Kafr El Sheikh.
In contrast, the study by Abdelgawad et al. (2010) concluded that there are
inefficiencies in the WUA, which are attributed to the undefined long run financial
planning. In addition, based on analyzing the overall effectiveness of the adopted
strategies and policies, the author suggested that they lack the effective coordination and
connection that would achieve the IWRM plan. Certainly, the IWRM implementation is
reshaping the irrigation management in Egypt. Thus, the effective integration of all
strategies must be obtained to achieve the desired outcomes of the improvement
programs. Yet, according to the studies, the achievements of the adopted strategies and
policies are controversial.

17
El- Agha et al. (2011) used cross-scale performance assessment indicators12
analysis in order to evaluate irrigation water management in the Nile Delta. Based on the
analysis of the indicators for three branch canals, the study found that there was no
significant difference between the performance of improved and non-improved irrigation
canals. The author concluded that the improvements would not achieve real water savings
due to the inefficient water supply to the branch and main canals. De Bont (2013)
undertook a three months field study and used semi-structured interviews, GPS mapping,
participatory mapping, and salinity measurements during and after the implementation of
IIP in Kafr el Sheikh. In his study, the author questions the similar results obtained by
separate field studies by Allam (2004), Allam et al. (2005) and Kotb and Boissevian
(2012). As those studies give exactly the same results obtained by the Ministry of Public
Works and Water Resources 1998 report, he questions whether the results have been that
consistent or rather the truth is being manipulated on purpose. Based on his own findings
the author concluded, the project did not achieve the desired outcomes due to the
deviations of the project implementation from the proposed plan. In addition, he also
added that the pressure on farmers increased, farmers were struggling with the same
problems they were faced with before while employing different infrastructure that they
had to adapt to.
The literature demonstrates controversial results for the impact of the adopted
strategies and policies in Egypt for improving irrigation efficiency and facing the
problems associated with water scarcity to achieve sustainable development. The
reviewed literature also reflects the critical need to evaluate the impact of water scarcity
on productivity, sustainability and management of land and water resources and test the
effectiveness of the implementation of the irrigation improvement projects.
12
Molden et al. (2005) defined the performance assessment indicators as the process of observation,
documentation and interpretation of irrigation management strategies using various indicators or ratio
analysis.

18
IV- Methodology and Data
This section will present the methodology adopted, samples and data and identify the
variables’ measurements to test the research hypotheses.
As mentioned in section II, this research identified three major problems
associated with water scarcity in the agricultural sector. Accordingly, this research will
test and analyze the impact of water scarcity on economic growth and sustainable
development by evaluating the impact of water scarcity on the economic productivity,
sustainability and management of land and water resources. Furthermore, the impact on
the irrigation improvement projects on water scarcity will be evaluated. Therefore, this
research will test the following hypotheses:
1- Water scarcity is limiting the growth of land and water productivity.
2- Deterioration of water quality is threatening the sustainability of land and
water resources.
3- Inefficiency of water use and management is creating water shortages and
inequity of water distribution.
4- The irrigation improvement projects have improved productivity,
sustainability and management of land and water resources.
Through testing the first hypothesis, this research will evaluate the impact of
water scarcity on the economic productivity of land and water resources specifically for
wheat. The research will use the data on the production of wheat because, it is a water
sensitive crop, high value crop, it plays a significant role in food security and finally,
there is a problem of wheat shortage in Egypt. Due to the wheat shortage, Egypt highly
depends on imports for satisfying the domestic demand for wheat and wheat imports have
been increasing over the past several years. The study will test and analyze water
productivity, yields and water consumption as a measure of economic productivity of
land and water resources.
Water productivity measures the output for each unit of water depleted. It is
measured in terms of water consumed by crops by calculating the ratio between crop

19
yield and actual crop water consumption. Water consumption is measured using the
actual evapotranspiration, which is the evaporation of water from the land surface and the
transpiration from plants. Since water is a scarce resource therefore, ratio should be
maintained at high values and should be increasing over time. The second indicator, the
crop yields, is measured in kilograms. The indicator should be increasing in order to
maintain economic growth, maintain food security, and reduce poverty rates. However,
efficiency in increasing crop yields would be maintained only while improving water
consumption.
The second hypothesis will evaluate the impact of water scarcity on sustainability
of land and water resources, measured using three indicators of water quality. The ratio
between the actual and critical values of each indicator will be computed, tested, and
analyzed. The three indicators are the dissolved oxygen, PH level as a measure of
alkaline, and most importantly the salinity of water using the electrical conductivity.
The Dissolved oxygen (DO) ratio is an indication for the oxygen in the irrigation
water that plants could benefit from. It should be maintained at high levels, as oxygen is
an essential factor for crop growth. Decreasing DO level could be an indication of low
water levels in the branch canals, where higher DO levels are found in flowing water as
compared to still waters. Low DO could result in increase in crop water consumption to
make up for oxygen deficiency and it could terminate crop growth. The DO critical value
is at least 5mg/l.
The alkaline ratio is used as an indication for the irrigation water quality. The
ratio uses the PH level as an indicator of acidity. The ideal range of PH level is between 6
and 7, at 7 water is considered neutral, below 7 water is considered acidic and above 7
water is alkaline. Too high or too low PH can have toxic effect on crops, increase soil
salinity and negatively affects the efficacy of fertilizers and pesticides applied to crops.
IT important to note that alkaline water with high PH is different from water alkalinity.
Alkalinity is the effect of bicarbonate and carbonate on water and will cause water PH to

20
increase. High PH level is an indication for the need of further analysis of water and is
not sufficient to conclude alkalinity of water.
The salinity ratio will be calculated using the electrical conductivity (EC). The
ratio should be maintained at low values, the accepted range of the EC is up to 0.85
mS/cm. The computation of the salinity ratio is very critical due to the high return flows
reuse in Egypt especially, at the tail end of each branch canal and the branch canals
located at the tail end of the main canals. High salinity can negatively affect crop growth
and yield and is a main reason for land and water degradation. Therefore, it can impose
threats on land and water sustainability.
Testing the third hypothesis, the study will evaluate the impact of water scarcity
on management of land and water resources by measuring water stress in wheat
production. In addition, will undertake head, middle and tail comparative analysis for the
economic productivity, sustainability and management indicators used in testing the
previous hypotheses.
The relative evapotranspiration ratio is used to measure water stress for crops by
computing the ratio between actual crop water demand and potential crop water demand.
The evapotranspiration (ET) is used in measuring crop water demand. The ratio falling
below 0.6 is an indication of water stress, between 0.6 and 0.9 is an indication of no
water stress, and equal to 1 is the ideal result for meeting crop water requirement.
Finally, by testing the last hypothesis, this study will evaluate the impact of the
irrigation improvement projects on water scarcity and sustainable development. This
study will test the indicators for economic productivity, sustainability and management of
land and water resources of the improved canals against the unimproved canals. This
study will also test equity in all indicators among the different locations of the improved
canals, as part of evaluating the impact of the irrigation improvement projects on water
management. The following table summarizes the indicators, ratios and variables:

21
Table 1: Summary of the indicators, ratios and variables used
The data used to test the hypotheses was obtained from the Water Management
Research Institute (WMRI) for a sample of branch canals located on two large and two
small main canals in the Nile Delta Region. The two main branch canals are Mit Yazid
and El Mahmoudia; and the two small main branch canals are Bany Helal and Bahr
Semalla. The Mit Yazeed canal is 63 km long with a gross area of 246,382 feddan and
receives water from Bahr Shebin canal. The Mahmoudia canal total length is 77.17 km
with a gross area of 310,000 feddan and receives water from El Atf pump station, El
Khandk el Shrike canal, and Edco drain. Mit Yazeed and Mahmoudia main canals cover
around 10% of the irrigated land area in the Nile Delta. Because they are highly affected
by water scarcity problems and salinity, it is where the government had implemented the
Indicator Ratio Variables
Economic
productivity of land
and water resources
Consumed water productivity:
Harvested crop yield / ETact
Harvested crop yield (kg/ha)
Actual evapotranspiration (mm)
Percentage change in crop yield:
(Yieldnew-Yieldold)/ Yieldold
Recent and historic crop yield
(kg/ha)
Percentage change in water
consumption: (ETactnew-
ETactold)/ ETactold
Recent and historic actual
evapotranspiration (mm)
Sustainability of land
and water resources
Dissolved oxygen ratio: Actual
DO concentration / critical DO
concentration
Actual and critical DO (mg/L)
Alkaline ratio: Actual PH
concentration / critical PH
concentration
Actual and critical PH
Salinity ratio: Actual EC
concentration / critical EC
concentration
Actual and critical Electrical
Conductivity (mS/cm)
Management of land
and water resources
Relative Evapotranspiration:
ETact/ETpot
Actual evapotranspiration (mm)
Potential evapotranspiration (mm)
Head, middle, and tail
comparative analysis for all
indicators
Using all previous ratios and
variables
Irrigation
improvement projects
impact on
Productivity,
sustainability and
Management for land
and water resources
Improved and unimproved
comparative analysis for all
indicators
Using all previous ratios and
variables
Head, middle and tail
comparative analysis for all the
indicators of the improved
canals
Using all previous ratios and
variables

22
irrigation improvement projects. The projects implementation within those two canals
will serve as a model for the future implementation in other areas.
The gross area of Bahr Semalla and Bany Helal are 6,924 and 9,267 feddan,
respectively. Bahr Semalla and Bany Helal have not been part of any improvement
projects. All four locations have similar soil types, climatic conditions and cropping
systems. The main cropping seasons are winter from November to April and summer
from May to October. The main winter crops are wheat, fodder and sugar beets while, the
main summer crops are rice, corn and cotton. The following is a map for the study area:
Figure 2: Map Adopted from Remote Sensing Study for the Impact of the Integrated Irrigation
Improvement and Management Project, by H. Peigrun, R. Kassies and M. Voogt, 2014, Egypt:
Unpublished Report by eLEAF under assignment of IIMP, MWRI, Egypt. Copyright 2014 eLeaf and
GeoMAP. Obtained from: Water Management Research Institute, 2016
The data for the indicators measuring economic productivity and water stress
were obtained for a sample of 96 branch canals. Of which 94 are located on the Mit
Yazeed and Mahmoudia main canals and the remaining two are the Bahr Semalla and
Bany Helal canals. The sample included 96 observations for wheat water productivity,
yields, actual water consumption and potential water consumption during the winter
seasons of 2008/2009 and 2013/2014. The gross area of the sample is 464,659 feddan
representing, 81.15% of the total gross area of the main canals.
Mit Yazeed
Bahr Semalla
El Mahmoudia
Bany Helal

23
The data for the indicators used to evaluate sustainability of land and water
resources was obtained for a sample of four branch canals. Three branch canals are
located on Mit Yazeed main canal and the last is Bahr Semalla canal. The three branch
canals are Khadeega, Dakkalt and El Mashraqa. The sample presents time serious data
for each indicator at the head, middle and tail of each canal. The data is computed semi-
monthly from 2008 to 2010 and from 2014 to 2016, except for El Mashraqa the data
covers from 2014 to 2016. From the end of year 2010 until 2014, the data was not
computed by WMRI due to the political instability that took place after the 2011
revolution. The sample presented 72 observations for each indicator at each position for
Khadeega branch canal, 91 observations at Dakkalt, 33 observations at El Mashraqa and
85 observations at Bahr Semalla.
Based on the same data the study generated the samples needed to undertake the
comparative analysis to evaluate inequity of water distribution and the impact of the
irrigation improvement projects. The study categorized all branch canals according to
their location and improvement status and applied the tests on the categorized data for
each indicator. From the sample of 96 branch canals, 33 branch canals are located on the
head, another 33 canals on the middle and 30 on the tail of the main canals. During the
winter season of 2008/2009, 38 branch canals were improved and 58 were unimproved.
In the winter season of 2013/2014, only 30 branch canals were unimproved and 66 canals
were improved. For the sample of time series data, Khadeega represents the head,
Dakkalt represents the middle and El Mashraqa represents the tail, all are located on Mit
Yazeed; and bahr Semalla is the only unimproved canal.
In addition to the descriptive analysis of the averages, maximum and minimum
values of the indicators, the research undertook empirical testing and analysis. The
research used the Shapiro-Wilk test to test for the normality of the data. Accordingly,
parametric and non-parametric tests were used. With normality, the one sample student t
test was used to estimate the population parameters. Also under normality, the two
samples student t difference in means test was used when testing the head, middle and tail
indicators against each other, when testing the improved and the unimproved indicators

24
against each other and when testing the indicators of the winter season of 2008/2009
against 2013/2014. Under non-normality, the one sample student t was replaced by the
Wilcoxon Signed Rank test and the two samples student t test was replaced by the Mann-
Whitney U test. All tests were computed at 5% significance level.
The following table summarizes the how the appropriate testing tool was applied
to test the research hypotheses.
S1
- Th
e
imp
lemen
tatio
n
of th
e
irriga
tion
imp
rov
emen
t
pro
jects
P3
- Incre
asin
g
wa
ter
ma
na
gem
ent
pro
blem
s
P2
- Incre
asin
g
dep
end
en
cy o
n
dra
ina
ge re
use
P1
- Lim
iting
gro
wth
an
d
dev
elop
men
t of
ag
ricultu
ral
pro
du
ction
Pro
blem
s/
So
lutio
ns
4- T
he irrig
atio
n
imp
rov
emen
t
pro
jects
imp
rov
ed
pro
du
ctivity
,
susta
ina
bility
an
d
ma
na
gem
ent o
f
lan
d a
nd
wa
ter
reso
urce
s
3- In
efficiency
of
wa
ter
ma
na
gem
ent is
crea
ting
wa
ter
sho
rtag
es an
d
ineq
uity
of w
ater
distrib
utio
n
2- D
eterio
ratio
n
of w
ater
qu
ality
is
threa
tenin
g th
e
susta
ina
bility
of
lan
d a
nd
wa
ter
reso
urce
s
1- W
ater
scarc
ity
is limitin
g th
e
gro
wth
of la
nd
an
d w
ater
pro
du
ctivity
Hy
po
theses
Ev
alu
ate th
e
imp
act o
f the
irrig
atio
n
imp
rov
emen
t
pro
jects o
n
wa
ter sca
rcity
Ev
alu
ate th
e
imp
act o
f wa
ter
scarc
ity o
n
wa
ter
ma
na
gem
ent
pro
blem
s
Ev
alu
ate th
e
imp
act o
f wa
ter
scarc
ity o
n th
e
susta
ina
bility
of
lan
d a
nd
wa
ter
reso
urce
s
Ev
alu
ate th
e
imp
act o
f wa
ter
scarc
ity o
n th
e
eco
no
mic
pro
du
ctivity
of
lan
d a
nd
wa
ter
reso
urce
s
Meth
od
s to
Test th
e
Hy
po
theses
Imp
rov
ed
can
als H
ead
,
Mid
dle a
nd
Ta
il
com
pa
rativ
e
an
aly
sis
Imp
rov
ed/
un
imp
rov
ed
com
pa
rativ
e
an
aly
sis
Hea
d/M
idd
le/
Ta
il
Co
mp
ara
tive
An
aly
sis
Wa
ter S
tress
Sa
linity
Ra
tio
Alk
alin
e Ra
tio
Disso
lved
Ox
yg
en R
atio
Wh
eat Y
ields
an
d W
ater
Co
nsu
mp
tion
Wh
eat W
ater
Pro
du
ctivity
Ind
icato
rs
Used
Test fo
r equ
ity a
t all lo
catio
ns fo
r the a
ll
ind
icato
rs of th
e imp
rov
ed ca
na
ls
Test th
at a
ll ind
icato
rs at th
e imp
rov
ed ca
na
ls
wer
e hig
her th
an
the u
nim
pro
ved
Test fo
r equ
ity a
mo
ng
the lo
catio
ns fo
r all
ind
icato
rs
Test th
at th
e rela
tive ev
ap
otra
nsp
iratio
n ra
tio
wa
s at lea
st 0.6
du
ring
the tw
o w
inte
r seaso
ns
Test th
at th
e ratio
wa
s at m
ost 1
Test th
at th
e ratio
wa
s equ
al 1
Test th
at th
e ratio
wa
s at lea
st 1
Test th
at w
ater
con
sum
ptio
n sig
nifica
ntly
decr
eased
betw
een
the tw
o w
inte
r seaso
ns
Test th
at y
ields sig
nifica
ntly
increa
sed b
etwee
n
the tw
o w
inte
r seaso
ns
Test th
at th
e ratio
sign
ifican
tly in
creased
betw
een
the tw
o w
inte
r seaso
ns
Test th
at th
e ratio
wa
s at lea
st equ
al th
e av
era
ge
glo
ba
l pro
du
ctivity
ratio
du
ring
the w
inte
r
seaso
n o
f 20
08
/200
9 a
nd
2013
/20
14
Meth
od
of E
va
lua
tion
Table 2: Summary of the methods applied to test the research hypotheses

25
V- Results and Analysis
This section presents the descriptive analysis, tests findings and analysis.
1- Economic Productivity of Land and Water Resources
1.1- Water productivity. During the winter seasons of 2008/2009 and 2013/2014,
the averages of the water productivity ratio were 1.09 kg/m3 and 1.25 kg/m
3 with
standard deviation of 0.04 kg/m3 and 0.02 kg/m
3. The maximum values were 1.21 kg/m
3
and 1.34 kg/m3, while the minimum values were 1.02 kg/m
3 and 1.21 kg/m
3 for
2008/2009 and 2013/2014 winter season, respectively. The average of water productivity
ratio for 2008/2009 season is slightly higher than that obtained by El- Agha et al. (2011)
for the same year. The study by El-Agha et al. (2011) reported averages of 0.94, 0.92 and
0.91 kg/m3 for three different canals. Based on Wilcoxon Signed Rank test results for
both years we accept the hypothesis that the ratio is at least equal to 1.09 kg/m3, which is
the global average of wheat water productivity as reported by Bastiaanssen and Zwart
(2004). In addition, the average change in water productivity was 14.5% with a standard
deviation of 2.76%. The maximum value for the change was an increase of 22.55% and
the minimum value was an increase of 7.5%. The Mann-Whitney U test showed that we
accept the hypothesis that the ratio in the 2013/2014 winter season was greater or equal
than in 2008/2009 winter season.
1.2- Yields and water consumption. During the winter seasons of 2008/2009
and 2013/2014, the average yields were 6718.4 kg/ha and 7236.7 kg/ha with standard
deviations of 301.45 kg/ha and 286.23 kg/ha. The maximum values were 7426 kg/ha and
7704 kg/ha, the minimum values were 5695 kg/ha and 6292 kg/ha for 2008/2009 and
2013/2014 winter season, respectively. With the exception of six branch canals, yields
increased between the two seasons. The average percentage change in yields was 7.84%
with a standard deviation of 4.75%. The maximum value of the change in yields was an
increase of 17.65% and the minimum value was a decrease of 5.39%. Furthermore, with
the exception of different six branch canals, actual water consumption has decreased
between both seasons. The indicators decreased by average of 5.8% and standard
deviation 3.9. The maximum value of the change in actual water consumption was an

26
increase of 2.04% and the minimum value was a decrease of 15.96%. The Mann-Whitney
U test showed that we accept the hypothesis that the yields in the 2013/2014 winter
season was greater or equal than in 2008/2009 winter season and that water consumption
was less or equal. The following tables summarize the results of the descriptive statistics
and the tests applied to evaluate economic productivity.
Indicator/Parameter
Water
Productivity kg/m3 Yields kg/ha
Water
consumption
mm
2008/
2009
2013/
2014
%
change
2008/
2009
2013/
2014
%
change
% change
Average 1.09 1.25 14.50 6718.40 7236.70 7.84 -5.80
Max 1.21 1.34 22.55 7426.00 7704.00 17.65 2.04
Min 1.02 1.21 7.50 5695.00 6292.00 -5.39 -15.96
Table 3: Summary of the descriptive statistics of the economic productivity of land and water
resources
Tested Hypotheses Sample –
Observations Test Result
Water productivity ratio is at
least equal the average global
average water productivity
1.09
2008/2009 winter
season – 96
Wilcoxon
Signed
Rank
Accept
2013/2014 winter
season – 96
Wilcoxon
Signed
Rank
Accept
Water productivity ratio
significantly increased
between the two winter
seasons
2008/2009 &
2013/2014 winter
seasons - 96 & 96
Mann-
Whitney U Accept
Yields significantly increased
between the two winter
seasons
2008/2009 &
2013/2014 winter
seasons - 96 & 96
Mann-
Whitney U Accept
Water consumption
significantly decreased
between the two winter
seasons
2008/2009 &
2013/2014 winter
seasons - 96 & 96
Mann-
Whitney U Accept
Table 4: Summary for the tests results for the economic productivity indicators
Based on the results after testing land and water productivity, it is obvious that the
productivity is above average and is not highly affected by problems of water scarcity

27
during the winter season. On the other hand, the highest increase in land productivity is
not very high, considering there are four years between the two winter seasons studied in
this research. Furthermore, the tests were conducted on wheat production during the
winter season and is not an indication of the over all status of land and water productivity.
2- Sustainability of Land and Water Resources
2.1- Dissolved oxygen ratio. The Dissolved oxygen ratio would be meeting the
sustainability measurements if its value was at least equal to 1.
Khadeega Canal. The averages of the DO ratio at the head, middle and tail of the
canal were 0.97, 0.85 and 0.83 mg/L, with standard deviations 0.59, 0.51 and 0.6 mg/L.
The maximum values were 2.64, 2.37 and 3.08 mg/L, while the minimum values were
0.07, 0.06 and 0.08 mg/L at the head, middle and tail of the canal. Using the Wilcoxon
Signed Rank test to test the sustainability hypothesis with confidence of 95%, the results
showed that we accept the hypothesis only at the head of the canal but must reject the
hypothesis at the middle and tail of the canal.
Dakkalt. The averages of the DO ratio at the head, middle and tail of the canal
were 0.96, 0.86 and 0.77 mg/L with standard deviations 0.51, 0.54 and 0.48 mg/L. The
maximum values were 2.91, 3.37 and 2.05 mg/L, while the minimum values were 0.09,
0.08 and 0.05 mg/L at the head, middle and tail of the canal. The Wilcoxon Signed Rank
test results were similar to Khadeega, which showed that we accept the hypothesis only at
the head of the canal but reject the hypothesis at the middle and tail of the canal.
El Mashraqa. The averages of the DO ratio at the head, middle and tail of the
canal were 0.54, 0.38 and 0.26 mg/L with standard deviations 0.22, 0.25 and 0.21 mg/L.
The maximum values were 0.90 mg/L at the head and middle of the canal and 0.76 mg/L
at the tail, while the minimum values were 0.05, 0.07 and 0.04 mg/L at the head, middle
and tail of the canal. The data is normally distributed only for the sample at the head of
the canal, the Student t test results showed that we reject the hypothesis at the head and

28
the Wilcoxon Signed Rank test results showed that we reject the hypothesis at the middle
and tail of the canal.
Bahr Semalla. The averages of the DO ratio at the head, middle and tail of the
canal were 1.02, 0.94 and 0.91 mg/L with standard deviations 0.61, 0.58 and 0.58 mg/L.
The maximum values were 3.19, 2.57 and 2.47 mg/L, while the minimum values were
0.14, 0.06 and 0.04 mg/L at the head, middle and tail of the canal. The Wilcoxon Signed
Rank test results showed that we accept the hypothesis at the head and middle of the
canal but reject the hypothesis at the tail of the canal.
The following tables summarize the results of the descriptive statistics and the tests
applied for the dissolved oxygen ratio.
Bra
nch
cana
l/
Para
mete
r
Khadeega Dakkalt El Mashraqa Bahr Semalla
Head Mid
dle Tail Head
Mid
dle Tail Head
Mid
dle Tail Head
Mid
dle Tail
Aver
age 0.97 0.85 0.83 0.96 0.86 0.77 0.54 0.38 0.26 1.02 0.94 0.91
Max 2.64 2.37 3.08 2.91 3.37 2.05 0.90 0.90 0.76 3.19 2.57 2.47
Min 0.07 0.06 0.08 0.09 0.08 0.05 0.05 0.07 0.04 0.14 0.06 0.04
Table 5: Summary for the descriptive statistics of the dissolved oxygen ratio
Tested
Hypoth
-esis
Sample - Observations Test Result
Th
e d
isso
lved
ox
yg
en r
ati
o i
s a
t le
ast
eq
ua
l 1
At the head of Khadeega branch canal time
series data from May 2008 to November 2015 -
72 observations
Wilcoxon
Signed
Rank
Accept
At the Middle of Khadeega branch canal time
series data from May 2008 to November 2015 -
72 observations
Wilcoxon
Signed
Rank
Reject
At the Tail of Khadeega branch canal time
series data from May 2008 to November 2015 -
72 observations
Wilcoxon
Signed
Rank
Reject
At the head of Dakkalt branch canal time series
data from May 2008 to February 2016 - 91
observations
Wilcoxon
Signed
Rank
Accept
At the Middle of Dakkalt branch canal time
series data from May 2008 to February 2016 -
91 observations
Wilcoxon
Signed
Rank
Reject
At the Tail of Dakkalt branch canal time series
data from May 2008 to February 2016 - 91
observations
Wilcoxon
Signed
Rank
Reject

29
At the head of El Mashraqa branch canal time
series data from August 2014 to November
2015 - 33 observations
Student t Reject
At the Middle of El Mashraqa branch canal
time series data from August 2014 to November
2015 - 33 observations
Wilcoxon
Signed
Rank
Reject
At the Tail of El Mashraqa branch canal time
series data from August 2014 to November
2015 - 33 observations
Wilcoxon
Signed
Rank
Reject
At the head of Bahr Semalla canal time series
data from August 2014 to November 2015 - 85
observations
Wilcoxon
Signed
Rank
Accept
At the Middle of Bahr Semalla canal time series
data from August 2014 to November 2015 - 85
observations
Wilcoxon
Signed
Rank
Reject
At the Tail of Bahr Semalla canal time series
data from August 2014 to November 2015 - 85
observations
Wilcoxon
Signed
Rank
Reject
Table 6: Summary for the tests results for the dissolved oxygen ratio
The tests results at the three locations of the four branch canals show that the
dissolved oxygen ratio in general does not meet the sustainability measurements.
Especially, at the middle and tail of the canals the ratio was below 1 except at Bahr
Semalla canal the ratio was not below 1 only at the middle. The dissolved oxygen level is
highly affected by the flow and level of water. The low levels of the dissolved oxygen
could be due to low water flows especially, that the ratio was below 1 at the tail of all
canals.
2.2- Alkaline ratio. The alkaline ratio would be meeting the sustainability
measurements if its value were equal to 1. If water was suffering from alkalinity, the PH
level would be increasing and more investigation would be mandatory.
Khadeega. The averages of the alkaline ratio at the head, middle and tail of the
canal were 1.16, 1.13 and 1.12 with standard deviations 0.11, 0.08 and 0.07. The
maximum values were 1.46, 1.44 and 1.32, while the minimum values were 0.74, 1.04
and 0.97 at the head, middle and tail of the canal. Using the Wilcoxon Signed Rank test
to test the sustainability hypothesis with confidence of 95%, the results showed that we
reject the hypothesis at the head, middle and tail of the canal. The following figure
illustrates the trend of the ratio at each position of the canal.

30
Figure 3: The PH Trend at the Head, Middle and Tail of Khadeega Branch Canal
Dakkalt. The averages of the alkaline ratio at the head, middle and tail of the
canal were 1.17, 1.14 and 1.11 with standard deviations 0.08, 0.08 and 0.07. The
maximum values were 1.37 at the head and middle of the canal and 1.39 at the tail. The
minimum values were 1.06, 0.87 and 0.98 at the head, middle and tail of the canal. The
Wilcoxon Signed Rank test results showed that we reject the sustainability hypothesis at
the head, middle and tail of the canal. The following figure illustrates the trend of the
ratio at each position of the canal.
Figure 4: The PH Trend at the Head, Middle and Tail of Dakkalt Branch Canal
Khadeega
0.00
0.20
0.40
0.60
0.80
1.00
1.20
1.40
1.60
Time
Time
PH
Head
Middle
Tail
Dakkalt
0.00
0.20
0.40
0.60
0.80
1.00
1.20
1.40
1.60
Time
Time
PH
Head
Middle
Tail

31
El Mashraqa. The averages of the alkaline ratio at the head, middle and tail of the
canal were 1.11, 1.09 and 1.08 with standard deviations 0.03, 0.04 and 0.03. The
maximum values were 1.22 at the head and middle of the canal and 1.17 at the tail. The
minimum values were 1.06, 1.01 and 0.99 for the head, middle and tail of the canal. As
the data is normally distributed only for the sample at the head of the canal, the Student t
test results showed that we reject the hypothesis at the head and the Wilcoxon Signed
Rank test results showed that we reject the hypothesis at the middle and tail of the canal.
The following figure illustrates the trend of the ratio at each position of the canal.
Figure 5: The PH Trend at the Head, Middle and Tail of El Mashraqa Branch Canal
Bahr Semalla. The averages of the alkaline ratio at the head, middle and tail of
the canal were 1.16, 1.13 and 1.12 with standard deviations 0.09, 0.07 and 0.08. The
maximum values were 1.35, 1.37 and 1.41 while the minimum values were 0.94, 1 and
0.94 for the head, middle and tail of the canal. The Wilcoxon Signed Rank test results
also showed that we reject the sustainability hypothesis at all positions of the canal. The
following figure illustrates the trend of the ratio at each position of the canal.
El Mashraqa
0.00
0.20
0.40
0.60
0.80
1.00
1.20
1.40
Time
Time
PH
Head
Middle
Tail

32
Figure 6: The PH Trend at the Head, Middle and Tail of Bahr Semalla Branch Canal
The following tables summarize the results of the descriptive statistics and the
tests applied for the alkaline ratio.
Bra
nch
cana
l/
Para
mete
r
Khadeega Dakkalt El Mashraqa Bahr Semalla
Head Mid
dle Tail Head
Mid
dle Tail Head
Mid
dle Tail Head
Mid
dle Tail
Aver
age 1.16 1.13 1.12 1.17 1.14 1.11 1.11 1.09 1.08 1.16 1.13 1.12
Max 1.46 1.44 1.32 1.37 1.37 1.39 1.22 1.22 1.17 1.35 1.37 1.41
Min 0.74 1.04 0.97 1.06 0.87 0.98 1.06 1.01 0.99 0.94 1.00 0.94
Table 7: summary for the descriptive statistics of the alkaline ratio
Bahr Semalla
0.00
0.20
0.40
0.60
0.80
1.00
1.20
1.40
1.60
Time
Time
PH
Head
Middle
Tail

33
Tested
Hypothesis Sample – Observations Test Result
Th
e a
lka
lin
e ra
tio
is
equ
al
1
At the head of Khadeega branch canal
time series data from May 2008 to
November 2015 - 72 observations
Wilcoxon
Signed
Rank
Reject
At the Middle of Khadeega branch canal
time series data from May 2008 to
November 2015 - 72 observations
Wilcoxon
Signed
Rank
Reject
At the Tail of Khadeega branch canal time
series data from May 2008 to November
2015 - 72 observations
Wilcoxon
Signed
Rank
Reject
At the head of Dakkalt branch canal time
series data from May 2008 to February
2016 - 91 observations
Wilcoxon
Signed
Rank
Reject
At the Middle of Dakkalt branch canal
time series data from May 2008 to
February 2016 - 91 observations
Wilcoxon
Signed
Rank
Reject
At the Tail of Dakkalt branch canal time
series data from May 2008 to February
2016 - 91 observations
Wilcoxon
Signed
Rank
Reject
At the head of El Mashraqa branch canal
time series data from August 2014 to
November 2015 - 33 observations
Student t Reject
At the Middle of El Mashraqa branch
canal time series data from August 2014 to
November 2015 - 33 observations
Wilcoxon
Signed
Rank
Reject
At the Tail of El Mashraqa branch canal
time series data from August 2014 to
November 2015 - 33 observations
Wilcoxon
Signed
Rank
Reject
At the head of Bahr Semalla canal time
series data from August 2014 to November
2015 - 85 observations
Wilcoxon
Signed
Rank
Reject
At the Middle of Bahr Semalla canal time
series data from August 2014 to November
2015 - 85 observations
Wilcoxon
Signed
Rank
Reject
At the Tail of Bahr Semalla canal time
series data from August 2014 to November
2015 - 85 observations
Wilcoxon
Signed
Rank
Reject
Table 8: Summary for the tests results for the alkaline ratio
The test results showed that the PH level does not meet the sustainability
measurements at any position of any branch canal. As the ratio was not following an
increasing trend, we cannot conclude that the water is suffering from alkalinity. The high
value and fluctuation could be the result of using low quality water or the treatment of
water from pollutants, acidity or alkalinity.

34
2.3- Salinity ratio. The salinity ratio would be meeting the sustainability
measurements if its value were at most equal to 1.
Khadeega. The averages of the salinity ratio at the head, middle and tail of the
canal were 0.55, 0.61 and 0.63 mS/cm with standard deviations 0.10, 0.15 and 0.16
mS/cm. The maximum values were 0.83, 1.46 and 1.53 mS/cm, while the minimum
values were 0.36, 0.39 and 0.44 mS/cm for the head, middle and tail of the canal. As the
data is normally distributed only for the sample at the head of the canal, the Student t test
results showed that we accept the sustainability hypothesis at the head and the Wilcoxon
Signed Rank test results also showed that we accept the hypothesis at the middle and tail
of the canal.
Dakkalt. The averages of the salinity ratio at the head, middle and tail of the canal
were 0.55, 0.61 and 0.73 mS/cm with standard deviations 0.09, 0.12 and 0.17 mS/cm.
The maximum values were 0.86, 0.98 and 1.44 mS/cm, while the minimum values were
0.40, 0.39 and 0.47 mS/cm for the head, middle and tail of the canal. The Wilcoxon
Signed Rank test results showed that we accept the sustainability hypothesis at the head,
middle and tail of the canal.
El Mashraqa. The averages of the salinity ratio at the head, middle and tail of the
canal were 0.64, 1.34 and 1.47 mS/cm with standard deviations 0.21, 0.88 and 0.42
mS/cm. The maximum values were 1.47, 3.46 and 2.29 mS/cm, while the minimum
values were 0.37, 0.46 and 0.65 mS/cm for the head, middle and tail of the canal. The
Wilcoxon Signed Rank test results showed that we accept the sustainability hypothesis at
the head and middle but reject the hypothesis at the tail of the canal.
Bahr Semalla. The averages of the salinity ratio at the head, middle and tail of the
canal were 0.47, 0.57 and 0.55 mS/cm with standard deviations 0.09, 0.49 and 0.16
mS/cm. The maximum values were 0.99, 4.82 and 1.24 mS/cm, while the minimum
values were 0.33, 0.28 and 0.39 mS/cm at the head, middle and tail of the canal. The
Wilcoxon Signed Rank test results showed that we accept the sustainability hypothesis at

35
the head, middle and tail of the canal. The following tables summarize the results of the
descriptive statistics and the tests applied for the salinity ratio.
Bra
nch
can
al/
Par
ame
ter
Khadeega Dakkalt El Mashraqa Bahr Semalla
Head Mid
dle Tail Head
Mid
dle Tail Head
Mid
dle Tail Head
Mid
dle Tail
Ave
rage 0.55 0.61 0.73 0.55 0.61 0.73 0.64 1.34 1.47 0.47 0.57 0.55
Max 0.83 1.46 1.53 0.86 0.98 1.44 1.47 3.46 2.29 0.99 4.82 1.24
Min 0.36 0.39 0.44 0.40 0.39 0.47 0.37 0.46 0.65 0.33 0.28 0.39
Table 9: Summary for the descriptive statistics of the salinity ratio
Tested
Hypoth
esis
Sample - Observations Test Result
Th
e a
lka
lin
e ra
tio
is
equ
al
1
At the head of Khadeega branch canal time series
data from May 2008 to November 2015 - 72
observations
Student t Accept
At the Middle of Khadeega branch canal time series
data from May 2008 to November 2015 - 72
observations
Wilcoxon
Signed Rank Accept
At the Tail of Khadeega branch canal time series data
from May 2008 to November 2015 - 72 observations
Wilcoxon
Signed Rank Accept
At the head of Dakkalt branch canal time series data
from May 2008 to February 2016 - 91 observations
Wilcoxon
Signed Rank Accept
At the Middle of Dakkalt branch canal time series
data from May 2008 to February 2016 - 91
observations
Wilcoxon
Signed Rank Accept
At the Tail of Dakkalt branch canal time series data
from May 2008 to February 2016 - 91 observations
Wilcoxon
Signed Rank Accept
At the head of El Mashraqa branch canal time series
data from August 2014 to November 2015 - 33
observations
Wilcoxon
Signed Rank Accept
At the Middle of El Mashraqa branch canal time
series data from August 2014 to November 2015 - 33
observations
Wilcoxon
Signed Rank Accept
At the Tail of El Mashraqa branch canal time series
data from August 2014 to November 2015 - 33
observations
Wilcoxon
Signed Rank Reject
At the head of Bahr Semalla canal time series data
from August 2014 to November 2015 - 85 observations
Wilcoxon
Signed Rank Accept
At the Middle of Bahr Semalla canal time series data
from August 2014 to November 2015 - 85 observations
Wilcoxon
Signed Rank Accept
At the Tail of Bahr Semalla canal time series data
from August 2014 to November 2015 - 85 observations
Wilcoxon
Signed Rank Accept
Table 10: Summary for the test results for the salinity ratio

36
The tests show that the salinity ratio is meeting the sustainability measurements
within all the branch canals except at the tail of El Mashraqa. As El Mashraqa lies at the
tail end of Mit Yazit, drainage water reuse is most probably the reason for the high
salinity ratio.
3- Water Use and Management Efficiency
3.1- Water stress (relative evapotranspiration ratio). During the winter seasons
of 2008/2009 and 2013/2014, the averages of the relative evapotranspiration ratio was
0.97 mm for both years with standard deviations of 0.01mm and 0.02mm. The maximum
value was 0.99 mm in both seasons; the minimum values were 0.94 mm and 0.91 mm for
2008/2009 and 2013/2014 winter season, respectively. Based on Wilcoxon Signed Rank
test results for both years we accept the hypothesis that the ratio is at least equal to
0.6mm. The ratio has decreased in forty branch canal between the two seasons. The
average percentage change was 0.44% with a standard deviation of 2.18%. The
maximum value of the change was an increase of 5.65% and the minimum value was a
decrease of 3.61%. The Mann-Whitney U test showed that we accept the hypothesis that
the ratio in the 2013/2014 winter season was at least equal the ratio in 2008/2009 winter
season.
The relative evapotranspiration ratio was in general very high and thus no water
stress can be concluded during both years analyzed. The ratio shows that during the
winter season farmers do not face difficulties in meeting the water demand of crops and
therefore, shows efficiency of water use and management. The following table
summarizes the descriptive statistics for the ratio.
Indicator/
Parameter
Relative Evapotranspiration Ratio
mm
2008/ 2009 2013/ 2014 %
change
Average 0.97 0.97 0.44
Max 0.99 0.99 5.65
Min 0.94 0.91 -3.61
Table 11: Summary for the descriptive statistics for the indicator of water stress

37
3.2- Location comparative analysis.
3.2.1- Economic productivity of land and water resources.
Water productivity. During the winter season of 2008/2009, the averages of the
water productivity ratio for the head, middle and tail were 1.11, 1.09 and 1.08 kg/m3 with
standard deviations of 0.05, 0.03 and 0.02 kg/m3. The maximum values of the ratios were
1.21 kg/m3 at the head 1.13 kg/m
3 at the middle and tail. The minimum values were 1.04
kg/m3 for the head and 1.02 kg/m
3 at both the middle and tail. The Mann-Whitney U test
showed that we accept the hypothesis of no significant difference between the head and
middle canals. On the other hand, the Student t test results showed that there was a
significant difference between the middle and tail canal and the Mann-Whitney U results
for the head and tail showed the same results. The results showed that the ratio for the
head and middle canals were significantly higher than at the tail canals.
During the winter season of 2013/2014, the averages of the water productivity
ratio for the head, middle and tail were 1.26, 1.25 and 1.24 kg/m3 with standard
deviations of 0.03, 0.03 and 0.02 kg/m3. The maximum values of the ratios were 1.33,
1.34 and 1.26 kg/m3 for the head, middle and tail respectively. The minimum value was
1.21 kg/m3 for all positions. The Mann-Whitney U test showed that we accept the
hypothesis of no significant difference between the head and middle canals and between
the middle and tail canals. On the other hand, the Mann-Whitney U results for the head
and tail showed that we reject the hypothesis. The results showed that the ratio at the
head canals was significantly higher than at the tail canals. Furthermore, the Student t test
results showed that there was no significant difference in the percentage change in water
productivity ratio between the head and middle canals as well as, the middle and tail
canals. The results showed that there was a significant difference between the head and
tail canals but they showed that the increase in water productivity was significantly lower
at the head canals.
Yields. During the winter season of 2008/2009, the average yields for the head,
middle and tail were 6788.03, 6733.45 and 6625.23 kg/ha with standard deviations of
275.16, 241.38 and 367.55 kg/ha. The maximum values of the yields were 7426, 7075

38
and 7210 kg/ha; the minimum values were 6317, 5903 and 5695 kg/ha for the head,
middle and tail respectively. The Mann-Whitney U tests and student t test showed that we
accept the hypothesis of no significant difference between any of the positions.
During the winter season of 2013/2014, the average yields for the head, middle
and tail were 7310.09, 7227.7 and 7165.93 kg/ha with standard deviations of 282.36,
236.24 and 327.75 kg/ha. The maximum values of the yields were 7703, 7603 and 7704
kg/ha; the minimum values were 6586, 6697 and 6292 kg/ha for the head, middle and tail
respectively. The Mann-Whitney U tests and student t test showed that we accept the
hypothesis of no significant difference between any of the positions. In addition, the
average percentage change in yields for the head, middle and tail were 7.83%, 7.44% and
8.31% with standard deviations of 5.40%, 4.37% and 4.49%. The maximum values of the
percentage change in yields were increase of 17.65%, 16.77% and 16.89%; the minimum
values were decrease of 5.39%, 1.67% and 1.79% for the head, middle and tail
respectively. The student t test results also showed we accept the hypothesis of no
significant difference among all positions.
The comparative analysis of the economic productivity indicators suggest that
during the winter season the problems attributed to inefficiency of water use and
management are less severe. In general, there was no significant difference among the
different locations for yields but the same does not apply for water productivity, which
shows that farmers can manage to maintain land productivity while faced with the
system’s inefficiencies.
3.2.2- Sustainability of land and water resources. As the sustainability
indicators were obtained at the different locations of each canal, the study undertook the
comparative analysis within each canal and among the different canals for each position.
In addition, when comparing among the different canals and El Mashraqa canal, the study
considered the data from 2014 for all canals because as it was mentioned earlier, the data
for El Mashraqa canal was only available from the year 2014. The descriptive analysis is

39
not included in this part because it was analyzed based on location in the sustainability
part.
Dissolved oxygen ratio.
Within each canal:
Comparing the head and middle, middle and tail, and head and tail of Khadeega canal,
the results of Mann-Whitney U test showed that we accept the hypothesis that the ratio
was equal at all positions. For Dakkalt, the results showed that we accept the hypothesis
only when testing the head with the middle and the middle with head but reject for the
head and tail. The results obtained for the head and tail of the canal showed that the ratio
was significantly higher at the head. As for El Mashraqa canal, the results showed that we
reject the hypothesis of equity at all positions. The test results showed that the ratio was
highest at the head and followed by the middle of the canal. Finally, the test results for
Bahr Semalla canal showed that we accept the hypothesis of equity at all positions.
Among the different canals:
At the head and middle positions of each canal the Mann-Whitney U test results showed
that we accept the hypothesis of equity between Khadeega with Dakkalt (head and
middle), Dakkalt with El Mashraqa (middle and tail), and Khadeega with El Mashraqa
(head and tail). At the tail of each canal, the results showed that we accept the hypothesis
for Khadeega with Dakkalt and Dakkalt with El Mashraqa but reject the hypothesis when
testing Khadeega with El Mashraqa. The test results showed that the ratio is significantly
higher at the tail of Khadeega canal as compared to the tail of El Mashraqa Canal.
Alkaline ratio.
Within each canal:
The results of Mann-Whitney U test showed that we reject the hypothesis that the ratio
was equal when comparing the head with middle for all canals except at Bahr Semalla
canal. Testing for equity at the middle and tail at each canal showed that we accept the
hypothesis except for Dakkalt canal. Finally, the results showed that we reject the
hypothesis for the head with tail at any canal.

40
Among the different canals:
At the head, middle and tail positions of each canal the test results showed that we accept
the hypothesis of equity between Khadeega and Dakkalt, Dakkalt and El Mashraqa, and
Khadeega and El Mashraqa.
Salinity ratio.
Within each canal:
The results showed that we accept the hypothesis only when comparing the middle with
tail of Khadeega, El Mashraqa and Bahr Semalla. Other than that, the ratio was lower at
the head and middle of each canal as compared to the tail and lower at the head as
compared to the middle.
Among the different canals:
At the head of each canal, the test results showed that we accept the hypothesis of equity
between Khadeega with Dakkalt and Khadeega with El Mashraqa but reject the
hypothesis when testing Dakkalt with El Mashraqa. The results showed that the ratio was
significantly lower at Dakkalt canal. At the middle of each canal, the results showed that
we accept the hypothesis only for Khadeega with Dakkalt but reject the hypothesis when
testing Dakkalt with El Mashraqa and Khadeega with El Mashraqa. The test results
showed that the ratio is significantly lower at the middle of Dakkalt and Khadeega as
compared to the middle of El Mashraqa. Furthermore, at the tail of each canal the results
showed that we reject the hypothesis at any position in which the ratio was significantly
lower at the tail of Khadeega as compared to the tail of Dakkalt and El Mashraqa and
lower at the tail of Dakkalt as compared to the tail of El Mashraqa.
The comparative analysis of the sustainability indicators suggest that there are
inefficiency in water use and management leading to inequity among the different
locations especially at the tail of the canals or the tail branch canals. In general, there was
a significant difference for all indicators among the different locations of each branch
canal. Among the different branch canals and at each location, the opposite was

41
concluded except for the salinity indicator. The salinity was in general more sustainable
at the canal located at the head, followed by the middle and tail. Therefore, the negative
effects of inefficient management of water resources are obvious.
3.2.3- Water use and management efficiency.
Water stress (relative evapotranspiration ratio). During the winter season of
2008/2009, the average of the relative evapotranspiration ratio for the head, middle and
tail was 0.97mm with standard deviations of 0.01mm. The maximum value of the ratios
was 0.99mm at all positions. The minimum values were 0.94 mm for the head and middle
and 0.95mm at the tail. The Student t test showed that we accept the hypothesis of no
significant difference at any of the positions.
During the winter season of 2013/2014, the average of the relative
evapotranspiration ratio for the head, middle and tail was 0.97mm with standard
deviations of 0.02mm. The maximum value of the ratios was 0.99mm at all positions.
The minimum values were 0.94mm for the head and middle and 0.91mm at the tail. The
Mann-Whitney U test showed that we accept the hypothesis of no significant difference
at any of the positions.
In general, there is no significant difference among the different locations. The
ratio in general is very at all locations and even if there were any difference, no water
stress would be concluded. The following tables summarize the descriptive statistics and
test results for all indicators and all locations.
2008/2009 Winter Season
Indic
ator/
Para
meter
Water productivity
kg/m3 Yields kg/ha
Relative
Evapotranspiration
Ratio mm
Head Midd
le
Tail Head Middle Tail Head Midd
le
Tail
Aver
age 1.11 1.09 1.08 6788.03 6733.45 6625.23
0.97 0.97 0.97
Max 1.21 1.13 1.13 7426 7075 7210 0.99 0.99 0.99
Min 1.04 1.02 1.02 6317 5903 5695 0.94 0.94 0.95
Table 12: Summary for the location comparative analysis descriptive statistics for winter 2008/2009

42
2013/2014 Winter Season
Indic
ator/
Para
meter
Water productivity
kg/m3 Yields kg/ha
Relative
Evapotranspiration
Ratio mm
Head Midd
le
Tail Head Middle Tail Head Middle Tail
Aver
age 1.26 1.25 1.24 7310.09 7227 7165.93
0.97 0.97 0.97
Max 1.33 1.34 1.26 7703 7603 7704 0.99 0.99 0.99
Min 1.2 1.21 1.21 6586 6697 6292 0.94 0.94 0.91
Table 13: Summary for the location comparative analysis descriptive statistics for winter 2013/2014
Tested Hypotheses Sample (locations) –
Observations Test Result
Water productivity
ratio is equal at all
locations
2008/2009 winter season (Head
and Middle) - 33 and 33 Mann- Whitney U Accept
2008/2009 winter season
(Middle and Tail) - 33 and 30 Student t Reject
2008/2009 winter season (Head
and Tail) - 33 and 30 Mann- Whitney U Reject
2013/2014 winter season (Head
and Middle) - 33 and 33 Mann- Whitney U Accept
2013/2014 winter season
(Middle and Tail) - 33 and 30 Mann- Whitney U Accept
2013/2014 winter season (Head
and Tail) - 33 and 30 Mann- Whitney U Reject
Yields are equal at
all locations
2008/2009 winter season (Head
and Middle) - 33 and 34 Mann- Whitney U Accept
2008/2009 winter season
(Middle and Tail) - 33 and 31 Mann- Whitney U Accept
2008/2009 winter season (Head
and Tail) - 33 and 31 Student t Accept
2013/2014 winter season (Head
and Middle) - 33 and 35 Student t Accept
2013/2014 winter season
(Middle and Tail) - 33 and 32 Mann- Whitney U Accept
2013/2014 winter season (Head
and Tail) - 33 and 32 Mann- Whitney U Accept
Percentage change
in water
productivity ratio is
equal at all
locations
2013/2014 winter season (Head
and Middle) - 33 and 34 Student t Accept
2013/2014 winter season
(Middle and Tail) - 33 and 31 Student t Accept
2013/2014 winter season (Head
and Tail) - 33 and 31 Student t Reject
Percentage change
in yields are equal
at all locations
2013/2014 winter season (Head
and Middle) - 33 and 36 Student t Accept
2013/2014 winter season
(Middle and Tail) - 33 and 33 Student t Accept
2013/2014 winter season (Head
and Tail) - 33 and 33 Student t Accept
Table 14 Summary for the test results for productivity location comparative analysis

43
Testes
Hypotheses Sample - Observations Locations Test Result
Th
e d
isso
lved
ox
yg
en r
ati
o i
s eq
ua
l Khadeega branch canal
time series data from May
2008 to November 2015 –
72
Head and Middle Mann- Whitney U Accept
Middle and Tail Mann- Whitney U Accept
Head and Tail Mann- Whitney U Accept
Dakkalt branch canal time
series data from May 2008
to February 2016 – 91
Head and Middle Mann- Whitney U Accept
Middle and Tail Mann- Whitney U Accept
Head and Tail Mann- Whitney U Reject
El Mashraqa branch canal
time series data from
August 2014 to November
2015 – 33
Head and Middle Mann- Whitney U Reject
Middle and Tail Mann- Whitney U Reject
Head and Tail Mann- Whitney U Reject
Bahr Semalla canal time
series data from August
2014 to November 2015 –
85
Head and Middle Mann- Whitney U Accept
Middle and Tail Mann- Whitney U Accept
Head and Tail Mann- Whitney U Accept
Th
e a
lka
lin
e ra
tio
is
equ
al
Khadeega branch canal
time series data from May
2008 to November 2015 –
72
Head and Middle Mann- Whitney U Reject
Middle and Tail Mann- Whitney U Accept
Head and Tail Mann- Whitney U Reject
Dakkalt branch canal time
series data from May 2008
to February 2016 – 91
Head and Middle Mann- Whitney U Reject
Middle and Tail Mann- Whitney U Reject
Head and Tail Mann- Whitney U Reject
El Mashraqa branch canal
time series data from
August 2014 to November
2015 – 33
Head and Middle Mann- Whitney U Reject
Middle and Tail Mann- Whitney U Accept
Head and Tail Mann- Whitney U Reject
Bahr Semalla canal time
series data from August
2014 to November 2015 –
85
Head and Middle Mann- Whitney U Accept
Middle and Tail Mann- Whitney U Accept
Head and Tail Mann- Whitney U Reject

44
Th
e
sali
nit
y r
ati
o i
s eq
ua
l
Khadeega branch canal
time series data from May
2008 to November 2015 –
72
Head and Middle Mann- Whitney U Reject
Middle and Tail Mann- Whitney U Accept
Head and Tail Mann- Whitney U Reject
Dakkalt branch canal time
series data from May 2008
to February 2016 – 91
Head and Middle Mann- Whitney U Reject
Middle and Tail Mann- Whitney U Reject
Head and Tail Mann- Whitney U Reject
El Mashraqa branch canal
time series data from
August 2014 to November
2015 – 33
Head and Middle Mann- Whitney U Reject
Middle and Tail Mann- Whitney U Accept
Head and Tail Mann- Whitney U Reject
Bahr Semalla canal time
series data from August
2014 to November 2015 –
85
Head and Middle Mann- Whitney U Reject
Middle and Tail Mann- Whitney U Accept
Head and Tail Mann- Whitney U Reject
Table 15 Summary for the test results for the sustainability location comparative analysis within
each branch canal
Testes
Hypothes
es
Sample - Observations Location Test Result
Th
e d
isso
lved
ox
yg
en r
ati
o i
s eq
ua
l
(Head and Middle)
Khadeega and Dakkalt
branch canals time series
data - 72 and 91
Head Mann- Whitney U Accept
Middle Mann- Whitney U Accept
Tail Mann- Whitney U Accept
(Middle and Tail) Dakkalt
and El Mashraqa branch
canals time series data - 37
and 33
Head Mann- Whitney U Accept
Middle Mann- Whitney U Accept
Tail Mann- Whitney U Reject
(Head and Tail) Khadeega
and El Mashraqa branch
canal time series data - 30
and 33
Head Mann- Whitney U Reject
Middle Mann- Whitney U Reject
Tail Mann- Whitney U Reject

45
Th
e a
lka
lin
e ra
tio
is
equ
al
(Head and Middle)
Khadeega and Dakkalt
branch canals time series
data - 72 and 92
Head Mann- Whitney U Reject
Middle Mann- Whitney U Accept
Tail Mann- Whitney U Reject
(Middle and Tail) Dakkalt
and El Mashraqa branch
canals time series data - 37
and 33
Head Mann- Whitney U Reject
Middle Mann- Whitney U Reject
Tail Mann- Whitney U Reject
(Head and Tail) Khadeega
and El Mashraqa branch
canal time series data - 30
and 33
Head Mann- Whitney U Reject
Middle Mann- Whitney U Accept
Tail Mann- Whitney U Reject
Th
e sa
lin
ity
ra
tio
is
equ
al
(Head and Middle)
Khadeega and Dakkalt
branch canals time series
data - 72 and 93
Head Mann- Whitney U Reject
Middle Mann- Whitney U Accept
Tail Mann- Whitney U Reject
(Middle and Tail) Dakkalt
and El Mashraqa branch
canals time series data - 37
and 33
Head Mann- Whitney U Reject
Middle Mann- Whitney U Reject
Tail Mann- Whitney U Reject
(Head and Tail) Khadeega
and El Mashraqa branch
canal time series data - 30
and 33
Head Mann- Whitney U Reject
Middle Mann- Whitney U Accept
Tail Mann- Whitney U Reject
Table 16 Summary for the test results for the sustainability location comparative analysis within
among the branch canals
Testes Hypotheses Sample (locations) - Observations Location Test
Relative
evapotranspiration
ratio is equal at all
positions
2008/2009 winter season (Head and
Middle) – 33 and 33 Student t Accept
2008/2009 winter season (Middle and
Tail) - 33 and 30 Student t Accept
2008/2009 winter season (Head and
Tail) - 33 and 30 Student t Accept
2013/2014 winter season (Head and
Middle) – 33 and 37 Mann- Whitney U Accept
2013/2014 winter season (Middle and
Tail) - 33 and 34 Mann- Whitney U Accept
2013/2014 winter season (Head and
Tail) - 33 and 34 Mann- Whitney U Accept
Table 17 Summary for the test results for water stress location comparative analysis within among
the branch canals

46
4- The Irrigation Improvement Projects
4.1- Improved and unimproved comparative analysis.
4.1.1- Economic productivity of land and water resources.
Water productivity. During the winter season of 2008/2009, the average of the
water productivity ratio of both the improved and unimproved canals was 1.09 kg/m3,
with standard deviations of 0.02 kg/m3 and 0.04 kg/m
3. The maximum values were 1.13
kg/m3 and 1.21 kg/m
3 while the minimum values were 1.04 kg/m
3 and 1.02 kg/m
3 for the
improved and unimproved, respectively. The Mann-Whitney U test results showed that
we accept the hypothesis that there is a difference between the improved and unimproved
water productivity. The ratio was significantly higher at the improved canals
During the winter season of 2013/2014, the averages of the water productivity
ratio of the improved and unimproved canals were 1.25 kg/m3 and 1.24 kg/m
3 with
standard deviations of 0.03 kg/m3 and 0.02 kg/m
3. The maximum values were 1.34 kg/m
3
and 1.27 kg/m3 for the improved and unimproved, respectively while the minimum value
for both was 1.21 kg/m3. The Mann-Whitney U test results showed that we accept the
hypothesis that the ratio at the improved canals was higher than the unimproved canals.
In addition, the averages of the percentage change in water productivity ratio of the
improved and unimproved canals were increase 14.01% and 15.59% with standard
deviations of 2.71 and 2.57. The maximum values were increase of 20.19% and 22.55%
while the minimum values were increase of 7.5% and 11.01%. The Student t test results
showed that we reject the hypothesis that at the improved canals the ratio was higher.
Yields. During the winter season of 2008/2009 the average yields of the improved
and unimproved canals was 6762.92 kg/ha and 6691.68 kg/ha with standard deviations of
206.63 kg/ha and 345.04 kg/ha. The maximum values were 7210 kg/ha and 7426 kg/ha
while the minimum values were 6327 kg/ha and 5695 kg/ha for the improved and
unimproved, respectively. The Mann-Whitney U test results showed that there was no
significant difference between the improved and unimproved canals.

47
During the winter season of 2013/2014 the average yields of the improved and
unimproved canals was 7312.23 kg/ha and 7070.60 kg/ha with standard deviations of
254.43 kg/ha and 285.94 kg/ha. The maximum values were 7704 kg/ha and 7646 kg/ha
while the minimum values were 6586 kg/ha and 6292 kg/ha for the improved and
unimproved, respectively. The Mann-Whitney U test results showed that we accept the
hypothesis that the improved canals yields were higher than the unimproved canals. In
addition, the averages of the percentage change in yields of the improved and
unimproved canals were increase 7.93% and 7.65% with standard deviations of 4.86 and
4.56. The maximum values were increase of 17.65% and 16.89% while the minimum
values were decrease of 5.39% and 1.79%. The Student t test results showed that there
was no significant difference between the change in yields of the improved and
unimproved canals.
Although, it can be concluded that the water productivity of the improved canals
was higher than of the unimproved, the increase in the ratio was higher for the
unimproved canals in both years. In addition, only during the winter season of 2013/2014
were yields higher at the improved canals as compared to the unimproved. There was no
significant difference between the improved and unimproved neither for yields of
2008/2009 season nor for the increase in yields between the two years. Therefore, the
impact of the improvement projects is not highly affecting the productivity of land and
water resources. The following tables summarize the descriptive statistics and test results
for evaluating the impact of the irrigation improvement projects on productivity of land
and water resources.
Table 18: Summary for the descriptive statistics for productivity improved and unimproved
comparative analysis during winter of 2008/2009
Winter Season 2008/2009
Indicator/
Parameter
Water Productivity Yields
IMP UN-IMP IMP UN-IMP
Average 1.09 1.09 6762.92 6691.68
Max 1.13 1.21 7210 7426
Min 1.04 1.02 6327 5695

48
Winter Season 2013/2014
Indicato
r/
Paramet
er
Water
Productivity
kg/m3
% change in
water
productivity
Yields kg/ha %change in
yields
% change in
water
consumption
IMP UN-
IMP
IMP UN-
IMP
IMP UN-
IMP
IMP UN-
IMP
IMP UN-
IMP
Average 1.25 1.24 14.01 15.59 7312.23 7070.60 7.93 7.65 -5.30 -6.94
Max 1.34 1.27 20.19 22.55 7704 7646 17.65 16.89 2.04 1.04
Min 1.21 1.21 7.50 11.01 6586 6292 -5.39 -1.79 -11.94 -15.96
Table 19: Summary for the descriptive statistics for productivity improved and unimproved
comparative analysis during winter of 2013/2014
Tested Hypotheses Sample - IMP and UNIMP
observations Test Result
Improved canals Water
productivity was at least
higher
2008/2009 winter data - 36
and 60
Mann-
Whitney U
Reject Equality -
Accept improved is
higher
2013/2014 winter data - 66
and 30
Mann-
Whitney U
Reject Equality -
Accept improved is
higher
Improved canals % change
in Water productivity was
at least higher
2008/2009 and 2013/2008
winter data - 66 and 30
Student t Reject Equality -
Reject improved is
higher
Improved canals yields was
at least higher
2008/2009 winter data - 36
and 60
Mann-
Whitney U
Accept Equality
2013/2014 winter data - 66
and 30
Mann-
Whitney U
Reject Equality -
Accept improved is
higher
Improved canals % change
in yields was at least higher
2008/2009 and 2013/2008
winter data - 66 and 30
Student t Accept Equality
Table 20: Summary for the test results for productivity improved and unimproved comparative
analysis during winter of 2008/2009 and 2013/2014
4.1.2- Sustainability of land and water resources.
Dissolved 0xygen ratio. Comparing the ratio at each position of the Bahr Semalla
unimproved canal against Khadeega, Dakkalt and El Mashraqa canals, the Mann-
Whitney U test results showed that there was no significant difference between any of the
canals and among all positions except when testing the tail of Bahr Semalla and El
Mashraqa. For this exception, the results showed that we reject the hypothesis that El
Mashraqa improved canal ratio was higher or even equal.

49
Alkaline ratio. As for the alkaline ratio, the test results showed that there was no
significant difference between the ratio at the unimproved canal and any of the improved
canals at any position.
Salinity ratio. The test results for the salinity ratio were unfavorable and showed
that the salinity ratio was significantly different at the unimproved and improved canals
at all position. The results showed that the ratio was significantly higher for the improved
canals as compared to the unimproved canal Bahr Semalla at the head, middle and tail of
all canals. The following table summarizes the test results for evaluating the impact of the
irrigation improvements on sustainability of land and water resources.
Tested
Hypotheses
Sample -
Observations Location
Test Result
Th
e im
pro
ved
bra
nch
ca
na
l d
isso
lved
ox
yg
en r
ati
o a
t le
ast
hig
her
Khadeega and Bahr
Semalla branch
canals time series
data - 72 and 85
Head Mann- Whitney U Accept equality
Middle Mann- Whitney U Accept equality
Tail Mann- Whitney U Accept equality
Dakkalt and Bahr
Semalla branch
canals time series
data -91 and 85
Head Mann- Whitney U Accept equality
Middle Mann- Whitney U
Accept equality
Tail Mann- Whitney U Accept equality
El Mashraqa and
Bahr Semalla
branch canal time
series data - and 33
and 85
Head Mann- Whitney U
Accept equality
Middle Mann- Whitney U Accept equality
Tail Mann- Whitney U Reject equality- Reject
improved is higher
Th
e im
pro
ved
bra
nch
ca
na
l a
lka
lin
e ra
tio
equ
al
or
low
er
Khadeega and Bahr
Semalla branch
canals time series
data - 72 and 85
Head Mann- Whitney U Accept equality
Middle Mann- Whitney U
Accept equality
Tail Mann- Whitney U Accept equality
Dakkalt and Bahr
Semalla branch
canals time series
data - 91 and 85
Head Mann- Whitney U Accept equality
Middle Mann- Whitney U
Accept equality
Tail Mann- Whitney U Accept equality
El Mashraqa and
Bahr Semalla
branch canal time
series data - 33 and
85
Head Mann- Whitney U Accept equality
Middle Mann- Whitney U Accept equality
Tail Mann- Whitney U
Accept equality

50
Th
e im
pro
ved
bra
nch
ca
na
l sa
lin
ity
ra
tio
is
equ
al
or
low
er
Khadeega and Bahr
Semalla branch
canals time series
data - 72 and 85
Head Mann- Whitney U Reject equality- Reject
improved is lower
Middle Mann- Whitney U
Tail Mann- Whitney U
Dakkalt and Bahr
Semalla branch
canals time series
data - 91 and 85
Head Mann- Whitney U Reject equality- Reject
improved is lower
Middle Mann- Whitney U
Tail Mann- Whitney U
El Mashraqa and
Bahr Semalla
branch canal time
series data - and 33
and 85
Head Mann- Whitney U Reject equality- Reject
improved is lower
Middle Mann- Whitney U
Tail Mann- Whitney U
Table 21: Summary for the test results for sustainability improved and unimproved comparative
analysis
The impact of the improvement projects on the sustainability of land and water
resources is not obvious. In general, the results show that there was no significant
difference between the improved and unimproved. Furthermore, for some locations the
salinity was significantly higher at the improved canals.
4.1.3- Water use and management efficiency.
Water Stress (Relative evapotranspiration ratio). During the winter season of
2008/2009 the averages of the relative evapotranspiration ratio of the improved and
unimproved canals was 0.96mm and 0.97mm with standard deviations of 0.01mm and
0.01mm. The maximum values were 0.98mm and 0.99mm for the improved and
unimproved, respectively while the minimum values of the ratio was 0.94mm for both.
The Mann-Whitney U test results showed that we reject the hypothesis that the improved
canals ratio was higher than the unimproved canals.
During the winter season of 2013/2014 the averages of the relative
evapotranspiration ratio of the improved and unimproved canals was 0.97mm and
0.96mm with standard deviations of 0.02mm and 0.02mm. The maximum value of the
ratio was 0.99mm for both for the improved and unimproved, while the minimum values
were 0.94mm and 0.91mm for the improved and unimproved, respectively. The Mann-

51
Whitney U test results showed that we accept the hypothesis that there is a significant
difference between the improved and unimproved canals, where the ratio at the improved
canals was higher than the unimproved canals.
During the winter season of 2008/2009, the effectiveness of the improvement
projects on water shortages was not obvious improvement projects. First, because the
ratio at the improved canals was not found significantly higher than the unimproved
canals second, because the ratio did not indicate water stress problems. Only during the
winter season of 2013/2014, the ratio at the improved canals was higher than the
unimproved canals. This could be because of the improvements however, the ratio did
not suffer from any inefficiency during either winter season and thus no significant
improvement could be concluded.
Location comparative analysis for the improved canals. This section includes
the comparative analysis for the economic productivity and management of land and
water resources. The comparative analysis for the sustainability of land and water
resources is not included in this section as 3.2.2 presented the comparative analysis for
three improved canals.
Economic productivity of land and water resources.
Water productivity. During the winter season of 2008/2009, the averages of the
water productivity ratio for the head, middle and tail improved canals were 1.10 kg/m3 at
the head and middle and 1.08 kg/m3 at the tail with standard deviations of 0.02 kg/m
3 at
the head and middle and 0.01 kg/m3 at the tail. The maximum values of the ratios were
1.13 kg/m3 at the head and middle and 1.09 kg/m
3 at the tail. The minimum values were
1.06, 1.04 and 1.07 kg/m3 at the head, middle and tail, respectively. The Student t test
showed that we accept the hypothesis of no significant difference between the head and
middle canals water productivity ratio. On the other hand, the Mann-Whitney U test
results showed that there was a difference between the middle and tail canals water
productivity and between the head and tail. The results showed that the ratio for the head
and middle canals were significantly higher than at the tail canals.

52
During the winter season of 2013/2014, the averages of the water productivity
ratio for the head, middle and tail were 1.26, 1.25 and 1.24 kg/m3 with standard
deviations of 0.03, 0.03 and 0.01 kg/m3. The maximum values of the ratios were 1.33,
1.34 and 1.26 kg/m3 at the head, middle and tail respectively. The minimum value was
1.21 kg/m3 at the head and middle and 1.23 kg/m
3 at the tail. The Mann-Whitney U test
showed that we accept the hypothesis of no significant difference between the head and
middle canals water productivity ratio and between the middle and tail canals. On the
other hand, the Student t results for the head and tail showed that we reject the hypothesis.
The results showed that the ratio at the head canals was significantly higher than at the
tail canals. Furthermore, the Student t test results showed that there was no significant
difference in the percentage change in water productivity ratio between the head and
middle canals as well as, the middle and tail canals. The results showed that there was a
significant difference between the head and tail canals but they showed that the increase
in water productivity was significantly lower at the head canals.
Yields. During the winter season of 2008/2009, the average yields for the head,
middle and tail were 6674.9, 6763.27 and 842.45 kg/ha with standard deviations of 239.3,
196.17 and 171.21 kg/ha. The maximum values of the yields were 7169, 7075 and 7210
kg/ha; the minimum values were 6327, 64757 and 6626 kg/ha for the head, middle and
tail respectively. The Student t tests results showed that we accept the hypothesis of no
significant difference between any of the positions.
During the winter season of 2013/2014, the average yields for the head, middle
and tail were 7305.34, 7285.29 and 7360.06 kg/ha with standard deviations of 287.36,
258.87 and 182.99 kg/ha. The maximum values of the yields were 7703, 7603 and 7704
kg/ha; the minimum values were 6586, 6697 and 6972 kg/ha for the head, middle and tail
respectively. The Student t test results showed that we accept the hypothesis of no
significant difference between any of the positions. In addition, the average percentage
change in yields for the head, middle and tail were 7.87%, 7.81% and 8.21% with
standard deviations of 5.75, 4.67 and 3.41. The maximum values of the percentage

53
change in yields were increase of 17.65, 14.32% and 14.14%; the minimum values were
decrease of 5.39%, 1.67% and 0.22% for the head, middle and tail respectively. The
student t test results also showed we accept the hypothesis of no significant difference
among all positions. The following table summarizes the test results for the improved
canals productivity location comparative analysis.
Tested
Hypotheses
Sample (locations) –
Observations Test Result
Water
productivity
ratio is equal
at all
locations
2008/2009 winter season (Head
and Middle) - 10 and 15 Student t Accept
2008/2009 winter season (Middle
and Tail) - 15 and 13 Mann- Whitney U Reject
2008/2009 winter season (Head
and Tail) - 10 and 13 Mann- Whitney U Reject
2013/2014 winter season (Head
and Middle) - 29 and 21 Mann- Whitney U Accept
2013/2014 winter season (Middle
and Tail) - 21 and 16 Mann- Whitney U Accept
2013/2014 winter season (Head
and Tail) - 29 and 16 Student t Reject
Yields are
equal at all
locations
2008/2009 winter season (Head
and Middle) - 10 and 15 Student t Accept
2008/2009 winter season (Middle
and Tail) - 15 and 13 Student t Accept
2008/2009 winter season (Head
and Tail) - 10 and 13 Student t Accept
2013/2014 winter season (Head
and Middle) - 29 and 21 Student t Accept
2013/2014 winter season (Middle
and Tail) - 21 and 16 Student t Accept
2013/2014 winter season (Head
and Tail) - 29 and 16 Student t Accept
Percentage
change in
water
productivity
ratio is equal
at all
locations
2008/2009 and 2013/2014 winter
season (Head and Middle) - 29
and 21
Student t Accept
2008/2009 and 2013/2014 winter
season (Middle and Tail) - 21
and 16
Student t Accept
2008/2009 and 2013/2014 winter
season (Head and Tail) – 29 and
16
Student t Reject
Percentage
change in
yields are
equal at all
locations
2008/2009 and 2013/2014 winter
season (Head and Middle) - 29
and 21
Student t Accept
2008/2009 and 2013/2014 winter
season (Middle and Tail) - 21
and 16
Student t Accept
2008/2009 and 2013/2014 winter
season (Head and Tail) – 29 and
16
Student t Accept

54
Table 22: Summary for the test results for improved productivity location comparative analysis
Water use and water management efficiency.
Water stress (relative evapotranspiration ratio). As for the water stress indicator,
during the winter season of 2008/2009, the averages of the relative evapotranspiration
ratio were 0.97mm at the head and tail and 0.96mm at the middle, with standard
deviations of 0.01mm for all positions. The maximum value of the ratios was 0.98mm at
all positions. The minimum values were 0.95, 0.94 and 0.96mm for the head, middle and
tail, respectively. The Student t test showed that we accept the hypothesis of no
significant difference when testing the head with middle and the head with the tail. On
the other hand, we cannot accept the hypothesis for the middle and tail where the ratio
was higher at the tail.
During the winter season of 2013/2014, the averages of the relative
evapotranspiration ratio were 0.98mm at the head and 0.97mm at the middle and tail,
with standard deviations of 0.02mm for the head and middle and 0.01mm for the tail. The
maximum value of the ratios was 0.99mm at all positions. The minimum values were
0.94mm for the head and middle and 0.95mm at the tail. The Mann-Whitney U test
showed that we accept the hypothesis of no significant difference at any of the positions.
The impact of the improvement projects on the efficiency of water use and
management is also not obvious. The results obtained from the location comparative
analysis of the improved canals were the same as those obtained when not considering
the improvement status. The results suggest that even when considering only the
improved canals, still there is inefficiency of water use and management resulting in
inequity among the different locations. The following table summarizes the test results
for the improved canals ratio location comparative analysis.
Tested
Hypothesis Sample (locations) – Observations Test Result
Rel
ati
ve
eva
po
tra
nsp
ir
ati
on
ra
tio
is
equ
al
at
all
po
siti
on
s
2008/2009 winter season (Head and Middle) - 10 and 15 Student t Accept
2008/2009 winter season (Middle and Tail) - 15 and 13 Student t Accept
2008/2009 winter season (Head and Tail) - 10 and 13 Student t Accept
2013/2014 winter season (Head and Middle) - 29 and 21 Mann- Whitney U Accept
2013/2014 winter season (Middle and Tail) - 21 and 16 Mann- Whitney U Accept
2013/2014 winter season (Head and Tail) - 29 and 16 Mann- Whitney U Accept
Table 23: Summary for the test results for improved water stress location comparative analysis

55
V-Conclusion
The reasons and impacts of water scarcity vary in different countries across the world and
therefore, the policies and strategies adopted in facing the problems of water scarcity are
different in every country. However, they all seek to improve efficiency of water use and
management in order to mitigate the impacts on the different sectors of the economy.
Although, several studies suggested optimal solutions such as water pricing and the
adoption of modernized irrigation systems, such policies would be unrealistic and
inapplicable in Egypt.
The Nile River is the main source of water in Egypt and is referred to as the
“Artery of Life”. The narrow strip of the Nile River from Aswan in Upper Egypt to Cairo
in Lower Egypt and the Delta literally define life in Egypt. Due to aridity, only 5% of the
country’s land area is utilized between all sectors of the economy. Over the past several
years, as to improve the quality of life in the country, the government has been applying
several improvement projects within the different sectors of the economy to improve
water use, water management and water productivity. The irrigation improvement
projects were aimed to mitigate the problems of water scarcity within the agricultural
sector and lessen the pressures on land and water resources from the traditional irrigation
techniques.
The projects were implemented through the adoption of an integrated water
resource management approach, which mainly integrates different policies to decentralize
the resource management. Major physical and non-physical changes have taken place
including, improvement of the irrigation system on the branch canal and on farm level,
water pollution abatement programs and the creation of water boards and water users
associations. Unfortunately, several literature suggested and showed that the
improvement projects have been ineffective mainly because of the lack of coordination
between the Ministry of Water Resources and Irrigation and farmer. However, the impact
of the improvement projects on farmers, land and water resources have been
controversial.

56
Based on research, the study concluded three major problems affecting the
agricultural sector due to water scarcity that the irrigation improvement projects have
been aiming to face. This study empirically tested and analyzed the identified problems to
evaluate the impact of water scarcity on economic growth and sustainable development.
In addition, the study empirically tested and analyzed the productivity, sustainability and
management of land and water resources of the improved canals to evaluate the impact of
the irrigation improvement projects. Accordingly, the following hypotheses were tested.
1- Water scarcity is limiting the growth of land and water productivity.
2- Deterioration of water quality is threatening the sustainability of land and
water resources.
3- Inefficiency of water use and management is creating water shortages and
inequity of water distribution.
4- The irrigation improvement projects have improved productivity,
sustainability and management of land and water resources.
In order to test the first hypothesis, the economic productivity of land and water
resources were evaluated. Economic productivity was measured using the data on wheat
water productivity ratio, yields and water consumption for a sample of 96 branch canals
during two winter seasons of 2008/2009 and 2013/2014. The analysis was based on the
following:
1- Computing descriptive statistics for the water productivity, yields and
water consumption during the two winter seasons
2- Computing descriptive statistics for the percentage change for the water
productivity, yields and water consumption between the two winter seasons
3- Testing the water productivity ratio during the two winter seasons against
the average global water productivity ratio for wheat
4- Comparing the water productivity ratio to results from the literature
5- Testing for increase between the two winter seasons in the water
productivity ratio and yields while, testing for decrease in water consumption.

57
To test the second hypothesis, the sustainability of land and water resources were
evaluated. Sustainability of the resources is mainly affected by the water quality and
therefore, the study used data on three indicators of water quality. The three indicators
measured the level of oxygen in irrigation water the plants can benefit from, the acidity of
water, and the salinity of water. The analysis were based on time series data for a sample
of four branch canals, three of which are located on Mit Yazeed main canal and are
improved. The sample measured each indicator at the head, middle and tail of each canal.
The indicators were evaluated as follows:
1- Computing the sustainability ratio of each indicator which is dividing the
current value and critical value as follows;
a. Dividing the current value of the dissolved oxygen by 5
b. Dividing the current value of the PH (alkaline) level by 7
c. Dividing the electrical conductivity (salinity) by 0.85
2- Computing descriptive statistics for the ratios at the head, middle and tail
of each branch canal.
3- Testing each ratio against the sustainability measurements for each canal
and at each position as follows;
a. Testing that the dissolved oxygen ratio was at least 1
b. Testing that the PH ratio (alkaline ratio) was equal 1 and is not following
an increasing trend
c. Testing that the electrical conductivity ratio(salinity) was at most 1
In order to test the third hypothesis, the efficiency of water use and management were
evaluated. Efficiency of water use and management were evaluated using the relative
evapotranspiration ratio for wheat, which measures water stress and location comparative
analysis for the productivity, sustainability and efficiency of the head, middle and tail as
follows;
1- Computing the relative evapotranspiration ratio for 96 branch canals
during the two winter seasons of 2008/2009 and 2013/2014
2- Computing descriptive statistics for the ratio during the two winter seasons
3- Testing that the ratio was at least 0.6 during the two winter seasons

58
4- Computing descriptive statistics for all indicators at the head, middle and
tail
5- Testing that there is equity between the head, middle and tail canals in
a. Economic productivity (water productivity, yields, change in water
productivity and change in yields)
b. Sustainability of land and water resources (dissolved oxygen ratio,
alkaline ratio and salinity ratio). The equity was tested at the head, middle and tail
of each canal and at each position among the canals. Khadeega canal represented
the head, Dakkalt represented the middle and El Mashraqa represented the tail.
c. Efficiency of water use and management (relative evapotranspiration
ratio)
Finally, the last hypothesis was tested by evaluating the irrigation improvement
projects. The study tested the economic productivity, sustainability and management of
land and water resources of the improved canals against the unimproved. In addition, the
study tested for equity of all indicators among the different locations of the improved
canals. The analysis were based on the following,
1- Computing descriptive statistics for the improved and unimproved canals
for all indicators
2- Testing that the indicators of economic productivity of the improved
canals were higher
3- Testing that the sustainability at the improved canals was as follows:
a. the dissolved oxygen ratio was higher
b. the PH level was not higher
c. the salinity level was lower
4- Testing that the efficiency of water use and management as follows;
a. the relative evapotranspiration ratio for the improved canal was higher
b. equity in economic productivity, sustainability and efficiency among the
different locations (head, middle and tail) for the improved canals

59
Based on the data analysis it can be concluded that the impact of water scarcity in
the agricultural sector is not severe during the winter season. The results showed that
water and land productivity during the winter season were high and increasing. However,
the rate of increase in crop yield is not in line with the rapid increase in the population.
Over five years the highest increase in wheat production was only 17.65%. Already,
Egypt is highly dependent on food imports, counting for 21% of its merchandise imports
during 2014(World Bank, 2014). Therefore, water scarcity is limiting growth in
agricultural production, threatening food security and negatively affecting the country’s
national income and poverty rates.
Based on the analysis of water quality, it can be concluded that the sustainability
of land and water resources are at risk. The dissolved oxygen ratio and alkalinity ratios
did not meet the sustainability measurements. Possibly, because of low water follow in
the branch canals, the study found that the dissolved oxygen levels are in general low and
placing pressure on the plant growth. Alkaline ratio was high but not following a specific
trend which could be due to the effect of water treatment and the use of drainage water.
On the other hand, except for the branch canals located at the tail end, the water did not
suffer from high salinity rates but it should not be confused with land salinity.
The analysis of the efficiency of water use and management showed that crops
did not suffer from water stress during the winter season. The location comparative
analysis showed clear variations among the different locations of the canals, which
indicates inefficiency of water management among the canals. The results proves that
especially, at the tail end farmers suffer from inequity and are obligated to use poor water
quality in their lands. It is worth to mention that the analysis of the economic productivity
and efficiency of water use and management for the main summer crops would be very
beneficial and more conclusive. However, as obtaining the summer data for this research
was not possible therefore, the analysis for water productivity and water stress were
based on winter data only.

60
Finally, the impact of the improvement projects in the agricultural sector is
questionable. The comparative analysis between the improved and unimproved canals for
all indicators did not prove that the improved canals had better performance. In general,
the study found that there was no significant difference between the improved and
unimproved economic productivity, sustainability and management of land and water
resources. Furthermore, the salinity at the improved canal that is located on the tail was
higher than the unimproved canal. This indicated that the improvements were not
effective in one of the most important problems currently facing the sector.
The results show the urgent need for the government to improve the coordination
between its sectors and farmers in order to help maintain the sustainability of the
agricultural production. Some of the improvement projects were applied before 2008; yet,
no conclusive results for the improvement have been achieved. It is obvious that farmers
have been managing to face the system’s inefficiencies and maintain productivity but that
is not sufficient to maintain the country’s sustainable development. Without proper
planning and implementation of the horizontal expansion of the irrigated lands, the
country will be facing serious development problems.

61
References
2030 Water Resources Group (2030WRG). (2009). Charting Our Water Future:
Economic frameworks to inform decision-making. Washington, DC, 2030WRG.
Abdelgawad, S., Allam, M., and Elgamal, M. (2010). Integrated Water Resource
Management Practices in Egypt, A Critical Review and Analysis. Fourteenth
Internationa Water Technology Conference, IWTC 14 2010, Cairo, Egypt.
Abou Kheira, A. (2009). Comparison among Different Irrigation Systems for Deficit-
Irrgated Corn in the Nile Valley. Water Management Research Institute, National
Water Research Center.
Allam, M.N. (2004). Participatory Irrigation Water Management in Egypt: review and
analysis. From: de Bont, C. (2013). Responses to the Irrigation Improvement Project
Along Abo Moustafa canal, Egypt. An analysis of water users' re-ordering of the
socio-technical water network (M.Sc. Minor Thesis). Wageningen University.
Water Resources Management Group.
Allam, M.N., El Gamal, F., and Hesham, M. (2005). Irrigation Systems Performance in
Egypt. From: de Bont, C. (2013). Responses to the Irrigation Improvement Project
Along Abo Moustafa canal, Egypt. An analysis of water users' re-ordering of the
socio-technical water network (M.Sc. Minor Thesis). Wageningen University.
Water Resources Management Group.
Barnes, J. (2014). Mixing waters: The reuse of agricultural drainage water in
Egypt. Geoforum, 57, 181-191. http://dx.doi.org/10.1016/j.geoforum.2012.11.019
Bassi, S., Farmer, A., and Fergusson, M. (2007). Water Scarcity and Droughts. London,
United Kingdom: Institute for European Environmental Policy.
Batt, H. & Merkley, G. (2009). Water management and user association analysis for
irrigation improvement in Egypt. Irrigation and Drainage.
http://dx.doi.org/10.1002/ird.465
Calzadilla, A., Rehdanz, K., & Tol, R. (2010). Water scarcity and the impact of improved

62
irrigation management: a computable general equilibrium analysis. Agricultural
Economics, 42(3), pp. 305-23.
Cancela, J., Cuesta, T., Neira, X., & Pereira, L. (2006). Modeling for Improved Irrigation
Water Management in a Temperate Region of Northern Spain. Biosystems
Engineering, 94(1), pp. 151-63.
Cascão, A.E. (2009). Changing power relations in the Nile river basin: Unilateralism vs.
cooperation? Water Alternatives 2(2), pp. 245-68
Dabour, N. (2006). Water resources and their use in agriculture in Arab countries. Journal
Of Economic Cooperation, 1(27), pp.1-38.
de Bont, C. (2013). Responses to the Irrigation Improvement Project Along Abo
Moustafa canal, Egypt. An analysis of water users' re-ordering of the socio-technical
water network (M.Sc. Minor Thesis). Wageningen University. Water Resources
Management Group.
de Fraiture, C., & Wichelns, D. (2010). Satisfying future water demands for agriculture.
Agricultural Water Management, 97(4), pp. 502-11.
El-Agha, D., Molden, D., & Ghanem, A. (2011). Performance assessment of irrigation
water management in old lands of the Nile delta of Egypt. Irrig Drainage Syst, 25(4),
215-236. http://dx.doi.org/10.1007/s10795-011-9116-z
El-Sadek, A. (2009). Virtual Water Trade as a Solution for Water Scarcity in
Egypt. Water Resour Manage, 24(11), 2437-2448. http://dx.doi.org/10.1007/s11269-
009-9560-9
Falkenmark, M., Lundqvist, J., & Widstrand, C. (1989). Macro-scale water scarcity
requires micro-scale approaches. Natural Resources Forum, 13(4), pp. 258-67.
Food and Agriculture Organization of the United Nations (FAO), (2005). Land and Water
Resources Information System in Egypt
Food and Agriculture Organization of the United Nations (FAO), (2011). Egypt: Country

63
Pasture/Forage Resources Profile.
Gohar, A., & Ward, F. (2011). Gains from Improved Irrigation Water Use Efficiency in
Egypt. International Journal of Water Resources Development, pp. 1-22.
Hassanin, S. (2007). Evaluation of Water Quality of ElNaser-3 Drain in Egypt Using
QUAL2K Model. Eleventh International Water Technology Conference, IWTC
2007 Sharm El-Shiekh, Egypt.
He, L., Tyner, W., Doukkali, R., & Siam, G. (2006). Policy Options to Improve Water
Allocation Efficiency: Analysis on Egypt and Morocco. Water International, 31(3),
pp. 320-37.
International Center for Agricultural Research in the Dry Areas. (2011). Water and
Agriculture in Egypt.
Kamara, A., & Sally, H. (2004). Water management options for food security in South
Africa: scenarios, simulations and policy implications. CDSA, 21(2), pp. 365-84.
Kawy, W. (2011). Using GIS Modeling to Assess the Agricultural Sustainability in Kafr
El-Sheikh Governorate, Nile Delta, Egypt. Arabian Journal of Geosciences, 6(3), pp.
Kawy, W. & Darwish, K. (2012). Sustainable multivariate analysis for land use
management in El-Sharkiya, Egypt. Arabian Journal Of Geosciences, 7(2), 475-487.
http://dx.doi.org/10.1007/s12517-012-0758-4733-47.
Koς, C. (2015). A Study on the Role and Importance of Irrigation Management in
Integrated River Basin Management. Environmental Monitoring and Assessment,
187(8), pp. 1-20.
Kotb, T. and Boissevain, W. (2012). Water Saving Due to Irrigation Improvement in the
Nile Delta. From:
Kumar, D. (2012). Adoption of Drip Irrigation System in India: Some Experience and
Evidence. Bangladesh Development Studies, xxxv(1), pp. 61-78.
López-Morales, C., & Duchin, F. (2011). Policies and Technologies for a Sustainable Use

64
of Water in Mexico: A Scenario Analysis. Economic Systems Research, 23(4), pp.
387-407.
Malashkhia, N. (2003). Social and Environmental Constraints of the Irrigation Water
Conservation Measures in Egypt (Masters of Science). Lund University.
Metawie, A. Salinity Management in the Nile Delta. Case Study: Resude of Drainage
Water in Egypt.
Ministry of Water Resources and Irrigation (MWRI), (2014). Water Scarcity in Egypt:
The Urgent Need for Regional Cooperation among Nile Basin Countries. Egypt:
FAO.
Ministry of Water Resources and Irrigation (MWRI), Irrigation Improvement Sector,
(2008). Irrigation Improvement Project: Final Completion Report, Main Report.
Unpublished. Obtained from: Water Management Research Institute, 2016
Moustafa, M. (2004). Can Farmers in Egypt Shoulder the Burden of Irrigation
Management?. Irrigation And Drainage Systems, 18(2), 109-125.
http://dx.doi.org/10.1023/b:irri.0000040249.12754.c8
Peigrun, H. Kassies, R. and Voogt, M.2014, Egypt: Unpublished Report by eLEAF
under assignment of IIMP, MWRI, Egypt. Copyright 2014 eLeaf and GeoMAP.
Obtained from: Water Management Research Institute, 2016
Peterson, S. and Klepper, G. (2007) : Potential impacts of water scarcity on the world
economy, IN: Lozá, L., Grassl, H. and Peter, E.: Global change-enough water for
all?, ISBN 3-9809668-2-8, Wiss. Auswertungen, Hamburg, pp.263-67
Radwan, L. (1997). Farmer Responses to Inefficiencies in the Supply and Distribution of
Irrigation Requirements in Delta Egypt. The Geographical Journal, 163(1), 78.
http://dx.doi.org/10.2307/3059688

65
Randall, A. (1981). Property Entitlements and Pricing Policies for a Maturing Water
Economy. Australian Journal of Agricultural Economics, 25(3), pp. 195-220.
Reinders, F., van der Stoep, I., & Backeberg, G. (2013). Improved Efficiency of
Irrigation Water Use: A South African Framework. Irrigation and Drainage, 62(3),
pp. 262-72.
Seckler, D., Amarasingle, A., Olden, D. M., de Silva, R. and Barker R. (1998). World
Water Demand and Supply 1990 to 2025: Scenario and Issues. International Water
Management Institute Research Report 19, Colombo, Sri Lanka.
Shaban, M., Urban, B., El Saadi, A., & Faisal, M. (2010). Detection and mapping of
water pollution variation in the Nile Delta using multivariate clustering and GIS
techniques. Journal Of Environmental Management, 91(8), 1785-1793.
http://dx.doi.org/10.1016/j.jenvman.2010.03.020
Törnqvist, R., & Jarsjö, J. (2011). Water Savings through Improved Irrigation
Techniques: Basin-Scale Quantification in Semi-Arid Environments. Water
Resource Management, 26(4), pp. 949-62.
United Nations World Water Development Report, (2015): Water for a Sustainable
World. United Nations Water Programme, (UN-Water).
United Nations Water Programme (UN-Water), (2006). Coping with Water Scarcity: A
strategic issue and priority for system-wide action.
United Nations Environmental Programme (UNEP). (2006). Global Water Resources.
Wichelns, D. (2002). An Economic Perspective on Subsurface Drainage Programmes in
Developing Countries, with an Example from Egypt. International Journal of Water
Resources Development, 18(3), pp. 473-85.
Wichelns, D. (2002). Economic analysis of water allocation policies regarding Nile River
water in Egypt. Agricultural Water Management, 52(2), pp. 155-75.

66
APPENDIX A
THE BRANCH CANALS’ NAME, LOCATION AND IMPROVEMENT STATUS
DURING THE WINTER SEASONS OF 2008/2009 AND 2013/2014
Branch Canal Location
Improvement Status
2008/2009 2013/2014
1 khadiga Mit yazeed Head Unimproved Improved
2 neshil el kadima Mit yazeed Head Unimproved Improved
3 neshil el gdeda Mit yazeed Head Unimproved Improved
4 el sheikha Mit yazeed Head Unimproved Improved
5 waslet neshil Mit yazeed Head Unimproved Improved
6 ganabiah 2,3,4,&5 Mit yazeed Head Unimproved Unimproved
7 mit yazid Mit yazeed Head Unimproved Improved
8 duplicate name Mit yazeed Head Unimproved Improved
9 mit yazid 2 Mit yazeed Head Unimproved Improved
10 kom el roz el gdeda Mit yazeed Head Unimproved Unimproved
11 bahr semella Bahr Semalla Head Unimproved Unimproved
12 nekla Mahmoudia Head Unimproved Improved
13 hamad minsy Mahmoudia Head Unimproved Improved
14 ganabiet el babli Mahmoudia Head Unimproved Improved
15 zarqoun el sharqia Mahmoudia Head Unimproved Improved
16 gnabiet kafr sobrakhit Mahmoudia Head Unimproved Improved
17 el hakem Mahmoudia Head Unimproved Improved
18 ganabiet el nasry Mahmoudia Head Unimproved Improved
19 kafr elrhmania Mahmoudia Head Unimproved Improved
20 rayah zarkqon Mahmoudia Head Unimproved Improved
21 ezab el awqaf Mahmoudia Head Unimproved Improved
22 el nakhla Mahmoudia Head Improved Improved
23 el herfa Mahmoudia Head Improved Improved
24 el hammamy Mahmoudia Head Improved Improved
25 bisntway Mahmoudia Head Improved Improved
26 ganabiet sahaly Mahmoudia Head Improved Improved
27 el rezqa Mahmoudia Head Improved Improved
28 el qenawia Mahmoudia Head Improved Improved
29 sahaly Mahmoudia Head Improved Improved
30 el garadat Mahmoudia Head Improved Improved
31 el qarawy Mahmoudia Head Improved Improved
32 ganabiet hamad minsy Mahmoudia Head Unimproved Improved

67
Branch Canal Location
Improvement Status
2008/2009 2013/2014
33 bany helal Bany helal Head Unimproved Unimproved
34 Arioum Mit Yazeed Middle Unimproved Unimproved
35 el shmarqa Mit Yazeed Middle Unimproved Unimproved
36 el gemeza Mit Yazeed Middle Unimproved Unimproved
37 kom el roz el kadema Mit Yazeed Middle Unimproved Improved
38 daqlat Mit Yazeed Middle Improved Improved
39 bahr nemra Mit Yazeed Middle Unimproved Improved
40 el zawiah Mit Yazeed Middle Unimproved Unimproved
41 ganabiah 6 yosra el zawia Mit Yazeed Middle Unimproved Unimproved
42 mit yazid4 Mit Yazeed Middle Unimproved Improved
43 el shoka Mit Yazeed Middle Unimproved Improved
44 mit yazid6 Mit Yazeed Middle Unimproved Improved
45 el zawiah Mit Yazeed Middle Unimproved Unimproved
46 el qahwagi Mit Yazeed Middle Improved Improved
47 mit yazid1 Mit Yazeed Middle Improved Improved
48 el ganabiah el rabah right Mit Yazeed Middle Unimproved Unimproved
49
el ganabiah el tanyah & el
taltah Mit Yazeed Middle Unimproved Unimproved
50 el zawiah Mit Yazeed Middle Unimproved Unimproved
51 marsa el gamal Mit Yazeed Middle Unimproved Improved
52 el ghabat Mit Yazeed Middle Unimproved Unimproved
53 gnabiet kafr el dawar Mahmoudia Middle Unimproved Unimproved
54 balaqtar Mahmoudia Middle Improved Improved
55 el saarania Mahmoudia Middle Improved Improved
56 ganabet el saarania Mahmoudia Middle Unimproved Unimproved
57 ganabet zahra Mahmoudia Middle Improved Improved
58 mamal el qazaz Mahmoudia Middle Improved Improved
59 louqein Mahmoudia Middle Improved Improved
60 el berka Mahmoudia Middle Improved Improved
61 el nasry Mahmoudia Middle Improved Improved
62 ganabet desones Mahmoudia Middle Improved Improved
63 el karoun Mahmoudia Middle Improved Improved
64 qafla Mahmoudia Middle Improved Improved

68
Branch Canal Location
Improvement Status
2008/2009 2013/2014
65 el akresha Mahmoudia Middle Improved Improved
66 kafr azazy Mahmoudia Middle Improved Improved
67 boses Mit yazeed Tail Improved Improved
68 el admah Mit yazeed Tail Unimproved Unimproved
69 el misk Mit yazeed Tail Improved Improved
70 sidi salim el sharqiah Mit yazeed Tail Improved Improved
71 el masharqa Mit yazeed Tail Improved Improved
72 shalmah Mit yazeed Tail Improved Improved
73 mit yazid3 Mit yazeed Tail Improved Improved
74 el sefsafa Mit yazeed Tail Improved Improved
75 el emdan Mit yazeed Tail Improved Improved
76 kom el wahal Mit yazeed Tail Improved Improved
77 dail rwena Mit yazeed Tail Improved Improved
78 el halafy Mit yazeed Tail Unimproved Improved
79 el zaker Mit yazeed Tail Unimproved Unimproved
80 ganabiet nazer Mahmoudia Tail Unimproved Unimproved
81 el beeda Mahmoudia Tail Unimproved Unimproved
82 gnabiet el omraa Mahmoudia Tail Unimproved Unimproved
83 gnabiet houd el malaha Mahmoudia Tail Unimproved Unimproved
84 gnabiet aref Mahmoudia Tail Unimproved Unimproved
85 el montaza Mahmoudia Tail Unimproved Unimproved
86 el raesyia el qadema Mahmoudia Tail Unimproved Unimproved
87 el malaha Mahmoudia Tail Unimproved Unimproved
88 el kanobia Mahmoudia Tail Improved Improved
89
gnabiet king osman el
bahrya Mahmoudia Tail Unimproved Improved
90 el kalaa Mahmoudia Tail Unimproved Unimproved
91 abis el gdida Mahmoudia Tail Unimproved Improved
92 maryout Mahmoudia Tail Unimproved Improved
93 khorshed Mahmoudia Tail Unimproved Unimproved
94 el gharby Mahmoudia Tail Unimproved Unimproved
95 el karakol Mahmoudia Tail Unimproved Unimproved
96 abis el qadema Mahmoudia Tail Unimproved Improved

69
APPENDIX B
ECONOMIC PRODUCTIVITY OF LAND AND WATER RESOURCES
INDICATORS FOR WHEAT
Branch Canal
Water
Productivity
Ratio kg/m3
Yields kg/ha % Change in
2008/
2009
2013/
2014
2008/
2009
2013/
2014
Water
Productivity Yields
Water
Consumption
1 khadiga 1.21 1.31 6985 7091 8.26 1.52 -6.38
2 neshil el kadima 1.15 1.28 6918 6777 11.30 -2.04 -11.92
3 neshil el gdeda 1.2 1.29 7426 7026 7.50 -5.39 -11.94
4 el sheikha 1.19 1.29 6921 7022 8.40 1.46 -6.66
5 waslet neshil 1.2 1.33 6642 6586 10.83 -0.84 -9.89
6 ganabiah 2,3,4,&5 1.07 1.26 6369 6977 17.76 9.55 -7.04
7 mit yazid 1.13 1.25 6854 6889 10.62 0.51 -8.88
8 duplicate name 1.08 1.26 6915 7189 16.67 3.96 -10.92
9 mit yazid 2 1.21 1.32 6476 7128 9.09 10.07 1.12
10 kom el roz el gdeda 1.06 1.24 6931 7324 16.98 5.67 -9.47
11 bahr semella 1.12 1.26 6902 7431 12.50 7.66 -3.90
12 nekla 1.05 1.22 6529 7168 16.19 9.79 -5.02
13 hamad minsy 1.06 1.23 6692 7514 16.04 12.28 -3.18
14 ganabiet el babli 1.09 1.23 7113 7557 12.84 6.24 -6.13
15 zarqoun el sharqia 1.08 1.24 7043 7523 14.81 6.82 -7.20
16 gnabiet kafr sobrakhit 1.09 1.23 7095 7549 12.84 6.40 -5.84
17 el hakem 1.06 1.24 6744 7602 16.98 12.72 -3.62
18 ganabiet el nasry 1.09 1.27 6782 7170 16.51 5.72 -9.00
19 kafr elrhmania 1.06 1.22 6404 7031 15.09 9.79 -4.94
20 rayah zarkqon 1.04 1.25 6317 7432 20.19 17.65 -1.16
21 ezab el awqaf 1.09 1.21 7009 7175 11.01 2.37 -7.18
22 el nakhla 1.13 1.24 6585 7398 9.73 12.35 1.87
23 el herfa 1.1 1.24 6701 7502 12.73 11.95 -0.98
24 el hammamy 1.08 1.26 6773 7642 16.67 12.83 -3.35
25 bisntway 1.08 1.24 6655 7593 14.81 14.09 -0.81
26 ganabiet sahaly 1.06 1.23 6567 7248 16.04 10.37 -4.85
27 el rezqa 1.12 1.27 7169 7666 13.39 6.93 -6.23
28 el qenawia 1.12 1.26 6918 7550 12.50 9.14 -2.91
29 sahaly 1.1 1.25 6619 7530 13.64 13.76 -0.33
30 el garadat 1.11 1.26 6327 7313 13.51 15.58 1.22
31 el qarawy 1.11 1.27 6435 7281 14.41 13.15 -0.86
32 ganabiet hamad minsy 1.11 1.26 7065 7703 13.51 9.03 -4.38

70
Branch Canal
Water
Productivity
Ratio kg/m3
Yields kg/ha % Change in
2008/
2009
2013/
2014
2008/
2009
2013/
2014
Water
Productivity Yields
Water
Consumption
33 bany helal 1.09 1.25 7124 7646 14.68 7.33 -5.83
34 Arioum 1.08 1.25 6980 7281 15.74 4.31 -10.02
35 el shmarqa 1.1 1.24 6943 7056 12.73 1.63 -10.09
36 el gemeza 1.05 1.22 6735 7265 16.19 7.87 -7.19
37 kom el roz el kadema 1.07 1.25 6952 7220 16.82 3.86 -11.06
38 daqlat 1.07 1.24 6932 7210 15.89 4.01 -9.89
39 bahr nemra 1.13 1.26 6811 6697 11.50 -1.67 -11.46
40 el zawiah 1.06 1.24 6839 7165 16.98 4.77 -10.82
41
ganabiah 6 yosra el
zawia 1.05 1.22 6545 6838 16.19 4.48 -10.11
42 mit yazid4 1.09 1.27 6998 7211 16.51 3.04 -11.08
43 el shoka 1.12 1.32 6780 7268 17.86 7.20 -8.90
44 mit yazid6 1.12 1.34 6204 6751 19.64 8.82 -8.98
45 el zawiah 1.08 1.25 6628 7130 15.74 7.57 -6.99
46 el qahwagi 1.12 1.26 6833 6996 12.50 2.39 -9.61
47 mit yazid1 1.08 1.25 7075 7302 15.74 3.21 -10.53
48
el ganabiah el rabah
right 1.09 1.27 6824 7163 16.51 4.97 -10.49
49
el ganabiah el tanyah &
el taltah 1.08 1.26 6777 7129 16.67 5.19 -10.17
50 el zawiah 1.08 1.26 6670 7029 16.67 5.38 -9.24
51 marsa el gamal 1.08 1.25 6829 7022 15.74 2.83 -11.50
52 el ghabat 1.02 1.25 5903 6893 22.55 16.77 -3.65
53 gnabiet kafr el dawar 1.07 1.22 6774 7334 14.02 8.27 -4.89
54 balaqtar 1.1 1.23 6868 7192 11.82 4.72 -6.40
55 el saarania 1.13 1.24 6646 7402 9.73 11.38 1.18
56 ganabet el saarania 1.09 1.24 6563 7240 13.76 10.32 -3.15
57 ganabet zahra 1.12 1.24 6665 7329 10.71 9.96 -0.33
58 mamal el qazaz 1.09 1.25 6561 7494 14.68 14.22 -0.33
59 louqein 1.12 1.24 6560 7435 10.71 13.34 2.04
60 el berka 1.1 1.24 6644 7532 12.73 13.37 0.00
61 el nasry 1.1 1.24 6633 7583 12.73 14.32 0.99
62 ganabet desones 1.08 1.24 6654 7549 14.81 13.45 -1.78
63 el karoun 1.1 1.25 7069 7603 13.64 7.55 -5.45
64 qafla 1.11 1.26 7028 7542 13.51 7.31 -6.13

71
Branch Canal
Water
Productivity
Ratio kg/m3
Yields kg/ha % Change in
2008/
2009
2013/
2014
2008/
2009
2013/
2014
Water
Productivity Yields
Water
Consumption
65 el akresha 1.04 1.21 6475 7153 16.35 10.47 -3.75
66 kafr azazy 1.09 1.23 6806 7500 12.84 10.20 -2.56
67 boses 1.07 1.23 6893 7146 14.95 3.67 -9.03
68 el admah 1.02 1.24 6276 7229 21.57 15.18 -5.04
69 el misk 1.08 1.25 6819 7375 15.74 8.15 -6.04
70 sidi salim el sharqiah 1.07 1.23 6626 7349 14.95 10.91 -3.07
71 el masharqa 1.09 1.25 6643 7339 14.68 10.48 -3.76
72 shalmah 1.09 1.24 6818 7289 13.76 6.91 -6.21
73 mit yazid3 1.09 1.25 6771 7370 14.68 8.85 -5.29
74 el sefsafa 1.08 1.24 6666 7382 14.81 10.74 -2.76
75 el emdan 1.09 1.23 7210 7226 12.84 0.22 -11.73
76 kom el wahal 1.08 1.24 6898 7157 14.81 3.75 -9.09
77 dail rwena 1.09 1.25 6957 7460 14.68 7.23 -6.86
78 el halafy 1.05 1.24 6384 6972 18.10 9.21 -7.24
79 el zaker 1.09 1.25 6632 6925 14.68 4.42 -10.19
80 ganabiet nazer 1.07 1.25 7093 6966 16.82 -1.79 -15.96
81 el beeda 1.08 1.21 7029 6927 12.04 -1.45 -12.15
82 gnabiet el omraa 1.07 1.22 6692 7242 14.02 8.22 -5.43
83 gnabiet houd el malaha 1.05 1.23 6460 7263 17.14 12.43 -3.90
84 gnabiet aref 1.07 1.26 5795 6598 17.76 13.86 -3.50
85 el montaza 1.07 1.23 5695 6292 14.95 10.48 -4.49
86 el raesyia el qadema 1.1 1.23 6656 6972 11.82 4.75 -6.91
87 el malaha 1.07 1.24 6177 7220 15.89 16.89 1.04
88 el kanobia 1.07 1.25 6966 7610 16.82 9.24 -6.88
89
gnabiet king osman el
bahrya 1.1 1.26 6898 7395 14.55 7.20 -6.69
90 el kalaa 1.06 1.21 6516 7001 14.15 7.44 -5.84
91 abis el gdida 1.06 1.24 6635 7573 16.98 14.14 -2.72
92 maryout 1.13 1.26 6687 7414 11.50 10.87 -0.17
93 khorshed 1.05 1.23 6516 7257 17.14 11.37 -4.05
94 el gharby 1.07 1.21 6371 6951 13.08 9.10 -4.17
95 el karakol 1.09 1.21 5964 6374 11.01 6.87 -4.52
96 abis el qadema 1.06 1.25 7014 7704 17.92 9.84 -6.53

72
APPENDIX C
SUSTAINABILITY OF LAND AND WATER RESOURCES INDICATORS TIME-
SERIES DATA
Branch
Canal Khadeega
Location Head Middle Tail
Date/
Indicator
DO
ratio
Alkaline
ratio
Salinity
ratio
DO
ratio
Alkaline
ratio
Salinity
ratio
DO
ratio
Alkaline
ratio
Salinity
ratio
18/5/08 1.81 1.22 0.44 1.70 1.15 0.55 1.64 1.12 0.55
3/6/08 1.03 1.13 0.47 1.22 1.27 0.39 1.00 1.12 0.44
8/7/08 0.90 1.18 0.45 0.99 1.17 0.46 0.83 1.11 0.47
6/8/08 0.56 1.09 0.56 1.12 1.13 0.49 1.29 1.12 0.64
6/9/08 0.83 1.15 0.51 0.88 1.16 0.51 0.42 1.12 0.53
5/10/08 1.28 1.14 0.50 1.08 1.11 0.52 0.83 1.07 0.52
20/11/08 1.54 1.29 0.58 0.80 1.08 0.72 0.71 1.08 0.94
23/12/08 1.77 1.15 0.52 1.70 1.12 0.52 1.73 1.12 0.51
24/12/08 2.04 1.21 0.58 1.61 1.13 0.59 3.08 1.29 0.51
11/1/09 2.64 1.44 0.64 2.09 1.34 0.69 2.71 1.27 0.74
18/1/09 2.17 1.21 0.56 1.68 1.21 0.62 1.53 1.13 0.68
09/2/3 1.96 1.35 0.56 1.95 1.36 0.58 1.72 1.24 0.63
09/2/8 1.56 1.19 0.61 2.37 1.44 0.66 1.95 1.27 0.60
09/3/2 1.56 1.16 0.56 1.33 1.17 0.61 1.20 1.18 0.61
09/3/16 2.40 1.30 0.50 1.75 1.17 0.57 1.88 1.20 0.55
09/4/6 1.97 1.25 0.50 1.64 1.18 0.54 1.62 1.17 0.55
09/5/13 2.05 1.46 0.36 0.88 1.12 0.67 1.30 1.26 0.47
09/5/20 1.52 1.17 0.44 0.85 1.07 0.86 1.31 1.09 0.67
09/5/13 2.05 1.46 0.36 0.88 1.12 0.67 1.30 1.26 0.47
09/5/20 1.52 1.17 0.44 0.85 1.07 0.86 1.31 1.09 0.67
09/6/3 1.36 1.21 0.42 1.20 1.18 0.53 0.80 1.14 0.96
09/6/14 1.23 1.23 0.44 1.13 1.18 0.43 1.00 1.19 0.46
09/7/14 1.34 1.29 0.42 0.99 1.18 0.62 0.70 1.14 0.64
09/7/18 0.89 1.10 0.46 1.17 1.27 0.45 0.75 1.10 0.51
09/8/4 1.04 1.19 0.45 0.78 1.14 0.90 0.91 1.17 0.80
09/8/18 0.96 1.20 0.48 1.05 1.25 0.44 0.35 1.19 0.50
09/9/2 0.95 1.10 0.51 1.17 1.11 0.50 0.93 1.05 0.61
09/9/13 1.03 1.18 0.54 0.45 1.12 0.58 0.98 1.14 0.57
09/10/5 1.33 1.21 0.55 0.77 1.08 0.62 0.85 1.08 0.58
09/10/17 1.06 1.20 0.51 0.84 1.05 0.85 0.64 1.00 0.70
09/11/18 1.41 1.31 0.49 1.35 1.26 0.53 1.43 1.29 0.56
09/11/24 0.98 1.13 0.58 1.12 1.11 0.59 1.04 1.07 0.73
09/12/8 1.08 1.12 0.64 1.08 1.11 0.65 1.18 1.05 0.69
09/12/24 0.99 0.74 0.65 1.03 1.04 0.67 1.09 1.07 0.74
10/1/5 1.39 1.18 0.80 1.11 1.09 0.72 1.09 1.04 0.77
10/1/16 1.29 1.28 0.64 1.15 1.18 0.68 1.03 1.03 0.88
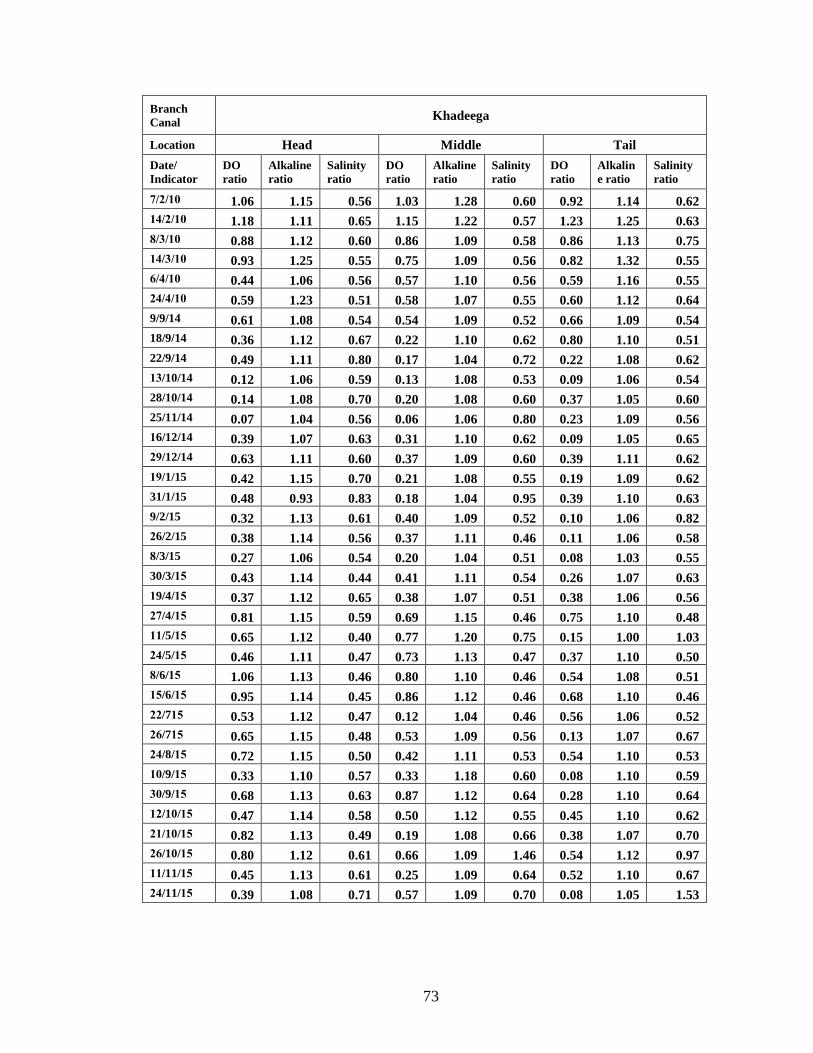
73
Branch
Canal Khadeega
Location Head Middle Tail
Date/
Indicator
DO
ratio
Alkaline
ratio
Salinity
ratio
DO
ratio
Alkaline
ratio
Salinity
ratio
DO
ratio
Alkalin
e ratio
Salinity
ratio
10/2/7 1.06 1.15 0.56 1.03 1.28 0.60 0.92 1.14 0.62
10/2/14 1.18 1.11 0.65 1.15 1.22 0.57 1.23 1.25 0.63
10/3/8 0.88 1.12 0.60 0.86 1.09 0.58 0.86 1.13 0.75
10/3/14 0.93 1.25 0.55 0.75 1.09 0.56 0.82 1.32 0.55
10/4/6 0.44 1.06 0.56 0.57 1.10 0.56 0.59 1.16 0.55
10/4/24 0.59 1.23 0.51 0.58 1.07 0.55 0.60 1.12 0.64
9/9/14 0.61 1.08 0.54 0.54 1.09 0.52 0.66 1.09 0.54
18/9/14 0.36 1.12 0.67 0.22 1.10 0.62 0.80 1.10 0.51
22/9/14 0.49 1.11 0.80 0.17 1.04 0.72 0.22 1.08 0.62
13/10/14 0.12 1.06 0.59 0.13 1.08 0.53 0.09 1.06 0.54
28/10/14 0.14 1.08 0.70 0.20 1.08 0.60 0.37 1.05 0.60
25/11/14 0.07 1.04 0.56 0.06 1.06 0.80 0.23 1.09 0.56
16/12/14 0.39 1.07 0.63 0.31 1.10 0.62 0.09 1.05 0.65
29/12/14 0.63 1.11 0.60 0.37 1.09 0.60 0.39 1.11 0.62
19/1/15 0.42 1.15 0.70 0.21 1.08 0.55 0.19 1.09 0.62
31/1/15 0.48 0.93 0.83 0.18 1.04 0.95 0.39 1.10 0.63
9/2/15 0.32 1.13 0.61 0.40 1.09 0.52 0.10 1.06 0.82
26/2/15 0.38 1.14 0.56 0.37 1.11 0.46 0.11 1.06 0.58
8/3/15 0.27 1.06 0.54 0.20 1.04 0.51 0.08 1.03 0.55
30/3/15 0.43 1.14 0.44 0.41 1.11 0.54 0.26 1.07 0.63
19/4/15 0.37 1.12 0.65 0.38 1.07 0.51 0.38 1.06 0.56
27/4/15 0.81 1.15 0.59 0.69 1.15 0.46 0.75 1.10 0.48
11/5/15 0.65 1.12 0.40 0.77 1.20 0.75 0.15 1.00 1.03
24/5/15 0.46 1.11 0.47 0.73 1.13 0.47 0.37 1.10 0.50
8/6/15 1.06 1.13 0.46 0.80 1.10 0.46 0.54 1.08 0.51
15/6/15 0.95 1.14 0.45 0.86 1.12 0.46 0.68 1.10 0.46
22/715 0.53 1.12 0.47 0.12 1.04 0.46 0.56 1.06 0.52
26/715 0.65 1.15 0.48 0.53 1.09 0.56 0.13 1.07 0.67
24/8/15 0.72 1.15 0.50 0.42 1.11 0.53 0.54 1.10 0.53
10/9/15 0.33 1.10 0.57 0.33 1.18 0.60 0.08 1.10 0.59
30/9/15 0.68 1.13 0.63 0.87 1.12 0.64 0.28 1.10 0.64
12/10/15 0.47 1.14 0.58 0.50 1.12 0.55 0.45 1.10 0.62
21/10/15 0.82 1.13 0.49 0.19 1.08 0.66 0.38 1.07 0.70
26/10/15 0.80 1.12 0.61 0.66 1.09 1.46 0.54 1.12 0.97
11/11/15 0.45 1.13 0.61 0.25 1.09 0.64 0.52 1.10 0.67
24/11/15 0.39 1.08 0.71 0.57 1.09 0.70 0.08 1.05 1.53

74
Branch
Canal Dakkalt
Location Head Middle Tail
Date/
Indicator
DO
ratio
Alkalin
e ratio
Salinity
ratio
DO
ratio
Alkaline
ratio
Salinity
ratio
DO
ratio
Alkalin
e ratio
Salinity
ratio
29/5/08 1.15 1.23 0.42 1.34 1.21 0.41 1.10 1.11 0.74
2/6/08 1.05 1.10 0.42 1.15 1.13 0.43 0.88 1.11 0.98
3/7/08 1.12 1.09 0.48 1.11 1.08 0.48 1.41 1.13 0.61
4/8/08 1.22 1.06 0.40 1.11 1.09 0.47 1.05 1.10 0.75
2/9/08 0.95 1.13 0.50 1.00 1.13 0.49 0.67 1.08 0.53
4/10/08 1.10 1.13 0.86 1.05 1.04 0.56 0.91 1.01 0.57
4/11/08 1.04 1.11 0.57 0.89 1.07 0.66 0.93 1.05 0.66
1/12/08 1.52 1.22 0.61 1.32 1.17 0.65 1.27 1.14 0.68
21/12/08 2.14 1.26 0.55 1.81 1.15 0.57 1.77 1.14 0.89
4/1/09 2.12 1.19 0.64 1.66 1.14 0.67 1.51 1.06 0.88
13/1/09 2.91 1.30 0.54 3.37 1.33 0.60 0.64 0.98 0.80
2009/2/7 2.13 1.32 0.57 1.49 1.19 0.62 1.80 1.19 0.62
09/2/15 2.00 1.23 0.60 1.66 1.19 0.74 1.29 1.14 0.68
09/3/3 1.69 1.21 0.57 1.46 1.18 0.69 1.48 1.17 0.65
09/3/14 2.19 1.30 0.57 1.91 1.19 0.68 2.05 1.30 1.05
09/4/8 1.77 1.21 0.51 1.70 1.16 0.66 1.85 1.15 0.61
09/4/21 1.65 1.35 0.43 1.85 1.34 0.47 1.92 1.32 0.47
09/5/13 1.32 1.18 0.47 1.22 1.17 0.52 1.24 1.16 0.56
09/5/20 1.09 1.06 0.45 0.86 1.04 0.52 1.21 1.05 0.77
09/6/1 1.46 1.20 0.45 1.72 1.31 0.45 1.27 1.19 0.74
09/6/21 1.34 1.29 0.40 1.33 1.33 0.39 1.06 1.23 0.70
09/7/13 1.13 1.35 0.44 1.16 1.29 0.47 1.19 1.39 0.50
09/7/20 0.83 1.15 0.44 0.82 1.13 0.46 0.76 1.13 0.76
09/8/3 0.84 1.16 0.46 0.78 1.15 0.46 0.91 1.21 0.50
09/8/13 1.33 1.24 0.48 1.34 1.25 0.48 1.16 1.17 0.61
09/9/8 0.95 1.06 0.54 0.69 1.08 0.54 0.47 1.04 0.64
09/9/28 1.13 1.26 0.56 0.57 1.23 0.61 0.77 1.10 0.76
09/10/4 1.34 1.22 0.56 1.04 1.17 0.56 1.14 1.15 0.65
09/10/27 1.08 1.20 0.57 1.12 1.21 0.66 1.25 1.21 1.02
09/11/23 1.08 1.10 0.60 1.12 1.17 0.66 1.18 1.20 0.68
09/12/2 0.88 1.09 0.63 0.98 1.12 0.65 0.96 1.09 0.71

75
Branch
Canal Dakkalt
Location Head Middle Tail
Date/
Indicator
DO
ratio
Alkalin
e ratio
Salinity
ratio
DO
ratio
Alkaline
ratio
Salinity
ratio
DO
ratio
Alkalin
e ratio
Salinity
ratio
09/12/23 1.40 1.28 0.68 1.60 1.31 0.58 1.40 1.19 0.73
10/1/3 1.32 1.10 0.82 1.45 1.19 0.68 1.49 1.21 0.80
10/1/12 0.95 1.17 0.66 1.16 1.23 0.69 1.15 1.16 0.61
10/2/2 0.83 1.09 0.64 0.93 1.16 0.61 0.84 1.07 0.76
10/2/13 0.97 1.19 0.61 0.90 1.08 0.65 0.85 1.08 0.71
10/3/4 0.78 1.09 0.60 1.03 1.37 0.60 0.84 1.08 0.69
10/3/13 1.03 1.36 0.49 0.91 1.22 0.68 0.80 1.08 0.83
10/4/7 0.92 1.37 0.52 0.79 1.10 0.59 0.64 1.07 0.69
10/4/22 0.65 1.28 0.43 0.66 1.10 0.60 0.60 1.11 0.70
10/5/8 0.60 1.33 0.43 0.55 1.22 0.50 0.53 1.17 0.72
10/5/15 0.50 1.37 0.40 0.46 1.26 0.49 0.44 1.17 0.75
10/6/8 1.21 1.23 0.46 1.21 1.25 0.49 0.81 1.06 0.78
10/8/1 1.26 1.13 0.50 1.10 1.09 0.52 0.98 1.13 1.29
10/8/9 1.36 1.20 0.68 1.22 1.14 0.54 0.78 1.04 0.66
10/8/15 1.33 1.23 0.49 1.31 1.23 0.51 1.02 1.10 1.44
10/8/22 1.17 1.10 0.52 1.09 1.08 0.55 1.03 1.08 0.57
10/9/5 0.84 1.14 0.52 0.76 1.07 0.57 0.69 1.06 0.72
10/9/20 0.77 1.13 0.55 0.69 1.09 0.65 0.48 1.03 0.67
10/10/4 1.46 1.17 0.59 1.02 1.08 0.63 1.09 1.07 0.97
10/10/26 1.46 1.23 0.62 1.61 1.24 0.61 1.50 1.23 0.62
10/11/2 1.02 1.14 0.56 0.88 1.08 0.61 0.46 1.04 0.69
10/12/4 0.83 1.19 0.51 0.77 1.13 0.61 0.81 1.09 0.55
10/12/14 0.69 1.29 0.54 0.66 1.24 0.70 0.55 1.15 0.64
26/08/14 0.95 1.17 0.66 0.61 1.09 0.61 0.60 1.03 0.67
2/9/14 0.61 1.11 0.52 0.47 1.10 0.51 0.37 1.09 0.57
10/9/14 0.64 1.09 0.56 0.52 1.07 0.59 0.49 1.05 0.70
24/9/14 0.58 1.12 0.68 0.40 1.08 0.70 0.33 1.09 0.85
28/9/14 0.58 1.12 0.63 0.41 1.09 0.60 0.45 1.09 1.01
15/10/14 0.28 1.10 0.65 0.19 1.07 0.81 0.14 1.08 0.71
22/11/14 0.36 1.14 0.58 0.39 1.08 0.57 0.41 1.08 0.62

76
Branch
Canal Dakkalt
Location Head Middle Tail
Date/
Indicator
DO
ratio
Alkaline
ratio
Salinity
ratio
DO
ratio
Alkaline
ratio
Salinity
ratio
DO
ratio
Alkaline
ratio
Salinity
ratio
10/12/14 0.17 1.07 0.60 0.08 1.08 0.75 0.07 1.07 0.67
22/12/14 0.43 1.13 0.66 0.40 1.09 0.63 0.22 1.08 0.60
15/1/15 0.17 1.08 0.55 0.21 1.09 0.54 0.14 1.07 1.04
20/1/15 0.09 1.08 0.55 0.10 1.07 0.73 0.08 1.07 0.73
30/1/15 0.46 1.09 0.72 0.42 1.10 0.96 0.41 1.07 0.72
9/2/15 0.22 1.10 0.51 0.13 0.87 0.46 0.10 1.06 1.13
16/2/15 0.57 1.08 0.51 0.34 1.00 0.84 0.17 1.08 0.68
24/2/15 0.46 1.12 0.48 0.37 1.11 0.54 0.39 1.11 0.53
1/3/15 0.48 1.11 0.52 0.41 1.09 0.79 0.38 1.09 0.56
16/3/15 0.46 1.10 0.49 0.34 1.06 0.58 0.34 1.07 0.72
8/4/15 0.09 1.08 0.53 0.08 1.05 0.74 0.07 1.06 0.69
26/4/15 0.69 1.10 0.49 0.28 1.05 0.52 0.40 1.07 0.75
18/5/15 0.72 1.13 0.48 0.47 1.11 0.49 0.49 1.13 0.57
21/6/15 0.96 1.10 0.44 0.80 1.11 0.48 0.42 1.11 1.01
28/6/15 0.78 1.13 0.48 0.48 1.07 0.66 0.42 1.07 1.03
5/7/15 0.85 1.14 0.44 0.64 1.12 0.49 0.82 1.15 0.49
27/7/15 0.67 1.11 0.47 0.61 1.11 0.52 0.60 1.10 0.58
4/8/15 0.60 1.15 0.48 0.15 1.06 0.67 0.19 1.06 0.63
23/8/15 0.51 1.14 0.50 0.34 1.14 0.51 0.08 1.10 1.01
3/9/15 0.17 1.10 0.55 0.25 1.10 0.55 0.51 1.10 0.59
29/9/15 0.62 1.13 0.56 0.63 1.12 0.57 0.66 1.11 0.59
12/1015 0.56 1.13 0.62 0.49 1.13 0.75 0.32 1.18 0.68
26/10/15 0.65 1.13 0.55 0.48 1.08 0.73 0.12 1.07 1.00
28/10/15 0.56 1.11 0.54 0.51 1.09 0.73 0.13 1.05 0.90
10/11/15 0.61 1.12 0.70 0.48 1.10 0.77 0.50 1.09 0.66
24/11/15 0.62 1.09 0.67 0.28 1.08 0.81 0.27 1.06 0.65
15/12/15 0.96 1.15 0.53 0.82 1.10 0.72 0.37 1.09 0.64
21/12/5 0.88 1.18 0.58 0.58 1.12 0.81 0.52 1.10 0.79
27/1/16 0.92 1.13 0.64 0.76 1.10 0.71 0.05 1.10 0.81
29/2/16 0.54 1.09 0.53 0.17 1.09 0.98 0.72 1.09 0.90
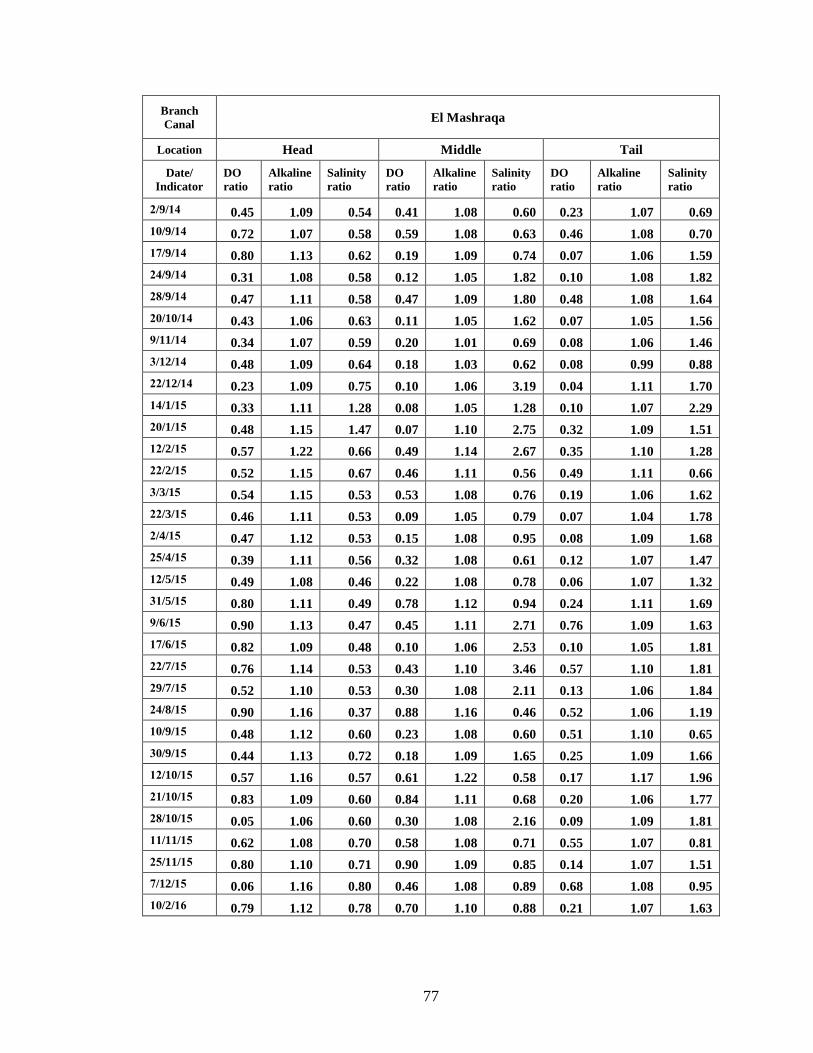
77
Branch
Canal El Mashraqa
Location Head Middle Tail
Date/
Indicator
DO
ratio
Alkaline
ratio
Salinity
ratio
DO
ratio
Alkaline
ratio
Salinity
ratio
DO
ratio
Alkaline
ratio
Salinity
ratio
2/9/14 0.45 1.09 0.54 0.41 1.08 0.60 0.23 1.07 0.69
10/9/14 0.72 1.07 0.58 0.59 1.08 0.63 0.46 1.08 0.70
17/9/14 0.80 1.13 0.62 0.19 1.09 0.74 0.07 1.06 1.59
24/9/14 0.31 1.08 0.58 0.12 1.05 1.82 0.10 1.08 1.82
28/9/14 0.47 1.11 0.58 0.47 1.09 1.80 0.48 1.08 1.64
20/10/14 0.43 1.06 0.63 0.11 1.05 1.62 0.07 1.05 1.56
9/11/14 0.34 1.07 0.59 0.20 1.01 0.69 0.08 1.06 1.46
3/12/14 0.48 1.09 0.64 0.18 1.03 0.62 0.08 0.99 0.88
22/12/14 0.23 1.09 0.75 0.10 1.06 3.19 0.04 1.11 1.70
14/1/15 0.33 1.11 1.28 0.08 1.05 1.28 0.10 1.07 2.29
20/1/15 0.48 1.15 1.47 0.07 1.10 2.75 0.32 1.09 1.51
12/2/15 0.57 1.22 0.66 0.49 1.14 2.67 0.35 1.10 1.28
22/2/15 0.52 1.15 0.67 0.46 1.11 0.56 0.49 1.11 0.66
3/3/15 0.54 1.15 0.53 0.53 1.08 0.76 0.19 1.06 1.62
22/3/15 0.46 1.11 0.53 0.09 1.05 0.79 0.07 1.04 1.78
2/4/15 0.47 1.12 0.53 0.15 1.08 0.95 0.08 1.09 1.68
25/4/15 0.39 1.11 0.56 0.32 1.08 0.61 0.12 1.07 1.47
12/5/15 0.49 1.08 0.46 0.22 1.08 0.78 0.06 1.07 1.32
31/5/15 0.80 1.11 0.49 0.78 1.12 0.94 0.24 1.11 1.69
9/6/15 0.90 1.13 0.47 0.45 1.11 2.71 0.76 1.09 1.63
17/6/15 0.82 1.09 0.48 0.10 1.06 2.53 0.10 1.05 1.81
22/7/15 0.76 1.14 0.53 0.43 1.10 3.46 0.57 1.10 1.81
29/7/15 0.52 1.10 0.53 0.30 1.08 2.11 0.13 1.06 1.84
24/8/15 0.90 1.16 0.37 0.88 1.16 0.46 0.52 1.06 1.19
10/9/15 0.48 1.12 0.60 0.23 1.08 0.60 0.51 1.10 0.65
30/9/15 0.44 1.13 0.72 0.18 1.09 1.65 0.25 1.09 1.66
12/10/15 0.57 1.16 0.57 0.61 1.22 0.58 0.17 1.17 1.96
21/10/15 0.83 1.09 0.60 0.84 1.11 0.68 0.20 1.06 1.77
28/10/15 0.05 1.06 0.60 0.30 1.08 2.16 0.09 1.09 1.81
11/11/15 0.62 1.08 0.70 0.58 1.08 0.71 0.55 1.07 0.81
25/11/15 0.80 1.10 0.71 0.90 1.09 0.85 0.14 1.07 1.51
7/12/15 0.06 1.16 0.80 0.46 1.08 0.89 0.68 1.08 0.95
10/2/16 0.79 1.12 0.78 0.70 1.10 0.88 0.21 1.07 1.63

78
Branch
Canal Bahr Semalla
Location Head Middle Tail
Date/
Indicator
DO
ratio
Alkaline
ratio
Salinity
ratio
DO
ratio
Alkaline
ratio
Salinity
ratio
DO
ratio
Alkaline
ratio
Salinity
ratio
10/5/08 3.19 1.25 0.38 2.57 1.10 0.44 2.47 1.06 0.45
1/6/08 1.11 1.24 0.37 1.01 1.17 0.40 0.93 1.10 0.44
13 / 7/ 08 1.60 1.26 0.33 1.83 1.29 0.28 0.96 1.16 0.41
3/8/08 0.92 1.06 0.39 0.70 1.05 1.27 1.22 1.06 0.42
3/9/08 1.25 1.24 0.39 0.66 1.11 0.43 1.31 1.21 0.42
7/10/08 0.91 1.19 0.44 0.71 1.15 0.47 0.81 1.15 0.46
13/12/08 2.02 1.35 0.43 1.08 1.14 0.51 1.82 1.35 0.48
16/12/08 2.45 1.34 0.46 2.38 1.33 0.48 2.46 1.34 0.47
23/12/08 1.67 1.12 0.57 1.47 1.11 0.60 1.65 1.14 0.61
10/1/09 2.01 1.20 0.54 2.10 1.10 0.53 1.94 1.05 0.56
3/2/09 1.85 1.17 0.52 1.99 1.28 0.51 1.77 1.24 0.54
16/2/09 2.07 1.23 0.47 2.00 1.22 0.49 2.11 1.21 0.49
8/3/09 1.75 1.13 0.43 1.59 1.12 0.44 2.10 1.10 0.45
21/3/09 1.77 1.27 0.44 1.86 1.30 0.45 1.88 1.26 0.45
26/3/09 1.95 1.26 0.41 1.80 1.23 0.45 1.96 1.23 0.46
1/4/09 1.85 1.20 0.42 1.90 1.17 0.42 1.72 1.16 0.47
19/4/09 1.39 1.19 0.43 1.60 1.19 0.45 1.17 1.07 0.47
02/5/09 1.75 1.27 0.51 1.67 1.27 0.45 1.37 1.16 0.47
13/5/09 1.54 1.32 0.38 1.08 1.21 0.43 1.35 1.21 0.44
04/6/09 1.39 1.09 0.47 1.21 1.07 0.40 1.28 1.07 0.48
14/6/09 1.29 1.19 0.37 1.36 1.25 0.35 1.33 1.24 1.01
01/7/09 1.02 1.09 0.41 0.55 1.06 1.06 0.46 1.03 1.12
11/7/09 0.94 1.13 0.40 1.07 1.15 0.40 1.11 1.16 0.44
01/8/09 1.43 1.31 0.37 1.31 1.22 0.39 1.02 1.17 0.45
15/8/09 1.13 1.15 0.38 1.11 1.14 0.41 1.08 1.14 0.43
05/9/09 0.66 1.04 0.41 0.66 1.03 0.43 0.69 1.03 0.44
23/9/09 0.86 1.11 0.49 0.77 1.10 0.55 0.79 1.07 0.52
07/10/09 1.09 1.17 0.49 1.06 1.17 0.51 1.00 1.18 0.49
28/10/09 1.19 1.26 0.46 1.00 1.19 0.51 1.05 1.18 0.54
18/11/09 1.09 1.14 0.50 1.05 1.14 0.50 0.92 1.10 0.51
15/12/09 1.38 1.14 0.62 1.43 1.16 0.60 1.39 1.15 0.57
31/12/09 1.17 1.11 0.59 1.23 1.18 0.58 1.13 1.11 0.62
02/1/10 2.14 1.34 0.54 1.58 1.16 0.58 1.18 1.08 0.64
11/1/10 1.38 1.28 0.59 1.21 1.25 0.52 1.21 1.12 0.55
03/2/10 0.99 1.24 0.51 0.99 1.14 0.55 0.98 1.13 0.60
23/2/10 1.04 1.12 0.50 0.96 1.12 0.52 1.00 1.12 0.49
08/3/10 1.01 1.14 0.46 0.98 1.37 0.40 0.94 1.32 0.46
16/3/10 1.09 1.32 0.43 1.01 1.11 0.47 1.11 1.41 0.40
07/4/10 0.73 1.09 0.46 0.73 1.04 0.63 0.79 1.18 0.56
17/4/10 1.02 1.23 0.46 0.90 1.15 0.48 0.89 1.21 0.45

79
Branch
Canal Bahr Semalla
Location Head Middle Tail
Date/
Indicator
DO
ratio
Alkaline
ratio
Salinity
ratio
DO
ratio
Alkaline
ratio
Salinity
ratio
DO
ratio
Alkaline
ratio
Salinity
ratio
05/5/10 0.47 1.19 0.44 0.47 1.21 0.44 0.47 1.17 0.47
29/5/10 0.62 1.04 0.99 0.61 1.07 0.97 0.57 1.04 0.97
22/6/10 0.94 1.11 0.42 0.94 1.06 0.45 0.78 1.07 0.49
30/6/10 1.36 1.19 0.38 1.38 1.20 0.39 1.01 1.12 0.45
04/7/10 1.04 1.15 0.38 0.86 1.08 0.42 1.05 1.09 0.42
14/7/10 1.55 1.18 0.44 1.55 1.15 0.46 1.57 1.28 0.39
10/8/10 1.41 1.29 0.38 1.17 1.12 0.43 1.13 1.11 0.44
21/8/10 1.51 1.29 0.38 1.15 1.16 0.45 0.88 1.07 0.56
02/9/10 0.91 1.10 0.44 0.84 1.11 0.42 0.77 1.09 0.47
13/9/10 1.53 1.12 0.48 1.58 1.19 0.46 1.09 1.06 0.69
30/9/10 0.52 1.07 0.60 0.60 1.09 0.67 0.59 1.08 0.68
02/10/10 0.62 1.15 0.52 0.43 1.07 0.58 0.45 1.05 0.56
17/10/10 2.11 1.18 0.51 2.10 1.15 0.54 2.02 1.06 0.72
01/11/10 1.08 1.14 0.42 0.96 1.14 0.48 0.88 1.12 0.45
01/12/10 1.12 1.29 0.47 0.58 1.07 0.56 1.16 1.29 0.50
16/1210 0.54 1.25 0.46 0.54 1.25 0.49 0.50 1.18 0.49
9/9/14 0.61 1.09 0.45 0.35 1.06 0.52 0.48 1.07 0.54
18/9/14 0.63 0.94 0.45 0.62 1.00 0.44 0.50 0.99 0.50
22/9/14 0.56 1.05 0.64 0.26 1.08 0.65 0.26 1.07 0.58
13/10/14 0.15 1.09 0.50 0.17 1.08 0.52 0.10 1.06 0.58
28/10/14 0.14 1.06 0.48 0.29 1.06 0.49 0.12 0.94 0.54
16/12/14 0.29 1.12 0.52 0.34 1.12 0.52 0.27 1.10 0.57
29/12/14 0.14 1.07 0.56 0.07 1.06 0.81 0.08 1.05 1.06
19/1/15 0.37 1.08 0.45 0.28 1.04 0.48 0.28 1.06 0.50
31/1/15 0.26 0.99 0.48 0.32 1.01 0.53 0.19 1.02 0.60
9/2/15 0.27 1.10 0.47 0.42 1.12 4.82 0.24 1.11 0.52
26/2/15 0.30 1.10 0.42 0.42 1.10 0.42 0.40 1.03 0.43
8/3/15 0.32 1.12 0.43 0.10 1.04 0.58 0.04 1.03 0.67
30/3/15 0.20 1.09 0.43 0.35 1.10 0.43 0.26 1.09 0.44
19/4/15 0.30 1.11 0.43 0.23 1.09 0.45 0.27 1.09 0.46
27/4/15 0.58 1.11 0.44 0.60 1.10 0.44 0.44 1.10 0.45
11/5/15 0.41 1.09 0.40 0.46 1.10 0.41 0.26 1.07 0.42
24/5/15 0.64 1.12 0.43 0.75 1.10 0.43 0.58 1.10 0.45
8/6/15 0.85 1.11 0.43 0.66 1.09 1.10 0.72 1.09 1.24
15/6/15 0.75 1.12 0.42 0.70 1.09 0.56 0.54 1.08 0.52
22/7/15 0.54 1.08 0.49 0.40 1.09 0.45 0.54 1.09 0.45
26/7/15 0.49 1.13 0.46 0.54 1.11 0.68 0.43 1.09 0.66
24/8/15 0.55 1.15 0.45 0.58 1.14 0.44 0.55 1.13 0.45
10/9/15 0.52 1.11 0.48 0.61 1.12 0.49 0.57 1.12 0.50
30/9/15 0.48 1.11 0.56 0.71 1.11 0.56 0.75 1.11 0.60
12/10/15 0.31 1.10 0.53 0.26 1.07 0.65 0.21 1.07 0.89
21/10/15 0.28 1.09 0.50 0.06 1.08 0.65 0.14 1.06 0.54
26/10/15 0.62 1.14 0.49 0.45 1.11 0.67 0.49 1.08 0.78
11/11/15 0.46 1.10 0.50 0.47 1.11 0.48 0.53 1.10 0.56
24/11/15 0.49 1.08 0.62 0.17 1.07 0.62 0.09 1.07 0.78

80
APPENDIX D
WATER STRESS INDICATOR FOR WHEAT
Branch Canal
Relative Evapotranspiration
Ratio %Change in
RET
2008/ 2009 2013/ 2014
1 khadiga 0.940 0.953 1.40
2 neshil el kadima 0.960 0.941 -1.95
3 neshil el gdeda 0.957 0.949 -0.82
4 el sheikha 0.949 0.952 0.38
5 waslet neshil 0.935 0.936 0.11
6 ganabiah 2,3,4,&5 0.971 0.954 -1.70
7 mit yazid 0.969 0.956 -1.35
8 duplicate name 0.975 0.950 -2.53
9 mit yazid 2 0.935 0.959 2.54
10 kom el roz el gdeda 0.982 0.967 -1.52
11 bahr semella 0.959 0.941 -1.81
12 nekla 0.993 0.985 -0.73
13 hamad minsy 0.974 0.985 1.09
14 ganabiet el babli 0.990 0.981 -0.88
15 zarqoun el sharqia 0.973 0.986 1.35
16 gnabiet kafr sobrakhit 0.989 0.990 0.06
17 el hakem 0.970 0.986 1.64
18 ganabiet el nasry 0.968 0.981 1.36
19 kafr elrhmania 0.999 0.982 -1.67
20 rayah zarkqon 0.974 0.987 1.26
21 ezab el awqaf 0.968 0.987 1.94
22 el nakhla 0.957 0.990 3.49
23 el herfa 0.966 0.986 2.07
24 el hammamy 0.966 0.991 2.54
25 bisntway 0.972 0.990 1.82
26 ganabiet sahaly 0.978 0.988 1.08
27 el rezqa 0.969 0.989 2.11
28 el qenawia 0.954 0.989 3.75
29 sahaly 0.973 0.988 1.48
30 el garadat 0.958 0.986 2.91
31 el qarawy 0.978 0.989 1.10
32 ganabiet hamad minsy 0.973 0.984 1.10
33 bany helal 0.968 0.982 1.41
34 Arioum 0.974 0.964 -1.11
35 el shmarqa 0.970 0.951 -2.03
36 el gemeza 0.987 0.963 -2.42
37 kom el roz el kadema 0.978 0.960 -1.89
38 daqlat 0.976 0.963 -1.38
39 bahr nemra 0.965 0.936 -2.97
40 el zawiah 0.981 0.958 -2.35
41 ganabiah 6 yosra el zawia 0.978 0.945 -3.31

81
Branch Canal
Relative Evapotranspiration
Ratio %Change in
RET
2008/ 2009 2013/ 2014
42 mit yazid4 0.971 0.963 -0.87
43 el shoka 0.968 0.959 -0.88
44 mit yazid6 0.956 0.950 -0.69
45 el zawiah 0.966 0.959 -0.73
46 el qahwagi 0.967 0.947 -2.02
47 mit yazid1 0.975 0.962 -1.26
48 el ganabiah el rabah right 0.971 0.940 -3.21
49 el ganabiah el tanyah & el taltah 0.976 0.952 -2.47
50 el zawiah 0.970 0.952 -1.85
51 marsa el gamal 0.976 0.946 -3.06
52 el ghabat 0.982 0.950 -3.26
53 gnabiet kafr el dawar 0.966 0.990 2.45
54 balaqtar 0.946 0.991 4.73
55 el saarania 0.958 0.989 3.28
56 ganabet el saarania 0.958 0.990 3.27
57 ganabet zahra 0.958 0.989 3.17
58 mamal el qazaz 0.939 0.990 5.38
59 louqein 0.937 0.990 5.65
60 el berka 0.953 0.990 3.85
61 el nasry 0.965 0.990 2.62
62 ganabet desones 0.952 0.990 4.00
63 el karoun 0.972 0.988 1.64
64 qafla 0.961 0.989 3.00
65 el akresha 0.966 0.990 2.53
66 kafr azazy 0.958 0.989 3.25
67 boses 0.977 0.961 -1.62
68 el admah 0.995 0.971 -2.39
69 el misk 0.965 0.964 -0.11
70 sidi salim el sharqiah 0.964 0.972 0.78
71 el masharqa 0.961 0.972 1.04
72 shalmah 0.969 0.965 -0.31
73 mit yazid3 0.965 0.971 0.57
74 el sefsafa 0.963 0.974 1.12
75 el emdan 0.976 0.968 -0.80
76 kom el wahal 0.973 0.964 -0.97
77 dail rwena 0.965 0.969 0.47
78 el halafy 0.981 0.948 -3.29
79 el zaker 0.980 0.944 -3.61
80 ganabiet nazer 0.975 0.984 0.89
81 el beeda 0.971 0.989 1.81
82 gnabiet el omraa 0.966 0.989 2.29

82
Branch Canal
Relative Evapotranspiration
Ratio %Change in
RET
2008/ 2009 2013/ 2014
83 gnabiet houd el malaha 0.948 0.963 1.48
84 gnabiet aref 0.955 0.958 0.23
85 el montaza 0.945 0.914 -3.09
86 el raesyia el qadema 0.972 0.989 1.71
87 el malaha 0.973 0.987 1.43
88 el kanobia 0.971 0.989 1.78
89 gnabiet king osman el bahrya 0.970 0.989 1.80
90 el kalaa 0.964 0.982 1.74
91 abis el gdida 0.972 0.991 1.85
92 maryout 0.981 0.972 -0.94
93 khorshed 0.963 0.983 1.99
94 el gharby 0.956 0.956 -0.02
95 el karakol 0.959 0.973 1.40
96 abis el qadema 0.975 0.989 1.39

83
APPENDIX E
SHAPIRO- WILK TEST RESULTS
Sample/ Indicator Test Result
2008/2009 2013/2014
Water Productivity Ratio Reject Normality Reject Normality
Yields Reject Normality Reject Normality
Water Consumption Reject Normality Reject Normality
Relative Evapotranspiration Ratio Reject Normality Reject Normality
Sample Test Result
2008/2009 2013/2014
Indicator/ Location Head Middle Tail Head Middle Tail
Water Productivity
Ratio
Reject
Normality
Accept
Normality
Accept
Normality
Reject
Normality
Reject
Normality
Reject
Normality
Yields Accept
Normality
Reject
Normality
Accept
Normality
Accept
Normality
Accept
Normality
Reject
Normality
Relative
Evapotranspiration
Ratio
Accept
Normality
Accept
Normality
Accept
Normality
Reject
Normality
Reject
Normality
Reject
Normality
%Change in Water
Productivity - - -
Accept
Normality
Accept
Normality
Accept
Normality
%Change in Yields - - - Accept
Normality
Accept
Normality
Accept
Normality
Sample Test Result
2008/2009 2013/2014
Indictor/ Improvement
Status
Improved Unimproved Improved Unimproved
Water Productivity Ratio Accept
Normality
Reject
Normality
Reject
Normality
Accept
Normality
Yields Accept
Normality
Reject
Normality
Reject
Normality
Reject
Normality
Relative
Evapotranspiration Ratio
Reject
Normality
Accept
Normality
Reject
Normality
Accept
Normality
%Change in Water
Productivity - - Accept
Normality
Accept
Normality
%Change in Yields - - Accept
Normality
Accept
Normality

84
Sample
Test Result
Improved Canals
2008/2009 2013/2014
Indicator/ Location Head Middle Tail Head Middle Tail
Water Productivity
Ratio Accept
Normality
Accept
Normality
Reject
Normality
Accept
Normality
Reject
Normality
Accept
Normality
Yields Accept
Normality
Accept
Normality
Accept
Normality
Accept
Normality
Accept
Normality
Accept
Normality
Relative
Evapotranspiration
Ratio Accept
Normality
Accept
Normality
Accept
Normality
Reject
Normality
Reject
Normality
Accept
Normality
%Change in Water
Productivity - - -
Accept
Normality
Accept
Normality
Accept
Normality
%Change in Yields - - - Accept
Normality
Accept
Normality
Accept
Normality
Indicator Branch Canal Test Result
Head Middle Tail
Dissolved
Oxygen Ratio
Khadeega Reject Normality Reject Normality Reject Normality
Dakkalt Reject Normality Reject Normality Reject Normality
El Mashraqa Accept
Normality Reject Normality Reject Normality
Bahr Semalla Reject Normality Reject Normality Reject Normality
Alkaline Ratio
Khadeega Reject Normality Reject Normality Reject Normality
Dakkalt Reject Normality Reject Normality Reject Normality
El Mashraqa Accept
Normality Reject Normality Reject Normality
Bahr Semalla Reject Normality Reject Normality Reject Normality
Salinity Ratio
Khadeega Accept
Normality Reject Normality Reject Normality
Dakkalt Reject Normality Reject Normality Reject Normality
El Mashraqa Reject Normality Reject Normality Reject Normality
Bahr Semalla Reject Normality Reject Normality Reject Normality