Embed Size (px)
Citation preview

The America COMPETES Acts: The Future of U.S. Physical Science & Engineering Research?
Jeffrey L. Furman Boston University & NBER
21 June 2012
paper prepared for the NBER Innovation Policy & the Economy Workshop
Washington, DC April 2012
* Acknowledgements: I thank Lee Branstetter, Aaron Chatterji, Cristin Dorgelo, Heather B. Gonzalez, Stuart Graham, David M. Hart, Naomi Hausman, Ben Jones, Tom Kalil, Kei Koizumi, Julia Lane, Cindy Lopes Bento, Steve Merrill, Fiona Murray, and Scott Stern for discussions, references, and helpful comments. Daniella Kaye provided valuable research assistance. The content of this paper reflects solely the views of the author and any errors are the responsibility of the author alone. Author contact information: Jeffrey L. Furman, Boston University School of Management, 595 Commonwealth Ave – #653a, Boston, MA 02215, [email protected].

The America COMPETES Acts: The Future of U.S. Physical Science & Engineering Research?
Abstract
The America COMPETES legislation, including the initial America COMPETES Act of 2007 (ACA 2007) and America COMPETES Reauthorization Act of 2010 (ACA 2010), was one of the prominent bipartisan legislative achievements of the past decade and was seen as having the potential to be the most notable science and innovation policy initiative of the new millennium. The aims of the COMPETES Acts were to substantially increase the extent of Federal funding for physical science and engineering research in the United States and to improve the country’s research infrastructure and STEM capabilities in these areas. This paper contributes to early evaluation of the America COMPETES Acts (ACA) by providing an overview of the history and goals of these Acts and by tracking the subsequent Federal funding and implementation of the associated ACA programs. The analysis documents that the tangible outputs of the COMPETES Acts are modest relative to the expectations expressed at the time of each act’s signing. Indeed, a substantial fraction of the funds authorized by the 2007 and 2010 Acts was not appropriated by Congress and many of the programs specified by those acts have either failed to materialize or have done so at funding levels much lower than those initially authorized by Congress. A number of notable programs and initiatives have, however, been created with the support of the ACA (including the Advanced Research Projects Agency – Energy and the federal prize authority) and some of the agencies affected have been able to implement programs consistent with the spirit of the Acts, even in face of funding limitations. In addition, a tenuous but consistent bipartisan consensus that may have been energized by the COMPETES legislation has enabled such programs to avoid the spending cuts experienced by many non-defense-related federal programs.

1
I. Introduction
The America COMPETES legislation, including the initial America COMPETES Act of 2007
(ACA 2007) and America COMPETES Reauthorization Act of 2010 (ACA 2010), was one of the
prominent bipartisan legislative achievements of the past decade and was seen as having the potential to
be the most notable science and innovation policy initiative of the new millennium.1 To date, however,
limited systematic analysis of the America COMPETES Acts has been undertaken.2 This paper provides
an overview of the history and goals of the COMPETES legislation and describes the subsequent Federal
funding and implementation of the associated programs. The analysis suggests that despite the initial
bipartisan support and plaudits from both the scientific and business communities, the tangible outputs of
the COMPETES Acts have been substantially more modest than envisioned by either the 2007 or 2010
Acts. Indeed, the most salient observation about the ACA is that much of the funds authorized by the
2007 and 2010 Acts were not appropriated by Congress and that many of the specified programs have
either not materialized or have been created but at funding levels much lower than their initial
authorizations. These outcomes notwithstanding, a number of notable programs and initiatives have been
created with the support of the ACA (including the Advanced Research Projects Agency – Energy and
federal innovation prizes programs) that may not have been created without the legislation and some of
the agencies targeted by the ACA have been able to implement programs consistent with the spirit of the
Acts, even in face of funding limitations. In addition, a tenuous but relatively consistent, bipartisan
consensus has enabled physical science and engineering research programs to avoid the spending cuts
1 See, for example, Broder, David (2007) “Thankless Bipartisanship,” Washington Post, May 3, 2007, A18; Ensign, John
(2007) “Why the America Competes Act is Vital,” Innovation, 5(3); National Governor’s Association (2007) “NGA Praises Congressional Passage of the America COMPETES Act,” press release, August 6, 2007, http://www.nga.org/cms/home/news-room/news-releases/page_2007/col2-content/main-content-list/title_nga-praises-congressional-passage-of-the-america-competes-act.html accessed 15 June 2012; ASTRA (2007) “Congress Passes, President Signs America COMPETES Act,” Alliance for Science & Technology Research In America: ASTRA Briefs, 6(6), 10-14; and American Physical Society (2008) “Supporters of America COMPETES Bill Praise Its Passage, Urge Federal Funding,” American Physical Society – Capital Hill Quarterly, 3(1), 1.
2 The notable exception to this is the extensive work by the Congressional Research Service, including the efforts of Deborah Stine and Heather B. Gonzalez, who have written regular updates on COMPETES Act policy issues and funding, and John F. Sargent, who has tracked budgeting for COMPETES Act programs relative to historical trends. Their work is cited throughout this paper and it forms the basis of much of the chapter’s analysis.

2
experienced by many non-defense-related federal programs. Thus, an overall evaluation of the ACA
requires a nuanced view of what the Acts have achieved (i.e., an understanding of the qualitative changes
they have enabled as well as quantities of funding appropriated) and depends on what one considers as the
appropriate counterfactual. Measured relative to the funding levels authorized by the 2007 and 2010 acts,
one could reasonably conclude that the legislation has had limited impact. Measured relative to the
expectations established by contemporaneous funding for Federal programs, however, the sanguine
assessment of the impact of the Acts on American physical science and engineering research is far more
sanguine.
Before proceeding to the discussion, a few notes on this paper’s analytic approach are
appropriate. An evaluation of the impact of the America COMPETES legislation is complicated by a
number of factors. First, ACA 2007 and ACA 2010 were both authorization acts, which indicate
Congressional support for Federal spending but which are neither necessary nor sufficient to ensure that
funds are appropriated (i.e., actually made available) for the purposes, programs, or agencies authorized
by those Acts. Thus, each of the COMPETES Acts could be usefully interpreted as a funding policy
signal. Second, acts with budgetary implications, including acts that authorize federal spending and acts
that actually appropriate federal funds for spending, can specify that federal funds be spent at the agency
level, broad program level, or narrow program level. The facts that multiple levels may be specified in
authorization acts and that these may different from the levels of spending enabled by subsequent
appropriations acts make it difficult to track the relationship between authorization and implementation.
In addition to their impact on funding, authorization acts, such as the 2007 and 2010 ACA can initiate
changes in federal policies, which may be quite subtle in their effects. One example of this is the 2010
ACA’s authorization of broad-ranging federal prize programs, which has both enabled federal agencies to
solicit competitive solutions to specific innovation problems via www.challenge.gov and to approach
federal innovations in a broader way.
Finally, one of the difficulties in considering the impact of the America COMPETES Acts is the
problem of specifying a clear counterfactual – i.e., a comparison of what would have happened had the

3
2007 and 2010 Acts not been passed. One potential comparison would be to compare the trajectory of
funding and program implementation that has been realized since the passage of ACA 2007 with the trend
prevailing in the years prior to the 2007 Act or by comparing actual implementation with that articulated
by the 2007 and 2010 acts. Drawing conclusions from these comparisons would, however, rely upon the
assumption that the underlying conditions driving year-by-year Federal funding by Congress and year-by-
year agency decisions about discretionary priorities remained unchanged over the period of analysis.
Considering the financial crisis of 2008, ensuring recession and accompanying Congressional responses,
these do not seem like tenable assumptions. An alternative would be to consider contemporaneous trends
in physical science and engineering research and education outside the United States as a comparison for
U.S. investments in these areas. Although foreign spending may provide important baselines against
which to compare U.S. policies and investments, these investments are also changing in response to
changing conditions. They are, therefore, not an ideal control group for identifying the impact of the
ACA on U.S. physical science and engineering research funding, as foreign spending trends are not likely
to indicate how U.S. funding would have developed had Congress not passed the 2007 and 2010 ACA.
Thus, whereas program evaluation by econometric methods is often appropriate and quite
informative regarding the impact of particular government programs, such as the often-researched
Advanced Technology Program and Small Business Innovation Research program,3 I do not choose to
apply these such approaches in this paper. Instead, I adopt a more historical approach that summarizes
the origins of the 2007 and 2010 America COMPETES Acts, identifies their priorities and key programs,
and tracks the implementation of these priorities and programs. My overall evaluation of the Acts
3 Some evaluations of the ATP program include: Jaffe, Adam B (1998) “The importance of ‘spillovers’ in the policy mission
of the advanced technology program,” Journal of Technology Transfer, 23(2), 11-19; Hall, Bronwyn H., Albert N. Link, and John T. Scott (2001) “Barriers inhibiting industry form partnering with universities: Evidence from the Advanced Technology Program,” Journal of Technology Transfer, 26(1-2), 87-98; and Feldman, Maryann P. and Maryellen R. Kelley (2003) “Leveraging Research and Development: Assessing the impact of the U.S. Advanced Technology Program,” Small Business Economics, 20(2), 153-165. Some evaluations of the SBIR program include: Lerner, Josh (1999) “The Government as Venture Capitalist: The Long-Run Effects of the SBIR Program,” Journal of Business, 72, 285-318; Audretsch, David, Albert Link, and John T. Scott (2002) “Public/private technology partnerships: Evaluating SBIR-supported research,” Research Policy, 31(1), 145-158; Gans, Joshua and Scott Stern (2003) “When Does Funding Research By Smaller Firms Bear Fruit?: Evidence From The SBIR Program,” Economics of Innovation and New Technology, 12(4), 361-384.

4
considers the multiple potential counterfactuals against which the impact of the Acts could be judged and
attempts to paint a nuanced picture of the COMPETES legislation and impact.
II. Historical Context: Arguments for S&T funding in the U.S. over time
2.1 Background: The argument for national science and innovation funding
Although the aim of “promot[ing] the progress of science and useful arts” was articulated in the
U.S. Constitution as a power of Congress, this power was expressly linked to providing incentives to
authors and inventors.4 Consistent with the specificity of these aims, the U.S. federal government federal
government administered the patent system but did not engage in much centralized policy-making
regarding science and technology during its first century.5 During and following the Civil War, the
federal government began to expand its role in promoting science and technology by developing some
key institutions. The Morrill Act of 1862 created the mechanism for founding dozens of land-grant
colleges, dedicated to practical research and teaching, particularly in agriculture and mechanics.6 Passed
during the Civil War (earlier efforts had failed in part because of the resistance of southern states), the
1862 Act, led to the creation of institutions in the north. Following the Civil War, eligibility was
extended to former Confederate states as well. Related, subsequent acts of Congress expanded the federal
role in supporting states’ higher education efforts, including the Hatch Act of 1887, which provided
funding for agricultural experiment stations at land-grant colleges, and the Morrill Act of 1890, which
expanded the prior Morrill Act and led to additional funding for existing land grant colleges and the
foundation of new land grant colleges (though with cash grants rather than land), especially in the south.
4 U.S. Constitution, Article I, Section 8, Clauses 1 & 8: “The Congress shall have Power…To promote the Progress of Science
and useful Arts, by securing for limited Times to Authors and Inventors the exclusive Right to their respective Writings and Discoveries.” Clause 1 precedes the ellipsis, while Clause 8 follows.
5 The Federal government did engage support some efforts related to science and technology, however. For example, Federal support for the exploration of Lewis and Clark yielded numerous contributions to scientific knowledge, including contributions to natural history (including discoveries of new plants and animals), meteorology, and cartography (Ambrose, Stephen E. (1996) Undaunted Courage: Meriwether Lewis, Thomas Jefferson, and the Opening of the American West, (1996) New York, NY: Simon & Schuster; Cutright, Paul Russell (1969) Lewis & Clark: Pioneering Naturalists, Urbana, IL: University of Illinois Press).
6 Nevins, A. (1962) The State Universities and Democracy, Urbana, IL: University of Illinois Press.

5
The National Academy of Sciences (NAS) was also established during the Civil War (in 1863) as a quasi-
governmental science agency, aimed at providing counsel to government agencies on scientific matters.
The second major wave of federal science- and technology-related investments began during the
first two decades of the 20th century and accelerated during World War I. The federal government
established the National Bureau of Standards (the predecessor to the National Institute of Standards &
Technology) in 1901, the Public Health Service in 1912, and the National Advisory Committee for
Aeronautics in 1915. The Naval Consulting Board was established in 1915 to support the assessment and
development of military technology, and the National Research Council was created the following year as
a research organization to provide scientific and technical advice to the government, particularly by
conducting studies of relevance the National Academy of Science.
The argument for government participating more actively in funding and guiding basic scientific
research was made famously by Vannevar Bush, Director of the Office of Scientific Research and
Development under Franklin Delano Roosevelt during World War II, in his monograph, Science: The
Endless Frontier.7 Bush argued both that the scientific enterprise was a key to economic growth and
improvements in social welfare and that responsibility for funding basic science lay, ideally, with the
federal government.8 His logic for suggesting federal support for science funding was straightforward
and reflected an understanding of positive externalities: Since investments in basic scientific research
invariably diffuse to other organizations in way that limits the ability to reap sufficient returns from such
investments, for-profit organizations face lower incentives to invest in basic research than does society
overall – i.e., basic research can be usefully classified as a public good. In order to overcome this market
failure and ensure socially efficient investment in science, Bush argues, government should step into the
7 Bush, Vannevar (1945) “Science The Endless Frontier,” A Report to the President by Vannevar Bush, Director of the Office
of Scientific Research and Development, Washington, DC: United States Government Printing Office. 8 “Advances in science when put to practical use mean more jobs, higher wages, shorter hours, more abundant crops, more
leisure for recreation, for study, for learning how to live without the deadening drudgery which has been the burden of the common man for ages past. Advances in science will also bring higher standards of living, will lead to the prevention or cure of diseases, will promote conservation of our limited national resources, and will assure means of defense against aggression” (Bush, 1945, p. 10).

6
void and assume an active role in supporting scientific research. Bush’s vision resulted in the creation of
the National Science Foundation in 1950 and has constituted the rationale for government investment in
basic science since that time.9
2.2 The Competitiveness Agenda: National science and technology investments in a connected world
The line of argument built on Vannevar Bush’s logic – i.e., that the federal government should
play a role in funding science and technology and that science and technology leadership helps fuel
economic growth and national prosperity – has become particularly prominent over the past two decades
in discussions of national competitiveness. The Bush argument would be especially compelling in a
world in which one of the world’s countries has a substantial edge in the creation of useful knowledge
relative to other countries (or if all global investments in science were coordinated by a single body). In
such a scenario, if the unchallenged leader country (or the global science investment body) were to curtail
investments in science and technology or were to slow the rate at which it built on prior research
advances, global technological improvements would stagnate, as would global economic growth.10
In the event, however, that a number of countries have relatively similar levels of scientific
development, national decisions regarding scientific investment become more interrelated. This
complicates matters, as one country’s optimal investment decisions will depend on the investments of
other nations and on the rapidity and completeness with which knowledge diffuses. If scientific and
9 Building on Bush’s ideas, economists beginning with Nelson (1959) and Arrow (1962) described as a public, non-rivalrous,
non-excludable good which creates higher social welfare than private benefits. Non-rivalrous goods are those for which the costs of transmission and use are zero – i.e., they can be consumed by multiple individuals or organization without the creation of additional costs. Non-excludable good are those that could be easily imitated by rival producers and cannot be easily protected via trade secrets or other mechanisms. For organizations of relatively similar capabilities, scientific knowledge is both relatively non-rivalrous good and non-excludable (although some investments are needed to be able to access or apply scientific knowledge and some scientific knowledge can be effectively protected by secrecy, tacitness, or hoarding research materials). As a result, markets for basic science (and technological knowledge that is far from commercialization) are likely to lead to underinvestment in research and underprovision of inventions and innovations relative to the social ideal. Considering the central role of scientific and technical knowledge play a central role in economic growth and social welfare (Solow, 1956; Abramovitz, 1956), the fact that scientific knowledge evidences the properties of a public good strongly suggest that the creation and accretion of knowledge should be central goals for national policymakers.
10 See Jones, Charles I. (1995) “R&D Based Models of Economic Growth,” Journal of Political Economy, 103: 739-784.

7
technical knowledge diffuses slowly and incompletely (or if it is particularly expensive for non-innovator
countries to imitate leader countries, i.e., if catch-up is slow), then a leader country is likely to obtain high
returns to its investments in science. If, however, scientific and technical knowledge diffuses sufficiently
swiftly and effectively, then there may not be a substantial benefit to being a leader country, as fast-
follower countries can free ride on the investments of leaders.
Thus, unless it is the unchallenged global technological leader, it will only be valuable for a
country to pursue a strategy of scientific and technical leadership in the presence of relatively strong
increasing returns to science and technology investment and relatively local knowledge diffusion. Stated
somewhat differently, in order for locally-generated knowledge to be translated into scientific and/or
technical leadership, researchers in close proximity to an original discovery must be able to exploit that
discovery more rapidly, intensively, and, ultimately, successfully, than researchers who are further
away.11
Despite improvements in information technology that have lowered the communication costs and
made it easier to spread information, the often-anticipated “death of distance” has failed to materialize.
Indeed, proclamations that the world is flat (Friedman, 2005) overlook the importance of local knowledge
spillovers, which are quite strong, even in science, one of the areas in which ideas are most likely to flow
most effectively.12 While transportation costs have declined for physical goods and cost of direct
communication has also declined, empirical evidence suggests value of proximity has increased in most
industries and most sectors as well. Research suggests that investments in science and technology at the
world’s frontier yield spillovers that are constrained to geographically proximate regions (Jaffe,
Trajtenberg, & Henderson, 1993) and that even small barriers to diffusion can explain large differences in
11 Furman, Jeffrey L. (2011) “The Economics of Science and Technology Leadership,” Leadership in Science and Technology:
A Reference Handbook, William Sims Bainbridge, Editor, Sage Publications, Chapter 3. 12 Friedman, Thomas L. (2007) The World is Flat: A Brief History of the Twenty-first Century. New York, NY: Farrar, Straus
and Giroux.

8
productivity levels among the most advanced nations (Eaton & Kortum, 1999).13 Thus, there are at least
some reasons to believe that investments in scientific and technical leadership may yield high rates of
return than investments encouraging fast-follower approaches. Within the United States, those regions
that have been historically knowledge-intensive have experienced greater economic success, even as the
information economy has developed further (Glaeser and Ponzetto, 2010).14 More broadly, research
suggests that those countries and geographic regions that have invested most heavily in scientific and
technological infrastructure and adopt innovation-oriented policies have substantially improved their
science bases and innovative capacity (Furman and Hayes, 2004).15 The evidence suggests, though, that
while many leader countries have continued to make science and technology investments at increasing
rates, a number of former follower countries have increased their commitments to innovation at even
greater rates. This has contributed to the globalization of science and technology and has contributed to
the erosion of the gap between the leader and emerging innovator countries.
There remains, however, a relative paucity of theoretical and empirical evidence adjudicating
whether country-level investments in scientific and technical leadership have higher average and marginal
rates of return than investments in diffusion, imitation, and catch-up. Nonetheless, the prevailing public
policy consensus within the United States remains that national science and technological leadership is
welfare-enhancing.16 Although outward support for science and technology investment remains strong,
13 Adam Jaffe, Manuel Trajtenberg, Rebecca M. Henderson (1993) “Geographic localization of knowledge spillovers as
evidenced by patent citation,” Quarterly Journal of Economics, 79(3): 577–598 and Eaton, Jonathan and Samuel Kortum, “Trade in ideas patenting and productivity in the OECD,” Journal of International Economics, 40(3-4), 251-278.
14 Edward L. Glaeser, Giacomo A. M. Ponzetto. (2010) “Did the Death of Distance Hurt Detroit and Help New York?” in Edward L. Glaeser, editor, Agglomeration Economics, Chicago, IL: University of Chicago Press.
15 Furman, Jeffrey L. and Richard Hayes (2004) “Catching up or standing still: Catching up or standing still? National innovative productivity among ‘follower’ countries, 1978–1999,” Research Policy, 33, 1329-1354.
16 See, e.g., World Economic Forum (2010) The Global Competitiveness Report. Geneva, Switzerland: World Economic Forum and Council on Competitiveness (2011) Compete. Washington, DC: Council on Competitiveness.

9
there is evidence that public support for U.S. S&T investment may be waning, both from certain political
pronouncements and from Congressional actions regarding science and technology funding.17
2.3 An Overview of Federal Research & Development Spending
As detailed in Table 1, the 2012 budget called for approximately $3.8 trillion in federal
expenditures. Of this amount, $2.2 trillion (57.5%) consisted of spending on mandatory programs,
including Social Security benefits, Medicare, and Medicaid, $207 billion arose from interest due on
federal debts, and the remaining $1.4 trillion from defense and non-defense discretionary spending. The
FY2012 budget was scheduled to include approximately $153 billion in federal R&D expenditures, an
amount equal to approximately 4.0% of total federal expenditures, 10.8% of total discretionary spending,
and 0.9% of Gross Domestic Product. Defense-related R&D constituted $85 billion, or approximately
55.6% of total federal R&D, while the remaining $68 billion, or 44.4%, of federal R&D was non-defense
R&D.
Reflecting the country’s long-standing commitment to medical and life sciences research,
approximately half of the non-defense R&D expenditures, or $33.4 billion, are targeted for Health R&D
(Table 2a). Physical science and engineering research and development are concentrated in categories
other than Health. Of the remaining federal R&D expenditures, $12.1 billion are budgeted for general
science, $9.5 billion for space exploration, $3.6 billion for energy, and $2.5 billion for environmental
research. Taken together, these and the remaining research categories constitute approximately 22% of
17 The sentiments expressed by Rep. Lincoln Diaz-Balart (R-FL) during a May 2010 hearing regarding the reauthorization of
the America COMPETES Act demonstrate both the public support for science funding and the increasing doubts regarding its rate of return: “I understand and I support the underlying principles of the America COMPETES Act, prioritizing and strengthening investments in basic research and development and STEM: science, technology, engineering, and mathematics education. . . . as much as I would prefer to support the underlying legislation, I believe that at this time of severe budgetary constraints, the underlying legislation includes excessive spending levels. The bill has an overall authorization of nearly $86 billion, which represents approximately $20 billion in new funding above the fiscal base of this year. That is a significant increase when we’re facing record budget deficits. And that is after the so-called stimulus bill injected six billion additional dollars into the agencies funded by this bill. … And if we continue on that trajectory, the America that we know, love, and admire will be severely threatened. Our excessive spending threatens the very foundation of our economy and our way of life. We could very well find ourselves in a position, soon, similar to today’s Greece,” Richard M. Jones (2010) “Selections from the Floor: House Consideration of COMPETES Legislation,” The American Institute of Physics Bulletin of Science Policy News, 56.

10
federal R&D. Decomposing federal R&D expenditures by federal department also helps clarify the
nature of national R&D priorities. Table 2b shows that greater than 75% of federal R&D is conducted
either by the Departments of Defense or Health and Human Services, the latter of which oversees the
National Institutes of Health. Physical science R&D and engineering R&D each received approximately
$3.9 in federal expenditures in FY2010.18 Taken together, the amount of U.S. federal funding dedicated
to physical science and engineering funding constituted is less than one fourth of that devoted to Health-
related R&D. This shift towards Health-related R&D reflects an historical trend, as fields such as
mechanical engineering, electrical engineering, geology, chemical engineering, physics, and chemistry all
experienced relative declines in federal funding beginning the 1990s.19
2.4 U.S. investment in science & innovation at the turn of the millennium: A storm on the horizon?
Concerns regarding the competitiveness of the United States economy have been most salient
during periods of recession have been most closely linked with rapidly-growing countries with which the
United States has a negative trade balance. The two most notable of these periods include the 1980s,
when the Japanese economy appeared more robust than the U.S. economy, and the most recent half-
decade, during which Asian economies, especially particular regions of China and India, have achieved
higher rates of growth.
Fears about U.S. competitiveness in the 1980s and early 1990s subsided somewhat as Japan
entered into its “Lost Decade,” as the United States economy achieved increased real growth rates
coupled with low inflation during the Clinton administration, and, at the end of the 1990s, as the internet
boom resulted in substantial new firm formation and coincided with a period of increasing productivity.
Questions regarding U.S. commitment to science and technology investments did emerge during this
18 Merrill, Steve (2012) “A Perpetual Imbalance? PS&E Research in the Decade of the COMPETES Act ,” Workshop on STEM
Measures for Innovation and Competitiveness, Washington, DC, 6 June 2012. 19 Ibid.
11
period, however (Porter and Stern, 1999, and Furman, Porter, Stern, 2002).20 Despite its macroeconomic
difficulties, Japanese firms continued to invest heavily in research and development and the Japanese
government did not substantially divert funding from S&T activities. Some countries increased
commitments to science and technology at rates that exceeded those of the United States, raising concerns
about U.S. science and technical leadership going forward.
With the internet boom of the late 1990s and associated wave of advances in consumer
electronics, software, and computer hardware, the growing extent of science and technology globalization
became clear. South Korean companies, like Samsung and LG, emerged as technology leaders, as did
Finnish firm Nokia. Large numbers of high technology ventures arose in Israel, Taiwan, Singapore,
China, and India, among other countries. These private sector successes reflected significant public
investments in science and technology infrastructure and increasing national commitments to S&T.
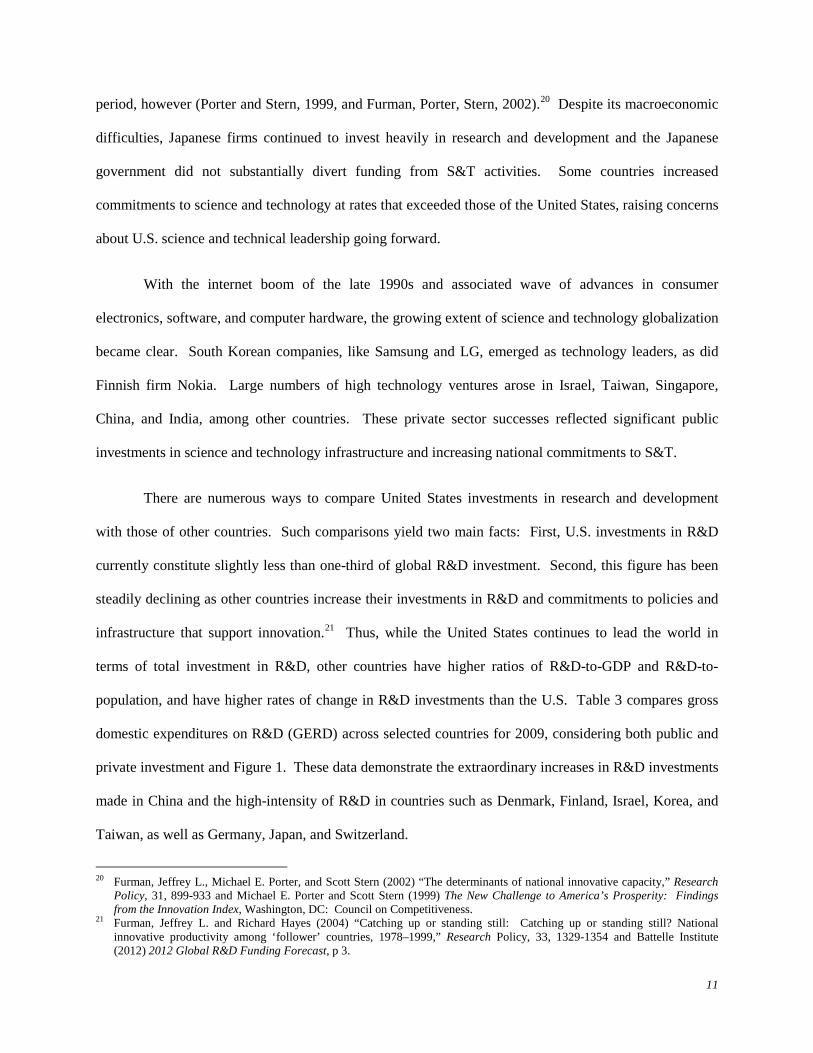
There are numerous ways to compare United States investments in research and development
with those of other countries. Such comparisons yield two main facts: First, U.S. investments in R&D
currently constitute slightly less than one-third of global R&D investment. Second, this figure has been
steadily declining as other countries increase their investments in R&D and commitments to policies and
infrastructure that support innovation.21 Thus, while the United States continues to lead the world in
terms of total investment in R&D, other countries have higher ratios of R&D-to-GDP and R&D-to-
population, and have higher rates of change in R&D investments than the U.S. Table 3 compares gross
domestic expenditures on R&D (GERD) across selected countries for 2009, considering both public and
private investment and Figure 1. These data demonstrate the extraordinary increases in R&D investments
made in China and the high-intensity of R&D in countries such as Denmark, Finland, Israel, Korea, and
Taiwan, as well as Germany, Japan, and Switzerland.
20 Furman, Jeffrey L., Michael E. Porter, and Scott Stern (2002) “The determinants of national innovative capacity,” Research
Policy, 31, 899-933 and Michael E. Porter and Scott Stern (1999) The New Challenge to America’s Prosperity: Findings from the Innovation Index, Washington, DC: Council on Competitiveness.
21 Furman, Jeffrey L. and Richard Hayes (2004) “Catching up or standing still: Catching up or standing still? National innovative productivity among ‘follower’ countries, 1978–1999,” Research Policy, 33, 1329-1354 and Battelle Institute (2012) 2012 Global R&D Funding Forecast, p 3.
12
These patterns have raised questions in the United States regarding its future leadership in
innovation. In 2005, following joint discussions between the National Academy of Sciences and the
National Academy of Engineering and official requests from members of both houses of the U.S.
Congress, the National Academies initiated a study of U.S. competitiveness that focused on national
investments in science and technology. The aim of the effort was to develop specific recommendations
that could support American competitiveness and prosperity in the 21st century. The resulting report,
Rising Above the Gathering Storm: Energizing and Employing America for a Brighter Economic Future
(commonly referred to as, the Gathering Storm report), included a core evaluation of 224 pages and was
bolstered by more than three hundred pages of appendices.22 The report assessed U.S. performance in
science and technology investment and productivity, considered actions that the country should take to
improve (a) K-12 education in science and mathematics, (b) science and engineering research, (c) science
and engineering higher education, and (d) economics and technology policy in order to ensure future
prosperity, and discussed the implications of the United States losing is competitive advantage in science
and technology.
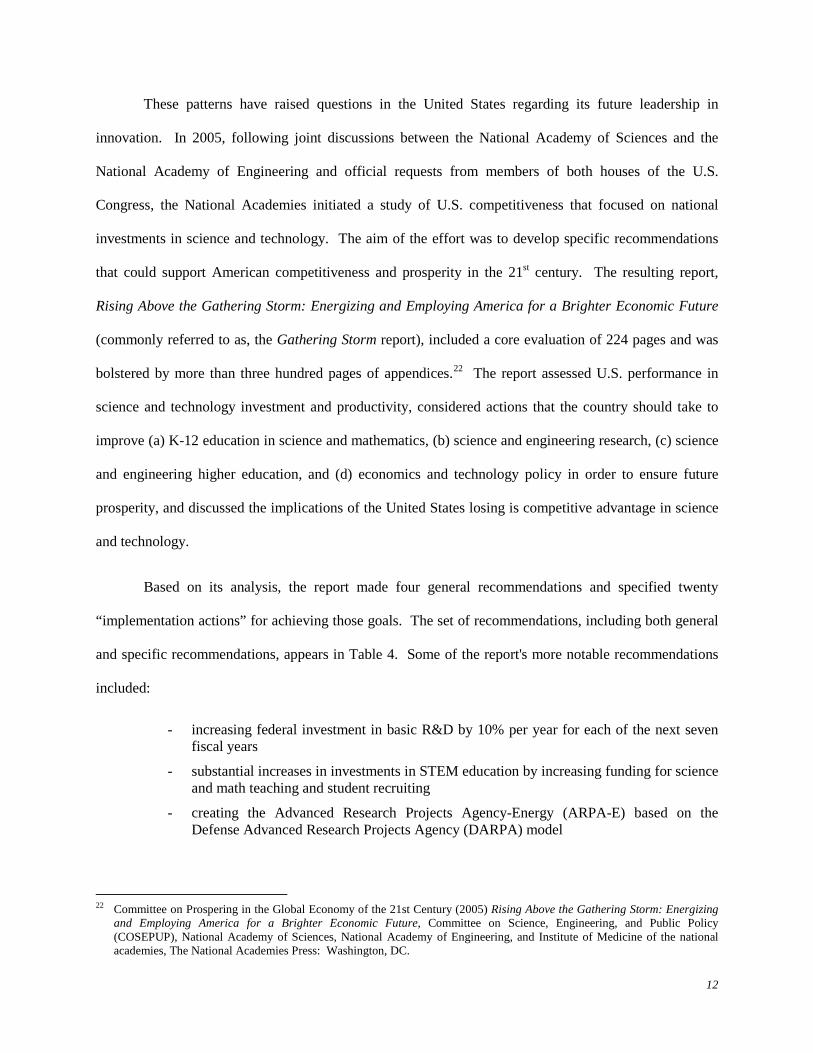
Based on its analysis, the report made four general recommendations and specified twenty
“implementation actions” for achieving those goals. The set of recommendations, including both general
and specific recommendations, appears in Table 4. Some of the report's more notable recommendations
included:
- increasing federal investment in basic R&D by 10% per year for each of the next seven fiscal years
- substantial increases in investments in STEM education by increasing funding for science and math teaching and student recruiting
- creating the Advanced Research Projects Agency-Energy (ARPA-E) based on the Defense Advanced Research Projects Agency (DARPA) model
22 Committee on Prospering in the Global Economy of the 21st Century (2005) Rising Above the Gathering Storm: Energizing
and Employing America for a Brighter Economic Future, Committee on Science, Engineering, and Public Policy (COSEPUP), National Academy of Sciences, National Academy of Engineering, and Institute of Medicine of the national academies, The National Academies Press: Washington, DC.

13
- increasing scholarship funding for U.S. citizens in areas of national need; supporting the ability of international graduate students to obtain visas and stay in the United States following completion of their studies
- enhancing intellectual-property protection and providing pro-innovation tax incentives
- ensuring broadband internet access.
The Gathering Storm report was not the only effort at the time turning the spotlight on the issue
of science and technology leadership. A number of the members of the National Academies Gathering
Storm report authorship team, including Norman Augustine and Charles Vest, had participated in the
Council on Competitiveness’s National Innovation Initiative Summit in May 2004, the summary of
which, “Innovate America,” demonstrated many of the same concerns as those reported in the National
Academies report.23
Concerns about American competitiveness and relative investments in science and technology
were further integrated into policymaking discussions when President George W. Bush announced the
American Competitiveness Initiative (ACI) in his January 2006 State of the Union Address. The ACI
incorporated a number of the Gathering Storm recommendations, including a call for doubling the
nation’s investment in funding for the physical sciences. Unlike the original Gathering Storm plan, which
called for a 10% annual increase in funding over a seven-year period, the ACI proposed a 7% increase in
funding over a ten-year period.24
III. The America COMPETES Act of 2007
3.1 Legislative Background
Congress began to take actions to implement various aspects of the Gathering Storm
recommendations in late 2005 and throughout 2006. President Bush’s American Competitiveness
23 Council on Competitiveness (2005) ““Innovate America: National Innovation Initiative Summit and Report.” 24 Office of Science and Technology Policy, Executive Office of the President (2006) “American Competitiveness Initiative
Research and Development Funding in the President’s 2007 Budget,” White House http://www.whitehouse.gov/files/documents/ostp/pdf/1pger_aci.pdf, accessed 21 February 2012).

14
Initiative gave further momentum to these efforts. Related bills made their way through the House of
Representatives and Senate between May and August 2007 and culminated with the August 2007 the
passage of the America Creating Opportunities to Meaningfully Promote Excellence in Technology,
Education, and Science Act of 2007 (America COMPETES Act, ACA-07). Sponsored by Barton Gordon
(D-TN) and co-sponsored by twenty-one representatives, including fifteen Democrats and six
Republicans, the ACA received bi-partisan support throughout this period and was passed by an
overwhelming majority of the both the House of Representatives and via unanimous consent in the
Senate.25 The bill was signed into law by President George W. Bush on August 9, 2007. Despite signing
the bill quickly, the administration expressed the, “[concern] that the legislation includes excessive
authorizations and new duplicative programs.”26 Even in light of the Administration’s reservations,
scientific societies and the high tech business community regarded the new law with substantial
optimism.27
The Act was broad in scope but focused in its overarching aims. Specifically, the Act aimed (1)
to enhance the United States’ overall levels of investments in physical science and engineering research
and (2) to improve education for science, technology, engineering, and mathematics (STEM) in American
schools (K-12) and post-secondary institutions, particularly in the areas of physical science and
engineering. To further these goals, the Act authorized $33.6 billion in funding between fiscal years 2008
– 2010. The Act consisted of eight sections (“titles”), the first seven of which articulated responsibilities
and funding authorizations for the affected federal agencies and offices and for specific programs within
these agencies: Office of Science & Technology Policy (OSTP) and government wide science; National
Aeronautics and Space Administration (NASA); National Institute of Standards & Technology (NIST);
25 Govtrack.us, “H.R. 2272: America COMPETES Act,” http://www.govtrack.us/congress/bill.xpd?bill=h110-2272; accessed
March 2012. 26 White House Press Release, August 9, 2007, “Fact Sheet America Competes Act of 2007, http://georgewbush-
whitehouse.archives.gov/news/releases/2007/08/20070809-6.html. 27 See, e.g., Mervis, Jeffrey (2007) “Congress passes massive measure to support research, education,” Science, 3117, 736-737;
American Physical Society, 2007, “Supporters of America COMPETES Bill Praise Its Passage, Urge Federal Funding,” October 4, 2007; http://www.aps.org/about/pressreleases/competes.cfm; accessed March 2012; Broache, Anne, “Bush signs off on billions for science, tech,” Cnet News, August 9 2007; http://news.cnet.com/8301-10784_3-9757778-7.html, accessed March 2012.

15
Ocean and Atmospheric Programs; Department of Energy; Education; National Science Foundation
(NSF); General Provisions.28
Reviewing the federal budget process is helpful for understanding the nature and implications of
the America COMPETES Act. The rules of Congress involve a two-stage procedure for providing
funding for federal agencies and programs. In the first step, Congress must pass legislation that
authorizes the creation, continuation, or modification of federal programs and agencies. This can be
reasonably viewed as a policy-making step, as decisions regarding programs receive authorizations and at
which levels of funding fall under the jurisdiction of relevant legislative committees (e.g., in the case of
the ACA, under the House Committee on Science, Space, and Technology) and involve setting funding
targets (ceilings) for particular programs. In the second step, the Congressional budgeting process results
in appropriations bills that determine specific levels of funding for authorized federal agencies and
programs.29 These bills are subject to the jurisdiction of the House and Senate Appropriations
Committees, which are not obligated to provide complete funds for all programs.30 The 2007 ACA
authorized federal funds science and technology programs for a three-year period. Additional funding for
initiatives such as the ACA typically results from additional authorization acts, although it is also possible
to receive appropriations without specific authorizations. One may reasonably interpret authorization acts
and re-authorization acts as policy signals that communicate the ‘sense of Congress’ regarding a
particular policy priority. As federal science and technology programs had, historically, received funding
authorizations from a variety of acts, the ACA was notable as a S&T funding authorization mechanism, as
28 110th Congress (2007) “America Creating Opportunities to Meaningfully Promote Excellence in Technology, Education, and
Science Act, H.R. 2272, Government Printing Office: Washington, DC. 29 Rules in the House of Representatives stipulate that authorization acts and appropriation acts must be separate and that the
appropriations process cannot approve funding in excess of the amounts (if any) specified in the authorization legislation. Senate rules also follow the practice of separating authorizations and appropriations, but enable appropriation in authorization bills (Streeter, Sandy (2011) “The Congressional Appropriations Process: An Introduction,” Congressional Research Service, 97-684).
30 Supplemental appropriations, such as those used for the 2009 American Recovery and Reinvestment Act (ARRA) can modify or extend Congressional funding. Such appropriates are usually invoked in response to natural disasters, national security issues or conflicts, or economic exigencies.

16
it aggregated funding authorizations across a broad range agencies, identified a series of new S&T
programs, and developed a vision for coordination across S&T-focused agencies.
As the initial ACA neared expiration, continued funding authorization for ACA programs could
have come in the form of Congressional authorizations historically used to indicate willingness to fund
federal agencies, such as the annual authorization for the Department of Commerce or Department of
Defense or in the form of a dedicated authorization act that covers several programs and/or agencies and
addresses a specific purpose, like the initial ACA in 2007. For example, Congress could have indicate its
willingness to extend ACA programs operated by the NSF in an annual NSF authorization bill or it could
have indicated a willingness to support these programs with a bill that bundled multiple programs,
agencies, and years of funding authorization, as it did with the 2010 America COMPETES Re-
authorization Act. The 2010 ACA extended a number of the programs created in the 2007 Act, retired
some of the 2007 Act programs, and initiated some new S&T programs. The fact that the 2007 ACA and
2010 ACA were authorization bills means that they were neither necessary nor sufficient to ensure
funding for the programs associated with them.
The difficulty of tracking the impact of the ACA on physical science and engineering research,
education, and infrastructure made even more complicated by the fact that authorizations can be specified
at multiple levels. Although each Act articulated responsibilities for various Executive agencies,
including, for example, the responsibility of the Office of Science and Technology Policy to identify
inadequacies at federal laboratories and prioritize investments in federal research infrastructure (Section
1007), the Executive Branch has some leeway in the way in which it interprets and adheres to these
responsibilities.31 Thus, a substantial fraction of the promise of the COMPETES legislation depended
upon the extent to which Congress subsequently funded the programs described by the Act and the extent
31 Of course, the shadow of future Congressional funding decisions helps discipline the extent to which the Executive Branch
interprets Congressional mandates. For example, if the Office of Science and Technology (OSTP) policy were to execute duties specified by the America COMPETES Act in way that did not accord with Congress’s intention, Congress could restrict future OSTP appropriations as an expression of dissatisfaction.

17
to which presidential administrations subsequently adhered to the prescriptions of the Act for the
Executive Branch.
3.2 ACA2007: Overview of key provisions
I characterize the 2007 Act as involving seven distinguishing features: (1) the Doubling Path; (2)
ARPA-E, (3) Science, Technology, Engineering, and Math (STEM) Education, (4) modification of NIST
programs, (5) additional programs in other agencies, (6) commitment to high-risk, high-reward basic
research projects, and (7) greater coordination of federal science and technology investments. I describe
each of these in greater below.
(1) The “Doubling Path”: The ACA 2007 authorized spending increases for FY2008-2010 that, if
funded and maintained consistently, would lead to a doubling of the combined budgets of the
National Science Foundation (NSF), the laboratories of the National Institute of Standards and
Technology (NIST), and the Department of Energy’s Office of Science within seven years. This
was consistent with the exhortation of the Gathering Storm report, although it was accelerated
relative to the Bush Administration’s 2006 American Competitiveness Initiative, which called for
a ten-year doubling path. Also consistent with the Gathering Storm report, the doubling path
would be focused on increasing investments in the physical sciences and engineering, rather than
the life sciences. One worthwhile note is that the aim on the Act was a steady rather than discrete
increase in funding, consistent with the suggestions of the Gathering Storm report and the lessons
academics had drawn from the swift, significant boost in NIH funding that was followed by
stagnant funding thereafter.32
(2) ARPA-E: The ACA authorized the establishment of the Advanced Research Projects Agency –
Energy within the Department of Energy. Modeled on the Defense Advanced Research Projects 32 Richard Freeman and John van Reenen (2009) “What if Congress Doubled R&D Spending on the Physical Sciences?” in Josh
Lerner and Scott Stern, eds., Innovation Policy and the Economy, Volume 9, University of Chicago Press, 1-38.

18
Agency (DARPA) and sharing its naming convention, the agency was envisioned as an agency
that would, “identif[y] and promot[e] revolutionary advances in fundamental sciences, translat[e]
scientific discoveries and cutting-edge inventions into technological innovations, and accelerat[e]
transformational technological advances in areas that industry, by itself, is not likely to undertake
because of technical and financial uncertainty.”33 ARPA-E was envisioned as an agency that
would fund cutting-edge research aimed at enhancing the U.S.’s ability to develop and sell clean,
affordable, and reliable energy. The agency was to target projects in which private industry was
unlikely to invest, either because such projects were too risky or because they would generate too
many spillovers to ensure sufficiently high private returns. Like DARPA, the organizational
structure of ARPA-E was expected to be lean (i.e., to have few organizational layers) and to
involve program managers who were world-class technical experts with a strong entrepreneurial
orientation who would selectively advance promising projects and approaches. The ACA07
authorized $300 million for the agency for FY2008 and “such sums as necessary” for FY2009
and FY2010.34 The authorization of the agency constituted a signal of the developing U.S. effort
to support energy R&D and infrastructure and built on legislative momentum of the Energy
Policy Act of 2005, which provided loan guarantees and tax incentives to support energy
production.
(3) Science, Technology, Engineering, Math (STEM) Education: A central motivating force
behind the 2007 ACA was the concern that American competitiveness was being eroded and
would continue to be eroded by relative declines in U.S. extent of investment in STEM education
in primary and secondary schools, by the quantity and quality of American STEM graduates, and
by the availability of funding for American graduate students. Increased investments in STEM
education were to be achieved particularly through programs at the Department of Energy,
33 Stine, Deborah D. (2009) “America COMPETES Act: Programs, Funding, and Selected Issues,” Congressional Research
Service, RL34328. 34 The Homeland Security Advanced Research Projects Agency (HSARPA), established in 2002, is another federal agency
devoted to translational research developed on the DARPA model.

19
Department of Education, and National Science Foundation. The Act highlighted three particular
areas of focus for new programs: (a) increasing the number of STEM teachers, particularly those
of high quality and with exceptional training, and improving the depth of existing teachers’ in
STEM areas; (b) exposing a larger number of U.S. students to STEM education and attracting
more into post-secondary STEM education and STEM-linked careers; and (c) improving
investments in STEM education among women, minorities, and high-need schools. The ACA
authorized a broad series STEM programs to be developed and implemented by the National
Science Foundation (NSF), Department of Energy (DOE), and Department of Education (ED).
• Department of Energy (DOE) STEM initiatives: The ACA instructed the Department of
Energy to appoint a Director of Science, Engineering, and Mathematics Education to oversee
STEM education initiatives within the DOE. The Act also established a number of new
STEM programs for the Director to oversee. These included (a) programs for establishing
state-wide public schools specializing in math and science education, (b) a summer program
in math and science for middle and high school students that would involve internships with
the national laboratories, and (c) a recruiting and mentoring program in STEM education for
women and minority students. In addition to the internship program, the Act authorized other
programs that draw upon the DOE’s national laboratories, including a Centers of Excellence
program that would enable teachers in a high-need public secondary school proximate to each
national laboratory to use the lab’s equipment for teaching purposes and summer programs
delivered at the national laboratories designed to improve the teaching skills of K-12
teachers. At the post-secondary level, the ACA also called for the creation of the a graduate
research fellowship program, the Protecting America’s Competitive Edge (PACE) fellowship,
dedicated to funding researchers operating in the DOE’s domain.
• Department of Education (ED) STEM initiatives: The ACA authorized funding for a
number of matching grant programs, including programs dedicated to creating part-time
master’s degree programs in STEM fields, one-year master’s degrees that would enable
STEM professionals to achieve teaching certification associated fields, and educational
partnerships that would facilitate teaching certification in STEM fields. Most notably,
matching grants were authorized to support the teaching of advanced placement or
international baccalaureate courses (AP/IB) in STEM fields in low income or rural areas and

20
to facilitate the enrollment of students in such courses. Another matching grant program,
which, like the AP/IB program had been part of President Bush’s American Competitiveness
Initiative was authorized by the ACA was the Math Now initiative. This program (authorized
by Section 6201) of the ACA07, provided matching grants to high-need local educational
agencies to support research-based mathematics teaching initiatives, enhance math teachers’
professional development opportunities, and monitor and support of K-9 student progress in
mathematics. Three additional STEM-related grant programs authorized by the ACA were
the Foreign Language partnership program, which supported study in foreign languages
valuable for national competitiveness and security reasons; the Alignment of Education
programs, which were designed to ensure a strong match between K-12 STEM educational
content and the knowledge and skills requirements of post-secondary STEM education and
the workforce; and the Mathematics and Science Partnership Bonus awards, designed to be
bestowed on schools with low-income students that evidenced the most significant progress
in math and science education.
• National Science Foundation (NSF) STEM initiatives: The 2007 ACA authorized the
expansion of a number of NSF STEM programs, including: the Robert Noyce Teacher
Scholarship program, which provides scholarships for STEM majors who agree to serve as
teachers in high-need schools for at least two years after graduation; the Math & Science
Partnership program; the STEM Talent Expansion Program (STEP) and Advanced
Technological Education (ATE) program, which aimed to increase the number and quality of
college graduates in STEM fields, respectively; the Graduate Research Fellowship and
Integrative Graduate Education and Research Traineeship (IGERT) programs, which support
research funding and educational innovation among STEM graduate school programs. The
ACA also includes a number of provisions designed to support the participation of women
and historically-underrepresented minorities in STEM training. The ACA also authorized the
creation of a new NSF program, the Laboratory Science Pilot program (LSP), a program
designed to award grants to partnerships between higher education and other organizations
that would improve schools’ laboratories, instruments, and tools.
(4) Modification of National Institute of Standards & Technology (NIST) programs: The ACA
created or modified a number of science and engineering programs within the Department of
Commerce that are operated by the National Institute of Standards and Technology and which

21
appear under its laboratories (Scientific & Technical Research and Services) and Construction
budgets.
• Hollings Manufacturing Extension Partnership Program (MEP): NIST’s Manufacturing
Extension Partnership program operates a nationwide network of regional centers, supported
by federal and non-federal funding sources, that provide scientific, technical, and
management assistance to small- and medium-sized enterprises. The ACA authorized the
establishment of additional MEP programs, such as collaborative research grants, a
fellowship program, and a research database.
• Replaced the Advanced Technology Program (ATP) with the Technology Innovation
Program (TIP): Established in 1998 and first funded in 1990, the ATP involved provided up
to 50% federal support for firm-based research projects that had been assessed as both having
high potential for private returns and being too distant from commercialization to adequately
attract private investment. The remainder of support for such projects was obtained by other
funding sources, including matching grants and private funding. Budget support and political
support for the ATP had wavered over the course of its existence.35 The 2007 ACA
authorized the replacement of the ATP with the Technology Innovation Program, targeted for
small- and medium-sized enterprises and ventures involving such enterprises and either
private sector, academic, or non-profit collaborators. Similar to the ATP, the TIP was
designed to provide federal support (subject to matching funds) for high-risk,
transformational research that addressed areas of specific national need.
• Fellowship programs: In addition to these programs, the ACA authorized funding for NIST
to expand its support for postdoctoral and senior research fellowships at NIST in the
manufacturing sciences.
(5) Additional programs in other agencies: The Act created additional obligations for the White
House Office of Science and Technology Policy (OSTP), the National Aeronautics and Space
Administration (NASA), and the National Oceanic and Atmospheric Administration (NOAA).
The OSTP was charged with multiple provisions, including convening a National Science and
35 Fong, Glenn R. (2001) “Repositioning the Advanced Technology Program,” Issues in Science & Technology Online,
http://www.issues.org/18.1/fong.html and Charles W. Wessner (1999) The Advanced Technology Program: Challenges and Opportunities. Washington, D.C.: The National Academies Press.

22
Technology Summit to evaluate U.S. STEM efforts, creating a President’s Council on Innovation
and Competitiveness, fostering twice-annual STEM Days in American elementary and middle
schools, developing research efforts in “service science,” and coordinating efforts across federal
agencies to develop STEM education plans, promote innovation and competitiveness, and share
innovation-related data and results across agencies. In addition to charging NASA with
participation in efforts to coordinate innovation and competitiveness efforts with other agencies,
the Act required NASA to develop an educational project based on the International Space
Station (ISS) and to develop a proposal for funding research to be performed on the ISS. The Act
expressed the expectation that the NOAA coordinate with other agencies in STEM education
efforts, competitiveness, and innovation promotion; contribute to U.S. competitiveness in ocean
and atmospheric science and innovation; and develop plans to educate American students
regarding the issues covered by the NOAA’s research mission.
(6) High-risk, High-Rewards Basic Research Projects: The Act expressed the “sense of Congress”
that each executive agency to which funds were authorized should devote an “appropriate”
fraction of its research budget to projects deemed to be high-risk, high-reward efforts. The Act
described such projects as “transformative” research, which involves fundamental scientific or
technical issues, multidisciplinary efforts, and substantial novelty. This initiative is based on the
idea that project-focused funding mechanisms may underinvest in such efforts, which are likely to
be more complicated, involve longer-term investments, and have higher variance in outcomes
than step-by-step research efforts.
(7) Greater coordination of federal science and technology investments: Embodied in the 2007
ACA was an effort to effect greater coordination of federal science and technology investments.
The Act identifies a number of such responsibilities for the Office of Science and Technology,
including the responsibility to identify deficiencies in national research infrastructure and to
encourage communication regarding research results and data sharing. In nearly every section of

23
the Act, affected agencies are implored to work more closely with each other and participate in
interagency coordination efforts.
3.3 ACA Funding & Implementation (2008-2010), including the American Recovery and Reinvestment Act (ARRA)36
The most salient fact regarding the programs created in and authorized for funding by the 2007
ACA is that many were not funded at authorized levels or at levels that enabled their implementation in
the years after the bill was signed into law. Determining the precise extent to which ACA initiatives were
funded and implemented is not straightforward. The Act did not articulate funding levels for each
program in each year and some agency budgets are not associated with specific, individual line items in
national or agency budgets. Moreover, some federal science and technology programs previously
authorized by other acts of Congress received authorizations in the 2007 ACA, making it difficult to link
precisely the impact of the 2007 ACA on changes in funding. The Congressional Research Service,
particularly Science and Technology Specialists, Deborah D. Stine, Heather B. Gonzalez, and John F.
Sargent, has undertaken careful efforts to document ACA program funding in CRS reports. Table 5 and 6
present summaries of these data and the majority of the discussion below builds on the information they
have compiled.
Table 5 lists programs authorized for funding in the Act, distinguishing those that received
funding in FY2009 from those that appear not to have received funding in that year (or in FY2008).
Table 6 lists programs with specific authorized budgets in the 2007 and 2010 America COMPETES Act
and identifies funding appropriations for those years for which it is available from CRS data (FY2008,
FY2009, and FY2011) along with funding authorizations for those years for which it was not (FY2010
and FY2012). The table lists funding from the 2009 Omnibus Appropriations Act separately from
36 Data reported in this section regarding Congressional authorization and appropriations and Bush Administration budget
requests were culled from D. D. Stine (2008) “America COMPETES Act: Programs, Funding, and Selected Issues,” Congressional Research Service, RL34328, January 22, 2008, and D. D. Stine (2009) “America COMPETES Act: Programs, Funding, and Selected Issues,” Congressional Research Service, RL3428, April 17, 2009.

24
funding appropriated via the 2009 American Recovery and Reinvestment Act, which also occurred in
FY2009. Although the appropriations data are not complete, Table 5 and 6 make clear that many of the
programs authorized by the America Competes Act were not funded at authorized levels during the Table
6 also demonstrates that some of the programs created by the 2007 ACA obtained their first significant
appropriations through the 2009 American Recovery and Reinvestment Act. This is particularly true for
ARPA-E, which had been authorized for $300 million FY2008 and was envisioned in the Gathering
Storm report to receive as much as $1 billion in FY2009, but which was not funded in FY2008 and which
received only $15 million in regular appropriations in the FY2009 budget. (APRA-E did receive $400
million in 2009 ARRA funding, however.) Similarly, while the 2007 ACA created a number of new
STEM education programs, few received funding in FY2008 or FY2009. Overall, rather than following
the doubling-path described in the 2007 ACA, which would have required an approximately 10%-per-
year increase in funding for targeted accounts, only approximately 6.4% increases were realized during
this period.37
The fact that the 2007 ACA was not passed until after the FY2008 budget had been approved
may have played some role in the absence of funding for ACA programs in FY2008 the FY 2008 budget
process could have anticipated the passage of the ACA and incorporated its associated programs into the
appropriations process. In the wake of the 2008 financial crisis and subsequent recession, shifting
priorities in Congress certainly played a significant role in limiting the funding appropriated in the
remainder of the years authorized for funding by the 2007 ACT. Less than one percent of the funding
authorized for new STEM programs at the Departments of Education or Energy by the 2007 ACA was
appropriated by the of the FY2008 or FY2009 Omnibus Appropriations Acts.38 At the Department of
Education, for example, the Teachers for a Competitive Tomorrow (TCT) Baccalaureate Program and the
TCT Master’s Program had been authorized to receive more than $100 million in appropriations in both 37 Sargent, John F., Jr., (2011) “An Analysis of Efforts to Double Federal Funding for Physical Sciences and Engineering
Research,” Congressional Research Service, Report R41951. 38 The Department of Energy may have been able to fund some of the ACA programs, or programs with similar goals, through
discretionary spending in its own budget; however, such funding would not have come from direct appropriations to programs specified by the ACA.

25
FY2008 and FY2009, but each received only $1 million in each fiscal year. The Bush Administration’s
American Competitiveness Initiative and FY2008 budget requested $250 million for the Math Now
program and the 2007 ACA authorized $95 million in funding for the program FY2008; however, $0
were appropriated for the program in FY2008 and FY2009. Whereas approximately $500 million had
been authorized for Department of Education STEM programs in FY2008, only $4 million was
appropriated in FY2008 and FY2009 combined. The new Department of Energy STEM programs created
by the 2007 ACA were similarly unfunded, including the DOE’s Early Career Awards for Science,
Engineering, and Math Researchers; Protecting America’s Competitive Edge (PACE) Graduate
Fellowship Program, which had been authorized to receive more than $30 million.
The ACA had not authorized new STEM programs at the National Science Foundation, which
had, historically, distributed the majority of STEM education funds for higher education. However, the
Act had authorized major expansions to NSF STEM programs that were not specifically funded in the
FY2008 and FY2009 budgets. The NSF’s Research & Related Activities (“Research”) budget and
Education & Human Resources “(Education”) did, however, experience increased in appropriations
during this period in amounts large enough to enable the agency to devote some funds directly to
programs whose goals reflected those of the ACA, even if the NSF did not receive funds specifically
dedicated to ACA-specified programs. For example, Graduate Research Fellowship funding increased
substantially starting in 2009, receiving contributions from both the NSF Research and Education
accounts.
In addition to the STEM programs, a number of other ACA programs were unfunded or
underfunded relative to authorization levels by the FY2008 and FY2009 budgets, including the DOE’s
Discovery Science and Engineering Innovation Institutes.
The primary set of programs that did receive funding from FY2008 and FY2009 appropriations
were those associated with the National Institute of Standards and the National Science Foundation.

26
Programs funded at NIST included those historically central to the agency’s mission, including the
Scientific and Technical Research and Services (STRS) and Construction & Maintenance, and the
Manufacturing Extension Partnership as well as the ACA-created Technology Innovation Program, which
replaced the long-standing Advanced Technology Program. Indeed, NIST’s programs were funded above
ACA authorized levels and also received additional funding from the ARRA stimulus bill. The 2009
Omnibus Appropriations Act allocated less funding to the NSF and Department of Energy’s Office of
Science than had been authorized under the ACA. As a consequence of ARRA supplemental funding,
each of these agencies ultimately received greater FY2009 funding than had been scheduled under the
2007 ACA.
IV. America COMPETES Reauthorization Act (2010)
4.1 ACA 2010: Overview of key provisions
The funding authorized by the 2007 America COMPETES Act covered only the years FY2008,
FY2009, and FY2010. Thus, to continue the programs of the ACA2007, Congress either needed specific
legislation aimed at continuing the 2007 ACA programs or it needed to provide funding for those
programs along with other authorization packages. Whereas the ACA 2007 enjoyed relatively strong bi-
partisan support as it evolved, the effort to reauthorize the 2007 Act was substantially more difficult and
the debate more polarized. For example, the version of the reauthorization bill considered by the House
of Representatives was voted upon and failed twice before it was passed on a third try in late May 2010.39
The Senate passed an amended version late in December, leaving the House of Representatives to
consider the amended bill before the lame duck 111th Congress adjourned. It, indeed, passed The House
of Representatives passed the bill on the last day of the 111th Congress’s session. Whereas the House bill
39 Mervis, Jeffrey (2010) “Third Time's a Charm for COMPETES Bill,” ScienceInsider, May 28, 2010;
http://news.sciencemag.org/scienceinsider/2010/05/third-times-a-charm-for-competes.html; accessed March 9, 2012.

27
had authorized spending for five years, the Senate version, and the ultimate Act authorized only three
years of funding. The Senate bill also trimmed the funding authorization from the $85.6 billion authorized
in the House measure to approximately $45 billion.40
The resulting 2010 ACA retained the essential objectives of the 2007 Act, but did so with more
modest expectations for funding. The discussion below highlights the Act’s key features and describes
their implementation:
(1) The Doubling Path: The retained the aim of doubling nominal science and technology funding
for the physical sciences relative to the 2006 benchmark, but extended the timing of the expected
doubling path from seven to ten years. The 2010 Act also retained the focus on increasing
funding for NIST, the NSF, and Department of Energy’s Office of Science. The FY2013 budgets
authorized for the NSF and DOE Office of Science by the 2010 ACA were approximately $8.3
billion and $6.0 billion, amounts that represented only a few percentage point increase relative to
the FY2010 budgets authorized by the 2007 COMPETES Act. The much-smaller NIST budget
FY2013 was authorized for a 15 percent increase relative to the ACA 2007 FY2010 amount and
was scheduled to increase to $676 billion by FY2013.
(2) STEM Education: Like the original 2007 Act, the 2010 ACA addressed a number of STEM
education issues. Specifically, the Act (a) charged the OSTP with a leadership role in
coordinating federal STEM education efforts, (b) directed agencies to undertake efforts related to
STEM education initiatives, particularly related to underrepresented minorities, and (c)
authorized funding for STEM education programs. Section 101 of the Act required the OSTP to
coordinate STEM education under the National Science and Technology Council (NSTC) and
Congress requested both a five-year plan and an annual report on STEM education. Efforts at
40 Reich, Eugenie Samuel (2010) “US Congress passes strategic science bill,” Nature, Published online 22 December 2010,
http://www.nature.com/news/2010/101222/full/news.2010.693.html, accessed March 9, 2012. Although the version of the ACA 2010 that first passed in the House consisted of a five year funding authorization, the Committee had previously supported three year authorizations as well.

28
ensuring additional educational opportunities for underrepresented minorities were included in
the Titles of the 2010 Act for a number of agencies, including, for example, the National Oceanic
and Atmospheric Administration (Section 302). Further, the NSF was instructed to support
grants for research and STEM education at historically black colleges, tribal colleges, and
Hispanic-serving institutions of higher education. The 2010 Act consolidated funding in a
smaller number of programs and eliminated a series of programs that had been authorized by the
2007 ACA but not funded subsequently. The 2010 Act concentrated STEM education funding to
a greater degree in the NSF and a lesser degree in the Departments of Energy and Education and
authorized less funding for STEM education than the 2007 Act. The ACA did authorize $10
million in funding to support individuals pursing higher education in STEM fields simultaneously
with teacher certification.
(3) ARPA-E: The Advanced Research Projects Agency – Energy at the Department of Energy was
extended by the 2010 Act. $300 million was authorized for funding the agency in fiscal year
FY2011. The amount of the authorization was increased by $6 million in FY2012 and another $6
million in FY2013.
(4) Prizes: One notable addition to the America COMPETES framework was the stipulation that,
“each head of an agency, or the heads of multiple agencies in cooperation, may carry out a
program to award prizes competitively to stimulate innovation that has the potential to advance
the mission of the respective agency” (Section 105). This idea had been advanced in the Obama
Administration’s 2009 Strategy for American Innovation.41 Although prizes for innovations are
not new, either in theory or in practice, prizes have received increasing attention from academics,
41 National Economic Council & Office of Science and Technology Policy (2009) A Strategy for American Innovation: Driving
towards Sustainable Growth and Quality Jobs. Washington, DC: Executive Office of the President.

29
policymakers, and businesses over the past decade.42 The 2010 ACA was broke new ground in
specifying that innovation inducement prizes could be offered by all federal agencies, subject to
the discretion of each agency director. The Act does not place specific limitations on the amounts
of prizes. It does, however, specified that prizes could not be offered unless sufficient federal
funds had already been appropriated or if private funds had been committed in writing.43 The Act
also requires that Congress be notified in writing 30 days before the approval of any prize greater
than $50,000 and that Agency directors must specifically approve funding for any prize in excess
of $1,000,000.
(5) Other programs: In addition to its support for the programs identified above, the 2010 ACA
established a number of new federal programs. The Act established the Regional Innovation
Program at the Department of Commerce, including a component aimed at supporting regional
innovation by providing loan guarantees for science and research parks. Another program created
in the Department of Commerce offered federal loan guarantees for small- and medium-sized
enterprises engaged in the manufacture of innovative technologies. The Act also included the
NIST Grants for Energy Efficiency, New Job Opportunities, and Business Solutions Act of 2010
(included in the 2010 ACA as the “NIST GREEN JOBS Act of 2010”), which enabled projects
related to energy efficiency to be funded under the Hollings Manufacturing Extension Partnership
(MEP) Program.
4.2 ACA 2010 Funding & Implementation
42 See Gallini, Nancy and Suzanne Scotchmer, (2002) Intellectual Property: When Is It the Best Incentive System, Cambridge:
MA: Thomas Kalil (2006) “Prizes for technological innovation,” Discussion Paper 2006-08, The Hamilton Project, The Brookings Institution; MIT Press.; Michael Kremer and Heidi Williams (2010) “Incentivizing innovation: Adding to the toolkit," in Josh Lerner and Scott Stern, eds., Innovation Policy and the Economy, Volume 10, University of Chicago Press, 1-17; Brunt, Liam, Josh Lerner, and Tom Nicholas (2012) “Inducement Prizes and Innovation,” Journal of Industrial Economics, forthcoming; Kevin J. Boudreau , Nicola Lacetera, & Karim Lakhani (2011) “Incentives and Problem Uncertainty in Innovation Contests: An Empirical Analysis,” Management Science, 57(5), 843-863; and Heidi Williams (2012) “Incentives, prizes, and innovation, MIT working paper. Note that many of these papers build on Brian Wright (1983) “The economics of invention incentives: Patents, prizes, and research contracts," American Economic Review, 73(4), 691-707.
43 Private funding of federal prizes, including matching funding, was specifically enabled the by Act; however, the Act was careful to note that private entities were not entitled to obtain consideration in exchange for inducement prize funding. (P.L. 111-358, Section 105).

30
As was case with the 2007 America COMPETES Act and FY2008 appropriations, the 2010
America COMPETES Reauthorization Act was not signed into law until after its fiscal year
appropriations process, FY2011, had been begun. Moreover, the 2010 ACA was passed during a period
of intense Congressional debate about the federal budget, the budget deficit, and the extent of federal
debt. In the wake of the 2008 financial crisis, ensuring recession, and shift from a Democratic majority to
a Republican majority in the House of Representatives in 2010, partisanship was on the rise in the 111th
Congress. In addition to the general trend in partisanship, the ability to agree on science and technology
policy in the House Committee on Science, Space, and Technology, the committee responsible for both
the ACA 2007 and ACA 2010 legislation, was made more difficult by key retirements.44 Bart Gordon
(D-TN), sponsor of both the ACA 2007 and ACA 2010 retired in 2010, as did physicist Vernon Ehlers
(R–MI), ranking member of the Subcommittee on Research and Science Education.
While Congress was willing to authorize $45.6 billion in ACA funding, it would not appropriate
that amount. As a consequence of Congress’s response to prevailing economic and political
circumstances, few of the programs authorized in the 2010 were funded by FY2011 appropriations. For
example, the Teachers for a Competitive Tomorrow program, which had been authorized for more than
$275 million ($151.20 million for the Baccalaureate program and another $125 million for the Master’s
program) received $0 in FY2011 appropriations, after having received approximately $2 million in
FY2010 and $2 million in FY2012. Table 7 lists programs authorized for funding by the 2010 ACA for
which there were no specific appropriations were funded in FY2012.
Not all ACA 2010 programs were unfunded or underfunded relative to authorizations, however.
The Manufacturing Extension Program (MEP), for example, received 3.0% ($128.4 million) more
funding in FY2011 than it had in FY2010 ($124.7 million). After receiving $0 in FY2010 appropriations,
ARPA-E received $179.6 million in FY2011 appropriations, marking the first time that the ACA 2007
44 Julie Palakovich Carr (2010) “Major Changes in Congress May Mean Major Changes for Science Policy,” BioScience,
60(10), 786.

31
program had received appropriations outside of the 2009 ARRA Act. ARPA-E’s funding was increased
to an estimated $275 million in FY2012.
V. A Half Decade of The America COMPETES Act: A Review and Initial Assessment
Although the America COMPETES Act was introduced in 2007 with wide-ranging optimism, the
impact of the Act and subsequent Reauthorization in 2010 has been less substantial than initially hoped.
Although a number of signature initiatives have begun to develop, including the ARPA-E and federal
prize authority, many of the programs, including numerous STEM initiatives at the Department of
Education have not received funding at levels authorized by the ACA legislation. As the United States
Congress engages deliberations over FY2013 appropriations, the final fiscal year in which the ACA 2010
authorizes science and technology funding, it remains unclear whether the vision for the ACA outlined in
the Gathering Storm report, the Bush Administration’s American Competitiveness Initiative, and
subsequently embraced by the Obama Administration’s Innovation Strategy, will be realized. This
sections reviews the America COMPETES Act’s signature initiatives, reviews their implementation to
date, and assesses the likely impact of those initiatives on U.S. science and technology outputs and
associated economic measures.
V.1 The Doubling Path
One of the signature initiatives of the ACA 2007 and ACA 2010 and one of the bolder visions of
its supporters was the aim of doubling federal funding for the physical sciences, in nominal terms, relative
to the FY2006 base year. Initially targeted for achievement within seven years, the aspirations for the
doubling path were revised downward during the implementation of the 2007 Act and have been
subsequently loosened since. Figure 2 tracks the potential doubling of federal funding for science and
technology in the agencies targeted for doubling, the National Science Foundation, Department of
Energy’s Office of Science, and the National Institute for Standards and Technology’s Core Research and

32
Construction. The figure traces (in grey) paths for doubling federal funding over seven years, ten years,
eleven years, and fifteen years. It also identifies (in color) the paths specified by the COMPETES Acts,
presidential budget requests, OMB projections, and actual spending. The Bush Administration funding
requests (FY2007-FY2009, burgundy line) follow the ten-year doubling path outlined in the American
Competitiveness Initiative. Expectations for the doubling path were raised by the 2007 ACA (FY2008-
FY2010, orange line), which were to follow the seven-year doubling target. Actual appropriations (green
line) in FY2007 and FY2008 followed a fifteen-year doubling path, but were boosted in FY2009 and
FY2010, reaching a trajectory for eleven-year doubling, even without including FY2009 ARRA funding.
The Obama Administration budget requests for FY2010, FY2011, and FY2011 (blue line) followed the
eleven-year doubling trajectory, as did the authorizations of the 2010 America COMPETES
Reauthorization Act. However, actual appropriations in FY2011 (and subsequently in FY2012, not
pictured) departed significantly from the doubling path. The Obama Administration’s FY2013 budget
requests an increase in funding for the doubling agencies of 4.1%. Annual 10% per year increases would
be required to ensure a seven-year path and 7% per year increases would be required to sustain a ten-year
doubling path; were the Administration’s FY2013 request of a 4.1% increase in funding for these
agencies and programs, the time period required to double nominal federal funding for the physical
sciences relative to the FY2006 base would be approximately eighteen years.45 Considering the FY2011-
FY2012 trajectory, the Obama Administration’s FY2013 budget request, and Office of Management and
Budget projections for FY2013 and FY2016, it seems fair to conclude that the effort to double federal
funding for the physical sciences has been put on hold, if not abandoned.
The Gathering Storm Report, American Competitiveness Initiative, and America COMPETES
Acts each considered 2006 as the baseline relative to which to compare future federal funding for physical
science and engineering. Table 8 and Figure 3 compare federal funding during the COMPETES Act
period (2007-2012) with that of funding in the pre-ACA period (2002-2006), using nominal dollars.
45 For additional details, see Heather B. Gonzalez, “America COMPETES 2010 and the FY2013 Budget,” CRS42430, 20-
March-2012.

33
These data suggest that, relative to 2002-2006, federal funding for the “doubling accounts” has not
accelerated in a substantial way during the ACA era.
While the COMPETES legislation does not appear to have accelerated federal funding for
physical science and engineering research, the conclusion that the legislation has failed to support such
research efforts may be overstated. U.S. federal spending has not matched authorized spending levels and
has lagged relative to the rates of growth of investment in China, which has undertaken a massive effort
to expand its universities and overall science and innovation infrastructure.46 Physical science and
engineering research funding and overall science funding has, however, managed to avoid cuts in
spending that have affected other domestic, discretionary spending programs. For example, the
Department of Education has experienced budget reductions since 2005 and budget authority for many of
the Department of Commerce’s programs not related to physical science and engineering research,
including the Economic Development Administration, Inspector General’s office, Economic and Statistics
Administration, International Trade Administration, and Bureau of Industry and Security, experienced flat
funding or funding decreases in recent years.47 Thus, while we cannot interpret the funding and program
development associated with the ACA as substantially accelerating the rate of federal investment in
physical sciences, it would not be unreasonable to conclude that the support that coalesced around the
Acts may have prevented reductions in the rate of federal investment in such research efforts.
V.2 STEM Education
The second effort most-closely associated with the America COMPETES Acts was the aim of
improving U.S. support for STEM education. The 2007 ACA and 2010 ACA authorized the creation and
funding of numerous programs devoted to improving STEM teacher training, increasing the number of 46 See, e.g., Li, Y., J. Whalley, S. Zhang and X. Zhao (2008), ''The Higher Educational Transformation of China and Its Global
Implications”, NBER Working Paper #13849 and Gaule, Patrick and Mario Piacentini (2012) “Immigration and innovation: Chinese graduate students in U.S. universities,” Review of Economics and Statistics, forthcoming.
47 Department of Education (2012), Budget History Tables, http://www2.ed.gov/about/overview/budget/history/index.html; data for Department of Commerce based on summary of FY2010-FY2012 Budget Authority, http://www.osec.doc.gov/bmi/budget/FY12BIB/BA-OUTLAYS.pdf.

34
STEM-trained graduates, and creating opportunities for underrepresented minorities to pursue STEM
education. In the time since the 2007 ACA, however, few of these new initiatives have received regular
funding. For example, the Teachers for a Competitive Tomorrow: Baccalaureate Degrees and Master’s
Degrees programs, which were authorized by both COMPETES Acts, received annual average funding of
approximately $1 million, although each had been authorized to receive more than $100 million in each
fiscal year. Many programs, including the Department of Energy’s Experiential-Based Learning
Opportunities; Early Career Awards for Science, Engineering, and Mathematics Researchers; Discovery
Science and Engineering Innovation Institutes; Protecting America’s Competitive Edge (PACE) Graduate
Fellowship Program; and Distinguished Scientist Program, each of which was authorized for between $10
million and $30 million in funding in FY2010, remained unfunded. Although fewer STEM education
programs were created by the 2010 ACA 2010, many of these also went unfunded in subsequent years,
including the NSF’s STEM-Training Grant Program, which had been authorized for approximately $10
million in annual funding, and the Department of Education’s Alignment of Education Programs, for
which approximately $125 million had been authorized annually.
The National Science Foundation plays a particularly important role in the federal portfolio of
STEM education programs. More than one-third of the total estimated $3.4 billion in FY2010 STEM
education investments were undertaken by the NSF.48 Despite the winnowing of STEM education
programs authorized by the COMPETES Acts, the NSF continuing investments in STEM education
during the ACA period. The NSF Education and Human Resources (EHR) program received an
estimated $829.00 million in FY2012. The EHR budget had increased a minimum of 3% and a maximum
of 10% between FY2008 and FY2011 before decreasing (in estimation) by nearly 4% between FY2011
and FY2012. In addition, although the real amount of NSF funding targeted by Congress for education
48 National Science and Technology Council (2011) “The Federal Science, Technology, Engineering, and Mathematics (STEM)
Education Portfolio,” Committee on STEM Education, Fast-Track Action Committee on Federal Investments in STEM Education, Executive Office of the President, December 2011, p. 5, http://www.whitehouse.gov/sites/default/files/microsites/ostp/costem__federal_stem_education_portfolio_report.pdf, referenced in Gonzalez, Heather B. (2012) “An Analysis of STEM Education Funding at the NSF: Trends and Policy Discussion,” Congressional Research Service reports, 9 April 2012.

35
and training purposes has decreased from 2003 to 2011, the NSF was able to continue its support for
STEM education initiatives by increasing the fraction of funding derived from its Research & Related
Activities account (RRA, or Research account), whose nominal funding levels rose from slightly more
than $4 billion in 2003 to approximately $5.5 billion in 2011.49 These funds enabled the NSF to continue
to increase its investments in postsecondary student funding, through the Graduate Research Fellowship
(GRF) and Integrative Graduate Education and Research Traineeship (IGERT) programs.
While the NSF has been able to continue funding programs consistent with the spirit of the
COMPETES legislation, its lack of targeted ACA funding and its relatively flat funding for education and
training, other than the increases enabled by rising Research account funding, have not enabled NSF to
provide the boost to overall STEM education funding authorized by the COMPETES Acts. Thus,
although STEM education continues to be a focus of federal policy discussion and is, ostensibly,
supported by public opinion, Congress, and the current Administration, it is fair to conclude that the
overall impact of the America COMPETES Act on STEM education funding has not been consequential
in the period 2007-2012.
Although both COMPETES Acts emphasizes STEM education funding levels, the Acts also
articulated policy changes designed to improve STEM education that did not depend fully on rapidly
increased funding. One such policy was the requirement that the President’s National Science and
Technology Council take a lead role in efforts to coordinate federal STEM education. The NTSC issued a
preliminary report on its efforts in February 2012 that identified federal STEM education goals and
articulated an approach to achieving those goals.50 It is worth noting, however, that the NTSC also
played a role in evaluating and providing guidance to STEM policy prior to the ACA.51
49 Gonzalez, Heather B. (2012) “An Analysis of STEM Education Funding at the NSF: Trends and Policy Discussion,”
Congressional Research Service reports, 9 April 2012. 50 National Science and Technology Council (2012) “Coordinating Federal Science, Technology, Engineering, and Mathematics
(STEM) Education Investments: Progress Report,” Committee on STEM education, Federal Coordination in STEM Education Task Force http://www.whitehouse.gov/sites/default/files/microsites/ostp/nstc_federal_stem_education_coordination_report.pdf.
51 National Science and Technology Council (2006) “Review and Appraisal of the Federal Investment in STEM Education Research,” National Science and Technology Council Committee on Science Subcommittee on Education and Workforce, http://www.whitehouse.gov/files/documents/ostp/NSTC%20Reports/STEMEducationResearchOctober06.pdf.

36
One of the STEM education provisions in the 2010 ACA was the provision of competitive grants
to states that improved their educational data systems. Although the funding for this program has been
haphazard, $250 million was provided for this effort by the ARRA, and 41 states have developed data
systems that meet the 2010 ACA’s requirements.52 Such data resources could prove to be valuable assets
in investigating the quality of instruction, schools, and educational policies. Indeed, academic research is
beginning to take advantage of these data.53
V.3 ARPA-E
The Advanced Research Projects Agency-Energy (ARPA-E) at the Department of Energy
constitutes a third component that was embraced by both COMPETES Acts, the Gathering Storm Report,
and the American Competitiveness Initiative. The agency was created in the 2007. It received $15
million in the FY2009 budget, but did not receive substantial funding until the 2009 ARRA appropriated
$400 million, which enabled ARPA-E to begin to solicit research proposals and fund research projects.
ARPA-E’s did not receive appropriations in FY2010, although it did receive nearly $180 million in
FY2011 and an estimated $275 million in FY2012. These funding levels have enabled ARPA-E to award
$521.7 million in grants to approximately 180 awardees as of March 2012. The agency issued a call for
$150 million in additional proposals in March 2012.54 In addition to its research funding, the Agency has
held three Energy Innovation Summits that showcase research by ARPA-E awardees, applicants, and
other contributors. Although the overall level of funding for ARPA-E has not reached the levels
envisioned by The Gathering Storm and is substantially lower than the DARPA annual budget ($3.2
billion), ARPA-E can be considered as an important outcome associated with the COMPETES Acts,
particularly in light of the fact that the total estimated annual U.S. investment in energy-related R&D is
52 Department of Education (2012) “Statewide Longitudinal Data Systems,” http://www2.ed.gov/programs/slds/factsheet.html. 53 Schenk, Tom L. and Kiyokazu Matsuyama (2010) “Calculating Returns to Degree Using Student Longitudinal Data
Systems,” working paper, SSRN, http://papers.ssrn.com/sol3/papers.cfm?abstract_id=1666465. 54 ARPA-E (2012) “ARPA-E issues open call for transformational energy technologies,” March 2, 2012, http://arpa-
e.energy.gov/media/news/tabid/83/vw/1/itemid/49/Default.aspx; accessed March 2012.

37
approximately $5.1 billion.55 It is currently too early to assess the impact of ARPA-E on energy
innovation; however, studies like those conducted by Erica Fuchs of the nature of DARPA research56 and
could be insightful and could set the stage for further evaluations of ARPA-E’s performance.
V.4. Prizes
Federal agencies were given latitude to develop inducement prizes under the 2010 COMPETES
Reauthorization Act. Numerous agencies, including the Department of Defense, Department of Energy,
Environmental Protection Agency, and NASA had sponsored prizes prior to the ACA 2010, including a
number of prizes of value greater than $2 million.57 The ACA 2010 offers federal agencies the authority
to conduct prizes up to $50 million with existing appropriations. The approval of prize authority has led
to the establishment of a clearinghouse for federal prize programs, www.challenge.gov, which posts prize
descriptions, eligibility conditions, submissions procedures, timelines, and rules. As of March 2012,
www.challenge.gov hosted more than 150 prize challenges, representing more than forty federal
agencies.58 One of the most ambitious federal prize efforts was an initiative sponsored by the Department
of Health and Human Services. Called the “Investing in Innovation” (i2) initiative, the effort involved a
novel $5 million effort aimed at initiating innovations in Health Information Technology. A number of
federal prize programs, most notably those operated by NASA, have already become the subject of
academic study.59
55 President’s Council of Advisors on Science and Technology (2010) “Report to the President on accelerating the pace of
change in energy technologies through an integrated federal energy policy,” November 10, 2010; http://www.whitehouse.gov/sites/default/files/microsites/ostp/pcast-energy-tech-report.pdf; accessed January 2012.
56 Erica R.H. Fuchs (2010) “Rethinking the role of the state in technology development: DARPA and the case for embedded network governance,” Research Policy, 39(9), 1133-1147.
57 Deborah Stine (2009) “Federally-Funded Innovation Inducement Prizes,” Congressional Research Services Report, R40677, June 29, 2009.
58 Office of Science and Technology Policy (2012) “Implementation of Federal Prize Authority: Progress Report,” Executive Office of the President, March 2012.
59 See, in particular, the work of Karim Lakhani and colleagues, including Kevin J. Boudreau, Nicola Lacetera, & Karim Lakhani (2011) “Incentives and Problem Uncertainty in Innovation Contests: An Empirical Analysis,” Management Science, 57(5), 843-863.

38
The extent of federal prize programs continues to grow and it is too soon to measure the overall
impact of such programs on innovation. The current scope of prize funding is many orders of magnitude
smaller than federal intramural research programs; however, it is possible that success with federal prizes
may contribute to momentum for yet larger attempts at inducements, such as those described by Kremer
and colleagues.60 More broadly, the opportunity for federal agencies to conduct innovation challenges
affords greater latitude for organizational innovation than existed in the past. It is possible that the seeds
sown by expanded federal prize authority will redound in ways that exceed the specific dollar value of
prizes offered by federal agencies; at the moment, however, it is too soon to evaluate either this
possibility or the specific impact of federal prize authority on innovation.
V.5. Concluding Statements
Compared to the grand expectations associated with the development and introduction of the
America COMPETES Acts, the accomplishments of the legislation thus far appear relatively modest. The
financial crisis, associated recession, and their political impact exerted a substantial impact on the
implementation of ACA programs. Indeed, as Figure 4 shows, the U.S total real federal investment in
science and technology agencies has not appreciated in the past decade. Thus, we can conclude with
confidence that the concerns that prompted The Gathering Storm report, American Competitiveness
Initiative, and America COMPETES legislation have not been allayed by the implementation of the Acts
so far. Indeed, broader questions regarding the impact of the globalization of science and technology on
U.S. innovation, competitiveness, employment, and overall social welfare loom remain in the wake of the
ACA’s limited implementation.
60 Michael Kremer and Heidi Williams (2010) “Incentivizing innovation: Adding to the toolkit," in Josh Lerner and Scott Stern,
eds., Innovation Policy and the Economy, Volume 10, University of Chicago Press, 1-17.

39
While evidence does not support the conclusion that the ACA resulted in significantly increased
funding for physical science and engineering research, it is less clear what would have happened in the
absence of the ACA. At a minimum, the COMPETES legislation demonstrated “sense of Congress” to
two Presidential administrations and to the American public that, despite differences in degree, both
parties support increases in federal funding for basic research in physical sciences and engineering. This
consensus has enabled these research areas to avoid significant cuts in federal funding, even during
difficult economic and budgetary conditions. In addition, the ACA has resulted in increased funding and
potentially important successes in a couple of key areas, including energy research concentrated in the
ARPA-E and funding for innovation prizes that involve public and private partnerships. In addition, the
Acts articulate a framework for coordinating federal STEM education efforts and send strong signals
regarding the federal government’s support for entrepreneurship, regional clusters, and the
commercialization of federally-sponsored research.

40
Table 1. U.S. Federal Spending and Federal R&D Spending, FY1970-FY2012
(billions of FY2011 dollars)
FY1970 Actual
FY1980 Actual
FY1990 Actual
FY2000 Actual
FY2012 Budget
Composition of Federal Spending Mandatory Programs 287 628 888 1,207 2,197
Net Interest 68 126 288 283 207 Defense Discretionary 386 322 469 374 761 Nondefense Discretionary 180 339 313 406 655 Total Federal Spending 921 1,415 1,959 2,269 3,819
Federal R&D Programs Defense Discretionary 39 36 65 53 85
Nondefense Discretionary 35 40 37 47 68 Total Federal R&D Spending 74 76 102 100 153
Composition of Federal Spending Mandatory Programs 31.2% 44.4% 45.3% 53.2% 57.5% Net Interest 7.4% 8.9% 14.7% 12.5% 5.4% Defense Discretionary 41.9% 22.8% 24.0% 16.5% 19.9% Nondefense Discretionary 19.6% 24.0% 16.0% 17.9% 17.1% Total Federal Spending 100% 100% 100% 100% 100%
Federal R&D Spending as Percent of Discretionary Spending Defense 10.1% 11.1% 13.9% 14.1% 11.2% Nondefense 19.6% 11.9% 11.8% 11.5% 10.4% Total R&D as % of Discretionary Spending 13.1% 11.5% 13.0% 12.8% 10.8%
Federal R&D Spending as Percent of GDP Defense R&D 0.30% 0.20% 0.50% 0.40% 0.50% Nondefense R&D 0.30% 0.30% 0.30% 0.30% 0.40% Total R&D as % of GDP 0.50% 0.50% 0.70% 0.70% 0.90%
Source: adapted from Table I-3, AAAS Intersociety Working Group (2012) AAAS Report XXXVI: Research & Development: FY2012, Washington, DC: American Association for the Advancement of Science.

41
Table 2a. Federal R&D Spending, by category (FY2010 and FY2012, millions of current dollars)
FY 2010 Actual
FY2012 Budget
Percent of 2012 Total
Defense vs. Non-defense R&D spending Defense 86,756 82,275 55.30%
Nondefense 62,539 66,619 44.70% Categories of Non-defense R&D spending
Health 32,423 33,420 22.40% General Science 10,776 12,066 8.10% Space 8,853 9,520 6.40% Energy 2,553 3,623 2.40% Environment 2,439 2,454 1.60% Agriculture 2,243 1,804 1.20% Transportation 1,506 1,535 1.00% Commerce 671 1,008 0.70% All Other 798 878 0.60% International 194 196 0.10% Justice 84 115 0.10% Total R&D (Defense + Not) 149,295 148,894 100.00%
Source: Table I-4, AAAS Intersociety Working Group (2012) AAAS Report XXXVI: Research & Development: FY2012, Washington, DC: American Association for the Advancement of Science.
Table 2b. Federal R&D, by agency (FY 2009, millions of current dollars) Agency FY2009 % of Total Department of Defense 68,230.2 49.8% Department of Health and Human Services 35,735.9 26.1% Department of Energy 11,562.2 8.4% National Science Foundation 6,924.8 5.1% National Aeronautics & Space Administration 5,937.1 4.3% Department of Agriculture 2,347.2 1.7% Department of Commerce 1,533.3 1.1% Department of Homeland Security 983.6 0.7% Department of Transportation 846.3 0.6% Department of the Interior 738.8 0.5% Environmental Protection Agency 552.8 0.4% Department of Veterans Affairs 510.0 0.4% Department of Education 322.4 0.2% Smithsonian Institution 226.7 0.2% Agency for International Development 160.1 0.1% All other agencies 385.1 0.3% Total 136,996.5 100.0%
Source: National Science Foundation, Science & Engineering Indicators, 2012, Table 4-16.

42
Table 3. Gross domestic expenditures on R&D (GERD), by selected country and region
Country/Region GERD (PPP $millions) GERD/GDP (%) United States 401,576.5 2.88 China 154,147.4 1.70 Japan 137,908.6 3.33 Germany 82,730.7 2.78 France 47,953.5 2.21 South Korea (2008) 43,906.4 3.36 United Kingdom 40,279.5 1.85 Russian Federation 33,368.1 1.24 Italy 24,752.6 1.27 India (2007) 24,439.4 0.76 Brazil (2008) 21,649.4 1.08 Taiwan 21,571.8 2.93 Spain 20,496.4 1.38 Australia (2008) 18,755.0 2.21 Israel 8,810.1 4.28 Finland 7,457.8 3.96 Denmark 6,283.8 3.02 Singapore 5,626.5 2.35 South Africa (2008) 4,689.3 0.93 Ireland 3,164.6 1.79 Greece (2007) 1,867.9 0.59 EU 297,889.6 1.90 OECD (2008) 965,629.1 2.33 G-20 countries 1,181,263.7 2.01 Note: FY is 2009 unless otherwise noted. Source: adapted from National Science Foundation, Science & Engineering Indicators, 2012, Table 4-19.

43
Table 4. Summary of Recommendations of National Academies Report, The Gathering Storm
• Recommendation A: Increase America’s talent pool by vastly improving K–12 science and mathematics education. - Action A-1: Annually recruit 10,000 science and mathematics teachers by awarding 4-year scholarships and
thereby educating 10 million minds - Action A-2: Strengthen the skills of 250,000 teachers through training and education programs at summer
institutes, in master’s programs, and in Advanced Placement (AP) and International Baccalaureate (IB) training programs
- Action A-3: Enlarge the pipeline of students who are prepared to enter college and graduate with a degree in science, engineering, or mathematics by increasing the number of students who pass AP and IB science and mathematics courses.
• Recommendation B: Sustain and strengthen the nation’s traditional commitment to long-term basic research that has the potential to be transfor mational to maintain the flow of new ideas that fuel the economy, provide security, and enhance the quality of life.
- Action B-1: Increase the federal investment in long-term basic research by 10% each year over the next 7 years through reallocation of existing funds or, if necessary, through the investment of new funds.
- Action B-2: Provide new research grants of $500,000 each annually, payable over 5 years, to 200 of the nation’s most outstanding early-career researchers.
- Action B-3: Institute a National Coordination Office for Advanced Research Instrumentation and Facilities to manage a fund of $500 million in incremental funds per year … to ensure that universities and government laboratories create and maintain the facilities, instrumentation, and equipment needed for leading-edge scientific discovery and technological development.
- Action B-4: Allocate at least 8% of the budgets of federal research agencies to discretionary funding. - Action B-5: Create in the Department of Energy an organization like the Defense Advanced Research Projects
Agency (DARPA) called the Advanced Research Projects Agency-Energy (ARPA-E). - Action B-6: Institute a Presidential Innovation Award to stimulate scientific and engineering advances in the
national interest. • Recommendation C: Make the United States the most attractive setting in which to study and perform research so that
we can develop, recruit, and retain the best and brightest students, scientists, and engineers from within the United States and throughout the world.
- Action C-1: Increase the number and proportion of US citizens who earn bachelor’s degrees in the physical sciences, the life sciences, engineering, and mathematics by providing 25,000 new 4-year competitive undergraduate scholarships each year to US citizens attending US institutions.
- Action C-2: Increase the number of US citizens pursuing graduate study in “areas of national need” by funding 5,000 new graduate fellowships each year.
- Action C-3: Provide a federal tax credit to encourage employers to make continuing education available (either internally or through colleges and universities) to practicing scientists and engineers.
- Action C-4: Continue to improve visa processing for international students and scholars - Action C-5: Provide a 1-year automatic visa extension to international students who receive doctorates or the
equivalent in science, technology, engineering, mathematics, or other fields of national need at qualified US institutions to remain in the United States to seek employment. If these students are offered jobs by US-based employers and pass a security screening test, they should be provided automatic work permits and expedited residence status.
- Action C-6: Institute a new skills-based, preferential immigration option. - Action C-7: Reform the current system of “deemed exports
• Recommendation D: Ensure that the United States is the premier place in the world to innovate; invest in downstream activities such as manufacturing and marketing; and create high-paying jobs based on innovation by such actions as modernizing the patent system, realigning tax policies to encourage innovation, and ensuring affordable broadband access.
- Action D-1: Enhance intellectual-property protection for the 21st century global economy - Action D-2: Enact a stronger research and development tax credit to encourage private investment in innovation. - Action D-3: Provide tax incentives for US-based innovation. - Action D-4: Ensure ubiquitous broadband Internet access.

44
Table 5 – Overview of FY2009 Funding Authorizations for 2007 America COMPETES Act Programs
Funding includes both FY2009 Omnibus Appropriations Act and American Recovery and Reinvestment Act
Programs Presumably Not Funded in FY2009 Programs Funded at Authorized Levels in FY2009
Department of Energy
• Pilot Program of Grants to Specialty Schools for Science and Mathematics
• Experiential Based Learning Opportunities • Summer Institutes • National Energy Education Development • Nuclear Science Talent Expansion Program • Hydrocarbon Systems Science Talent
Expansion Program • Early Career Awards for Science, Engineering,
and Mathematics Researchers • Discovery Science and Engineering Innovation
Institutes • Protecting America’s Competitive Edge
Graduate Fellowship Program • Distinguished Scientist Program
Department of Education
• Advanced Placement & International Baccalaureate Program
• Math Now • Summer Term Education Program • Math Skills for Secondary Skill Students • Advancing America Through Foreign
Language Partnership Program • Mathematics and Science Partnership Bonus
Grants National Science Foundation
• Laboratory Science Pilot Program
Department of Energy • Office of Science
National Science Foundation • Research & Related Activities • Major Research Instrumentation • Professional Science Master’s Degree Program • Robert Noyce Teacher Scholarship Program • Graduate Research Fellowship Program • Major Research Equipment and Facilities
Construction NIST • Scientific & Technical Research and Services • Construction & Maintenance
Source: Deborah D. Stine (2009) “America COMPETES Act: Programs, Funding, and Selected Issues,” Congressional Research Service, RL3428, April 17, 2009.

45
Table 6. Programs & Funding Status of America COMPETES Act (2007 & 2010) Programs (millions of dollars) Note that data for some years are appropriated, while others are estimated or requested amounts.
* = new program (note: The Technology Innovation Partnership was a new program that replaced the old, Advanced Technology Partnership) "^" = not included" or "not defined"; these programs are specifically mentioned in the source documents as being not included in authorization or appropriation acts. Programs without entries for particular Fiscal Years are not mentioned in the documents summarizing funding for those programs in those years. Sources: FY2008-2009 data, including ARRA = Table 2, "America COMPETES Act," D.D. Stine, CRS-RL34328, 4-17-2009; FY2010 data = "America COMPETES Act and the FY2010 Budget," John F. Sargent, Jr. CRS-R40519, 09-16-2010; FY2011 Appropriations & FY2012 Authorization data = Table 1, "America COMPETES 2010," H. B. Gonzalez, CRS-R41906, 11-22-2011; FY2012 Estimated & FY2013 Authorized data = "America COMPETES 2010 and the FY2013 Budget," Heather B. Gonzalez, CRS42430, 20-March-2012.
ProgramFY2008
AppropriatedFY2009
AppropriatedFY2009 ARRA
FY2010 Estimated
FY2010 Authorized Programs
FY2011 Appropriated
FY2012 Estimated
FY2012 Authorized
FY2013 Authorized
Department of Energy Department of EnergyOffice of Science 4,035.60 4,757.60 1,600.00 4,903.70 5,814.00 Office of Science 4,842.70 4,873.60 5,614.00 6,000.70Advanced Research Projects Agency— Energy*
~ 15.00 400.00 0.00 as needed Advanced Research Projects Agency - Energy 179.60 275.00 306.00 312.00
Department of Education Department of EducationTeachers for a Competitive Tomorrow: Baccalaureate*
0.98 1.10 ^ 1.10 151.20 Teachers for a Competitive Tomorrow – BA ^ ^ 2.00 2.00
Teachers for a Competitive Tomorrow: Master’s*
0.98 1.10 ^ 1.10 125.00 Teachers for a Competitive Tomorrow – MA ^ ^ 2.00 2.00
Department of Commerce Department of CommerceNational Institute of Standards and Technology
National Institute of Standards and Technology 878.60 750.8 1039.7
Scientific & Technical Research and Services (STRS)
440.50 472.00 222.00 515.00 548.80 Scientific & Technical Research & Services 507.00 567.00 661.10 676.70
Construction & Maintenance 160.50 172.00 360.00 147.00 49.70 Construction of Research Facilities 69.90 55.40 84.90 121.30Industrial Technology Services 173.30 224.80 224.80
Technology Innovation Partnership (TIP)*
65.20 65.00 69.60 140.50 Technology Innovation Partnership (TIP)* eliminated eliminated eliminated
Manufacturing Extension Partnership (MEP)
124.70 Manufacturing Extension Partnership (MEP) 128.40 128.40 155.10 165.10
NIST Green Jobs Act of 2010* ^ 7.00Dept of Commerce (other than NIST)Loan Guarantees for Innov Tech in Mfg* 5.00 20.00Loan Guarantees for Science Park Infrastructure* 5.00 7.00Regional Innovation Program* ^
National Science Foundation 6,127.50 6,490.00 3,002.00 6,872.50 8,132.00 National Science Foundation 6,859.90 7,033.60 7,800.00 8,300.00Research and Related Activities (R&RA)
4,844.00 5,183.00 2,500.00 5,617.90 6,401.00 Research & Related Activities 5,563.90 5,689.00 6,234.30 6,637.80
Major Research Instrumentation (MRI)
^ ^ 300.00 ^ 131.70
Exp Prog to Stimulate Competitive Research
120.00 133.00 ^ 147.10 147.80
Education and Human Resources (EHR)
765.50 845.30 100.00 872.80 11,040.00 Education & Human Resources 861.00 829.00 979.00 1,041.80
Math & Sci Ed Partnership (MSP)
^ 61.00 25.00 58.20 123.20
Robert Noyce Teacher Scholarship Program
55.00 55.00 60.00 55.00 140.50
Graduate Research Fellowship/EHR (GRF)
^ 107.00 ^ 102.60 119.00Major Research Equipment & Facilities Construction
220.70 152.00 400.00 117.30 280.00 Major Research Equip & Facilities Construction 117.10 197.10 225.50 236.80Agency Operations and Award Management
281.80 294.00 ^ 300.00 329.50 Agency Operations & Award Management 299.40 299.40 341.70 363.70
National Science Board 4.00 4.00 ^ 4.50 4.30 National Science Board 4.50 4.40 4.80 4.90Inspector General 11.40 12.00 2.00 14.00 13.20 Office of the Inspector General 14.00 14.70 14.70 15.00
Programs with Specific Authorized Budgets in the 2007 America COMPETES Act Programs with Specific Authorized Budgets in the 2010 Act

46
Table 7: Programs authorized by the 2010 ACA for which funding was unspecified in FY2011-FY2012*
Department/Program Section of ACA
2010 FY2013 Authorization
($ million) Department of Education Teachers for a Competitive Tomorrow - BA 1003 2.0 Teachers for a Competitive Tomorrow - MA 1003 2.0 Advanced Placement and International Baccalaureate Programs 1003 75 Alignment of Education Programs) 1003 120.0 Department of Energy Summer Institutes 901 25.0 Nuclear Science Program Expansion Grants for Institutions of Higher Education
902 10.4
Nuclear Science Competitiveness Grants for Institutions of Higher Education
902 8.8
Hydrocarbon Systems Science Talent Program Expansion Grants
902 10.1
Early Career Awards 902 25.0 Protecting America’s Competitive Edge (PACE) Graduate Fellowship Program
902 21.9
Distinguished Scientist Program 902 33.0 Department of Commerce Regional Innovation Program 603 100.0 NIST Baldrige Performance Excellence Program 10.6 NIST Green JOBS Act of 2010 703 7.0 National Science Foundation STEM-Training Grant Program 556 10.0 * These programs can be presumed to be unfunded by the 2010 ACA, although they may be funded through other acts or fungible sources of agency funding. Source: "America COMPETES 2010 and the FY2013 Budget," Heather B. Gonzalez, CRS42430, 20-March-2012.

47
Table 8: Funding for "Doubling Path" accounts in millions of nominal (current) dollars, FY2002-20013 FY2002-FY2011 (Actual), FY2012 (Estimated), and FY2013 (Request) FY2009 Total includes funding from FY2009 and the American Reinvestment and Recovery Act.
Actual Actual Actual Actual Actual Actual Actual Total^ Actual Actual Est. Request
2002 2003 2004 2005 2006 2007 2008 2009 2010 2011 2012 2013
NSF 4,774 5,369 5,652 5,481 5,646 5,884 6,084 8,871 6,972 6,913 7,033 7,373 DOE - Office of Science 3,309 3,322 3,536 3,636 3,632 3,837 4,083 6,440 4,964 4,843 4,874 4,992 NIST - Core Research 330 357 336 379 395 434 441 692 515 497.4 567 648 NIST - Facilities 64 66 64 73 174 59 161 532 147 70 55 60 Total 8,477 9,114 9,589 9,568 9,847 10,214 10,769 16,535 12,598 12,323 12,529 13,073 Percentage Increase Year-to-Year
7.5% 5.2% -0.2% 2.9% 3.7% 5.4% 38.7% -23.8% -2.2% 1.7% 4.3%
Relative to 2002
7.5% 13.1% 12.9% 16.2% 20.5% 27.0% 95.1% 48.6% 45.4% 47.8% 54.2% Relative to 2006
3.7% 9.4% 67.9% 27.9% 25.1% 27.2% 32.8%
Notes: "NIST - Core Research" reflects funding for the "NIST-Scientific and Technical Research and Services" (NIST-STRS) account. Budget figures for this account and the "NIST - Facilities" account do not include items appearing under the "NIST - Industrial Technology Services" (NIST-ITS), which include programs such as the Advanced Manufacturing Technology Consortium (AMTech), Advanced Technology Program (ATP), Technology Innovation Program (TIP), Baldrige Performance Excellence Program (BPEP), and Hollings Manufacturing Extension Partnership (MEP).
Source: FY2002-FY2005 data from NSF, DOE-Office of Science, and NIST annual budget requests (websites listed below); FY2006-FY2013 data from John F. Sargent Jr. (2012) “Federal Research and Development Funding: FY2013,” Congressional Research Service report, R42410, 15 June 2012. NSF budget data from www.nsf.gov/about/budget/; DOE-OS data from science.energy.gov/budget/; NIST budget data from www.nist.gov/public_affairs/budget/. Budget data taken from reports in FY+2 (e.g., FY2006 report used for FY2004 budget data); JF verified that this method yielded match with budget data reported by Sargent (2012).

48
Figure 1. Gross domestic expenditures on R&D by the United States, EU, and selected other countries: 1981–2009, billions of constant PPP dollars
0
50
100
150
200
250
300
350
400
450
1981 1983 1985 1987 1989 1991 1993 1995 1997 1999 2001 2003 2005 2007 2009UnitedStates
EU Germany France
UnitedKingdom
Japan China SouthKorea

49
Figure 2. The “Doubling Path” in Research Funding for the Physical Sciences Figure tracks potential doubling of federal funding for science and technology, including funding for the NSF, DOE Office of Science, and NIST Core Research and Construction relative to FY2006 appropriations levels
Source for figure & notes below: John F. Sargent Jr. (2012) “Federal Research and Development Funding: FY2013,” Congressional Research Service report, R42410, 15 June 2012. Notes: “The 7-year doubling pace represents annual increases of 10.4%, the 10-year doubling pace represents annual increases of 7.2%, the 11-year doubling pace represents annual increases of 6.5%, the 15-year doubling represents annual increases of 4.7%, and the 20-year doubling represents annual increases of 3.3%. Through compounding, these rates achieve the doubling of funding in the specified time period. The lines connecting aggregate appropriations for the targeted accounts are for illustration purposes only. With respect to “Actual Appropriations,” aggregate data for FY2006-FY2012 is based on regular appropriations (funding provided under the American Recovery and Reinvestment Act of 2009 (P.L. 111-5) is not included). America COMPETES Act figures are based on aggregate funding for the target accounts as authorized by the act. America COMPETES Reauthorization Act of 2010 figures for FY2011- FY2013 are based on aggregate funding for the target accounts as authorized by the act” (Sargent, 2012, p. 9).

50
Figure 3: Funding for "Doubling Path" accounts in millions of nominal (current) dollars, FY2002-20013 FY2002-FY2011 (Actual), FY2012 (Estimated), and FY2013 (Request) FY2009 combines funding from FY2009 and the American Reinvestment and Recovery Act.
Notes: "NIST - Core Research" reflects funding for the "NIST-Scientific and Technical Research and Services" (NIST-STRS) account. Budget figures for this account and the "NIST - Facilities" account do not include items appearing under the "NIST - Industrial Technology Services" (NIST-ITS), which include programs such as the Advanced Manufacturing Technology Consortium (AMT), Advanced Technology Program (ATP), Technology Innovation Program (TIP), Baldrige Performance Excellence Program (BPEP), and Hollings Manufacturing Extension Partnership (MEP).
Source: FY2002-FY2005 data from NSF, DOE-Office of Science, and NIST annual budget requests (websites listed below); FY2006-FY2013 data from John F. Sargent Jr. (2012) “Federal Research and Development Funding: FY2013,” Congressional Research Service report, R42410, 15 June 2012. NSF budget data from www.nsf.gov/about/budget/; DOE-OS data from science.energy.gov/budget/; NIST budget data from www.nist.gov/public_affairs/budget/. Budget data taken from reports in FY+2 (e.g., FY2006 report used for FY2004 budget data); JF verified that this method yielded match with budget data reported by Sargent (2012).
0
2,000
4,000
6,000
8,000
10,000
12,000
14,000
16,000
18,000
2002 2003 2004 2005 2006 2007 2008 2009 2010 2011
Fede
ral f
undi
ng, m
illio
ns o
f nom
inal
dol
lars
NSF DOE - Office of Science NIST - Core Research NIST - Facilities

51
Figure 4: Federal Research Funding, by Agency, in constant FY2012 $billions (1995-2011 actual, 2012 estimates; 2013 request)
Notes: FY2012 data estimated, FY2013 based on Presidential Budget Request. Source: Office of Science & Technology Policy (2012)


![Trade Secrets, Non-Competes, and Inventor Mobility ... › acc_papers › dthe9spk32t... · Trade Secrets, Non-Competes, and Inventor Mobility: Empirical Evidence [name deleted] February](https://img.dokumen.tips/doc/110x75/5f0c1f817e708231d433da42/trade-secrets-non-competes-and-inventor-mobility-a-accpapers-a-dthe9spk32t.jpg)