Embed Size (px)
Citation preview

MINERALOGICAL MAGAZINE, SEPTEMBER 1974, VOL. 39, PP" 747- -67
The alkali-feldspar solvus at 1 kilobar water-vapour pressure
P E T E R S M I T H AND I A N P A R S O N S
Department of Geology and Mineralogy, University of Aberdeen, Aberdeen, AB9 IAS, Scotland
SUMMARY. The compositions of feldspar pairs crystallized from stoichiometric alkali feldspar gels with water at Pg~o ~ I kbar in runs of up to 3ooo hours' duration vary with Na: K in the starting material. This is because, for most bulk compositions, rapid nucleation in the gel leads to growth of one feldspar phase outside the solvus. The composition of this initial feldspar phase can be thought of as reflecting the configuration of the liquidus-solidus curves in the system Ab-Or. In general, the attainment of the stable equilibrium solvus (binodal) requires that one phase approach the binodal from outside; for compositions with < 3o mole % Or this phase becomes more potassic with time, with > 30 mole % Or, more sodic. Homogeneous gels of bulk composition AbToOr30 initially crystal- lize feldspar pairs inside the binodal, which rapidly (< I7 hours) unmix to define a solvus-like curve (probably the spinodal, with an apparent critical point at 6o2 ~ and 3t mole % Or) and then unmix slowly, giving a solvus after 3ooo hours with a critical point at 657 ~ and 36 mole % Or.
Because this curve has been approached from two directions it is the best approximation to the binodal (metastable only with respect to A1-Si order) obtained. It is similar to the 2 kbar 'peralkaline' solvus of Orville, I963, provided an adjustment for pressure of I6 ~ is made. Differences between solvi determined by Luth and Tuttle (I966) for 'non-stoichiometric' bulk compositions may reflect differences in initial crystallization behaviour, as may the breaks in the solvus limbs suggested by Luth et al. (1974).
:SINCE the earl iest de te rmina t ion o f the a lkal i - fe ldspar solvus in the system N a 2 0 - K20-A12Oa-SiO2-H20 by Bowen and Tut t le (I95O) at P ~ o = 0"982 kbar , numerous workers have ob ta ined solvus curves at higher pressures and for compos i t ions off the s to ichiometr ic fe ldspar jo in . Lu th (I974), Luth , Mar t in , and Fenn (I974), and Gold- smi th and N e w t o n (I974) have summar ized much o f this da t a and uti l ized methods o f t he rmodynamic analysis devised by T h o m p s o n and W a l d b a u m (I969). W e will refer to much of this recent da t a in some detail in the present paper , which is con- cerned with the loca t ion of the solvus for compos i t ions on the alkal i fe ldspar jo in a t abou t I kba r wa te r -vapour pressure.
W e began the present s tudy to establ ish the l imits o f unmixing in alkal i fe ldspars as par t o f a s tudy o f A I - S i order ing in anor thoclases (begun by Parsons, I968b) and as a p re l iminary to de te rmina t ion o f solvi for compos i t ions conta in ing Ca (Smith, in prepara t ion) . We noted, however, tha t our fe ldspar pairs were no t conforming to a s imple test for e q u i l i b r i u m - - t h a t different bu lk compos i t ions (in terms o f N a ' K ) wi thin the solvus should yield the same pa i r of coexist ing feldspars when crystal l ized at the same tempera ture . These compos i t iona l differences persis ted for the p roduc ts o f runs o f at least 15oo hours dura t ion and showed no tendency to d i sappear wi th t ime. Subsequent ly Morse (197o) and Seck (I972) have repor ted this ' bu lk compos i t ion
�9 Copyright the Mineralogical Society.

748 P. SMITH AND I. PARSONS ON
effect' although their sets of observations concerned starting materials with excess SiO2 and AlcOa, whereas our starting materials were 'stoichiometric'. We have in- vestigated it in some detail and looked at the direction from which equilibrium is approached, with time, during crystallization from gels.
By making use of differences in the crystallization behaviour of different gel starting materials we have obtained a solvus curve bracketed by approach from two directions along the composition axis, avoiding the difficulty (Luth and Tuttle, 1966) of obtaining reversals of equilibrium about the solvus by approaching from higher and lower temperatures. Goldsmith and Newton (I974), alone among previous workers, give great attention to the reversibility of equilibrium in experiments to locate the solvus. They used different types of starting material to approach equilibrium from different directions, and located the solvus at Pn~o ~> 9 kbar, at which pressures reaction rates are greatly enhanced. We discuss aspects of the data of previous workers in the light of our findings and comment on the application of Thompson and Waldbaum's (i 969) thermodynamic model to the alkali feldspars, in particular the usefulness of the tests for equilibrium that they suggest. We explain our different solvus curves and the crystallization behaviour that leads to them on the basis of their thermodynamic data.
Experimental methods
Starting materials. For most syntheses these were stoichiometric gels with various Ab :Or ratios made by the technique of Roy (1956) as modified by Hamilton and MacKenzie (196o) using the following reagents: 'Analar' sodium and potassium car- bonates, British Aluminium Co. 'super-purity' aluminium, and either Monsanto or B.D.H. Tetraethylorthosilicate. Some gels were members of a series used by Parsons (1968, 1969) in previously described experiments; duplicates were later made by Smith using different reagent batches. No systematic differences in products were observed. The only phase other than feldspar obtained in our study was analcime, an expected product at low temperatures (MacKenzie, 1957). We do not, therefore, have any reason to believe that our materials were accidentally off-composition. During the course of the runs some dissolution into the vapour phase will occur and in this sense the solid phases will depart slightly from the ideal feldspar composition if the solution is incongruent. For the same reason P~o will be slightly less than I.o34 kbar.
Two types of gel material were used. Some were 'homogeneous' gels in which Na and K were mixed in solution, others were 'mixed' gels, made by grinding together in an agate mortar for 2o minutes weighed quantities of end-member gels of albite and orthoclase composition. The comparability of data obtained from homogeneous and mixed gels also supports our belief that our starting materials are essentially stoichiometric.
Synthesis. Gels were crystallized in welded gold capsules containing IO to 2o mg of gel (dried at 1 lO ~ before weighing) with about IO wt % deionized water. Runs were done in Tuttle bombs with temperatures measured by internal thermocouples cali- brated against the melting points of zinc (419'4 ~ and NaC1 (8oo'4 ~ recorded on a Honeywell recording potentiometer and maintained to 4-1o ~ throughout runs.

THE ALKALI-FELDSPAR SOLVUS 749
The pressure medium was water and pressures were measured on Budenberg Bourdon gauges and maintained to • IOOO lb/in 2 of 150oo lb/in 2 (o'o69 kbar of 1-o34 kbar) at which all runs were carried out. Temperature overshoot during warm-up was avoided but the rate of reaching the desired temperature varied appreciably from run to run. Other results of this study suggest that this, and factors such as the occasional ap- pearance of pressure leaks during warm-up, necessitating quenching, may account for some of the apparently random variations in solvus data points that characterize both our own and earlier work.
X-ray technique. After optical inspection the composition of feldspar phases was obtained by measuring the separation of the feldspar ~oI reflections from the IOI reflection of B.D.H. 'Analar' KBrO3 run as an internal standard in smear mounts on a Phillips diffractometer using the following instrument conditions: Cu-Kc~ radiation at 36 kV, 24 mA; scanning speed �89176 slits 1"o~176176 chart speed 800 mm/hr; ratemeter 4; time constant 4- Each set of reflections was scanned through three com- plete oscillations, and the resulting six sets of separations averaged. Resolved peaks were measured at ] peak height (from background) to o.ooI inch using a vernier rule and converted to 20. Feldspar compositions were obtained using a curve relating 20 to Ab:Or in the present series of starting materials crystallized at 85 ~ ~ a curve used previously (Parsons, 1968, 1969), and which differs by a maximum of Nor o.oz from the curves of Orville (1963) and Tuttle and Bowen (1958) but by up to 0"06 from the curve of Goldsmith and Newton (I974), which gives values consistently lower in Or for median compositions. Because of these uncertainties our ~oI calibration data are given in Appendix i.
Two-phase assemblages away from the top of the solvus (critical region) gave sharp ~oI reflections even in short (c. z hours) runs. Separations of such reflections can be measured to the equivalent of Nor = ~zo'oo4. Near the top of the solvus there are observational problems because of poor resolution; this is particularly serious for bulk compositions away from the central part of the system because of the relative weakness of reflections from the subordinate phase. In some instances therefore peak positions were estimated near peak tops for poorly resolved reflections, and these are noted 'p' in Table I.
Many runs outside the measurable two-phase region gave diffuse reflections. We have attempted to crudely quantify this effect by measuring the peak width at �88 peak height (from background), and recording this in 20 ('W' in Table I). The included K B r Q standard gave W values between o.zI and o'27 ~ 20, with an average of o'z3 ~ (6 mounts).
Estimates of structural state were made using the o6o-~o4 reflection method of Wright (I968), with K B r Q as internal standard. Analcime was detected by inspection of diffraction patterns.
Terminology
To clearly distinguish starting materials from crystalline products the following terminology will be used:
Starting materials, e.g. AbToOr30(H) = homogeneous gel composition in weight ~o,
750 P. SMITH AND I. PARSONS ON
or AbToOra0(M ) = 'mixed' gel made by grinding weighed quantities of end-member gels, in weight %.
Crystalline products. No~_~: and No~_Na- mole fraction Or in K-rich and Na-rich phase respectively of two phase assemblage (N2/3 and N2~ of Thompson and Waldbaum, I969). Nor_Fsp ---- mole fraction Or in assemblage in which only one feldspar phase could be distinguished by X-ray means. Nerit, Terit = critical composition and critical temperature./Zor_•a, etc. = chemical potential of KA1SizOs in the Na-rich phase, etc.
Solvus. The present study (and the work of others) has generated a large number of solvus-like curves, many of which appear to be equilibrium curves, the nature of which we shall discuss later. In the present paper we shall use the term solvus for all these curves, which depict observed systematic compositional variation in two-phase assemblages with respect to temperature.
Binodal. Our data allow us to derive a solvus that is approached by compositional changes from the two directions (a type of reversal of equilibrium), which we think is a good approach to the binodal. This is the 'true' stable equilibrium solvus, defined by the binodal points on the curves of Gibbs free energy for the system (fig. 4). Strictly the binodal would be defined by feldspar phases with equilibrium degrees of A1-Si ordering; this is probably not achieved by us or others, and the 'binodal' curve is metastable with respect to A1-Si ordering.
Spinodal. A homogeneous alkali feldspar grown above the solvus may break down by spinodal decomposition (Owen and McConnell, I970. This occurs when the feld- spar is cooled inside the coherent spinodal curve, which lies everywhere within the binodal. Our experiments are not analogous to this situation, because we are nucleat- ing phases inside the binodal from amorphous gel. We find, however, that although gels of certain bulk compositions may evolve feldspar phases with compositions central within the binodal these are transient and only observed in the shortest runs (c. 2 hours). They rapidly ( < ~7 hours, and probably while remaining gel crystallizes) change to phases lying on a curve approximating to the chemical spinodal, which is defined bythe points ofinflexion on the Gibbs energy curves (fig. 4) where d2G/dN 2 = o.
It seems unlikely that textures due to spinodal decomposition would be observed (by electron microscopy) in our products and the observed spinodal is probably rapidly attained by complete structural reorganization during crystal growth. A help- ful explanation of exsolution mechanisms is given by Yund and McAllister (I97o).
Results
Variation in solvus curves with bulk composition. Compositions of feldspar phases occurring together after crystallization for various periods of time from different bulk compositions and from both homogeneous and mixed gels are given in Table I. Figs. I and 2 show the very systematic and pronounced differences that exist in feldspar pairs produced by the different starting compositions and persist in runs of at least 3ooo hours' duration. The data shown are ranked in respect of the lengths of the run. Runs of between 34o and 79 ~ hours for AbToOr3o (which will be referred to as '5oo hour' runs) were selected as being broadly comparable (in run length) with the solvi
T H E A L K A L I - F E L D S P A R S O L V U S 751
given by Luth and Tuttle (I966). Similarly the > 5oo hour runs on Ab~0Or,0 and Ab~ 0 are mainly close to 5oo hours in length, and the few longer runs on these com- positions (which are up to 15oo hours' duration) differ only slightly from runs of around 5oo hours' duration. The broken solvus curves on figs. I and 2 are therefore all
7OO
60O
500
400
.60C
50s
40C
3000
/ l I
�9 k I Ab80Or20 H 1 I �9 >500 h
Ab6.5 0r,35 H �9 "F' I~/I 0 0 \ \ 0 > 3000 h
\ ',0 \ \
\ " \
\ 'k
[ l f ~ I f f
_ M. AbzoO% �9 O340-790h
~-ct~-'---"~...,. �9 o others /_ I \
~ : , /~o t o � 9 ~ ' . q i ~ \
1 ~
1 ~ ! IT ,1 ! ' , . ,, I ' 0 , \ r
No r 1.o
4 4 <~ 4h
. . ~ ~ o others
,
i ~
h , I I , 1 \
T ~ ?,5o0r5o Ab25Or75 H M = < 3 h _
7 0 0 ? 4 <~ <~4h I <1 �9 O > 5 0 0 h ] n > 5 0 0 h
/0.64 i \o~,~ �9 �9
!
400 l 1 T ~ t 1
o No r
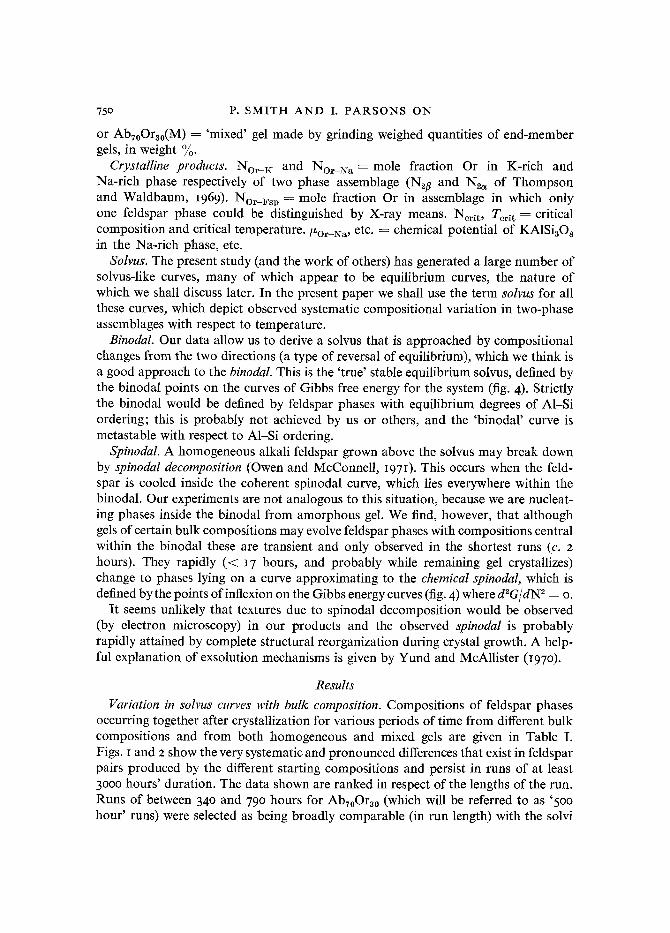
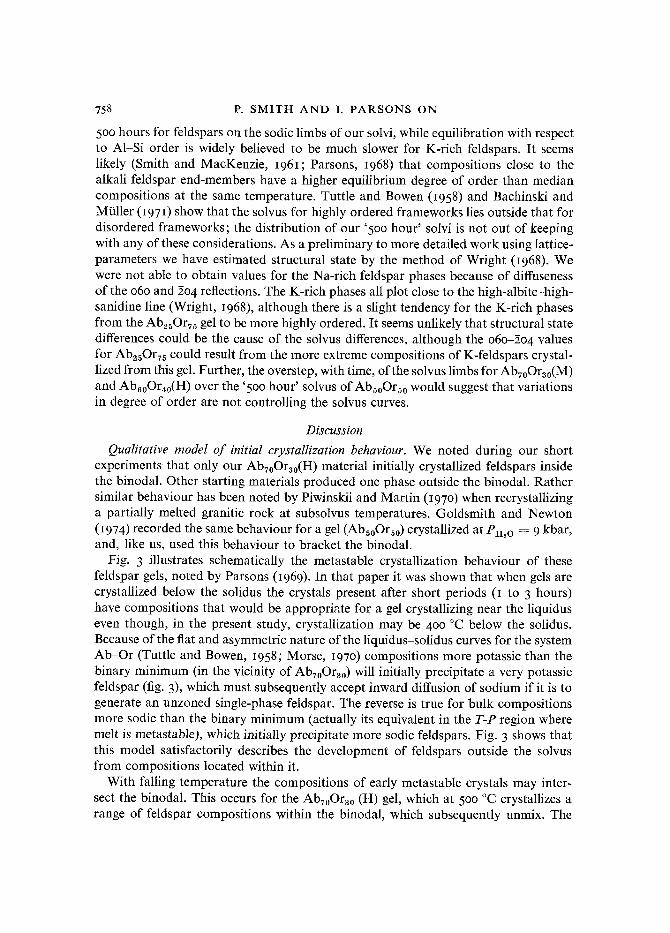
FIGS. I and 2: FIG. I (left): A (top). Compositions of feldspar phases crystallized from bulk composi- tions of AbsoOr20 and Ab~5Oras compared to the AbToOrao presumed binodal. B (bottom). Composi- tions of feldspar phases defining the binodal solvus (solid curve) obtained by combining Ab~0Or30(H) and (M) ' > 23oo hour data' (squares) and using the 'r-s" extrapolation and smoothing method of Thompson and Waldbaum, 1969. Large circles indicate data from runs of broadly similar length to runs of Luth and Tuttle (I966). Apices of triangles point in direction of subsequent change in com- position with time. Broken curve shows 'solvus' for '34o-690 hour ' data. FIG. 2 (right): A (top). Feld- spar compositions and solvus (broken curve) obtained from bulk composition Ab60Or40 compared to the AbToOra0 binodal (solid curve). B (bottom). Feldspar compositions obtained from bulk coin,- positions AbsoOrso and AbzsOra0, compared to the AbToOr3o binodal (solid curve). The broken curve
is the exchange solvus obtained from the Ab~oOrso data.
1.0
equally valid as complete equilibrium curves on the criteria used by Bowen and Tuttle (195o) and Luth and Tuttle 0966). Data points used to generate these curves can be identified in Table I. The curves have been drawn by eye except for Tcrit and Ne~tt which were obtained using the 'r-s' method of Thompson and Waldbaum 0969; see our Table liD, and for convenience they will be referred to as '5oo hour ' solvi even though some longer runs are included.
There is close agreement on the position of the Na-rich limbs of all the '5oo hour" solvi, except for the values from Aba0Or20 at temperatures above 55o ~ The K-rich

75z P. S M I T H A N D I. P A R S O N S O N
�9
%
r ~
.<
.o
o
Z
Z
Z
Z
~ , %
. ,~,#79 . . . . . . . . . # , , # 7 ? 7 " " ? . . . . . . , , ~ I ~ , 7 7 ~ o o o ~ o o ~ o ~ n ~ o ~ ~ ~ o c o ~ n ~ o oo oo o~ ,~ o o o~ ~ u-~ o o o ~ o o ~ c~ ~ co ox o ~ o 0o o o ~ t ~ .
o ~ ~J o ~J ~o ~J
6 6 6 6 6 6 6 6 II II II il II II il II
o o ~ o o o o o o
~ o ~ o o o ~
~ o o ~ ~ o
6 6 6 6 6 6 6 6
~o
6 6 6 6 6 [ o o o . . . . . . o . . . . . ~ . ~ ~ ~ ~ o t ' o ~ b b b 6 b b b b b b b b b b b 6 ] b 6 ] ] b 6 6 6 0 0 0 0 0 6 6
o
g ~
o o "0
0 ~ r , .~ .~ ~ 0 o~ .~ .~ .~ .~ . ~ 9 ~ o ~ ~ . ~ .~ ~ .~ ~ ~ o o o , ~ o o 0 o 0 o
o o o . . . . . ~ o o o o o o o o o o o o o o ~ . - o o o o o o ~ ~ 1 7 6 1 7 6 1 7 6 66666666 ~66666666666656~oooo666 ~6
a a
~ o o o o ~ o ~ ~ o ~ O ~ o ~ ~ oo ~ o o ~ ~ o

T H E A L K A L I - F E L D S P A R S O L V U S 753
0 0 0 0
o
b b b b
b b b b b b b b b b b b b b b b b ' ~ b b b b b b b b b b b b b b b b b b b
b b b b b b b b b ] b b b b b b b b b ] I b b b ] b b b b b b b b b b b b b b [
~ ~ ~o ~ o o o o o ~ o ~ o o ~ ~ ~ o ~ o ~ o ~
g
o
--~@~@.~o'~@@A4' ' ' ; ' ''''' ' '~o'@ 7Y ~. l~- i n ,~- cm r-. v~ , r o o 0 ~ 00 rm ,,~. '~" i% ~ ~o00 e - - ,~ ~ I--- r-.-
u ~ t o
O ~ O o o o o 0 o r . . . r . . r . . r - . r . . r - r . . . r . . . r . . ~ - . . r . . r . . r . . ~ o ~ 0 o o o o ~ ~ m ~ ~ o , r o emr--,nt--~Or..~.r..r..
.~b ~b bbbbb bbbbb bbb bbbb bbb .~bb bbbbbbbbb ~b8 bbbbbbb
.< .< .~
~ o 9 9 9 9 9 9 9 9 o ~ c~oo ~ .~ m v ~ . ~ . . "~ ~ ~ ~', ~ . . . . . . . *'~ ~ o o ~ - ~ "~o ~. ~ o o o ~ ~ o o o o o o o ~ o ~
o o o .~ o ~ ~ o ~ , ~ ~-o ~ o o o~o~,.o
i o i n ~o
~ o ~ =
w
b a a
~, ".~
o o o ,~
II
~o
9
g ~
g ~
O N ~ o ~bbb II
~ , o et u~
3 A

754 P. SMITH AND I. PARSONS ON
limbs show large systematic differences of at least I0 mole % Or; using the '5oo hour' curves for Ab70Or30 and AbsoOrs0 to estimate the temperature of beginning of un- mixing for a feldspar of bulk Ab30OrTo would give values differing by 120 ~ There is relatively low scatter of data points from all but the shortest runs about each of the curves, which are dearly distinguished, and duplicate runs always gave values agreeing to within 4 mole ~o Or. The more Ab-rich the bulk composition of the gel, up to AbToOr30 (figs. IB, 2), the greater the Na content of the feldspar on the K-rich limb of the solvus. The bulk composition Ab80Or2o (fig. IA) shows a reversal of this trend, and, at high temperatures, the Na-rich limb is more sodic than the AbToOra0 '5oo hour' solvus.
A similar relationship between bulk composition (in terms of Na: K) and apparent solvus position has been noted by Morse (r97o) and Seck (I972) but their starting materials were peraluminous-persilicic. Luth and Turtle produced differences in solvi of similar magnitude but at constant N a : K with added alkali silicate, alumina, or silica. Their solvus for a 'stoichiometric' Abr0Or40 gel is essentially identical to our curve for this composition. Our data shows that 'non-stoichiometry' is not a pre- requisite for obtaining a multiplicity of solvus curves; on the criteria for equilibrium adopted by these earlier workers varying the Na: K ratio alone will produce variation of similar magnitude.
We have investigated this bulk composition effect in some detail by doing very short runs (~< 4 hours, indicated by triangles with apices pointing towards the result of longer runs) and exploring subsequent changes with time up to 3200 hours, in particular for the composition Ab70Ora0. The changes in feldspar pairs with time and subsequent development of an apparent multiplicity of solvi can be understood in terms of a thermodynamic model, for which we rely on the data and methods of Thompson and Waldbaum 0969), who in turn based their equations of state on analysis of the peralkaline phase equilibrium data of Orville (I963) and Luth and Tuttle 0966). We shall show that these solvi are closely similar to our binodal, discussed below.
Changes with time in fetdspar pairs from Abv0Or~0 gel. Long runs ( ~ 2300 hours) on both (H) and (M) starting materials of this composition gave the square symbols shown on fig. ~, which were used to generate the solid solvus curve shown on figs. I and 2. This curve has been smoothed and extrapolated above 6oo ~ by the 'r-s" method of Thompson and Waldbaum. It is very similar in form to the 2 kbar solvus of Orville (i963), obtained by ion-exchange in alkali chloride solution (see fig. 7). The ' > 2300 hour' solvus lies everywhere outside the '500 hour' AbToOr30 solvus. When crystallized for 2 hours below 550 ~ the AbToOrzo(H ) material gave feldspars giving a very broad, diffuse 5o I reflection, indicating that a range of compositions was present (fig. 3). After 4 hours two phases were resolved, both well inside the ' ~ 230o hour' solvus, which after longer runs moved further apart, the Or-rich phase becom- ing considerably enriched in Or with time, the opposite of what occurred with more Or-rich bulk compositions. This starting material alone among our starting materials exhibited conventional unmixing behaviour with time. There is a sudden change in rate of unmixing (after c. I7 hours), best shown by the 5oo ~ data, and the '34o-79o
THE ALKALI-FELDSPAR SOLVUS 755
hour' runs (fig. I) merely represent a stage in the slow part of this unmixing process. Above 550 ~ the first Na-rich feldspar to crystallize was more sodic than the final value; the K-phase 2oi reflections were weak and therefore poorly resolved in these runs.
The AbToOr30(M) gel behaved quite differently to its homogeneous equivalent, although after ~ 23oo hours the (H) and (M) data are indistinguishable. At < 50o ~ short runs gave analcime and a feldspar lying outside the K-rich limb of the ' ~ 23oo hour' solvus (fig. 0- Analcime rapidly disappears and after 5o0 hours the feldspar pairs have both become more sodic and lie close to the ' ~ 23oo hour solvus'. Two runs of c. I5OO hours duration (642-I, 657-3) gave more sodic K-feldspars lying on the '5oo hour' solvus for the (H) material, but the Na-feldspars are abnormally sodic (these pairs are the small solid circles at 425 ~ and 475 ~ fig. I). The longest runs ( ~ 23oo hours) gave feldspar pairs both phases of which were more potassic than the ~5oo-hour runs. The (M) gel thus appeared to be following a path involving initial inward movement (of the K-phase) followed by subsequent separation. The two I5oo-hour points are anomalous in a sense, but are thermodynamically explicable (see below), if the '5o0 hour' solvus is, in fact, close to the spinodal. At higher tempera- tures ( ~ 5o0 ~ the (M) gel generates feldspar pairs inside the solvus, which subse- quently unmix.
Changes with time in feldspar pairs from Ab6oOr4o and AbsoOrso gels. Runs of 5oo hours on these compositions produced changes of lesser magnitude and, for
AbsoOrs0, opposite sense to the AbToOrzo(H ) data. From Table I it can be seen that the Ab6oOr4o data changed little with time, except for the shortest runs when a rela- tively potassic feldspar grew initially. After 24 hours the data for the K-phase become static or irregular in direction of change with time. The Na-phase becomes slightly, but consistently, more sodic with time. The data points (fig. 2) are essentially coin- cident with ' ~ 2300 hour' solvus points, although they lie inside the extrapolated AbToOrz0 solvus in the critical region.
The AbsoOrso(H) and (M) solvi show more marked changes with time. Both crystallize very potassic K-feldspar initially, which (below 6o0 ~ is rapidly (within x hour in the case of the (M) gel) joined by a Na-phase more potassic than the 'final' values found. With time both phases become more sodic so that, observed at intervals, we see the entire solvus becoming more asymmetrical and skewed towards Ab. However, the data do not overlap the Ab7oOrzo ' > 2300 hour' solvus, although some data points approach it closely (the one AbsoOrso(M) point slightly inside the AbToOrao solvus (fig. 2B) is a single phase giving a skewed reflection very close to the bulk composition).
Reversal of equilibrium. It can be seen from the foregoing that the data as a whole constitute a type of equilibrium reversal, at least in so far as the K-rich solvus limb is concerned. The feldspar compositions crystallizing from AbToOr30 move outward with time, reaching the position of the essentially unchanging feldspar pairs from Ab6oOr40 after e. 2ooo hours, while the AbsoOrso K-rich solvus limb moves towards these curves from the direction of Or. The AbToOr30 solvus is therefore bracketed by approach from two directions from the materials of the different bulk compositions;
756 P. SMITH A N D I. PARSONS ON
it is bracketed by the AbToOrao(H ) and (M) data (below 500 ~ apart from the two anomalous pairs noted above, and it is very similar to the bracketed peralkaline solvus o f Orville (I963). For these reasons we believe that the AbToOrao ' > 23oo hour' data are the best approach to the true binodal obtained by us, and we shall therefore refer to this data set as 'the binodal' in subsequent discussion. If a difference exists between our curve and the true binodal the latter is likely to lie slightly outside our ' > 23oo hour' data points. This curve represents an equilibrium curve metastable only with respect to A1-Si order-disorder (see later section).
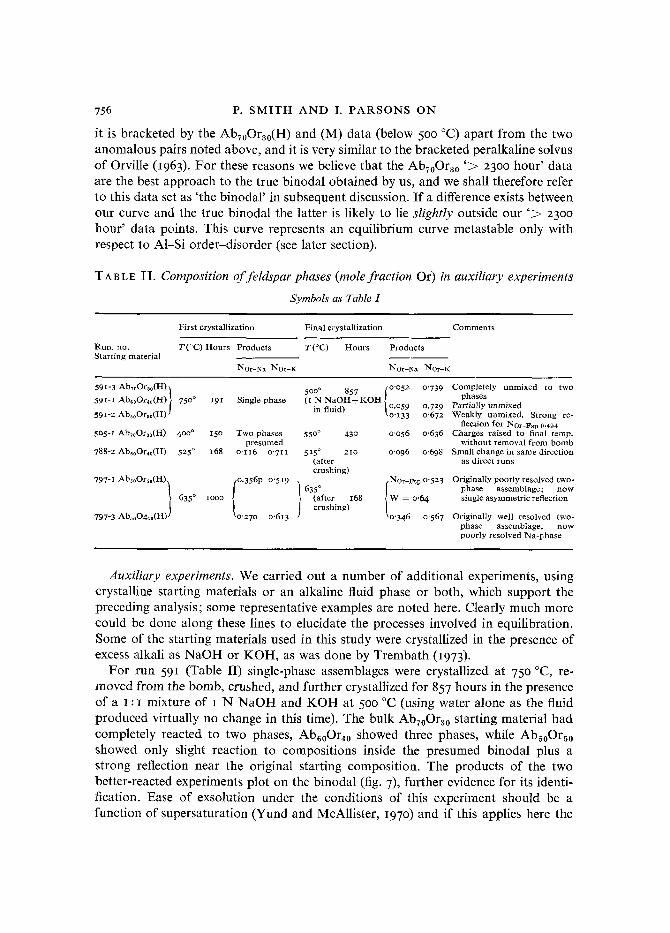
TABLE II. Composition of feldspar phases (mole fraction Or) in auxiliatT experiments
Symbols as Table I
First crystallization Final crystallization Comments
Run. no. T(*C) Hours Products T(~ Hours Products Starting material
NOr-Na NOr-K ]~ffOr-N~ NOr-K
59I-3 AbroOrzo(H) ~ 500 ~ 857 [ o'o52 0"739 59I-I Ab~Or4o(H)} 750 ~ I9I Single phase (r N NaOH+KOH 59I-2 Ab~0Or~0(H) / J in fluid) |0.059 0.729 ~o'I33 0'672
5o5-I AbToOr3o(H) 400 ~ z5o T w o phases 550 ~ 430 0"o56 0'636 presumed
788-2 Ab.0Or~0(H) 525 ~ I68 o ' i i6 o'7tI 525 ~ 2IO 0"096 o'698 (after crushing)
797-x Ab~0Or~0(H) ~o.356P o'519 / { } 6350 / NOr-t'sp O'523
635 ~ Iooo (after I68 W = o'64 crushing)
797-3 Ab~004~0(H) j 'o"27o o'613 to'346 0'567
Completely unmixed to two phases
Partially unmixed Weakly unmixed. Strong re-
flection for ~Or-Fsp 0.494 Charges raised to final temp.
without removal from b o m b Small change in same direction
as direct runs
Originally poorly resolved two- phase assemblage; n o w single asymmetric reflection
Originally well resolved two- phase assemblage, n o w poorly resolved Ha-phase
Auxiliary experiments. We carried out a number of additional experiments, using crystalline starting materials or an alkaline fluid phase or both, which support the preceding analysis; some representative examples are noted here. Clearly much more could be done along these lines to elucidate the processes involved in equilibration. Some of the starting materials used in this study were crystallized in the presence of excess alkali as N a O H or KOH, as was done by Trembath (I973).
For run 59I (Table II) single-phase assemblages were crystallized at 75o ~ re- moved from the bomb, crushed, and further crystallized for 857 hours in the presence o f a I : I mixture o f I N N a O H and K O H at 500 e c (using water alone as the fluid produced virtually no change in this time). The bulk AbToOra0 starting material had completely reacted to two phases, Ab60Or40 showed three phases, while AbsoOrs0 showed only slight reaction to composit ions inside the presumed binodal plus a strong reflection near the original starting composition. The products of the two better-reacted experiments plot on the binodal (fig. 7), further evidence for its identi- fication. Ease o f exsolution under the conditions of this experiment should be a function of supersaturation (Yund and McAllister, I97o) and if this applies here the

THE ALKALI-FELDSPAR SOLVUS 757
ease of reaction implies a critical composition near AbT~Or3o (our binodal), not the apparent critical compositions of our other solvi.
Run 5o5-I (Table II) was carried out in order to establish whether equilibrium would be approached in a reasonable time when a feldspar pair synthesized at low temperatures was taken to higher temperatures. The K-phase lies close to the presumed binodal although the Na-phase plots outside it.
The remaining runs in Table II involved the crushing and re-running of material at the same temperature as the first synthesis. It was thought that the persistence of the different solvi might be due to difficult diffusion through outer layers of crystals, either because of some form of zonation, or non-stoichiometry in the outer layers because of removal of alkalis in the vapour phase. Regrinding produced little effect on bulk Ab~QOr~o below the critical region (788-2) although the small change observed for this run is in the same direction as that observed in continuous runs, with time. More marked effects are seen for the runs on AbaoOrs, in which one phase is outside the equilibrium solvus. Strikingly, the runs numbered 797 (Table II) both show pro- gressive sideways movement of the initial two-phase assemblage, to an assemblage in which two phases are only poorly resolved or shown only by a broad go~ peak. These runs support the view that the Ab~QOr30 curve is the best approximation to the binodal and that the other solvi are curves of a different type.
Near the top of the solvus (above c. 575 ~ the Ab60Ori, data and the AbToOrao data fall somewhat inside the extrapolated binodal. Perhaps this means that the extrapolated binodal curve is not the true binodal. However, in this region, where the degree of supersaturation is least, unmixing of assemblages crystallizing initially inside the binodal would be expected to be difficult (Yund and McAllister, I97o). Some evidence suggesting that the extrapolated value of Tcr~t is correct is given by the go~ peak-width values ('W'-values) listed in Table I. Clearly the reflections are significantly and persistently diffuse up to at least 65o ~ However, this evidence should be viewed with care because Parsons U969) reported a diffuse but measurable two-phase assemblage produced from gel Ab55Or45 after 5 hours at 7o0 ~ at P ~ o , 30 o~o lb. in -~, well outside the two-plaase region. Abv0Or~o(H) gave a diffuse reflec- tion after I68 hours at 700 ~ (above lhe binodal), which sharpened with time. Clearly, outside and above the binodal, two-phase assemblages or assemblages show- ing a range of compositions may evolve and persist for long periods. Orville 0963) shows diffractometer peaks illustrating similar effects. Perhaps differences between ~-o~ determinative curves, such as those of Goldsmith and Newton 0974) and the present authors, can be accounted for in this way. The former curve was for ostensibly homogeneous crystals synthesized at 7o0 ~C, 1 kbar Pn2o for 24 hours, the latter was for synthesis at 850 ~ o'3 kbar for 48 hours. The discrepancies are in the direction and over the compositional range predicted from the model of metastable behaviour we develop below.
Structural state of feldspar phases. We have considered the possibility that the '500 hour' solvi are all equilibrium solvi, each representing a different metastable equi- librium for crystals with different degrees of AI-Si order. Parsons's (I968) experi- ments suggest that at 50o ~ AI-Si ordering would be essentially complete after about
758 P. SMITH AND I. PARSONS ON
5OO hours for feldspars on the sodic limbs of our solvi, while equilibration with respect to A1-Si order is widely believed to be much slower for K-rich feldspars. It seems likely (Smith and MacKenzie, I96I; Parsons, ~968) that compositions close to the alkali feldspar end-members have a higher equilibrium degree of order than median compositions at the same temperature. Tuttle and Bowen 0958) and Bachinski and Mtiller (I97r) show that the solvus for highly ordered frameworks lies outside that for disordered frameworks; the distribution of our '5oo hour' solvi is not out of keeping with any of these considerations. As a preliminary to more detailed work using lattice- parameters we have estimated structural state by the method of Wright (I968). We were not able to obtain values for the Na-rich feldspar phases because of diffuseness of the o60 and 204 reflections. The K-rich phases all plot close to the high-albite-high- sanidine line (Wright, I968), although there is a slight tendency for the K-rich phases from the Ab25Or75 gel to be more highly ordered. It seems unlikely that structural state differences could be the cause of the solvus differences, although the o6o-2o4 values for Ab25Or75 could result from the more extreme compositions of K-feldspars crystal- lized from this gel. Further, the overstep, with time, of the solvus limbs for AbToOr30(M) and Ab60Or40(H) over the '5oo hour' solvus of AbsoOrs0 would suggest that variations in degree of order are not controlling the solvus curves.
Discussion
Qualitative model of initial crystallization behaviour. We noted during our short experiments that only our AbToOr30(H) material initially crystallized feldspars inside the binodal. Other starting materials produced one phase outside the binodal. Rather similar behaviour has been noted by Piwinskii and Martin 097o) when recrystallizing a partially melted granitic rock at subsolvus temperatures. Goldsmith and Newton (I974) recorded the same behaviour for a gel (AbsoOrs0) crystallized at Pn2o = 9 kbar, and, like us, used this behaviour to bracket the binodal.
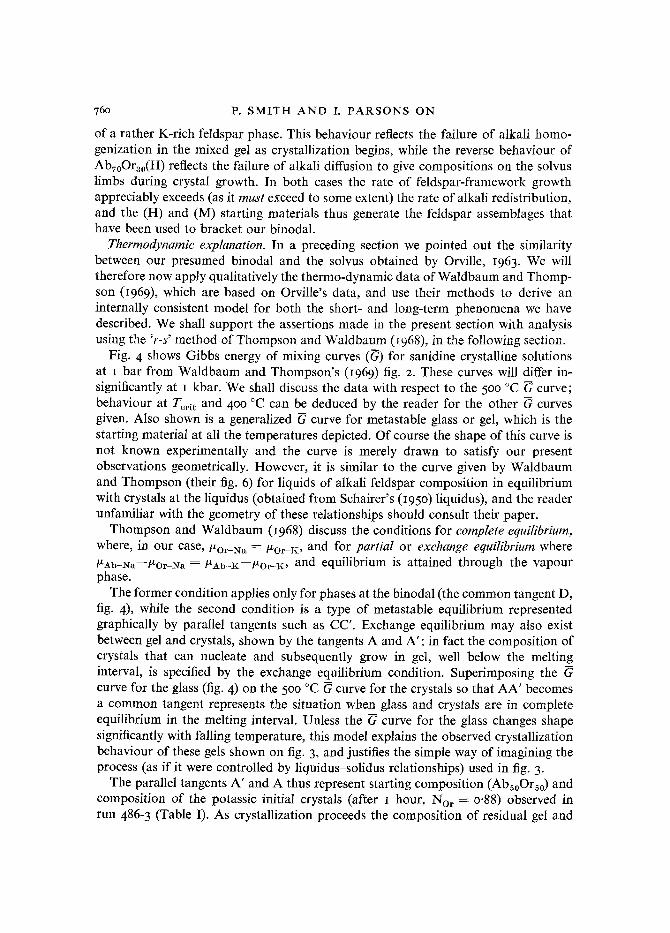
Fig. 3 illustrates schematically the metastable crystallization behaviour of these feldspar gels, noted by Parsons (I969). In that paper it was shown that when gels are crystallized below the solidus the crystals present after short periods (I to 3 hours) have compositions that would be appropriate for a gel crystallizing near the liquidus even though, in the present study, crystallization may be 4oo ~ below the solidus. Because of the fiat and asymmetric nature of the liquidus-solidus curves for the system Ab-Or (Tuttle and Bowen, I958; Morse, ~97o) compositions more potassic than the binary minimum (in the vicinity of Abr0Or30) will initially precipitate a very potassic feldspar (fig. 3), which must subsequently accept inward diffusion of sodium if it is to generate an unzoned single-phase feldspar. The reverse is true for bulk compositions more sodic than the binary minimum (actually its equivalent in the T-P region where melt is metastable), which initially precipitate more sodic feldspars. Fig. 3 shows that this model satisfactorily describes the development of feldspars outside the solvus from compositions located within it.
With falling temperature the compositions of early metastable crystals may inter- sect the binodal. This occurs for the AbToOr30 (H) gel, which at 500 ~ crystallizes a range of feldspar compositions within the binodal, which subsequently unmix. The

THE A L K A L I - F E L D S P A R SOLVUS 759
AbToOr30(H) gel shows the most variable early crystallization behaviour of all our composi t ions ; we have already noted that in earlier experiments (Parsons, I969) a two- phase assemblage was obtained, transiently, at 7oo ~ It seems that this uncer ta inty in behaviour is related to the close proximity of the binary m i n i m u m (Ab70Or30, at
700
T~
6O0
50o
I
I ^ ~ " 5 Q , ~ ~ /
W - - - - W - . . . . , I �9 [ 1
I t I I I I
I I l [ 1 i I I
' , / i J , I / J - " I " " - J ' ~ - 4 m r " " , . I l
/ / / / , 4 n 2h ,q-n \ \ Analcime - - ',. \
[ T I I l l
Ab Wt ~ or
~OO j o o
o o 0
G L A S S
~ ' Sp inoda l
"n';
~ . ~ ' / z---/. "- zJ / CRYSTALS ~ , t ~ . ~ j /
1 1 T [ I ~ i I I
No,
A
-c' ' - D
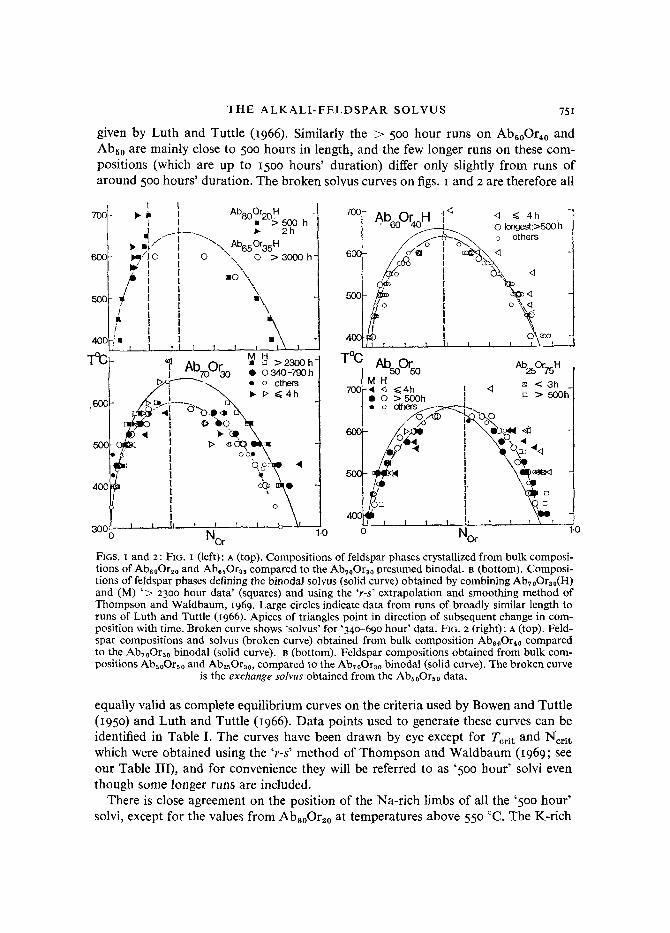
FIGS. 3 and 4: FIG. 3 (left). Generalized representation of metastable crystallization behaviour exhibited by homogeneous alkali-feldspar gels (and glasses). Triangles are compositions of feldspars present after short periods (t to 3 hours), with apices pointing in the direction of subsequent equilibra- tion. Broken tie lines join these points to the appropriate bulk composition, which is depicted as lying on the liquidus, even though, in reality, the melting interval is not intersected at the temperature of crystal growth. This model describes how bulk compositions inside the binodal can initially crystallize feldspars well outside the solvus, and explains the reversal of direction of equilibration exhibited on either side of the metastable equivalent of the binary minimum. The bulk composition AbToOra0, close to the binary minimum, shows two types of behaviour; equilibrating from inside the solvus at low temperatures. The approximate limit of metastable crystallization of analcime is shown. The solid curve is our binodal, the broken curve approximates to the spinodal, estimated from fig. I. Liquidus and solidus are constructed from Morse, 197o, except that a minimum, not a eutectic, is depicted. FIG. 4 (right). Gibbs energy of mixing (G) curves (solid curves) for sanidine crystalline solutions at I bar taken from Waldbaum and Thompson, I969, fig. z. A hypothetical G curve for a metastable glass is also shown. Triangles are observed compositions of phases obtained from Ab70Or30 (H) gel after the run times shown (in hours) at 500 ~ P~I2o ~ I kbar. The significance of the tangents A-D is discussed in the text. The binodal (shown as a broken curve) is defined by all common tangents such as D-D; the chemical spino dal by the points of inftexion on the G curves, also shown as a broken
curve.
I kbar (Bowen and Tuttle, i95o ) Abn.~Or28.5, at 5 kbar (Morse, I97O)); this proximity leads to the development of feldspar pairs lying inside the binodal throughout much
of the subsolvus range, a l though not in the region above 550 ~ (fig. 3). The earliest crystalline sodic phase observed from Abv0Ora0(M) below 525 ~ was
analcime. I t is accompanied by a K-rich feldspar more Or-rich than the final K-feld- spar, and subsequently reacts with fluid to give an albitic feldspar phase. This rapid analcime growth seems to deplete the gel locally in Na, causing subsequent nucleat ion
76o P. SMITH AND I. PARSONS ON
of a rather K-rich feldspar phase. This behaviour reflects the failure of alkali homo- genization in the mixed gel as crystallization begins, while the reverse behaviour of AbToOr30(H) reflects the failure of alkali diffusion to give compositions on the solvus limbs during crystal growth. In both cases the rate of feldspar-framework growth appreciably exceeds (as it must exceed to some extent) the rate of alkali redistribution, and the (H) and (M) starting materials thus generate the feldspar assemblages that have been used to bracket our binodal.
Thermodynamic explanation. In a preceding section we pointed out the similarity between our presumed binodal and the solvus obtained by Orville, I963. We will therefore now apply qualitatively the thermo-dynamic data of Waldbaum and Thomp- son 0969), which are based on Orville's data, and use their methods to derive an internally consistent model for both the short- and long-term phenomena we have described. We shall support the assertions made in the present section with analysis using the 'r-s' method of Thompson and Waldbaum 0968), in the following section.
Fig. 4 shows Gibbs energy of mixing curves (G) for sanidine crystalline solutions at I bar from Waldbaum and Thompson's (I969) fig. 2. These curves will differ in- significantly at I kbar. We shall discuss the data with respect to the 5o0 ~ G curve; behaviour at Terit and 400 ~ can be deduced by the reader for the other G curves given. Also shown is a generalized G curve for metastable glass or gel, which is the starting material at alI the temperatures depicted. Of course the shape of this curve is not known experimentally and the curve is merely drawn to satisfy our present observations geometrically. However, it is similar to the curve given by Waldbaum and Thompson (their fig. 6) for liquids of alkali feldspar composition in equilibrium with crystals at the liquidus (obtained from Schairer's (I95o) liquidus), and the reader unfamiliar with the geometry of these relationships should consult their paper.
Thompson and Waldbaum 0968) discuss the conditions for complete equilibrium, where, in our case,/Xor_z~ ~ = tLo~z, and for partial or exchange equilibrium where /~b_Na--/ZO~_Z~a = tz~b_~Z--t~Or_~Z, and equilibrium is attained through the vapour phase.
The former condition applies only for phases at the binodal (the common tangent D, fig- 4), while the second condition is a type of metastable equilibrium represented graphically by paraIlel tangents such as CC'. Exchange equilibrium may also exist between gel and crystals, shown by the tangents A and A'; in fact the composition of crystals that can nucleate and subsequently grow in gel, well below the melting interval, is specified by the exchange equilibrium condition. Superimposing the G curve for the glass (fig. 4) on the 500 ~ G curve for the crystals so that AA' becomes a common tangent represents the situation when glass and crystals are in complete equilibrium in the melting interval. Unless the G curve for the glass changes shape significantly with falling temperature, this model explains the observed crystallization behaviour of these gels shown on fig. 3, and justifies the simple way of imagining the process (as if it were controlled by liquidus-solidus relationships) used in fig. 3.
The parallel tangents A' and A thus represent starting composition (AbsoOrs0) and composition of the potassic initial crystals (after I hour, Nor ---- 0"88) observed in run 486-3 (Table IF). As crystallization proceeds the composition of residual gel and
THE ALKALI-FELDSPAR SOLVUS 761
crystals becomes more sodic, and an initial single feldspar phase is joined by an Ab-rich second phase, in exchange equilibrium with any remaining gel and the earlier crystals through the vapour phase. Feldspar pairs defined by such tangents as CC' may therefore evolve and, our experiments suggest, persist for long periods. The whole family of isothermal subcritical G curves can generate, from appropriate starting materials (AbsoOrs0, AbzsOr~5 in our experiments), a multiplicity of solvus-like curves whose position depends on starting composition (which controls the magnitude of the compositional changes needed to establish complete equilibrium) and time. These curves are equilibrium curves of a type; they involve ion-exchange equilibrium through the vapour phase and we shall call them exchange solvi. They represent metastable equilibrium, in respect of both A1-Si order-disorder and alkali distribution.
The tangents BB' indicate how sodic bulk composition (such as Abs0Or20) may produce an initial crystalline phase more sodic than the binodal. The tangent B is shown on the G curve for Terie because this behaviour is only observed at tempera- tures > 575 ~ (fig. 4).
Composition AbGoOr40 initially evolves potassic feldspars outside the binodal, in exchange relationship with residual gel, but, by the time a second phase has appeared both phases are close to the binodal, so that subsequent changes with time are slight. At temperatures above about 525 ~ both phases (with one anomalous exception) lie inside the extrapolated binodal, and if this is the true binodal, presumably would unmix with time.
The composition Abv0Or30(H) initially crystallizes within the spinodal throughout the whole range of temperatures. The time-numbered points on the 500 ~ G (fig. 4) show compositions obtained from this material at 500 ~ The sudden change in rate of phase separation after c. I7 hours is close to the spinodal, as are the '50o hour '~ values. We also noted previously two I5oo-hour runs (64z-i , 657-3) from AbToOr,0(M) that gave one phase near the K-rich spinodal, with an abnormally sodic Na-rich phase. It seems that for some reason (perhaps related to temperature fluctuations during warm-up, or undetected leaks in capsules) the two phases adopted a condition of exchange equilibrium. It is a requirement for exchange equilibrium of this type that one phase must lie between binodal and spinodal, because phases inside the chemical spinodal will break down rapidly to compositions at the spinodal. For the same reason runs crystallizing initially some compositions inside the spinodal (Ab70Ora0(H), 2 hours) break down very quickly ( < 4 hours) to phases at the chemical spinodal, and runs on compositions giving one phase outside the binodal should give a second phase between binodal and spinodal. Fig. 2B therefore shows an approximation to the spinodal for the shortest runs on the sodic limb, while the AbToOra0(H ) data gives an approximation, after < I7 hours, to the spinodal on the potassic limb. The over-all scatter of points (figs. I and 2) is in good qualitative agreement with the shape of the
curves derived by Thompson and Waldbaum (I969), which show a narrower trough for the Na-rich side, implying a narrower region between spinodal and binodal, as well as a narrower field in which phases in exchange equilibrium outside the binodal may evolve.
Analysis by 'r-s' method. Thompson and Waldbaum (I969) have suggested that it is
762 P. S M I T H A N D I. P A R S O N S O N
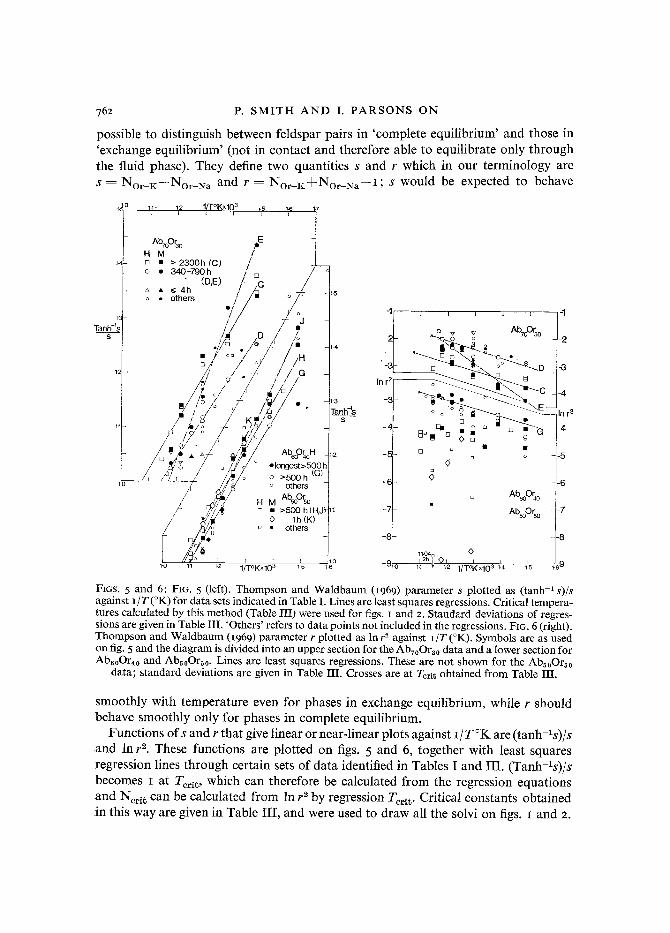
possible to distinguish between feldspar pairs in 'complete equilibrium' and those in "exchange equilibrium' (not in contact and therefore able to equilibrate only through the fluid phase). They define two quantities s and r which in our terminology are S = Nor_K--Nor_Na and r = NOr_K+Nor_Na--I; s would be expected to behave
151~ 1:1. li2 l fl'OKxlO 3 ,i5 ,16 i~-
l AbmO % ,E H M [
" ~ : :72O_2h~C) /
-1 l 1 t 1 { - 1
o v v Abz00% 4 ""-4q,-.o o -2
'~
�9 - - - - ~ - - - - . ~ , 4 -3
hnh-'s : o "~ o6 ~ ' - - - ~ " " ~ E - ~ - In r :~
t3 a -- [3 �9 m 0 ~ 9
i 1-2 El u Ill �9
-(~ -6 AbeaO%
-I,J: -7 Ab5oO% -7
-8 -8
11-04~.
vo 11 1-2 l/TOKxlO 3 15 - - 1.6 _s 1.[12h ~ <~1! 2 t 1/TOKxlO 3 1!4 115 lj6 9
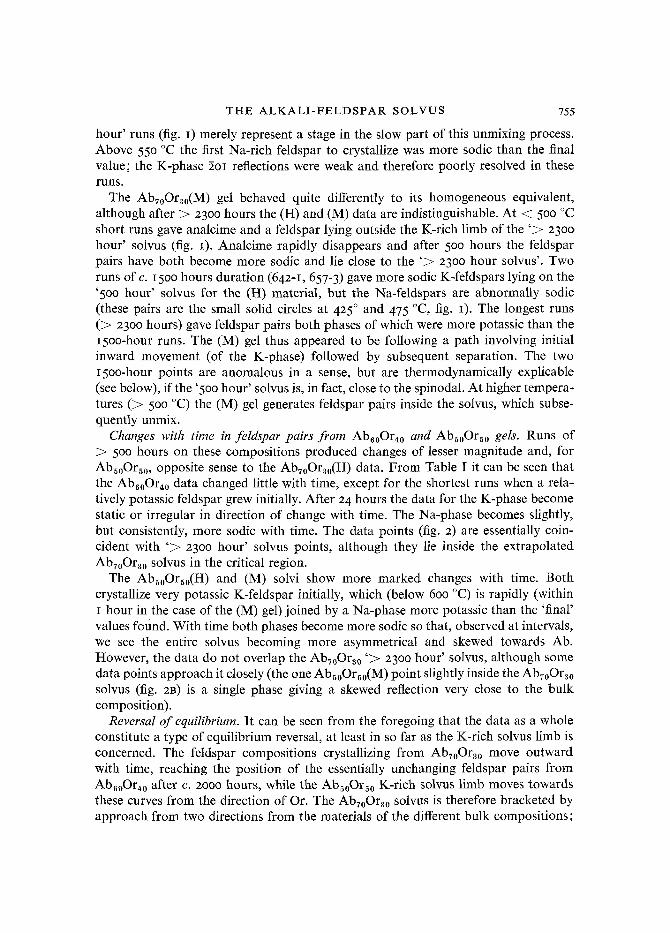
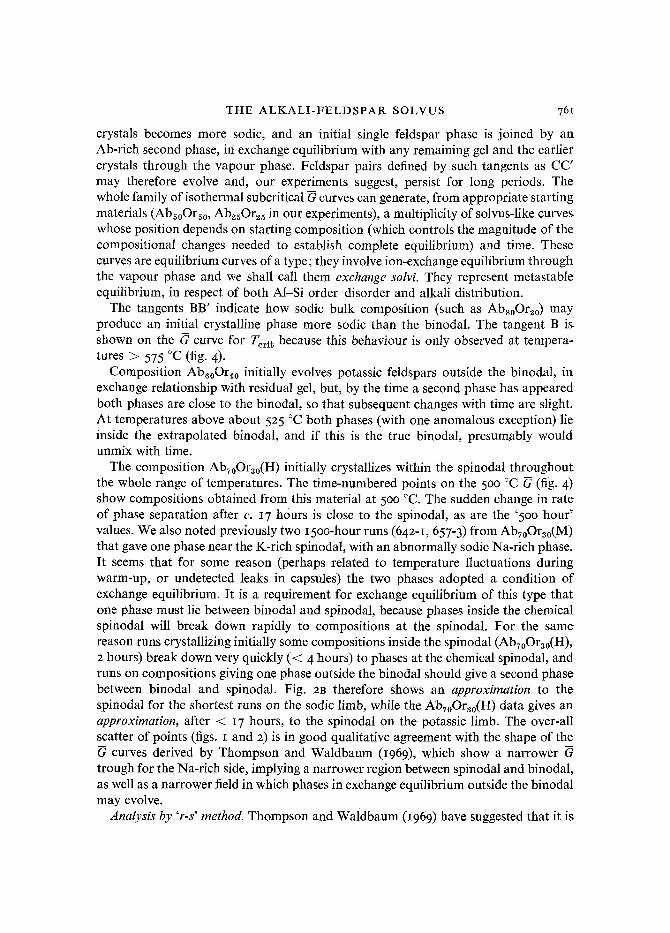
FIGS. 5 and 6: FIG. 5 (left). Thompson and Waldbaum (I969) parameter s plotted as (tanh -1 s)/s against I/T(~ for data sets indicated in Table l. Lines are least squares regressions. Critical tempera- tures calculated by this method (Table HI) were used for figs. I and z. Standard deviations of regres- sions are given in Table III. 'Others' refers to data points not included in the regressions�9 FiG. 6 (right). Thompson and Waldbaum (I969) parameter r plotted as In r 2 against I/T (~ Symbols are as used on fig. 5 and the diagram is divided into an upper section for the AbToOr30 data and a lower section for Ab60Or~0 and AbsoOra0. Lines are least squares regressions. These are not shown for the AbsoOrs0
data; standard deviations are given in Table III. Crosses are at Tcrit obtained from Table III.
smoothly with temperature even for phases in exchange equilibrium, while r should behave smoothly only for phases in complete equilibrium.
Functions o f s and r that give linear or near-linear plots against I/T~ are (tanh-ls)/s and In r 2. These functions are plotted on figs. 5 and 6, together with least squares regression lines through certain sets o f data identified in Tables I and ffl. (Tanh-ls)/s becomes I at Teri~, which can therefore be calculated from the regression equations and Ncri~ can be calculated from In r ~ by regression Tepid. Critical constants obtained in this way are given in Table III, and were used to draw all the solvi on figs. I and 2.

THE ALKALI-FELDSPAR SOLVUS 763
For data approaching complete equilibrium it is reasonable to use the regression equations to generate a smoothed solvus, which may be extrapolated outside the range of the data; this has been done for the Ab70Or30 '~> 2300 hour' data (fig. I).
(Tanh-is)/s increases as s increases and therefore phases that are unmixing in a conventional way should show increase in (tanh-ls)/s with time. This is clearly shown by regressions D and C (fig. 5) for the AbToOr30(H) data. In fact these data are not for phases in exchange equilibrium but for phases approaching complete equilibrium from the spinodal. The regression line E shows an equally smooth plot through Abv0Ora0(M) products, which is clearly a fortuitous result because low- and high- temperature points were for phases equilibrating from different directions.
From the configuration of the G curves (fig. 4) one can deduce that phases approach- ing complete equilibrium from the exchange equilibrium condition should show a decrease in s with time. This should be smaller than changes in s during unmixing. Also, the over-all variation in s between different starting compositions should be less than variations in s during unmixing. This is strikingly shown by the lower section of fig. 5- Decrease in s is shown by the small difference between regressions K and J. All the data are linear and smoother than the Ab70Or~0 data.
Regression K is for pairs of feldspars crystallized after I hour from AbsoOrs0(M) gel. Regression K gives a value of Terit essentiallyidentical (Table IIl) to Torit from regression C (our presumed binodal). Since it is impossible to have two crystalline phases even in only exchange equilibrium above the true value of Tcrit (the G curve must have a binodal flexure, even for exchange equilibrium), this seems to confirm that the true value of Te~it is indeed near to, or slightly above, 657 ~
Regression H, for runs in exchange equilibrium after > 5oo hours confirms this, giving Terit = 660 ~ The data for Ab60Or~0(H ) shows little change with time, although the apparent value of Torit increases slightly with time (regressions F and G, Table III), in keeping with the data points from this composition with respect to the AbToOr~0 binodal.
The function In r 2 is sensitive to the mean of the phase compositions, and reflects the asymmetry of the solvus. Solvi skewed towards Ab (as all our solvi are) will give negative values of In r 2 which will become closer to o as the solvus becomes more asymmetric. Spinodal and binodal are further apart on the K-rich solvus limb (fig. 4) and when unmixing is occurring In r 2 should become more negative with time. This is shown by regressions D and C, fig. 6, for AbToOr30. Bulk compositions tending towards complete equilibrium from exchange equilibrium should show increasing asymmetry with time, and In r 2 should become less negative. This is shown, to the small degree expected, by the AbGoOr4o data (note the similarity to regression C), and also, to a larger extent, by the AbsoOrs0 data.
It is clear from fig. 6 that the smoothness of In r 2 is not significantly different between C, D, E, and G (least-squares standard deviations are given in Table IIi), although we believe on other grounds that the data points for C represent the nearest approach to complete equilibrium. However, the exchange equilibrium AbsoOrs0 data are very irregular, in particular the shortest runs, and regressions have not been attempted. With time they show a general tendency to approach the Ab60Or40 data. The In r 2
764 P. S M I T H A N D I. P A R S O N S O N
method has therefore successfully distinguished the exchange equilibrium data from data representing phases unmixing from within the binodal, but has not distinguished between the latter. It is clear to us that as a method of distinguishing data offering the best approach to the binodal, the 'r-s' method is a blunt tool, and no substitute for 'time and motion' (Goldsmith and Newton, I974) synthesis studies.
Comparison with other work. It seems likely that the importance of early crystalliza- tion effects has been underrated by many previous workers. Eugster et al. (I97 a) have noted analogous effects for the system paragonite-muscovite. Goldsmith and Newton
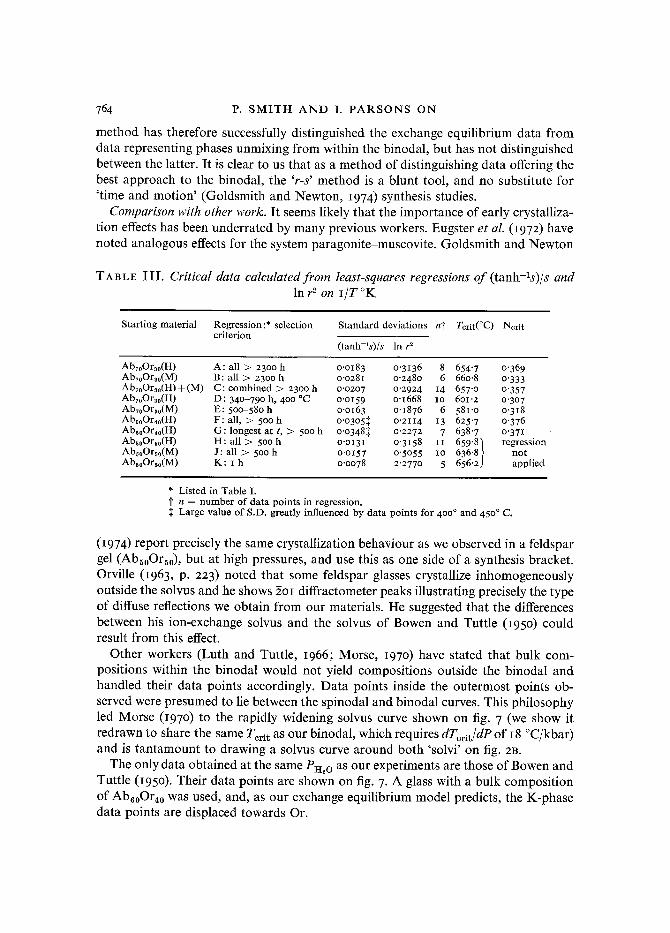
TABLE III . Critical data calculated from least-squares regressions of (tanh-ls)/s and In r 2 on 2/T ~
Starting material Regression:* selection criterion
Standard deviations nt Terit(~ Nerit
(tanh-ls)/s In r ~
AbroOrao(H) A: all > 2300 h o-o183 o'3136 8 654'7 0"369 AbToOr3o(M) B: all > z3oo h o.o28I o'2480 6 66o-8 o'333 AbToOrso(H)+(M) C: combined > 23o0 h o-o207 0"2924 14 657.0 o'357 AbToOr3o(H) D: 34o-79o h, 4o0 ~ o'oi59 o.I668 IO 6oi-2 o'3o7 AbroOr~o(M) E: 5o0-580 h o'oi63 o"1876 6 581"o o'318 Ab6oOr4o(H) F: all, > 500 h o'o3o5~ o '2II4 13 625'7 o'376 Ab60Or40(H) G: longest at t, > 5ooh 0.03485 o'2z7z 7 638"7 o'37I AbsoOrso(H) H: all > 5ooh o'oi31 o'3158 I I 659"8] regression Ab~oOrso(M) J: all > 500 h o-oi57 o'5055 1o 636.8 7 not AbsoOrso(M) K: I h o'oo78 2"277o 5 656"2~ applied
* Listed in Table I. t n = number of data points in regression. 2~ Large value of S.D. greatly influenced by data points for 4oo ~ and 45o ~ C.
(I974) report precisely the same crystallization behaviour as we observed in a feldspar gel (AbsoOrs0), but at high pressures, and use this as one side of a synthesis bracket. Orville (I963, p. 223) noted that some feldspar glasses crystallize inhomogeneously outside the solvus and he shows goI diffractometer peaks illustrating precisely the type of diffuse reflections we obtain from our materials. He suggested that the differences between his ion-exchange solvus and the solvus of Bowen and Tuttle 095o) could result from this effect.
Other workers (Luth and Tuttle, I966; Morse, 297o) have stated that bulk com- positions within the binodal would not yield compositions outside the binodal and handled their data points accordingly. Data points inside the outermost points ob- served were presumed to lie between the spinodal and binodal curves. This philosophy led Morse (I97O) to the rapidly widening solvus curve shown on fig. 7 (we show it redrawn to share the same Terit as our binodal, which requires dTcrit/dP of I8 ~ and is tantamount to drawing a solvus curve around both 'solvi' on fig. 2B.
The only data obtained at the same P~,o as our experiments are those of Bowen and Tuttle (i95o). Their data points are shown on fig. 7. A glass with a bulk composition of Ab60Or40 was used, and, as our exchange equilibrium model predicts, the K-phase data points are displaced towards Or.
T H E A L K A L I - F E L D S P A R S O L V U S 765
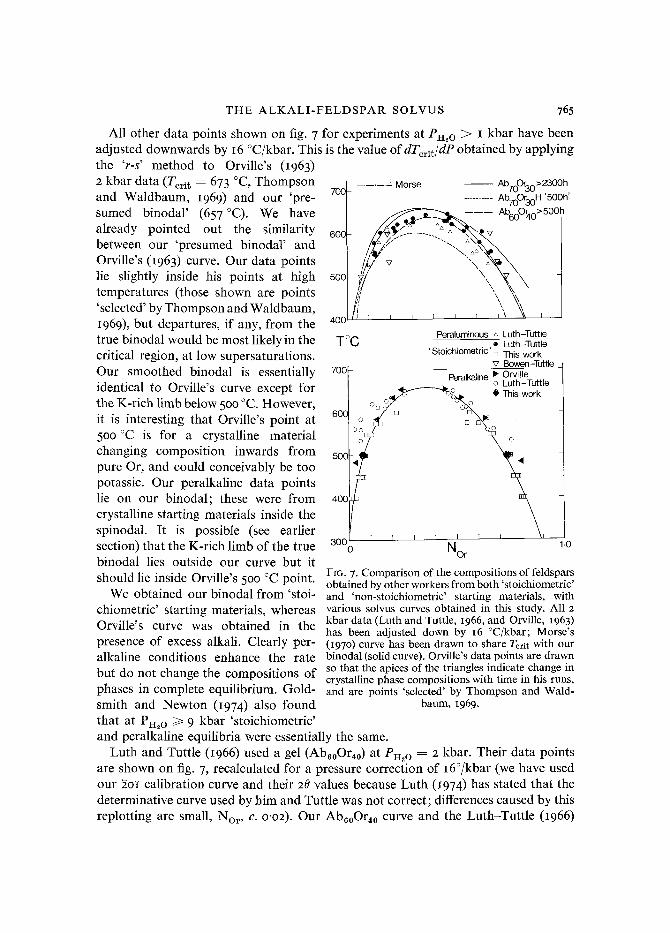
All other data points shown on fig. 7 for experiments at PB2o > I kbar have been adjusted downwards by I6 ~ This is the value ofdToriJdP obtained by applying the 'r-s' method to Orville's 0963) 2 kbar data (Torit : 673 ~ Thompson and Waldbaum, ~969) and our 'pre- sumed binodat' (657 ~ We have already pointed out the similarity between our 'presumed binodal' and Orville's (I963) curve. Our data points lie slightly inside his points at high temperatures (those shown are points 'selected' by Thompson and Waldbaum, I969), but departures, if any, from the true binodal would be most likely in the critical region, at low supersaturations. Our smoothed binodal is essentially identical to Orville's curve except for the K-rich limb below 500 ~ However, it is interesting that Orville's point at 5oo ~ is for a crystalline material changing composition inwards from pure Or, and could conceivably be too potassic. Our peralkaline data points lie on our binodal; these were from crystalline starting materials inside the spinodal. It is possible (see earlier section) that the K-rich limb of the true binodal lies outside our curve but it should lie inside Orville's 5o0 ~ point.
We obtained our binodal from 'stoi- chiometric' starting materials, whereas Orville's curve was obtained in the presence of excess alkali. Clearly per- alkaline conditions enhance the rate but do not change the compositions of phases in complete equilibrium. Gold- smith and Newton 0974) also found that at P~2o ~> 9 kbar 'stoichiometric'
-/- Morse - - Ab70Or30>2300h 70C
.......... A b700~30H '500h'
. / ' ~ Ab600~t0 >500h / "~
\ \ 50C
4 0 C ] ' ' I , , \ \ \ I
Toc Peraluminous • Luth-Tuttle �9 Luth -Tuttle
' Stoichiometric' [] This work v Bowen -Turtle
700 Peralkaline b Orville
o Luth-Tuttle o ~ ~ , �9 This work
O o o
60C ~ I~
b 0
50s
400
[ T ] I I } B l \1 300
o Nor 1.0
FI~. 7. Comparison of the compositions of feldspars obtained by other workers from both 'stoichiometric' and 'non-stoichiometric' starting materials, with various solvus curves obtained in this study. All 2 kbar data (Luth and Tuttle, ~966, and Orville, 1963) has been adjusted down by 16 ~ Morse's ([97o) curve has been drawn to share Teri~ with our binodal (solid curve). Orville's data points are drawn so that the apices of the triangles indicate change in crystalline phase compositions with time in his runs, and are points 'selected' by Thompson and Wald-
baum, 1969,
and peralkaline equilibria were essentially the same. Luth and Tuttle Q966) used a gel (Ab60Or40) at Pn~o = 2 kbar. Their data points
are shown on fig. 7, recalculated for a pressure correction of z6~ (we have used our ~o~ calibration curve and their 20 values because Luth 0974) has stated that the determinative curve used by him and Turtle was not correct; differences caused by this replotting are small, Nor, c. o.o2). Our Ab60Or40 curve and the Luth-Tuttle (I966)
766 P. SMITH AND I. PARSONS ON
curve are indistinguishable if this pressure correction is made, further support for the stoichiometry of our starting materials. There seems every reason to think that Luth and Turtle's gel was crystallizing in the same way as ours, and that their AbGoOr40 solvus is, like ours, not a complete equilibrium solvus.
The status of peraluminous and persilicic-peralkaline (i.e. added (Na,K)20.2SiO2) data needs review in the light of our findings. The Luth-Tuttle, 1966, data of this type are shown on fig. 7. Clearly the peraluminous runs on (Abd0Or40)97(A1203)3 lie inside the binodal, while the runs on (Ab~0Or40)97(NSd0KS~0)3 gave points lying outside the data of Orville and ourselves, at least on the Ab-rich limb. The more recent data of Luth, Martin, and Fenn (1974) and Seck (1972) agree broadly with the earlier data at low pressures. We believe that the idea should be entertained that these solvus differences arise because of changes in the shape of the free-energy surface of the amorphous starting materials as compositions move away from the Ab-Or join in the system Na20-K20-A12Q-SiO2-H~O, and that the apparent differences in solvi arise because of differences in the composition of early-crystallized phases. These differences, as our study shows, fundamentally influence the solvus curves obtained in experi- mentally practicable times, by controlling both the direction from which complete equilibrium is achieved and the magnitude of the changes required to achieve com- plete equilibrium. Peralkaline conditions (as alkali chloride or hydroxide) appear to influence the rate of equilibration but not the equilibrium itself. Our data also show that some materials reach equilibrium from different directions at different tempera- tures; dearly behaviour like this could very well generate breaks in solvus limbs like those postulated by Luth, Martin, and Fenn (1974). We note that the break occurs at 495 to 524 ~ 1.25 kbar, which is the temperature range over which we observe changes in direction of equilibration with time in our AbToOr30(M) data, and where our AbToOr30(H ) and AbGoOr40(H) data begin to lie inside our presumed binodal. These departures have been explained in terms of direction and rate of equilibration and we think that the similarity between our binodal and Orville's (1963) binodal (fig. 7) is not due to chance. Transient growth of analcime is another possible control on the composition of early feldspar compositions, and 5oo ~ is the highest tempera- ture at which we observed analcime in our runs. Breaks in solvi and the sensitivity of solvus curves to 'non-stoichiometry' must be proved by reversals or at least 'time and motion ' studies before being accepted as indicating real differences in N a : K ratio between feldspars in complete equilibrium.
Acknowledgements. The bulk of the experiments in this study were carried out by Smith during tenure of an N.E.R.C. Research Studentship, as part of a study submitted as a Ph.D. thesis, University of Aberdeen. The apparatus was financed in part by an N.E.R.C. Research Grant to Parsons. We are grateful to R. Clark and T. Trendall for technical assistance, and to Professors D. R. Waldbaum and L. T. Trembath who kindly reviewed an early version of the manuscript.
REFERENCES BOWEN (N. L.) and TUTTLE (O. F.), I95o. Journ. Geol. 58, 489. BACHINSKI (S. W.) and MI)LLER (G.), I97I. Journ. Petrology, 12, 329. EU~SXER (H. P.), ALBEE (A. L.), BENCE (A. E.), THOMPSON ~J. B.), and WALDBnUM (D. R.), I972.
Ibid. 13, I47.
THE A L K A L I - F E L D S P A R SOLVUS 767
GOLDSMITH (J. R.) and NEWTON (R. C.), I974. The Feldspars, 337; eds. MAcKENzIE (W. S.) and ZUSSMAN (J.); Manchester University Press.
HAMILTON (D. L.) and MACKENZIE (W. S.), I96o. Journ. Petrology, 1, 56. LUTH (W. C.), 1974. The Feldspars, 249; eds. MACKeNzIE (W. S.) and ZUSSMAN (J.); Manchester
University Press. - - MARTIN (R. F.), and FENN (P. M.), 1974. Ibid. 297. - - and TUTTLE (O. F.), I966. Amer. Min. 51, I359. MACKENZIE (W. S.), I957. Amer. Journ. Sci. 251,481. MARTIN (R. F.), I969. Contr. Min. Petr. 23, 323. MORSE (S. A.), :97o, Journ. Petrology, 11, 22I. ORVILLE (P. M.), 1963. Amer..four. Sei. 261, 2oi. OWEN (D. C.) and MCCONNELL (J. D.), 1971. Nature (Phys. Sci.), 230, 118. PARSONS 0.), 19682. Min. Mag. 36, 797. - - I968b. Ibid. IO6I. - - 1969. Ibid. 37, 173. PrWlNS~Zn (A. J.) and MARTIN (R. F.), 197o. Contr. Min. Petr. 29, 1. RoY (R.), I956. Journ. Amer. Ceram. Soc. 39, I45. SCHAIRER (J. F.), I950. Journ. Geol. 58, 512. SEC~: (H. A.), I972. Fortschr. Min. 49, 3I. SMITH (J. V.) and MACKENZIE (W. S.), 1961. Estudios Geologicos, Cursillos y Conferencias, 8, 39. Trlor0wSON (J. B.) and WALDBAUM (D. R.), I968. Amer. Min. 53, 1965.
:969. Ibid. 54, 811. TREMBATH (L. T.), I973. Min. Mag. 39, 455. TtrrTLE (O. F.) and BOWEN (N. L.), 1958. Geol. Soc. Amer. Mere. 74. WALDBAUM (D. R.) and TrtOMPSON (J. B.), :969. Amer. Min. 54, 1274. WRmHT (T. L.), 1968. Ibid. 53, 88. YUND (R. A.) and MCALLISTER (R. H.), 1970. Chem. Geol. 6, 5.
[Manuscript received 25 October 2973.]
A P P E N D I X I
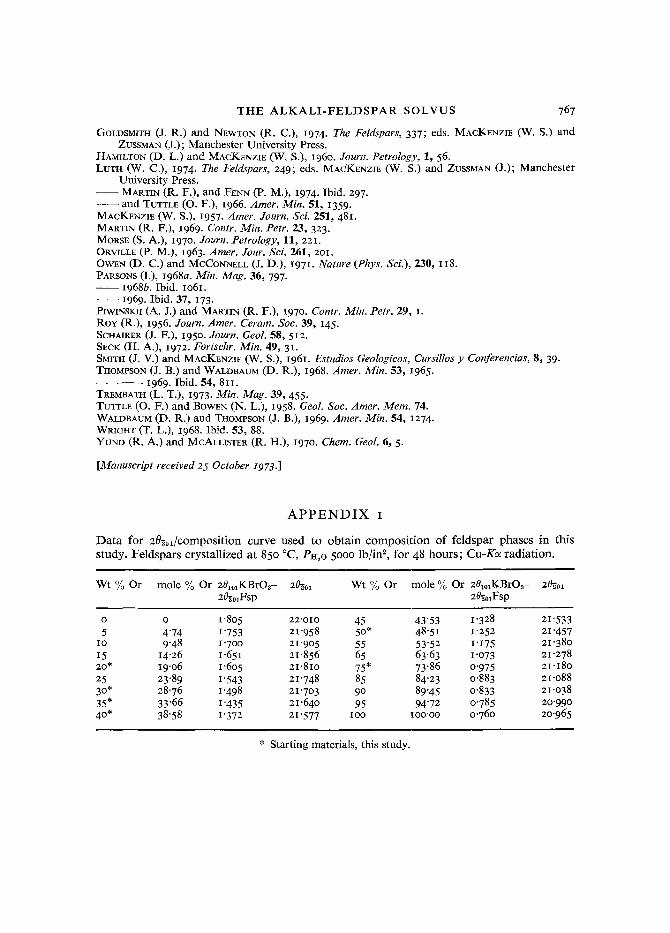
Data for 20:0:/composition curve used to obtain composition of feldspar phases in this study. Feldspars crystallized at 85o ~ P~,o 50oo lb/in 2, for 48 hours; Cu-K~ radiation.
W t % O r mole%Or 201o:KBrO3- 207o1 W t % O r mole%Or 2~o:K]3rOa- 207o1 207olFsp 207oxFsp
o o 1'8o5 22.oto 45 43"53 I'328 2I'533 5 4"74 1'753 21"958 50* 48"5I 1"252 2I'457
IO 9"48 1"7oo 2I'9O5 55 53'52 I'I75 2I'380 I5 I4"26 I'65I 21"856 65 63'63 I'073 21"278 20* 19-o6 I'605 21"810 75* 73"86 0"975 21"180 25 23'89 I"543 2I'748 85 84"23 O'883 21"088 3O* 28"76 I'498 2I'703 9O 89"45 O'833 2I'O38 35* 33"66 1"435 2I"640 95 94"72 O'785 2O'99O 4O* 38"58 I'372 2I'577 IOO IOO'OO 0"760 20'965
* Starting materials, this study.