Embed Size (px)
Citation preview

The Alcohol and Other Drug
Use in Georgian Students
The Alcohol and Other Drug
Use in Georgian Students
ESPADESPAD
Levan Baramidze
pilot study rigorously following criteria of European School Project on Alcohol and Other Drug
South Caucasus Anti Drug (SCAD) Programme (Phase V).
This Programme is funded by the European Union
and implemented by UNDP

Levan Baramidze
The Alcohol and Other Drug Use in Georgian Students
pilot study rigorously following criteria of European School Project on
Alcohol and Other Drug (ESPAD)
This publication was made possible through the support provided by the South Caucasus
Anti Drug (SCAD) Programme (Phase-V), which is funded by the European Union and
implemented by UNDP
AUTHORS AND CONTRIBUTORS:
Levan Baramidze, MD PhD MPH – Author
akaki Gamkrelidze, MD PhD; National Center for Disease Control and Public Health, Ministry of Labor, Health and Social Affaires
Jana d. Javakhishvili, Information/Prevention Expert, SCAD Programme
Lela Sturua, MD PhD MPH, Epidemiology Expert, SCAD Programme
Platon nozadze, Country manager for Georgia, SCAD Programme
Giorgi Gakheladze, Ministry of Education and Science
EDITOR
Lela Sturua, MD PhD MPH Epidemiology Expert, SCAD Programme
REVIWER
Tomas zabransky, MD PhD, International Epidemiology Expert, SCAD Programme
Published by Publishing-Advertising company – SAUNJE
iSBn 978-9941-0-1820-6

- 3 -
PrefaceThis is the report from the data collection of the Alcohol and Other Drug Use in Georgian Students, pilot study rigorously following Criteria of European School Project on Alcohol and Other Drug (ESPAD).
Over the years ESPAD has become an important source of information on young people’s substance use. The ESPAD project was initiated in 1993 by the Swedish Council for Information on Alcohol and Other Drugs (CAN) as a follow up of a test of a European school survey questionnaire funded by the Pompidou Group at the Council of Europe in a pilot study in 1986–88, which concluded that the validity and reliability of the questionnaire were high.
Work on this report would not have been possible without financial support from the UNDP under the supervision of the South Caucasus anti-Drug (SCAD) Program. We are grateful for their support and qualified contribution SCAD epidemiology experts: Tomas Zabransky, MD PhD and Lela Sturua, MD PhD MPH.
Special thank to the representatives of the Ministry of Labor, Health and Social Affaires and the Ministry of education and Science of Georgia.
A number of people have made an important contribution to this report, including teachers, research assistants and others who collected data, Tbilisi students who by participating in the data collection, helped us to arrive at a better understanding of youth’s substance use.
Tbilisi, July 2009Levan Baramidze, MD PhD MPH
Principal Investigator

- 4 -
CONTENTSPreface ....................................................................................................................................................3
List of figures ....................................................................................................................................................5
List of tables ....................................................................................................................................................5
Summary ....................................................................................................................................................7Methodology .............................................................................................................................................7Results ....................................................................................................................................................7Cigarettes ...................................................................................................................................................7Alcohol ....................................................................................................................................................7Illicit drugs ................................................................................................................................................7Other substances ........................................................................................................................................8
Introduction.……………………………………………………………………………………………………9
Study design and procedures ...........................................................................................................................10The target population ..............................................................................................................................10The data collection instrument ................................................................................................................10Sampling procedure ................................................................................................................................11Field procedure ........................................................................................................................................14Questionnaire and data processing ..........................................................................................................14
Methodological considerations ........................................................................................................................15
Results ..................................................................................................................................................17Cigarettes .................................................................................................................................................17Alcohol ..................................................................................................................................................19Illicit drugs ..............................................................................................................................................28Cannabis ..................................................................................................................................................30Various substances ..................................................................................................................................33Perceived risks of legal and illegal substance use ...................................................................................34Lifetime abstinence from various substances .........................................................................................35
Conclusions ..................................................................................................................................................36
References ..................................................................................................................................................37
Appendix 1List of institutions and individuals who supported the survey ........................................................................38
Appendix 2List of researchers ............................................................................................................................................39
Appendix 3ESPAD Class room report ................................................................................................................................40
Appendix 4Focus Groups Summary Report .......................................................................................................................42
Appendix 5Student questionnaire .......................................................................................................................................43
Appendix 5Student questionnaire .......................................................................................................................................68

- 5 -
List of figures
Figure 1 Information about schools in Tbilisi by districts ...........................................................................11
Figure 2 Information about sampling of schools in Tbilisi ........................................................................ 12
Figure 3 Map of Tbilisi by districts ............................................................................................................ 13
List of tablesTable 1 Information about schools in Georgia ............................................................................................11
Table 2 Percentages of genders in grades of all schools in Tbilisi ............................................................. 12
Table 3 Proportion of unanswered questions; all students .......................................................................... 16
Table 4 Frequency of lifetime use of cigarettes .......................................................................................... 17
Table 5 Cigarette smoking during the last 30 days ..................................................................................... 18
Table 6 Perceived availability of substances. Percentages among boys, girls and all students answering ”Very easy” or ”Fairly easy” ............................................................................. 19
Table 7 Frequency of lifetime use of any alcoholic beverage .................................................................... 19
Table 8 Frequency of use of any alcoholic beverage during the last 12 months ........................................ 20
Table 9 Frequency of use of any alcoholic beverage during the last 30 days ............................................. 20
Table 10 Frequency of beer drinking during the last 30 days ..................................................................... 20
Table 11 Frequency of wine drinking during the last 30 days .................................................................... 21
Table 12 Frequency of drinking spirits during the last 30 days .................................................................. 21
Table 13 Quantities of beer consumed on the last alcohol drinking occasion ............................................ 22
Table 14 Quantities of champagne consumed on the last alcohol drinking occasion. ................................ 22
Table 15 Quantities of wine consumed on the last alcohol drinking occasion ........................................... 22
Table 16 Quantities of spirits consumed on the last alcohol drinking occasion ......................................... 23
Table 17 Estimated average consumption of beer, wine, spirits, champagne in ml 100% alcohol, on the last drinking occasion ............................................................. 23
Table 18 Lifetime frequency of being drunk .............................................................................................. 24
Table 19 Frequency of being drunk last 12 months .................................................................................... 24
Table 20 Frequency of being drunk last 30 days ........................................................................................ 24
Table 21 Degree of drunkenness ................................................................................................................. 25
Table 22 Frequency of drinking five or more drinks in a row .................................................................... 25

- 6 -
Table 23 Drinking places on the last drinking day. Percentages among boys, girls and all students ......... 26
Table 24 Expected personal consequences of alcohol consumption. Percentages among boys, girls and all students answering “Very likely” or “Likely” .......................... 27
Table 25 Experienced problems caused by own alcohol use ...................................................................... 28
Table 26 Perceived availability of substances. Percentages among boys, girls and all students ................ 29
Table 27 Frequency of lifetime use of any illicit drug. Percentages among boys, girls and all ................. 29
Table 28 Frequency of lifetime use of marijuana. Percentages among boys, girls and all students ........... 30
Table 29 Frequency of use of marijuana or hashish during the last 12 months. Percentages among boys, girls and all students ..................................................................................... 30
Table 30 Frequency of use of marijuana during the last 30 days. Percentages among boys, girls and all students ..................................................................................... 31
Table 31 Places where marijuana or hashish easily can be bought. Percentages among boys, girls and all students ..................................................................................... 31
Table 32 Frequency of lifetime use of any illicit drug other than marijuana. Percentages among boys, girls and all students ..................................................................................... 32
Table 33 Lifetime experience of different illicit drugs. Percentages among boys, girls and all ................. 32
Table 34 Lifetime use of tranquillizers or sedatives; anabolic steroids; alcohol together with pills; alcohol together with cannabis. Percentages among boys, girls and all students .................................. 33
Table 35 Perceived risk of substance use. Percentages among boys, girls and all students answering “Great risk” ........................................................................................ 34
Table 36 Experienced problems caused by own drug use .......................................................................... 35
Table 37 Perceived drug use among friends. Percentages among boys, girls and all students ................... 36

- 7 -
Summary
The main purpose of the European School Survey Project on Alcohol and Other Drugs (ESPAD) is to collect comparable data on substance use among 15–16 year-old European students in order to monitor trends within as well as between countries. This summary presents key results from the Alcohol and Other Drug Use in Georgian Students, pilot study rigorously following Criteria of European School Project on Alcohol and Other Drug (ESPAD).
Methodology The surveys were conducted according to a standardized methodology and with a standardized questionnaire. Data were collected during February 2009 and the target population was Tbilisi students in the 10-th grade (93% born in 1992), with a mean age of 16.1 years at the time of data collection.Data were collected by group-administered questionnaires. The students answered the questionnaires anony-mously in the classroom with researchers.
ResultsCigarettesA small number of questions regarding cigarette smoking are given at the beginning of the questionnaire. On average, in our survey, about half of the surveyed students reported having tried smoking cigarettes at least once and 16% had used cigarettes during the past 30 days. 1.1% of all students had smoked at least a packet of cigarettes per day during the last 30 days. On average 60% of surveyed students replied that they find it fairly or very easy to get cigarettes if they want to. On average, 30% (10% - 9 years old or less) of the students said that they had been smoking cigarettes on a daily basis at the age of 13 or younger. The proportion of students who smoked on a daily basis at the age of 13 or younger is 4.3%.
AlcoholAlcoholic beverages, especially beer and wine are considered easily available; 73% found beer and 70% wine easy to obtain. About 90% of the students sample has drunk alcohol at least once during their lifetime. The cor-responding average figures for the past 12 months and the past 30 days are 80% and 40% respectively. Gender differences become apparent when frequency of use is considered: boys have used alcohol more often than girls. 7.5% of the students state that, they never drink alcohol at all. Wine and beer are the two most important types of beverage for the students. On average, 40% of students on the latest drinking day consumed wine and 38% - beer. Champagne and spirits consumed 29% and 22% of students, respectively. On average, half of the students have been intoxicated, at least once during their lifetime, to the point of staggering when walking, having slurred speech or throwing up. 40% reported intoxication in the last 12 months and 12% in the past 30 days. Another way to measure drunkenness is to ask about a specific amount of alcohol consumed within a certain period of time. The students were asked if they had had five drinks or more on one occasion during the past month; this is referred to here as “heavy episodic drinking”. 40% reported this; more boys than girls did so (45% versus 33%). More than half of the questioned students had consumed at least one glass of alcohol at the age of 13 or younger, and 25% had been drunk at that age. Having been intoxicated during the past 30 days, in turn, co-varies both with anticipating more positive consequences from drinking and with having experienced more negative personal consequences when drinking.
Illicit drugsThe term “any illicit drug” includes cannabis, amphetamines, cocaine, crack, ecstasy, LSD and heroin. 22% of the surveyed students perceive cannabis to be easily available, and boys consider cannabis slightly more accessible than girls do, the gender difference is rather big (31% vs.13%). Amphetamines and ecstasy are not perceived to be as easily available as cannabis. On average, 33% of the boys and 8% of the girls have tried

- 8 -
illicit drugs at least once during their lifetime (20% for all students). After cannabis, ecstasy is in second posi-tion, being mentioned by 7.5% of the students and the figure for amphetamines is about 2%. Lifetime use of crack was reported by fewer students (1.1%) and the rate for heroin was even lower (1%). Lifetime cocaine and heroine experiences were reported by 0.6% of the students on average. Just as few reported experience of GHB and anabolic steroids or drug use by intravenous administration. Since cannabis is the most frequently used illicit drug, it could be worthwhile to have a closer look at this substance. Use of cannabis in the past 12 months was reported by 17% of the boys and 3% of the girls (10% for all students) while use in the past 30 days was stated by 6.5% of the boys and 0.8% of the girls (3% mean).
Other substancesLifetime use of tranquillizers or sedatives with a doctor’s prescription was reported by 5.5% of the students and 0.04% reported use of such substances without a personal prescription. Use of alcohol together with pills “in order to get high” was reported by 0.01% of girls and 0.04% of boys (the average was 0.03%). Use of alcohol together with cannabis “in order to get high” was reported by 13.5% of boys and 2% of girls (the average - 8%).

- 9 -
Introduction
Health effects of tobacco, alcohol and drug consumption are evident on the individual as well as the societal level. The prevalence rates of alcohol, tobacco and other drugs use are matters of concern to public policy in most countries, since they are important factors related to the health and welfare of the population.
The wellbeing of young people is of special concern in all societies and ongoing efforts should be made to reduce all types of dangerous behavior. These include many aspects of the consumption of tobacco, alcohol and illegal drugs.
To date, there has been no general population surveys focused on substance use conducted in Georgia. Hence, there are no valid data on the prevalence or incidence of drug use neither among the general population, or various subpopulation groups such as students.
Since 1999 youth have been surveyed on regular basis (once in two years) within the framework of the state drug prevention program using the 1999 version of the ESPAD questionnaire adapted to the Georgian cultural environment and specific goals of the study sponsors. The last surveillance was conducted by the Georgian Research Institute on Addiction (GRIA) in May 2005. 735 students from 13 secondary schools of Tbilisi were covered; the surveyed were born in 1988-1989. Interviewees (41% boys and 59% girls) were selected by random sampling method. It should be mentioned that GRIA had no agreement from the ESPAD council; the studies were not conducted in compliance with ESPAD standards; the questionnaire used was obtained without ESPAD council permission and covered just several topics of ESPAD original questionnaire. These studies can be considered neither as ESPAD studies nor as ESPAD-like studies as it is respected by different Georgian institutions and experts. (Javakhishvili et al, 2006).
ESPAD surveys focus on risk behaviors spread among young people. These behaviors give information about lifestyles, which could occur again in following growth stages. Gathering better knowledge has important im-plications in terms of public health.
ESPAD data has become an increasingly important component in reporting of the European drug situation and is part of the EMCDDA key indicator “drug prevalence in the general population and youth”. Future full par-ticipation in the ESPAD would make a useful contribution to the overall understanding of drug use in Georgia. The main purpose of this pilot study was to adjust the internationally standardized tools to national environ-ment, and, subsequently, to pilot-test the ESPAD methodology in Tbilisi, Georgia in order to make the nec-essary step aiming to involvement of the whole country into next wave of nationally representative ESPAD surveys (Georgia hopes to apply for early spring 2011); to obtain a high-quality Georgian questionnaire and sampling procedure, and study protocol that would achieve the ESPAD scientific criteria while reflecting the cultural and linguistic specificity, and to increase national research capacity in this area.
- 10 -
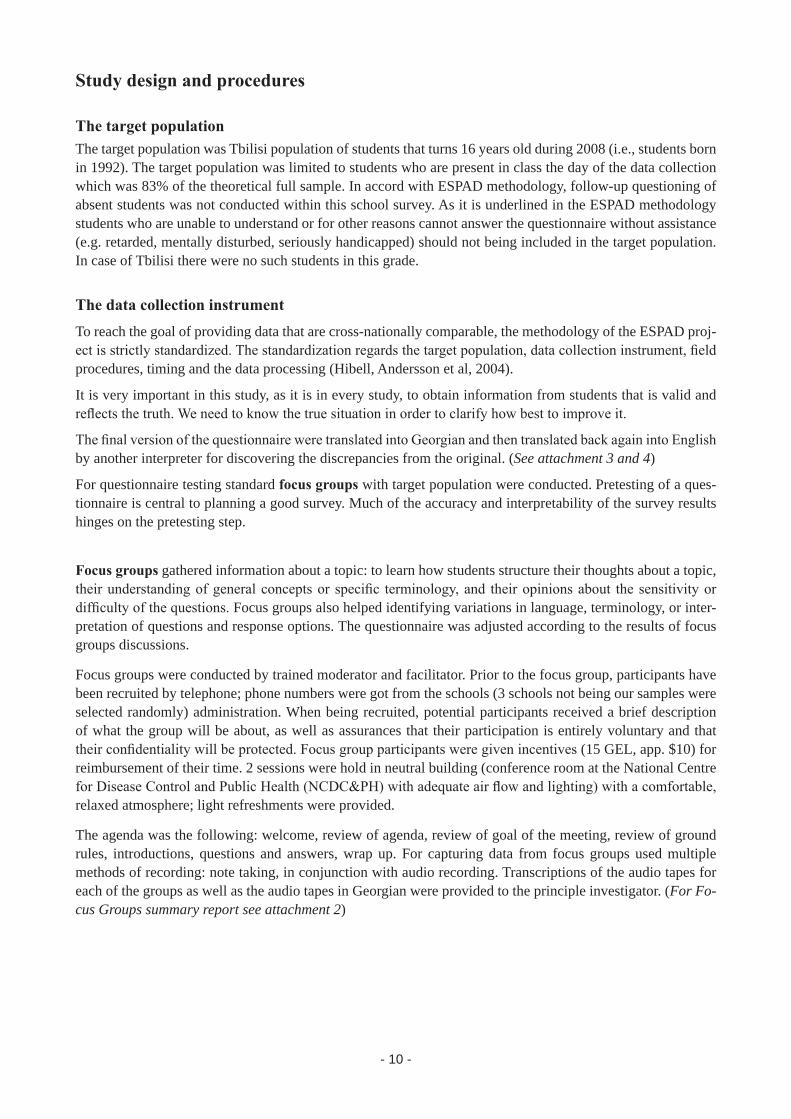
Study design and procedures
The target populationThe target population was Tbilisi population of students that turns 16 years old during 2008 (i.e., students born in 1992). The target population was limited to students who are present in class the day of the data collection which was 83% of the theoretical full sample. In accord with ESPAD methodology, follow-up questioning of absent students was not conducted within this school survey. As it is underlined in the ESPAD methodology students who are unable to understand or for other reasons cannot answer the questionnaire without assistance (e.g. retarded, mentally disturbed, seriously handicapped) should not being included in the target population. In case of Tbilisi there were no such students in this grade.
The data collection instrumentTo reach the goal of providing data that are cross-nationally comparable, the methodology of the ESPAD proj-ect is strictly standardized. The standardization regards the target population, data collection instrument, field procedures, timing and the data processing (Hibell, Andersson et al, 2004).
It is very important in this study, as it is in every study, to obtain information from students that is valid and reflects the truth. We need to know the true situation in order to clarify how best to improve it.
The final version of the questionnaire were translated into Georgian and then translated back again into English by another interpreter for discovering the discrepancies from the original. (See attachment 3 and 4)
For questionnaire testing standard focus groups with target population were conducted. Pretesting of a ques-tionnaire is central to planning a good survey. Much of the accuracy and interpretability of the survey results hinges on the pretesting step.
Focus groups gathered information about a topic: to learn how students structure their thoughts about a topic, their understanding of general concepts or specific terminology, and their opinions about the sensitivity or difficulty of the questions. Focus groups also helped identifying variations in language, terminology, or inter-pretation of questions and response options. The questionnaire was adjusted according to the results of focus groups discussions.
Focus groups were conducted by trained moderator and facilitator. Prior to the focus group, participants have been recruited by telephone; phone numbers were got from the schools (3 schools not being our samples were selected randomly) administration. When being recruited, potential participants received a brief description of what the group will be about, as well as assurances that their participation is entirely voluntary and that their confidentiality will be protected. Focus group participants were given incentives (15 GEL, app. $10) for reimbursement of their time. 2 sessions were hold in neutral building (conference room at the National Centre for Disease Control and Public Health (NCDC&PH) with adequate air flow and lighting) with a comfortable, relaxed atmosphere; light refreshments were provided.
The agenda was the following: welcome, review of agenda, review of goal of the meeting, review of ground rules, introductions, questions and answers, wrap up. For capturing data from focus groups used multiple methods of recording: note taking, in conjunction with audio recording. Transcriptions of the audio tapes for each of the groups as well as the audio tapes in Georgian were provided to the principle investigator. (For Fo-cus Groups summary report see attachment 2)

- 11 -
Sampling procedureThe goal of the sampling process is to obtain a national and gender wise representative data set.
It is recommended that each country, with some minor exceptions, should draw a sample of about 2,800 stu-dents as a minimum, regardless of the size of the country. This was calculated to give about 2400 answered questionnaires, which would allow for analysis by sex plus another variable (Bjarnason and Morgan, 2002).
Georgia has detailed information about the number of schools, classes and students available from the Ministry of Education and Science of Georgia1 in electronic format (with the exception of the regions of South Osse-tia and Abkhazia that are occupied by military troops of the Russian Federation recently). There were 2462 schools (both public and private) in Georgia in the time of the study, out of which 313 schools were in Tbilisi. Detailed information about Georgia and Tbilisi schools is provided in table 1 and figure 1.
Table 1 Information about schools in Georgia
All schools 2462
Public 2215
Private 247
1-12 grade 1920
1-4 grade 1
1-6 grade 33
7-9 grade 5
10-12 grade 18
10-11 grade 1
7-9-11 grade gymnasium 3
1-9 grade 466
7-12 grade 15
Figure 1. Information about schools in Tbilisi by districts
1 52, D. Uznadze str., 0102, Tbilisi, Georgia; Phone: (995 32) 43 88 19; www.mes.gov.ge

- 12 -
Table 2 Percentages of genders in grades of all schools in Tbilisi
Grades I II III IV V VI VII VIII IX X XI XII
Girls 47% 46% 47% 46% 47% 47% 47% 48% 48% 48% 49% 49%
Boys 53% 54% 53% 54% 53% 53% 53% 52% 52% 52% 51% 51%
We’ve done a two step random sampling. A first step was to randomly sample schools and the second to ran-domly sample a class within the selected schools. During the meetings with the official representatives of the Ministry of Education and Science of Georgia it appeared that the vast majority, namely 88% of 16th years old students in Georgia are aggregated in 10th grade, this percentage is even higher (93%) for Tbilisi. Taking into account the above mentioned fact and also the experts’ evidence-based conclusions that in Georgian culture risky behaviors/habits are more associated with the school grade than with the age of students, the Ministry recommended surveying 10-th grade students. The survey management board took into consideration several main aspects: 1)the ESPAD project is based on a complex sample design that takes into account national and regional differences in participating countries; 2) the ESPAD project recommends to include as many grades as possible that included students born in 1992, or at least each grade that included 10% or more of the target population and the only such grade in Tbilisi schools is 10-th grade; 3) In 2007 ESPAD survey several countries such as Armenia, Cyprus, Denmark, Finland, Iceland, Norway, Poland, Sweden and etc. conducted the study only in one grade; and decided to survey Tbilisi 16-th year old students in one – 10-th grade. From our point of view it can’t be regarded as a weakness of our study.(Hibell et al, Substance Use Among Students in 35 European Countries; The 2007 ESPAD Report) Each step was done randomly, we choose 20 schools from the all schools, both public and private having 10-th grade. One 10-th grade class (with 16th years old students in almost all cases) from each selected schools was chosen randomly in each sampled school.
Figure 2. Information about sampling of schools in Tbilisi
All students (who are present in class the day of the data collection) in selected classes participated in the survey.
In this survey it was not necessary to study 2 800 students, as our survey site isn’t the whole Georgia, but the capital city and especially that the exact results were not our main interest, but the methodology. In this pilot study a two-stage cluster sample design has been used; sampling was based on classes as the final sampling unit. This procedure is more economical than sampling individual students and also has some desirable meth-odological properties, e.g. sampling entire classes can be expected to increase student perceptions of anonym-ity (Bjarnason and Morgan, 2002).

- 13 -
NCDC&PH has close contacts with the Ministry of Education. After negotiation the permission to conduct the survey was obtained. The selected schools were noticed in 1-2 weeks advance. No school refused to participate in the survey. The special meeting with these schools representatives where held at NCDC&PH by survey prin-ciple investigator; SCAD epidemiology expert as well as MoE representative were attended. The classes were chosen randomly at the meeting, also exact date and time of survey for each school was set up.Materials include instructions, questionnaires and classroom reports were prepared for the interviewers (NCDC&PH employees) collecting the data.
No school or class refused to participate in the survey. When the students had filled out the questionnaire they put it in a separate envelope, which was collected and sent to NCDC&PH together with the classroom report. (See attachment 1)
Data was collected in the period February 9–13, 2009. The mean age is 16.1±0.5 years.
Sampling frame for Tbilisi:20 schools - 6 schools (5 public and 1 private) in Gldani-Nadzaladevi; 6 schools (4 public and 2 private) in Vake-Saburtalo; 4 schools (all public) in Samgori, 2 schools (all public) in Didube-Chughureti and 2 schools (all public) in Mtatsminda-Krtsanisi districts)
Figure 3. Map of Tbilisi by districts
The Tbilisi schools differ by the number of students; the same is in our sample: in different schools there is different number of students – from 91 to 1327.
Schools were selected from the schools list for each district using random numbers. All schools, both public and private had an equal chance of being chosen. 1 class per school was also selected randomly at the meeting at NCDC&PH using traditional method of drawing slips of paper from a hat; each school representative chose the class in their schools by him/herself.
475 students were tested in Tbilisi (469 completed valid questionnaires

- 14 -
Field procedureIn line with what was decided about the sampling and the data collection instrument, also the field procedures had to be standardized as much as possible (Hibell and Andersson, 2002).
The directors of the participating schools were contacted in 1-2 weeks advance by the survey team and in-formed regarding the planned study. He/she was asked to inform the teachers of the chosen classes, but not to inform the students in order to avoid discussions among them that could lead to biased data.
A written instruction for the survey leader describing how to perform the completion of the questionnaire in the classroom was created by the survey team.
The validity and reliability of collected data is a major concern in all surveys, and especially so in relation to sensitive behaviors such is drug use, etc. The validity of answers depends upon the respondents’ trusting that reporting such behavior would not result in any negative consequences. Thus, it was important that the students perceive the survey to be anonymous.
Data was collected by group-administered questionnaires, under the supervision of a researcher. The ques-tionnaires have been answered anonymously (they did not contain any identification number and the students did not write their names on the questionnaires). Another reason to believe that the students do feel that their integrity is safe we used the recommended model of having an envelope to each form for the student to seal him-/herself after having answered the questionnaire. Teachers not always attended the survey process; some schools administration required teachers attendance for cultural and security reasons as well as for avoidance any complaints from the parents and that’s the reason why we set up to them to decide whether to stay or not at classroom but under no circumstances was the teacher be allowed to see any questionnaire during the ad-ministration.
The researcher completed a classroom report (information on how many boys and girls are absent and the reasons) while the students answer the questionnaires. (See attachment N) Classroom reports were analyzed regarding students (boys and girls) attendance and reasons of absence, if there were any disturbances during the survey, if students were interested in participating in the survey, if they worked seriously and if any of them refused to participate.
Every class in the sample was given a unique identification number. When the questionnaires, the envelopes as well as researcher instructions and classroom reports were packed in order to be transported, each pack was marked with this class number.
Questionnaire and data processingAll ESPAD core questions were included in the questionnaire, except questions about alcopop and cider which are almost absent in the country; these questions were replaced with questions on champagne, a popular drink in Georgia.
The questionnaire (See attachment 3) was translated and back translated by different professional agencies: Translation Agency ‘Tbilisi’ and The Tbilisi Central School of English and Computing (TCS).
After completion the questionnaire was checked for completeness and if age or gender was missing it was compared with the information from the classroom reports and imputed. It worse to mention that it happened just in 3 cases from different schools. If the missing information was impossible to re-establish the question-naire was excluded.
Statisticians were instructed about checking individual questionnaires for completeness and validity. The data file was checked for data quality. The proportion of excluded questionnaires was small (6 questionnaire out of 475, 1.3%).

- 15 -
Methodological considerations
RepresentativenessThe target population was Tbilisi population of students in 10-th grade. The target population was limited to students who are present in class the day of the data collection, 83% of students. The survey is made on repre-sentative samples of school classes for Tbilisi.
Average age and time of the data collectionThe survey was conducted during February 9-13, 2009. Based on the time of data collection, an average age of students in selected 10-th grade classes was 16.1±0.5 years.
Representativeness of the samplesSampling in the ESPAD project is based on classes as the final sampling unit (Bjarnason and Morgan, 2002). It’s proved that this procedure is more economical than sampling individual students; and also sampling entire classes can be expected to increase student perceptions of anonymity.
School and student co-operation
All schools and students were willing to participate in the study. In majority of the classes the students were interested and worked seriously. The average time to fill out the questionnaire was 45 minutes. 83% of students were present at schools on the survey day, none of them refused to participate in. The response rate was 83%.
Absent students can be expected to be somewhat more prone to be involved in the use of various substances than is the case with students who are consistently in school (Grube J, Morgan M and Kearney K (1989); An-dersson B, Hibell B (1995)).
In our study the students were absent mainly because of illness (71% in public and 67% in private schools), the second frequent reason (15% in public and 14% in public schools) was sports games.
External validitySchool and student co-operation
All schools and students were willing to participate in the study.
Of the present students no one refused to participate in the survey. Students were quite interested in.
The response rate was 83%. The average time to fill out the questionnaire was 45 minutes. There were not reported any disturbances during completion of the questionnaire.
AnonymityIt is very important in this study, as it is in every study, to obtain information from students that is valid and reflects the truth. The validity of answers depends upon the respondents’ trusting that reporting such behavior would not result in any negative consequences. Thus, it was very important that the students perceive the sur-vey to be anonymous.
Data was collected by group-administered questionnaires, under the supervision of a researcher. The question-naires were answered anonymously (they did not contain any identification number and the students did not write their names on the questionnaires) and put in the envelope, students sealed it by him-/herself.
- 16 -
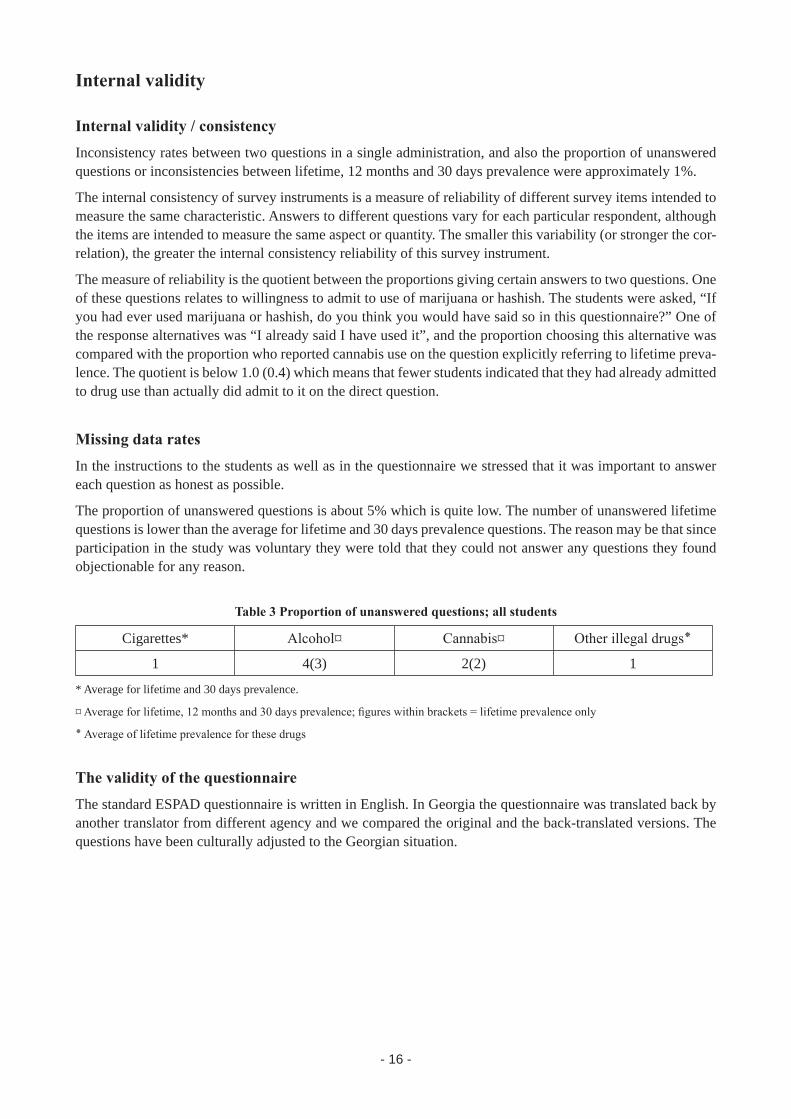
Internal validity
Internal validity / consistencyInconsistency rates between two questions in a single administration, and also the proportion of unanswered questions or inconsistencies between lifetime, 12 months and 30 days prevalence were approximately 1%.
The internal consistency of survey instruments is a measure of reliability of different survey items intended to measure the same characteristic. Answers to different questions vary for each particular respondent, although the items are intended to measure the same aspect or quantity. The smaller this variability (or stronger the cor-relation), the greater the internal consistency reliability of this survey instrument.
The measure of reliability is the quotient between the proportions giving certain answers to two questions. One of these questions relates to willingness to admit to use of marijuana or hashish. The students were asked, “If you had ever used marijuana or hashish, do you think you would have said so in this questionnaire?” One of the response alternatives was “I already said I have used it”, and the proportion choosing this alternative was compared with the proportion who reported cannabis use on the question explicitly referring to lifetime preva-lence. The quotient is below 1.0 (0.4) which means that fewer students indicated that they had already admitted to drug use than actually did admit to it on the direct question.
Missing data ratesIn the instructions to the students as well as in the questionnaire we stressed that it was important to answer each question as honest as possible.
The proportion of unanswered questions is about 5% which is quite low. The number of unanswered lifetime questions is lower than the average for lifetime and 30 days prevalence questions. The reason may be that since participation in the study was voluntary they were told that they could not answer any questions they found objectionable for any reason.
Table 3 Proportion of unanswered questions; all students
Cigarettes* Alcohol¤ Cannabis¤ Other illegal drugs٭
1 4(3) 2(2) 1
* Average for lifetime and 30 days prevalence.
¤ Average for lifetime, 12 months and 30 days prevalence; figures within brackets = lifetime prevalence only
Average of lifetime prevalence for these drugs ٭
The validity of the questionnaireThe standard ESPAD questionnaire is written in English. In Georgia the questionnaire was translated back by another translator from different agency and we compared the original and the back-translated versions. The questions have been culturally adjusted to the Georgian situation.

- 17 -
Results
The following text simply aims to give a descriptive picture of prevalence estimates in Tbilisi, and, to pres-ent results in regard to gender distributions. The section deals with the results regarding tobacco, the next one presents data on alcohol, and then follows a section dealing with illicit substances as well as licit substances other than tobacco and alcohol.
CIGARETTES In this section variables relating to cigarette smoking are presented. The exceptions are the questions about perceived risk from smoking, the results from them will be compared with those for the other substances.
Perceived availability of cigarettes The students were asked to indicate how difficult it would be for them to get hold of cigarettes if they wanted to. The response categories were: “impossible”, “very difficult”, “fairly difficult”, “fairly easy”, “very easy” and “don’t know”. The results presented in the tables section and discussed in this section are those for students who replied “very easy” or “fairly easy” (these categories are merged).
On average 60% of surveyed students replied that they find it fairly or very easy to get cigarettes if they want to. The gender differences as regards finding cigarettes easily available are negligible.
It is reasonable that a number of factors should determine perceptions of the availability of cigarettes: the number of places where cigarettes can be purchased, opening hours, and age limits which isn’t followed even described in the Anti Tobacco Low regulations.
Lifetime use of cigarettesLifetime-prevalence rates of cigarette smoking - about half of the students in the sample had tried smoking at least once.
Table 4 Frequency of lifetime use of cigarettes
Number of occasions used in lifetime Total
0 1-2 3-6 6-9 10-19 20-39 40 or more
No answer
Male 91 50 14 9 12 4 43 5 228
39,9% 21,9% 6,1% 3,9% 5,3% 1,8% 18,9% 2,2% 100,0%
Female 146 52 15 7 5 1 13 2 241
60,6% 21,6% 6,2% 2,9% 2,1% ,4% 5,4% ,8% 100,0%
Total 237 102 29 16 17 5 56 7 469
50,5% 21,7% 6,2% 3,4% 3,6% 1,1% 11,9% 1,5% 100,0%
Regular smokers, if defined as those who had been smoking 40 times or more in lifetime, made up 12%. Boys are in the majority as regards lifetime prevalence of cigarette smoking (about 40% boys and 60% girls), the gap between the sexes regarding the 40+ lifetime prevalence is 13.5%.
Last 30 days use of cigarettesThere is a strong statistical correlation between lifetime use and last 30 days use of cigarettes.
On average, 16% of the questioned students had used cigarettes during the past 30 days. The majority of the

- 18 -
students reporting cigarette use in the past 30 days had smoked 6-10 cigarettes or less per day on average. However, 1.1% of all students had smoked at least a box (20 cigarettes) a day during the past 30 days. The gender pattern showed that the proportions of students who have not been smoking during the last 30 days are high (about 78% boys and 90% girls). There are more boys than girls who have smoked cigarettes 11 times or more during last 30 days.
Table 5 Cigarette smoking during the last 30 days
Number of cigarettes per day in last 30 days Total
Not at all Less then 1
cigarette per week
Less then 1
cigarette per day
1-5 cigarette per day
6-10 cigarette per day
11-20 cigarette per day
More than 20
cigarette per day
No answer
Male 177 5 1 7 15 9 4 10 228
77,6% 2,2% ,4% 3,1% 6,6% 3,9% 1,8% 4,4% 100,0%
Female 218 3 1 6 2 1 1 9 241
90,5% 1,2% ,4% 2,5% ,8% ,4% ,4% 3,7% 100,0%
Total 395 8 2 13 17 10 5 19 469
84,2% 1,7% ,4% 2,8% 3,6% 2,1% 1,1% 4,1% 100,0%
Age of starting cigarette useYoung people may have tried occasionally to smoke early in life, and some of those who try it progress to habitual smoking while others do not. The proportion of students who had tried cigarettes at the age of 13 or younger is 30% (10% started smoking at the age 9 years old or less). The proportion of students who smoked on a daily basis at the age of 13 or younger is 4.3%.
CIGARETTES – A SUMMARYTo sum up, on average 50% of the students had tried cigarettes at least once and 16% had used cigarettes dur-ing last 30 days. Boys reported more use than girls. There is a strong statistical correlation between lifetime use and use in the past 30 days. On average, 4% of the surveyed students said that they started smoking daily at 13 or before. About 1% of questioned students had smoked at least a box of cigarettes per day during the past 30 days.

- 19 -
ALCOHOL
Perceived availability of alcoholic beveragesThe students were asked how difficult they would find it to get hold of beer, wine, champagne and spirits if they wanted to. We added the optional alternatives of cider and alcopops to the questionnaire -champagne which is relevant considering Georgian alcohol market and the drinking patterns of the students.
Almost three in four students (73%) stated that beer would be “fairly easy” or “very easy” to get if they wanted to do so. The corresponding figure for wine is about 70%, for champagne – 56.5% and that for spirits is 47.5%. On the whole, most alcoholic beverages were perceived to be relatively easily available and gender differences were relatively uncommon.
Table 6 Perceived availability of substances. Percentages among boys, girls and all students answering ”Very easy” or ”Fairly easy”
Beer Champagne Wine Spirits
Male 179 131 162 121
% 79,60% 59,60% 73,60% 54,80%
Female 162 134 165 102
% 67,80% 56,60% 71,40% 44,10%
Total 341 265 327 223
% 73,50% 58,00% 72,50% 49,40%
Lifetime and last 12 months use of alcoholAbout 90% of the students sample have drunk alcohol at least once during their lifetime. Those who have tried alcohol at least once are not all particularly experienced consumers or regular drinkers: an average of 28% have tried alcohol only on 1–5 occasions while, on the other hand, 20.5% have done so on 40 occasions or more. In the latter group, gender differences are more pronounced – 30.7% of the boys report use on 40 or more occasions but only 10.8% of the girls.
Table 7 Frequency of lifetime use of any alcoholic beverage
Number of occasions in lifetime Total
0 1-2 3-5 6-9 10-19 20-39 40 or more
No answer
Male 11 27 27 24 36 27 70 6 228
4,8% 11,8% 11,8% 10,5% 15,8% 11,8% 30,7% 2,6% 100,0%
Female 24 33 46 38 37 31 26 6 241
10,0% 13,7% 19,1% 15,8% 15,4% 12,9% 10,8% 2,5% 100,0%
Total 35 60 73 62 73 58 96 12 469
7,5% 12,8% 15,6% 13,2% 15,6% 12,4% 20,5% 2,6% 100,0%
Not all students who have tried alcohol have used it during the past 12 months, even if many have. 80% in-dicate alcohol use during the past 12 months. Having consumed alcohol 20 times or more during the last 12 months could probably be seen as a rather regular use; 9 percent of the students in our sample had done so.
The gender distribution showed that there are some differences; more girls than boys consume alcohol during the last 12 months except drinking 10 times or more. On average, 7% of the boys and none of the girls reported drinking 40 times or more during the 12 months prior to the survey.

- 20 -
Table 8 Frequency of use of any alcoholic beverage during the last 12 months
Number of occasions in last 12 months Total
0 1-2 3-5 6-9 10-19 20-39 ≥40 No answer
Male 28 50 41 22 37 19 17 14 228
12,3% 21,9% 18,0% 9,6% 16,2% 8,3% 7,5% 6,1% 100,0%
Female 43 82 48 28 24 7 0 9 241
17,8% 34,0% 19,9% 11,6% 10,0% 2,9% 0 3,7% 100,0%
Total 71 132 89 50 61 26 17 23 469
15,1% 28,1% 19,0% 10,7% 13,0% 5,5% 3,7% 4,9% 100,0%
Last 30 days use of alcoholAny alcoholic beverage
40% of the students had been drinking alcohol during the 30 days immediately prior to the survey. Overall, boys were more likely than girls to report the level of frequent drinking.
Table 9 Frequency of use of any alcoholic beverage during the last 30 days
Number of occasions in last 30 days Total
0 1-2 3-5 6-9 10-19 20-39 No answer
Male 111 49 30 6 12 4 16 228
48,7% 21,5% 13,2% 2,6% 5,3% 1,8% 7,0% 100,0%
Female 146 64 12 6 4 1 8 241
60,6% 26,6% 5,0% 2,5% 1,7% ,4% 3,3% 100,0%
Total 257 113 42 12 16 5 24 469
54,8% 24,1% 9,0% 2,6% 3,4% 1,1% 5,1% 100,0%
Types of beverage used in the last 30 daysThe students were asked if they had drunk beer, wine, champagne and spirits during the last 30 days. The most com-monly reported type of beverage was wine (44%), followed by beer (38%), champagne (29%) and spirits (24%). Gender differences are apparent for all beverages: more boys than girls reported drinking of any beverage.
Table 10 Frequency of beer drinking during the last 30 days
Number of occasions in last 30 days Total
0 1-2 3-5 6-9 10-19 20-39 ≥40 No answer
Male 109 56 28 11 13 3 3 5 228
47,8% 24,6% 12,3% 4,8% 5,7% 1,3% 1,3% 2,2% 100,0%
Female 168 49 9 5 1 1 0 8 241
69,7% 20,3% 3,7% 2,1% ,4% ,4% 0 3,3% 100,0%
Total 277 105 37 16 14 4 3 13 469
59,1% 22,4% 7,9% 3,4% 3,0% ,9% ,6% 2,8% 100,0%

- 21 -
Table 11 Frequency of wine drinking during the last 30 days
Number of occasions in last 30 days Total
0 1-2 3-5 6-9 10-19 20-39 ≥40 No answer
Male 103 60 21 18 9 4 1 12 228
45,2% 26,3% 9,2% 7,9% 3,9% 1,8% ,4% 5,3% 100,0%
Female 134 68 15 5 1 1 1 16 241
55,6% 28,2% 6,2% 2,1% ,4% ,4% ,4% 6,6% 100,0%
Total 237 128 36 23 10 5 2 28 469
50,5% 27,3% 7,7% 4,9% 2,1% 1,1% ,4% 6,0% 100,0%
Table 12 Frequency of drinking spirits during the last 30 days
Number of occasions in last 30 days Total
0 1-2 3-5 6-9 10-19 20-39 No answer
Male 147 37 8 13 8 2 13 228
64,5% 16,2% 3,5% 5,7% 3,5% ,9% 5,7% 100,0%
Female 186 28 9 2 3 1 12 241
77,2% 11,6% 3,7% ,8% 1,2% ,4% 5,0% 100,0%
Total 333 65 17 15 11 3 25 469
71,0% 13,9% 3,6% 3,2% 2,3% ,6% 5,3% 100,0%
Latest alcohol drinking dayBesides questions on alcohol consumption during specific time periods there is also a set of questions dealing with the latest day on which alcohol was used. The students are asked to report how large quantities, of vari-ous beverages, they consumed on the last day on which they drank any alcohol. The format of the response categories was based on fixed quantities relevant to each beverage type in terms of milliliters. Since container sizes (cans, bottles and glasses) differ between countries, Principal Investigator adjusted the examples illustrat-ing the response categories to fit the volumes according the Georgian reality - milliliters. The questions also include the response categories “I never drink beer/champagne/wine/spirits” and “I did not drink beer/cham-pagne/wine/spirits on the last day that I drank alcohol”. To make sure that the students would report amounts only for the latest drinking day (and not amounts for the latest occasion on which they drank each individual beverage), there was an initial filter question where students were told to list all beverages used on their last drinking occasion.
Non-consumers A total of 6.5% of the students stated that they never drink alcohol at all, when asked about consumption on their latest drinking day. Roughly 22% claimed never to drink beer; some 20% never used any champagne, 12% - wine and 36% - spirits. It should be noted that students claiming never to drink alcohol at present may have used alcohol in the past without considering themselves current users. Estimated average consumption on the latest drinking day When the students were asked what beverages they used on their latest drinking day, beer and champagne was mentioned by 51% each, spirits by 32% and wine by 69%. These results reflect the same order of beverages as for reported use in the last 30 days.
An attempt to estimate the total alcohol volume consumed on the latest drinking day is made in the following. The calculations are based on the volumes per beverage type and the alcohol content of the respective bever-ages, and the results are expressed in milliliters of pure (100%) alcohol.
- 22 -
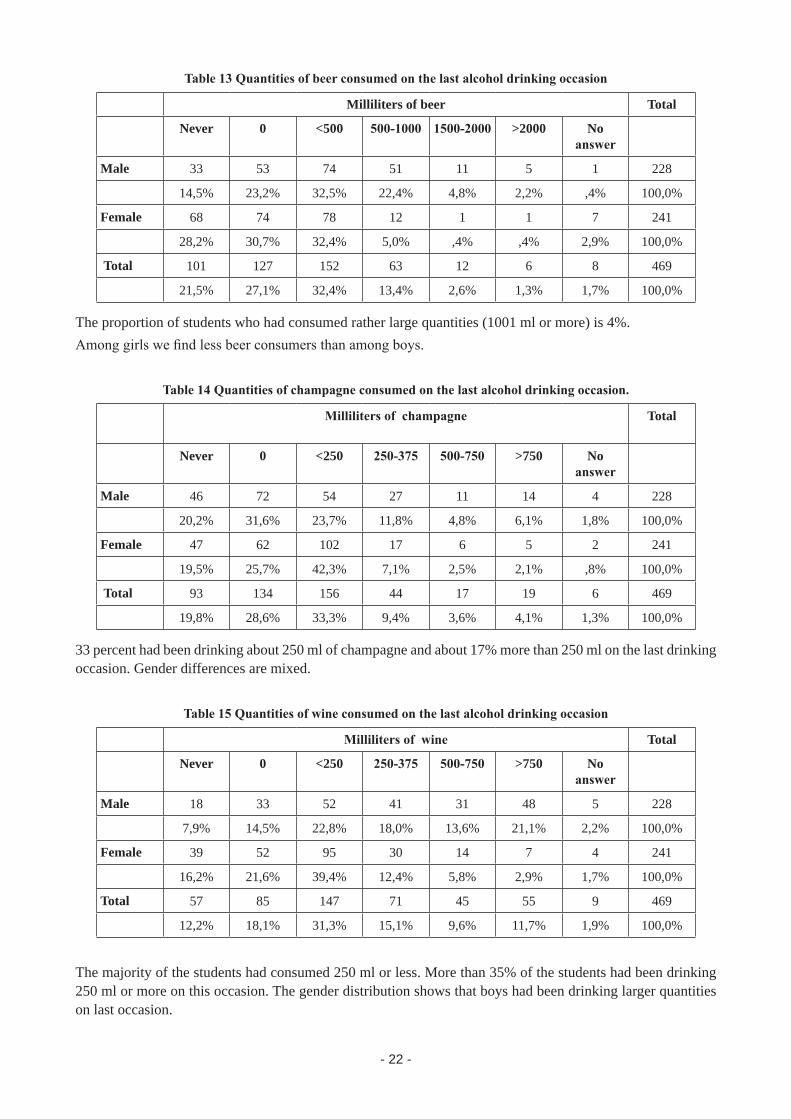
Table 13 Quantities of beer consumed on the last alcohol drinking occasion
Milliliters of beer Total
Never 0 <500 500-1000 1500-2000 >2000 No answer
Male 33 53 74 51 11 5 1 228
14,5% 23,2% 32,5% 22,4% 4,8% 2,2% ,4% 100,0%
Female 68 74 78 12 1 1 7 241
28,2% 30,7% 32,4% 5,0% ,4% ,4% 2,9% 100,0%
Total 101 127 152 63 12 6 8 469
21,5% 27,1% 32,4% 13,4% 2,6% 1,3% 1,7% 100,0%
The proportion of students who had consumed rather large quantities (1001 ml or more) is 4%. Among girls we find less beer consumers than among boys.
Table 14 Quantities of champagne consumed on the last alcohol drinking occasion.
Milliliters of champagne Total
Never 0 <250 250-375 500-750 >750 No answer
Male 46 72 54 27 11 14 4 228
20,2% 31,6% 23,7% 11,8% 4,8% 6,1% 1,8% 100,0%
Female 47 62 102 17 6 5 2 241
19,5% 25,7% 42,3% 7,1% 2,5% 2,1% ,8% 100,0%
Total 93 134 156 44 17 19 6 469
19,8% 28,6% 33,3% 9,4% 3,6% 4,1% 1,3% 100,0%
33 percent had been drinking about 250 ml of champagne and about 17% more than 250 ml on the last drinking occasion. Gender differences are mixed.
Table 15 Quantities of wine consumed on the last alcohol drinking occasion
Milliliters of wine Total
Never 0 <250 250-375 500-750 >750 No answer
Male 18 33 52 41 31 48 5 228
7,9% 14,5% 22,8% 18,0% 13,6% 21,1% 2,2% 100,0%
Female 39 52 95 30 14 7 4 241
16,2% 21,6% 39,4% 12,4% 5,8% 2,9% 1,7% 100,0%
Total 57 85 147 71 45 55 9 469
12,2% 18,1% 31,3% 15,1% 9,6% 11,7% 1,9% 100,0%
The majority of the students had consumed 250 ml or less. More than 35% of the students had been drinking 250 ml or more on this occasion. The gender distribution shows that boys had been drinking larger quantities on last occasion.

- 23 -
Table 16 Quantities of spirits consumed on the last alcohol drinking occasion
Milliliters of spirits Total
Never 0 <100 101-150 200-300 >300 No answer
Male 78 62 36 18 16 13 5 228
34,2% 27,2% 15,8% 7,9% 7,0% 5,7% 2,2% 100,0%
Female 86 84 35 19 5 4 8 241
35,7% 34,9% 14,5% 7,9% 2,1% 1,7% 3,3% 100,0%
Total 164 146 71 37 21 17 13 469
35,0% 31,1% 15,1% 7,9% 4,5% 3,6% 2,8% 100,0%
A clear difference between the sexes can be seen in the proportions that have been drinking 200 ml of spirits or more on this occasion
Estimated average consumption
The individual responses for different beverages were used to estimate the volumes consumed on the last drinking occasion. The volumes are based on the assumed alcohol contents for different beverage types and recalculated into pure alcohol. The alcohol content for beer is 5%, wine and champagne - 11% and spirits - 40%.
For the calculations the midpoints of each response category’s range are used. For the last open ended category the lowest value is used. This is most certainly a conservative estimate, since some of the students in this cat-egory probably had been drinking larger quantities. The calculations are done only for students who had ever been drinking alcohol.
Table 17 Estimated average consumption of beer, wine, spirits, champagne in ml 100% alcohol, on the last drinking occasion
Beer Champagne Wine Spirits Total Beer% Champagne % Wine% Spirits%
Male 2,89 2,79 3,91 2,57 12,15 23,78 11,71 33,41 7,68
Female 2,37 2,59 2,89 2,31 10,15 23,38 11,06 26,11 8,83
All students 2,62 2,68 3,39 2,43 11,13 23,59 11,37 29,78 8,17
Overall, the beverages most preferred and reported by the students are beer and wine. On average, they consti-tute slightly more than one fourth each.
If we focus on the amounts of drinks students had been drinking the largest quantities of wine and cham-pagne.
DrunkennessApart from being asked about the amount of alcohol they consumed on their latest drinking day, the students were also asked to indicate on a ten-point scale how drunk they felt on that day. Response category “1” means “not drunk at all” while “10” corresponds to “heavily intoxicated”, which was exemplified by having experi-enced memory gaps. Results for the self-estimated level of drunkenness are presented only for students who responded with a value between 1 and 10. Those stating that they do not drink alcohol at all are thus excluded from the analysis.
The students were asked to indicate how many times they had been intoxicated from alcohol drinking during
- 24 -
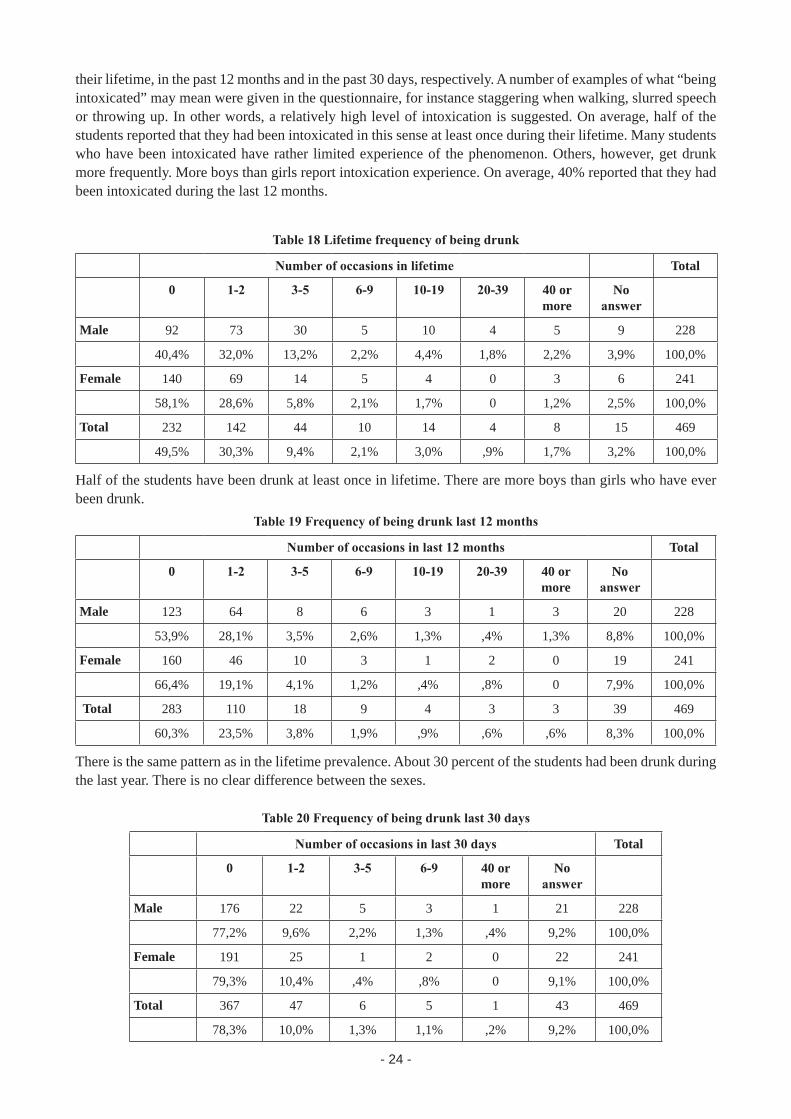
their lifetime, in the past 12 months and in the past 30 days, respectively. A number of examples of what “being intoxicated” may mean were given in the questionnaire, for instance staggering when walking, slurred speech or throwing up. In other words, a relatively high level of intoxication is suggested. On average, half of the students reported that they had been intoxicated in this sense at least once during their lifetime. Many students who have been intoxicated have rather limited experience of the phenomenon. Others, however, get drunk more frequently. More boys than girls report intoxication experience. On average, 40% reported that they had been intoxicated during the last 12 months.
Table 18 Lifetime frequency of being drunk
Number of occasions in lifetime Total
0 1-2 3-5 6-9 10-19 20-39 40 or more
No answer
Male 92 73 30 5 10 4 5 9 228
40,4% 32,0% 13,2% 2,2% 4,4% 1,8% 2,2% 3,9% 100,0%
Female 140 69 14 5 4 0 3 6 241
58,1% 28,6% 5,8% 2,1% 1,7% 0 1,2% 2,5% 100,0%
Total 232 142 44 10 14 4 8 15 469
49,5% 30,3% 9,4% 2,1% 3,0% ,9% 1,7% 3,2% 100,0%
Half of the students have been drunk at least once in lifetime. There are more boys than girls who have ever been drunk.
Table 19 Frequency of being drunk last 12 months
Number of occasions in last 12 months Total
0 1-2 3-5 6-9 10-19 20-39 40 or more
No answer
Male 123 64 8 6 3 1 3 20 228
53,9% 28,1% 3,5% 2,6% 1,3% ,4% 1,3% 8,8% 100,0%
Female 160 46 10 3 1 2 0 19 241
66,4% 19,1% 4,1% 1,2% ,4% ,8% 0 7,9% 100,0%
Total 283 110 18 9 4 3 3 39 469
60,3% 23,5% 3,8% 1,9% ,9% ,6% ,6% 8,3% 100,0%
There is the same pattern as in the lifetime prevalence. About 30 percent of the students had been drunk during the last year. There is no clear difference between the sexes.
Table 20 Frequency of being drunk last 30 days
Number of occasions in last 30 days Total
0 1-2 3-5 6-9 40 or more
No answer
Male 176 22 5 3 1 21 228
77,2% 9,6% 2,2% 1,3% ,4% 9,2% 100,0%
Female 191 25 1 2 0 22 241
79,3% 10,4% ,4% ,8% 0 9,1% 100,0%
Total 367 47 6 5 1 43 469
78,3% 10,0% 1,3% 1,1% ,2% 9,2% 100,0%

- 25 -
About 12% of the students have been drunk during the last 30 days. The majority of the students who had been drunk (10%) had been drunk only 1–2 times during the period. There is no clear difference between the sexes. Frequent intoxication (3 times or more during the last 30 days), is reported by more boys than girls.
Table 21 Degree of drunkenness
Total
1Never
2 3 4 5 6 7 8 9 10 11 No answer
Male 72 55 17 19 13 6 9 6 3 9 12 7 228
31,6% 24,1% 7,5% 8,3% 5,7% 2,6% 3,9% 2,6% 1,3% 3,9% 5,3% 3,1% 100,0%
Female 107 64 19 5 7 7 5 1 2 5 15 4 241
44,4% 26,6% 7,9% 2,1% 2,9% 2,9% 2,1% ,4% ,8% 2,1% 6,2% 1,7% 100,0%
Total 179 119 36 24 20 13 14 7 5 14 27 11 469
38,2% 25,4% 7,7% 5,1% 4,3% 2,8% 3,0% 1,5% 1,1% 3,0% 5,8% 2,3% 100,0%
The feeling of being drunk is a very subjectively defined state of mind. In addition, young people differ in their view on what should be defined as a state of intoxication. About 38% of the students reported that they had never been drunk. More than one third of the students had been only slightly affected by the alcohol as they indicated 2 or 3 on the scale; More than 17% of the students indicated 6 or higher on the scale. There are more boys than girls that have indicated a degree of drunkenness higher than 5 on the scale.
Heavy episodic drinkingThe students were asked how many times during the last 30 days they had had five drinks or more on one oc-casion. The idea behind this question is to measure alcohol drinking geared towards intoxication in a more standardized and less subjective way, and the concept under study is here labeled “heavy episodic drinking”. Consuming five alcoholic drinks or more on one occasion would cause most students of this age to reach at least some degree of intoxication. About 40% of the students reported such behavior to have occurred during the last 30 days. Heavy episodic drinking during the last 30 days is more common, on average, among boys than among girls (45% versus 33%). This should not be very surprising, given that girls are more sensitive to alcohol than boys owing to biological factors. In other words, to reach a given level of intoxication, girls need to consume less alcohol than boys and are therefore less likely to reach the cut-off point for heavy episodic drinking.
Table 22 Frequency of drinking five or more drinks in a row
Number of occasions in last 30 days Total
None 1 2 3-5 6-9 ≥10 No answer
Male 116 28 35 17 11 11 10 228
50,9% 12,3% 15,4% 7,5% 4,8% 4,8% 4,4% 100,0%
Female 158 52 15 9 3 1 3 241
65,6% 21,6% 6,2% 3,7% 1,2% ,4% 1,2% 100,0%
Total 274 80 50 26 14 12 13 469
58,4% 17,1% 10,7% 5,5% 3,0% 2,6% 2,8% 100,0%

- 26 -
Age of starting use of different alcoholic beverages and drunkenness70% of the surveyed students reported that they had drunk at least one glass of wine at the age of 13 or younger. The situation is more or less the same for champagne (66%) and beer (63%). It is less common to have had a glass of spirits (36%) at this age. 25% of surveyed students indicated being drunk at least once at the age of 13 or younger.
Boys are more likely than girls to have tried alcoholic beverages at the age of 13 or younger. This is true for all beverages asked about.
Alcohol purchasesThe students were asked to think back over the last 30 days and to indicate on how many occasions they had bought “beer, champagne, wine or spirits in a store (grocery store, liquor store, kiosk or petrol station)” for their own consumption. They gave a separate answer for each beverage. Roughly half of the students had bought beer last 30 days. Beer is the most commonly purchased type of alcoholic beverage. On average, 26% of students reported that they had bought beer in the last 30 days. Spirits (13%) are in second place. Purchases of wine and champagne were reported to a lesser extent (around 10% mentioned these beverages). For all alcohol types, it was more common to have made just a few (1–2) purchases during the period in question. Boys were more likely than girls to report having bought alcoholic beverages during the period in question. To explore whether the students consume alcohol in public establishments, they were asked to indicate how many times they had drunk “beer, champagne, wine or spirits in a pub, bar, restaurant or disco” during the past 30 days. Answers were given separately for each alcoholic beverage. On average, one in five students reported having consumed beer in a public establishment during the past 30 days. 17% had drunk spirits; about 13% had consumed wine and 12% champagne.
Drinking placesThe students were asked: “Think of the last day on which you drank alcohol. Where were you when you drank?” The students were allowed to mark more than one response category.
More than 43% of the students reported that they had been drinking at home, which is the most frequently indicated response. More than 27% of the students indicated “at someone else’s home”. Other responses were marked by less than 10 percent of students.
Table 23 Drinking places on the last drinking day. Percentages among boys, girls and all students
At home At someone else at home
Street, park other open area
Bar or pub
Disco Restaurant Other places
I never drink
Male 89 70 29 13 11 25 10 16
% 39,0% 30,7% 12,7% 5,7% 4,8% 11,0% 4,4% 7,0%
Female 115 57 3 3 3 19 12 27
% 47,7% 23,7% 1,2% 1,3% 1,2% 7,9% 5,0% 11,2%
Total 204 127 32 16 14 44 22 43
%43,5% 27,1% 6,8% 3,4% 3,0% 9,4% 4,7% 9,2%
Expected personal consequences of alcohol useThe students were asked to indicate how likely they thought that various positive and negative consequences were to happen if they drank alcohol. Five positive and six negative consequences were proposed. The positive ones were “feel relaxed”, “feel happy”, “feel more friendly and outgoing”, “have a lot of fun” and “forget my problems”. The six negative ones were “feel sick”, “get a hangover”, “not be able to stop drinking”, “harm my

- 27 -
health”, “do something I would regret” and “get into trouble with the police”. Most students associate their alcohol consumption with having fun. A large majority (63% on average) anticipate this as a possible conse-quence. The other anticipated positive consequences were each indicated by roughly half of the students, with “feel more friendly and outgoing” (55%) mentioned slightly less often. The proportion of students expecting their alcohol consumption to make them forget their problems is 23.2%.
Among the negative consequences, “get a hangover” (38%) and “feel sick” (36%) are the ones most often anticipated. The two least mentioned consequences were “get into trouble with the police” (14%) and “not be able to stop drinking” (12%). The response pattern is quite similar in both sexes, both in relation to the rank-ing of the items and the sizes of the percentages. More boys (20%) than girls (9%) thought that they probably would get into trouble with the police.
Comparison of the averages for positive and negative consequences, respectively, clearly shows that the stu-dents are more likely to expect positive rather than negative effects of their alcohol consumption.
Table 24 Expected personal consequences of alcohol consumption. Percentages among boys, girls and all students answering “Very likely” or “Likely”
“Positive” consequences “Negative” consequences
Feel relaxed
Feel happy
Feel more
friendly
Have a lot of
fun
Forget problems
Average Feel sick
Get a handover
Not be able stop
drink
Harm my
health
Do something I wood regret
Go trouble
with police
Average
M 125 106 138 155 86 122 73 83 32 57 41 45 55
% 54,8% 46,5% 60,5% 67,9% 37,7% 53,5% 32,1% 36,4% 14,0% 25,0% 18,0% 19,8% 24,2%
F 110 105 119 142 87 112,6 96 94 25 50 35 21 54
% 45,6% 43,5% 49,4% 58,9% 36,1% 46,7% 39,8% 39,0% 10,4% 20,7% 14,6% 8,7% 22,2%
T 235 211 257 297 173 234,6 169 177 57 107 76 66 109
% 50,1% 45,0% 54,8% 63,3% 36,9% 50,0% 36,1% 37,8% 12,1% 22,8% 16,2% 14,0% 23,2%
Experienced problems caused by use of alcohol and other substancesThe respondents were asked a question about the number of occasions during the last 12 months on which they had experienced any problems related to their alcohol use. Ten problems are listed in the questionnaire, and these have been grouped into four categories: “individual problems”, “relational problems”, “sexual problems” and “delinquency problems”.
“Individual problems” include the following items: “performed poorly at school or at work”, “accident or in-jury” and “hospitalized or admitted to an emergency room”. The individual problem more often indicated is “performed poorly at school or at work”, 7.5% had experienced this during the past 12 months.
“Relationship problems” include serious problems with parents, indicated by about 10% of students.
“Sexual problems” also include only two items: “engaged in sexual intercourse you regretted the next day” (4%) and “engaged in sexual intercourse without a condom” (7%).
“Delinquency problems” include “physical fight”, “victimized by robbery or theft” and “trouble with the po-lice”. Of these, the first is the one most often indicated (by 12% on average.
The most common group of problems due to alcohol consumption during the past 12 months was relational problems, which were mentioned by 8% on average while the other three groups were indicated by roughly 4-6%. For all four problem groups, the average scores for boys are high than the same for girls. Delinquency problems were reported by sevenfold as many boys as girls (22% versus 3%). This is mainly because the boys have been involved in physical fights to a larger extent. The gender differences on the variable “unprotected sex” are also quite big, more boys (14%) than girls (0.9%) reported this, the same is for the variable “regretted sex” the boys are in the majority (8 vs. 0.9%).

- 28 -
Table 25 Experienced problems caused by own alcohol use
Individual problems Relationship problems
Performed poorly
Accident Hospitalized Average Problems with friend
Problems with parents
Average
Male 23 10 5 13 13 29 21
% 10.5 4.52 2.3 5.77 5.9 13.2 9.55
Female 11 4 2 6 12 19 15.5
% 4.7 1.69 0.8 2.40 5 7.9 6.45
Total 34 14 7 18 25 48 36.5
% 7.5 3.06 1.5 4.02 5.4 10.4 7.9
Sexual problems Delinquency problems
Engaged in sexual intercourse you
regret next day
Engaged in sexual intercourse without
condom
Average Trouble with police
Victimized by robbery
Physical fight
Average
M 17 30 24 18 2 49 23
% 8,00% 13,90% 10,95% 8,30% 0,90% 21,70% 10,30%
F 2 2 2 6 0 7 4
% 0,90% 0,90% 0,90% 2,50% 0,00% 2,90% 1,80%
T 19 32 26 24 2 56 27
% 4,20% 7,10% 5,65% 5,30% 0,40% 12,10% 5,93%
ALCOHOL – A SUMMARYAlcoholic beverages, especially beer and wine are considered easily available; 73% found beer and 70% wine easy to obtain. 90% of the surveyed students have tried alcohol at least once during their lifetime. 80% have done so in the last 12months and 40% in the past 30 days. Gender differences become apparent when frequen-cy of use is considered: boys have used alcohol more often than girls. 7.5% of the students state that, they never drink alcohol at all. Wine and beer are the two most important types of beverage for the students. On average, 40% of students on the latest drinking day consumed wine and 38% - beer. Champagne and spirits consumed 29% and 22% of students, respectively. On average, half of the students have been intoxicated, at least once during their lifetime, to the point of staggering when walking, having slurred speech or throwing up. 40% re-ported intoxication in the last 12 months and 12% in the past 30 days. Another way to measure drunkenness is to ask about a specific amount of alcohol consumed within a certain period of time. The students were asked if they had had five drinks or more on one occasion during the past month; this is referred to here as “heavy episodic drinking”. 40% reported this; more boys than girls did so (45% versus 33%). More than half of the questioned students had consumed at least one glass of alcohol at the age of 13 or younger, and 25% had been drunk at that age. Having been intoxicated during the past 30 days, in turn, co-varies both with anticipating more positive consequences from drinking and with having experienced more negative personal consequences when drinking.
ILLICIT DRUGSThis section presents results on the use of illicit drugs (cannabis, ecstasy, etc.) as well as tranquillizers or sedatives (with and without a doctor’s prescription), anabolic steroids and inhalants. Overall, the focus is on lifetime prevalence, except for a limited number of substances for which the 12 months and 30 days preva-lence rates are also presented. The section begins with a presentation of the perceived availability of a limited number of substances.

- 29 -
Perceived availability of various substancesThe students were asked: “How difficult do you think it would be for you to get each of the following?” and presented with a list of five substances (cannabis, amphetamines, ecstasy, tranquillizers/sedatives and inhal-ants). For each of the listed substances, the response categories were: “impossible”, “very difficult”, “fairly difficult”, “fairly easy”, “very easy” and “don’t know”. The proportions of students who answered “very easy” or “fairly easy” to this question are presented in this section. 22% perceived cannabis to be easily obtained. Boys consider cannabis to be slightly more available than girls do (31% versus 13%). The observed difference might be related to a higher level of use among boys. Availability questions for two more illicit substances, amphetamines and ecstasy, were also included in the questionnaire. On average, amphetamines said to be fairly or very easily available by around 5% (i.e. one forth the cannabis proportion) and ecstasy by 12% (half the cannabis proportion) of students.
Gender differences are visible for the perceived availability of amphetamines (7% boys versus 3% girls) and ecstasy (25% boys versus 5% girls). Almost no gender differences exist, however, for the perceived availability of tranquillizers/sedatives and inhalants. The questionnaire does not distinguish between the prescription and non-prescription availability of these medical drugs. Finally, the availability of inhalants was also checked. Ac-cording to the instructions provided, the definition given of “inhalants” in the questionnaires was to include, in addition to “glue”, other relevant Georgian examples such as acetone, petrol. 26.5% of the students considered inhalants to be easily available.
Table 26 Perceived availability of substances. Percentages among boys, girls and all students
answering ”Very easy” or ”Fairly easy”
Marihuana Amphetamines Tranquillizers or sedatives
Ecstasy Inhalants
Male 71 16 25 43 58
% 31,10% 7,00% 10,90% 18,90% 25,40%
Female 32 8 31 11 66
% 13,30% 3,40% 12,80% 4,60% 27,30%
Total 103 24 56 54 124
% 22,00% 5,10% 11,90% 11,50% 26,50%
Lifetime use of any illicit drugThe concept of “any illicit drug” includes marijuana, hashish, amphetamines, cocaine, crack, ecstasy, LSD or other hallucinogens, and heroin. 20% of the surveyed students report having used any of the drugs included in the index at least once.
Many of the students have tried an illicit drug only once or twice, while others have used such drugs more often. On average, 33% of the boys and 8% of the girls have tried illicit drugs at least once during their life-time.
Table 27 Frequency of lifetime use of any illicit drug. Percentages among boys, girls and all students
0 1-2 3-5 6-9 10-19 20-39 ≥40 No answer Total
Male 74 76 29 8 8 9 10 14 228
% 32.5 33.3 12.7 3.5 3.5 3.9 4.4 6.1 100
Famale 218 20 6 3 6 2 2 4 241
% 90.5 8.3 2.5 1.2 2.5 0.8 0.8 1.7 100
Total 368 96 35 11 14 11 12 18 469
% 78.5 20.5 7.5 2.3 3.0 2.3 2.6 3.8 100

- 30 -
CANNABISLifetime and last 12 months use of cannabisThe vast majority of the students who have tried any illicit drug have used marijuana or hashish (cannabis). The proportion of students reporting experience of cannabis is thus close to the total prevalence for illicit drugs. Lifetime use of cannabis was reported by 17% of the surveyed students (31% boys versus 4% girls).
Table 28 Frequency of lifetime use of marijuana. Percentages among boys, girls and all students
Number of occasions used in lifetime Total
0 1-2 3-5 6-9 10-19 20-39 40 or more
No answer
Male 156 33 13 3 6 7 8 2 228
68,4% 14,5% 5,7% 1,3% 2,6% 3,1% 3,5% ,9% 100,0%
Female 231 4 3 0 1 1 0 1 241
95,9% 1,7% 1,2% 0 ,4% ,4% 0 ,4% 100,0%
Total 387 37 16 3 7 8 8 3 469
82,5% 7,9% 3,4% ,6% 1,5% 1,7% 1,7% ,6% 100,0%
Use of cannabis in the past 12 months was reported by 17% of the boys and 3% of the girls (10% of all stu-dents). More than half of the students who have ever used cannabis had apparently done so during the past 12 months.
Table 29 Frequency of use of marijuana or hashish during the last 12 months. Percentages among boys, girls and all students
Number of occasions Total
0 1-2 3-5 6-9 10-19 20-39 40 or more
No answer
Male 166 18 9 3 4 2 2 24 228
72,8% 7,9% 3,9% 1,3% 1,8% ,9% ,9% 10,5% 100,0%
Female 215 3 1 2 1 0 0 19 241
89,2% 1,2% ,4% ,8% ,4% 0 0 7,9% 100,0%
Total 381 21 10 5 5 2 2 43 469
81,2% 4,5% 2,1% 1,1% 1,1% ,4% ,4% 9,2% 100,0%
Last 30 days use of cannabisMore than 3% of all questioned students (6.5% of the boys and 0.8% of the girls) stated that they had used marijuana or hashish during the last 30 days. This corresponds to roughly one-fifth of the group stating lifetime use. About 1% of all students had used cannabis at an average frequency roughly corresponding to at least once a week during the period in question (3–5 times or more last 30 days).

- 31 -
Table 30 Frequency of use of marijuana during the last 30 days. Percentages among boys, girls and all students
During the last 30 days
0 1-2 3-5 6-9 10-19 40 or more
No answer
Total
Male 188 12 1 0 1 1 25 228
82,5% 5,3% ,4% 0 ,4% ,4% 11,0% 100,0%
Female 218 1 1 0 0 0 21 241
90,5% ,4% ,4% 0 0 0 8,7% 100,0%
Total 406 13 2 0 1 1 46 469
86,6% 2,8% ,4% 0 ,2% ,2% 9,8% 100,0%
Opportunities to try cannabisAll students were asked: “Have you ever had the possibility to try marihuana or hashish (cannabis) without trying it”? About 36% of the students have had the opportunity to try, without taking it.
Places to buy cannabisTable 31 Places where marijuana or hashish easily can be bought. Percentages among boys, girls and all students
I don’t know of any such
place
Street, park etc
School Disco, bar Internet Coffee shop
House of a dealer
Other
Male 136 30 6 20 2 7 24 13
% 59,6% 13,2% 2,6% 8,8% ,9% 3,1% 10,6% 5,7%
Female 173 19 4 23 2 9 9 7
% 72,4% 7,9% 1,7% 9,5% ,8% 3,7% 3,7% 2,9%
Total 309 49 10 43 4 16 33 20
%66,2% 10,4% 2,1% 9,2% ,9% 3,4% 7,1% 4,3%
The students were asked: “In which of the following places do you think you could easily buy marijuana or hashish if you wanted to?” It is obvious that many students, which have not used cannabis themselves, have an opinion about where to find it.
On average “disco, bar etc.” (10.4%) and “street, park etc” (9.2%) scored highest. 7.1% of students indicated “house of a dealer”, other different alternatives are found in less than 5%.
There are more girls (72.4%) than boys (59.6%) who reported that they do not know of any such Place; Over-all, the gender pattern reveals that predominantly boys are indicating “park, street”, and “house of a dealer” as a place where they would find it easy to buy cannabis. More girls indicated “disco, bar, etc.” and ”coffee shop” than boys.
Lifetime use of illicit drugs other than cannabisAs established above, the most important and prevalent drug is cannabis. Nevertheless, some students have also used other substances; in some cases they have done so without any experience of cannabis at all. The previously used index “any illicit drug” is here used again, but without counting cannabis. The drugs included are thus ecstasy, amphetamines, LSD or other hallucinogens, crack, cocaine and heroin. Students with cannabis experience may of course be included in this index, but then not because of their cannabis use.

- 32 -
Overall, an average of 15% report use of the illicit drugs included in the index. More boys than girls have done so. After cannabis, ecstasy is the second-most frequently tested illicit drug. On average, 7.5% of the students have tried ecstasy at least once. 4.5% reported ecstasy use during the past 12 months and 1.4% reported use during the past 30 days. Lifetime cocaine and heroine experiences were reported by 0.6% of the students on av-erage, and the figure for amphetamines is about 2%. Lifetime prevalence of LSD (1.7%) and crack was lower (1.1%) and that of GHB even more so (0.4%). Lifetime prevalence of Relevin and “vint”/jeff” is 0.04% each. Magic mushrooms were not reported at all. The average for injection use of drugs is 0.2%, meaning that this behavior is practically non-existent among the Tbilisi students. Even though the examples given refer to illicit drugs, the students may also have reported injection use of other substances, such as pharmaceutical drugs or doping agents.
Table 32 Frequency of lifetime use of any illicit drug other than marijuana. Percentages among boys, girls and all students
0 1-2 3-5 6-9 10-19 20-39 ≥40 No answer Total
Boys 174 33 9 1 1 1 1 8 228
% 76.3 14.5 3.9 0.4 0.4 0.4 0.4 3.7 100
Girls 215 14 2 3 2 1 2 2 241
4% 89.2 5.8 0.8 1.2 0.8 0.4 0.8 0.8 100
All 389 47 11 4 3 2 3 10 469
% 82.9 10.0 2.3 0.9 0.6 0.4 0.6 2.1 100
Table 33 Lifetime experience of different illicit drugs. Percentages among boys, girls and all students
Amphetamines
LSD or other
Crack Cocaine Heroin Ecstasy Magic Mushrooms
GHB injection
Girls 5 6 4 3 2 28 0 2 1
% 2,20% 2,60% 1,80% 1,30% 0,80% 12,28 0 0,90% 0,40%
Boys 4 2 1 0 1 7 0 0 0
% 1,70% 0,80% 0,40% 0,00% 0,40% 2,90 0 0,00% 0,00%
All 9 8 5 3 3 35 0 2 1
% 1,90% 1,70% 1,10% 0,60% 0,60% 7,46 0 0,40% 0,20%
ILLICIT DRUGS – A SUMMARY22% of the surveyed students perceive cannabis to be easily available, and boys consider cannabis slightly more accessible than girls do, the gender difference is rather big (31% vs.13%). Amphetamines and ecstasy are not perceived to be as easily available as cannabis. On average, 33% of the boys and 8% of the girls have tried illicit drugs at least once during their lifetime (20% for all students). After cannabis, ecstasy is in second position, being mentioned by 7.5% of the students and the figure for amphetamines is about 2%. Lifetime use of crack was reported by fewer students (1.1%) and the rate for heroin was even lower (1%). Lifetime cocaine and heroine experiences were reported by 0.6% of the students on average. Just as few reported experience of GHB and anabolic steroids or drug use by intravenous administration. Since cannabis is the most frequently used illicit drug, it could be worthwhile to have a closer look at this substance. Use of cannabis in the past 12 months was reported by 17% of the boys and 3% of the girls (10% for all students) while use in the past 30 days was stated by 6.5% of the boys and 0.8% of the girls (3% mean).

- 33 -
VARIOUS SUBSTANCESThis final use-related section deals with various substances such as pharmaceutical drugs and inhalants, and it concludes with a comparison regarding the age of onset for various substances.
Lifetime use of tranquilizers or sedativesTranquillizers or sedatives are a widely used group of prescription medication but these drugs may also be obtained without a doctor’s prescription to be used for the purpose of getting high rather than for medical reasons. Tranquillizers or sedatives in Georgia are used both as a legally prescribed medicine and as an illicit drug. The questionnaire asks about lifetime use of tranquillizers or sedatives both with and without a doctor’s prescription.
The majority of the students who ever used any such substance have used it legally (5.5% versus 0.04%). A look at the gender distribution showed that, on average, slightly more girls than boys report use of tranquil-lizers or sedatives without a prescription (0.05% versus 0.04%). The opposite proportion is in regards of pre-scription use (4.5% girls versus 6.5% boys).
Table 34 Lifetime use of tranquillizers or sedatives; anabolic steroids; alcohol together with pills; alcohol together with cannabis. Percentages among boys, girls and all students
Tranquilliser/sedatives(doctor’s prescription)
Withoutprescription
Anabolicsteroids
Alcoholwith pills
Alcoholwith cannabis
Male 15 8 2 10 63
% 6,58 0,04 0,01 0,04 13,43
Female 11 12 0 3 9
% 4,56 0,05 0,00 0,01 1,92
Total 26 20 2 13 72
% 5,54 0,04 0,00 0,03 7,67
Lifetime use of alcohol together with pillsIt is a well-known fact that young people sometimes combine pills with alcohol to obtain a synergetic effect. The prevalence rate for “alcohol together with pills (medicaments) in order to get high” is 0.03%. On average, boys are in the majority (0.04% versus 0.01%).
Lifetime use of alcohol together with cannabisYoung people sometimes combine cannabis with alcohol to obtain a synergetic effect. The prevalence rate for “alcohol together with cannabis in order to get high” is 8%. Boys are in the majority (13.5% versus 2%).
Age of starting using of various substancesData on the age of onset for cigarettes, alcoholic beverages and drunkenness have already been presented in previous sections. Compared with having had a glass of an alcoholic beverage or smoked a cigarette at the age of 13 or younger, experience of other substances at such a young age is quite rare. Use of cannabis at the age of 13 or younger was mentioned by 5.5% of the students, about 1% had used inhalants, 0.8% had used non-prescription tranquillizers or sedatives, 1.2% - ecstasy, 0.4% - amphetamines and 1.7% had used alcohol with pills when they were that young.
USE OF VARIOUS SUBSTANCES – A SUMMARYLifetime use of tranquillizers or sedatives with a doctor’s prescription was reported by 5.5% of the students and 0.04% reported use of such substances without a personal prescription. Use of alcohol together with pills “in

- 34 -
order to get high” was reported by 0.01% of girls and 0.04% of boys (the average was 0.03%). Use of alcohol together with cannabis “in order to get high” was reported by 13.5% of boys and 2% of girls (the average - 8%).
PERCEIVED RISKS OF LEGAL AND ILLEGAL SUBSTANCE USE
The students were asked: “How much do you think people risk harming themselves (physically or in other ways) if they...”, followed by twelve items regarding cigarette smoking, alcohol consumption and use of illicit drugs suggesting different intensities of use. For cigarettes, the examples were “a) smoke cigarettes occasion-ally” and “b) smoke one or more packets of cigarettes per day”. The response categories were “no risk”, “slight risk”, “moderate risk”, “great risk” and “don’t know”. The comments in this section are based only on answers indicating a “great risk” for each item. The average values for the risk assessment vary substantially across substances. The highest average value is noted for regular use of either cannabis, ecstasy or amphetamines. Around 60% perceived regular use of these three drugs to be associated with great risk in the perspective of harmfulness.
Of the proposed behaviors in the list, the one deemed the least harmful was “smoke cigarettes occasionally”, which only 16% of students considered to entail a great risk. About 38% considered people to be at great risk of harming themselves if they have one or two drinks nearly every day and 60% if they try cannabis once or twice. Students entailed a great risk of harm regarding smoking cannabis occasionally (31%), having five or more drinks every weekend (44%), and trying ecstasy or amphetamines once or twice (60%). About 43% said that smoking at least a packet of cigarettes a day, 57% - having five drinks a day nearly every day involved a great risk of harm. Overall, more girls than boys perceive the different patterns of regular consumption to be associated with great risks.
Table 35 Perceived risk of substance use. Percentages among boys, girls and all students answering ”Great risk”
Cigarettes Drinks marihuana ecstasy amphetamine
occa
sion
ally
≥1 packs
per day
1-2 drinks nearly ev-
ery day
4-5 drinks nearly
every day
≥5 drinks each
weekend
1-2 times
occa
sion
ally
regu
larl
y
1-2 times
regu
larl
y1-2
times
regu
larl
y
M 35 85 71 106 79 113 58 113 62 121 88 126
% 15,6% 38,5% 31,8% 48,0% 35,7% 51,6% 26,4% 51,4% 28,1% 54,8% 40,4% 58,3%
F 40 112 107 152 119 155 85 154 64 145 88 143
% 16,8% 47,5% 45,1% 65,2% 51,3% 67,4% 36,0% 65,8% 27,2% 62,8% 37,6% 61,6%
T 75 197 178 258 198 113 143 267 126 266 176 269
16,2% 43,1% 38,7% 56,8% 43,7% 59,7% 31,4% 58,8% 27,6% 58,8% 38,9% 60,0%
Experienced problems caused by use of drugsThe respondents were asked a question about the number of occasions during the last 12 months on which they had experienced any problems related to their drug use. Ten problems are listed in the questionnaire, and these have been grouped into four categories: “individual problems”, “relational problems”, “sexual problems” and “delinquency problems”. “Individual problems” include the following items: “performed poorly at school or at work”, “accident or in-jury” and “hospitalized or admitted to an emergency room”. The individual problem more often indicated is “performed poorly at school or at work”, 1.7% had experienced this during the past 12 months. “Relationship problems” include serious problems with parents, indicated by about 1.1% of students.
“Sexual problems” also include only two items: “engaged in sexual intercourse you regretted the next day”

- 35 -
(1.7%) and “engaged in sexual intercourse without a condom” (2.4%).
“Delinquency problems” include “physical fight”, “victimized by robbery or theft” and “trouble with the po-lice”. Of these, the first is the one most often indicated (by 3% on average).
The most common group of problems due to alcohol consumption during the past 12 months was sexual prob-lems, which were mentioned by 2% on average while the other three groups were indicated less. For all four problem groups, the average scores for boys are high than the same for girls.
Table 36 Experienced problems caused by own drug use
Individual problems Relationship problems
Performed poorly
Accident Hospitalized Average Problems with friend
Problems with parents
Average
Male 7 4 4 5 4 3 4
% 3.2 1.8 1.9 2.30 1.9 1.4 1.65
Female 1 1 0 1 0 2 1
% 0.4 0.4 0 0.27 0 0.9 0.45
Total 8 5 4 6 4 5 5
% 1.7 1.1 0.8 1.20 0.8 1.1 0.95
Sexual problems Delinquency problems
Engaged in sexual intercourse
next day
Engaged in sexual intercourse
without condom
Average Troublewith police
Victimized by robbery
Physical fight
Average
M 6 10 8 7 1 12 7
% 2,80% 4,60% 3,70% 3,20% 0,50% 5,30% 3,00%
F 2 1 2 1 0 1 1
% 0,80% 0,40% 0,60% 0,40% 0,00% 0,40% 0,27%
T 8 11 10 8 1 13 7
% 1,70% 2,40% 2,05% 1,70% 0,20% 2,80% 1,57%
LIFETIME ABSTINENCE FROM VARIOUS SUBSTANCESOn average, 96% of the students have never used any tranquillizers or sedatives without a medical prescrip-tion. Almost as many (98%) have never used amphetamines and LSD; 99% had never used crack, cocaine and heroine; inhalants of any kind. The rate of lifetime abstinence from using illicit drugs such as GHB, anabolic steroids, relevin and jeff/vint is almost 100% each. The same is regarding using drugs by injection. about 97% had never used alcohol with pills. Having used cigarettes is quite common compared with use of the substances mentioned above. About the half (50.5%) of all surveyed students have abstained from trying cigarettes during their lifetime. On average, only 7.5% are alcohol abstainers.

- 36 -
Perceived drug use among friendsTable 37 Perceived drug use among friends. Percentages among boys, girls and all students
smoke cigarettes
drink alcoholic beverages
get drunk smoke marihuana or hashish (cannabis)
take tranquillisers or
sedatives
take ecstasy use inhalants.
Male 201 195 165 110 22 44 11
% 89,70% 87,10% 74,90% 51,20% 10,20% 19,90% 5,10%
Female 205 203 161 112 28 32 7
% 85,40% 84,90% 67,70% 47,30% 12,10% 13,60% 3,00%
Total 406 398 326 222 50 76 18
% 87,40% 85,90% 71,10% 49,10% 11,10% 16,70% 4,00%
Vast majority of the surveyed students report most of their friends smoke cigarettes (87.4%) and drink alcohol (85.9%).About half of the students (49.1%) report that almost all of their friends use marihuana. Taking inhalants is rather unusual among the students’ friends. Friends’ taking tranquillizers or sedatives was reported by 11 percent of the students. Some students have friends who take ecstasy – 16.7%. There are virtually no gender differences in these prevalence rates.
ConclusionsAlcohol remains the number one problem. The fact that more than 90% of respondents have had drunk alcohol at least once and that more than 43% have had their last drink at home and more than 27% at friend’s home, indicates the great reflection of the cultural acceptance of alcohol within Georgian society and within Georgian families.
Adolescent’s tobacco use is a great public health concern in Georgia. Smoking is quite prevalent among Geor-gian adult population which on one hand reflects their children’s habits and on the other hand reflects not only their, but their families and broader community’s health.
Using drugs is less problematic in Tbilisi adolescents but still needs urgent public health interventions.
The consumption level among adults and their attitudes towards the substance in question can be one factor that affects use among teenagers. So may the magnitude of information and preventive efforts. Availability, not only in physical terms but also in financial terms, is another factor. Other, less substance-related, factors include the general level of health awareness in a population and the social and economic structures and condi-tions of individual communities.
The study results show the importance of knowledge on these issues and therefore including the healthy life-style subject in school curricula.
The need to repeat this exercise at regular intervals is important in order to be aware of newer trends and to serve as a basis for policy direction and change.

- 37 -
References
Javakhishvili, D., Lejava, G., Stvilia, K., Todadze, KH., Tsintsadze, M. (2006) Drug Situation in Georgia, 2005, Annual Report. In Javakhishvili, D. (Ed.)
Björn Hibell, Ulf Guttormsson, Salme Ahlström, Olga Balakireva, Thoroddur Bjarnason, Anna Kokkevi, Lud-wig Kraus; Substance Use Among Students in 35 European Countries; The 2007 ESPAD Report
Andersson B, Hibell B (1995). Skolelevers drogvanor 1994 (Student drug use, 1994). Rapportserie nr 44. Stockholm, Sweden: The Swedish Council for Information on Alcohol and Other Drugs.
Bjarnason T. and Morgan M. (2002). Guidelines for Sampling Procedures in School Surveys on Alcohol and Other Drugs (stencil) The ESPAD project, The Swedish Council for Information on Alcohol and Other Drugs, Stockholm, Sweden.
Grube J, Morgan M and Kearney K (1989). Using selfgenerated identification codes to match questionnaires in panel studies of adolescent substance use. Addictive Behaviors, 14, 159–171.
Hibell B and Andersson B. (2002a). Project Plan (stencil). The ESPAD project, The Swedish Council for In-formation on Alcohol and Other Drugs, Stockholm, Sweden.
Hibell B, Andersson B, Bjarnason T, Ahlström S, Balakireva O, Kokkevi A and Morgan M (2004). The ESPAD Report 2003. Alcohol and Other Drug Use Among Students in 35 European Countries. The Swedish Council for Information on Alcohol and Other Drugs, Stockholm, Sweden.
http://www.emcdda.europa.eu

- 38 -
Appendix 1
List of institutions and individuals who supported the survey
Ministry of Labour, Health and Social Affaires (MoLHSA)
Ministry of Education and Science of Georgia (MoE)
Participant schools administration
South Caucasus Anti-Drug Programme (SCAD) Epidemiology experts: Dr. Zabransky (International Epidemi-ology Expert) and Dr. Sturua (Local Epidemiology expert)
NCDC&PH staff involved in the survey

- 39 -
Appendix 2
List of researchers
Levan Baramidze MD PhD MPH – Principal investigatorAkaki Gamkrelidze MD PhD – Project ManagerMerab Mirtskhulava PhD – Statistics expert
Irma Khidasheli – researcher Khatuna Babunashvili – researcherNino Mamukashvili – researcherTamar Chachava – researcherTea Arsoshvili – researcher
Dr. Tomas Zabransky Md PhD (SCAD International Epidemiology Expert) Dr. Lela Sturua MD PhD MPH (SCAD Local Epidemiology expert)

- 40 -
Appendix 3ESPAD Class room report
(Please return enclosed with the completed questionnaires)
School:Class: Date:
Number of students (present and absent)
Boys Girls Total
Number of students present
Number of students absent
Total
Reasons for absence:
Boys Girls Total
Illness (number)
Permission (number)
Other reasons (number)
Absence without permission (number)
Do not know (number)
Total
1. Did you notice any disturbances during completion of the questionnaires?1 No2 Yes, from a few students3 Yes, from less than half of the students4 Yes, from about half of the students5 Yes, from more than half of the students
2. Did you find that the students interested in the survey?1 Yes, all of them 2 Nearly all of them 3 A majority of them 4 About half of them5 Less than half of them6 Nearly none of them7 Not one of them

- 41 -
3. Did you find that the students worked seriously?1 Yes, all of them 2 Nearly all of them 3 A majority of them 4 About half of them5 Less than half of them6 Nearly none of them7 Not one of them
4. Were there any students that refused to participate?1 No2 Yes
If yes, how many? …………………….
5. Personal comments:----------------------------------------
Name
Researcher

- 42 -
Appendix 4
Focus Groups Summary Report
For questionnaire testing standard two Focus Group sessions were conducted.
Focus Groups participants (8 students in first and 7 students in the second session) were 10-th grade students of 3 schools not being our samples. Prior to the focus group, participants have been recruited by telephone; phone numbers were got from the schools (3 schools not being our samples were selected randomly) administration. When being recruited, potential participants received a brief description of what the group will be about, as well as assurances that their participation is entirely voluntary and that their confidentiality will be protected. Focus group participants were given incentives (15 GEL, app. $10) for reimbursement of their time.
Sessions were hold in neutral building (conference room at the National Centre for Disease Control and Pub-lic Health (NCDC&PH) with adequate air flow and lighting) with a comfortable, relaxed atmosphere; light refreshments were provided.
Focus groups were conducted by trained moderator (Prof. M. Sekhniashvili) and facilitator (L. Popkhadze).
The agenda was the following: welcome, review of agenda, review of goal of the meeting, review of ground rules, introductions, questions and answers, wrap up. For capturing data from focus groups used multiple methods of recording: note taking, in conjunction with audio recording. Transcriptions of the audio tapes for each of the groups as well as the audio tapes in Georgian were provided to the principle investigator.
Focus Groups sessions lasted about 3 hours as the questionnaire was quite long.
Focus groups gathered information about a topic; we learnt how students structure their thoughts about a topic, their understanding of general concepts or specific terminology, and their opinions about the sensitiv-ity or difficulty of the questions. Focus groups also helped identifying variations in language, terminology, or interpretation of questions and response options. The questionnaire was adjusted according to the results of focus groups discussions.
Students were very interested in research topic and were very enthusiastic and active in discussion. There were several statements and comments regarding questions phrasing, terminology used, alcohol and drug types as well as school grades.
Questions phrasing was changed according to students comments. Terminology was adjusted to the Georgian reality, e.g. marihuana/hashish was changed as the slang “plan” which is very commonly used by Georgian adolescents. Drinks: it was recommended to remove questions about cider and alcopops as these liquids doesn’t exist in Georgia, but to add question about champagne, very popular liquid in Georgia; also to add in explanation of spirits several mixed drinks with spirits which are popular in Georgian students; to change the measures in cl with the measure in ml which is used in Georgia; to remove questions about smuggled drinks as these problem doesn’t exist in Georgia but to leave questions about home made drinks which are very popular in Georgia as almost all families has home made drinks, it’s a Georgian tradition. Regarding drugs: it was recommended to remove questions about moist snuff which doesn’t even exist in Georgia. School grades: it was suggested changing the school grades according the grades used by schools (Ministry of Education and Science) in Georgia.
After the first session the changes were adjusted and the questionnaire was re-tested on the second Focus Group session. Students agreed on changes done.

- 43 -
Appendix 5
ESPADThe European School Survey Project on Alcohol and Other Drugs
Student questionnaire
Before you start, please read this
This questionnaire is part of an international study on alcohol, drugs and tobacco use among stu-dents your age. The survey is performed this year in more than 35 European countries. The proj-ect is done in cooperation with the Pompidou Group at the Council of Europe. This is the fourth study. The first one was done in 1995, the second in 1999 and the third in 2003.
In your country the survey is done by ........................ The results will be presented in a national report as well as in an international comparison of the results from all participating countries. The report will not include any results of single classes and schools.
Your class has been randomly selected to take part in this study. You are one out of about 2.800 students in ............. participating in the study.
This is an anonymous questionnaire – it does not include your name or any other information, which would identify you individually. When you have finished the questionnaire, please put it in the enclosed envelope and seal it yourself. Do not write your name on that either. Your teacher/survey administrator will collect the envelopes after completion.
If the study is to be successful, it is important that you answer each question as thoughtfully and frankly as possible. Remember your answers are totally anonymous. The study is completely voluntary. If there is any question, which you would find objectionable for any reason, just leave it blank. This is not a test. There are no right or wrong answers. If you do not find an answer that fits
exactly, mark the one that comes closest. Please, mark the appropriate answer to each question by making an “X” in the box.
We hope you will find the questionnaire interesting. If you have a question, please raise your hand and your teacher/survey administrator will assist you.
Thank you in advance for your participation.

- 44 -
Before beginning be sure to read the instructions on the coverPlease mark your answer to each question by marking “X” in the appropriate box
The first questions ask for some background information about yourself and the kinds of things you might do
What is your sex?1. 1. � Male2. � Female
When were you born?2. Year 19 � � Month: � � (Mark 01 for January, 02 for February.... ..... and 12 for December)
How often (if all) do you do each of the following?3. Mark one box for each line.
Never A few times a year
Once or twice a month
At least once a week
Almost every day
a) Play computer games...... � � � � �b) Actively participation sport, athletics or
exercising......... � � � � �
c) Read books for enjoyment ( do not count schoolbooks) � � � � �
d) Go out in the evening (to a disco, cafe, party etc).... � � � � �
e) Other hobbies (play an instrument, sing, draw, write)... � � � � �
f) Go around with friend to shopping centers, streets, parks etc just for fun.... � � � � �
g) Use the internet for leisure activities (chats, looking for music, playing games etc)..... � � � � �
h) Play on slot machines (the kind in which you may win money)... � � � � �
1 2 3 4 5
During the LAST 30 DAYS on many days have you missed one or more lesson?4. Mark one box for each line.
None 1 day 2 days 3-4 days 5-6 days 7 days or more
a) Because of illness � � � � � �B) Because you skipped or “cut” � � � � � �c) For other reasons � � � � � �
1 2 3 4 5 6

- 45 -
Which of the following best describes your average grade at the end of the last term?5. 1. � A (93–100) 2. � A– (90–92)Medium 3. � B+ (87–89) 4. � B (83–86) 5. � B– (80–82) 6. � C+ (77–79) 7. � C (73–76) 8. � C– (70–72)
The next major section of this questionnaire deals with cigarettes, alcohol and various other drugs. There is a lot of talk these days about these subjects, but very little accurate information. Therefore,
we still have a lot of to learn about the actual experiences and attitudes of people your age.
The following questions are about CIGARETTE SMOKING.
How difficult do you think it would be for you to get cigarettes if you wanted?6. 1. � Impossible 2. � Very difficult 3. � Fairly difficult 4. � Fairly difficult 5. � Very easy 6. � Don’t know
On how many occasions (if any) during your lifetime have you smoked cigarettes?7.
Number of occasions
0 1-2 3-5 6-9 10-19 20-39 40 or more
� � � � � � �1 2 3 4 5 6 7
How frequently have you smoked cigarettes during the LAST 30 DAYS?8. 1. � Not at all 2. � Less than 1 cigarette per week 3. � Less than 1 cigarette per day 4. � 1-5 cigarette per day 5. � 6-10 cigarette per day 6. � 11-20 cigarette per day 7. � More then 20 cigarette per day

- 46 -
How old you were when you did each of the following things for the first time?9. Mark one box for each line
Never ≤ 9 y. 10 y. 11 y. 12 y. 13 y. 14 y. 15 y. ≥16 y.
a) Smoke your first cigarette � � � � � � � � �b) Smoke cigarettes on a daily basis � � � � � � � � �
1 2 3 4 5 6 7 8 9
The next questions are about ALCOHOLIC BEVERAGES – Including beer, cider, champagne, pre-
mixed drinks, wine and spirits.
How difficult do you think it would be for you to get each of the following, if you wanted?10 Mark one box for each line
Impossible Very difficult
Fairly difficult
Fairly difficult
Very easy
Don’t know
a) Beer (do not include alcohol free or alcohol beer) � � � � � �b) Cider (do not include low alcohol cider) * � � � � � �c) Alcopops (premixed drinks with an alcohol content about 5%)* � � � � � �d) Wine � � � � � �e) Spirits (whisky, cognac, shot drinks etc), (also include
spirits mixed with soft drinks, excluding alcopops) � � � � � �
1 2 3 4 5 6
*Optional
On how many occasions (if any) have you had any alcoholic beverage to drink? 11 Mark one box for each line Number of occasions
0 1-2 3-5 6-9 10-19 20-39 ≥40
a) In your lifetime � � � � � � �b) During the last 12 months � � � � � � �c) During the last 30 days � � � � � � �
1 2 3 4 5 6 7

- 47 -
Think back over the LAST 30 DAYS. On how many occasions (if any) have you had any of the fol-12 lowing to drink?
Mark one box for each line Number of occasions
0 1-2 3-5 6-9 10-19 20-39 ≥40
a) Beer (do not include alcohol free or alcohol beer) � � � � � � �b) Cider (do not include low alcohol cider) * � � � � � � �c) Alcopops (premixed drinks with an alcohol content about 5%)* � � � � � � �
d) Wine � � � � � � �e) Spirits (whisky, cognac, shot drinks etc), (also include spirits mixed with soft drinks, excluding alcopops)
� � � � � � �
1 2 3 4 5 6 7
*Optional
The following questions are about the last day you drank alcohol.
When did you drink alcohol last time?13 1. � I never drank alcohol 2. � 1-7 days ago 3. � 8-14 days ago 4. �15-30 days ago 5. � 1 month-1 year ago 6. � more than 1 year ago
14 Think back over the LAST 30 DAYS that you drink any alcohol. Which of the following beverages did you drink on that day?
Mark all that apply 1. � I never drank alcohol 2. � Beer( do not include alcohol free or alcohol beer) 3. � Cider (do not include low alcohol cider)* 4. � Alcopops (premixed drinks with an alcohol content about 5%)* 5. � Wine 6. � Spirits
*Optional
14a. If you drank beer that day you drank any alcohol, how mach did you drink? 1. � I never drank beer2. � I did not drank beer on the last day that I drank alcohol3. � Less then a regular bottle or can (<50 cl)4. � 1-2 regular bottles or cans (50-100 cl)5. � 3-4 regular bottles or cans (101-200 cl)6. � More then 4 regular bottles or cans (>200 cl)

- 48 -
Optional14b. If you drank cider that last day you drank any alcohol, how mach did you drink(do not include low alcohol cider)?
1. � I never drank cider 2. � I did not drank cider on the last day that I drank alcohol 3. � Less then a regular bottle or can (<50 cl) 4. � 1-2 regular bottles or cans (50-100 cl) 5. � 3-4 regular bottles or cans (101-200 cl) 6. � More then 4 regular bottles or cans (>200 cl)
Optional14c. If you drank alcopops (premixed drinks with an alcohol content about 5%) that last day you drank any alcohol, how mach did you drink(do not include low alcohol cider)?
1. � I never drank cider 2. � I did not drank cider on the last day that I drank alcohol 3. � Less then 2 regular bottle or can (<50 ml) 4. � 2-3 regular bottles (50-100 cl) 5. � 4-6 regular bottles (500-750 cl) 6. � 7 or more regular bottles or cans (>200 cl)
14d. If you drank wine that day you drank any alcohol, how mach did you drink? 1. � I never drank wine2. � I did not drank wine on the last day that I drank alcohol3. � Less then 2glasses (<20 cl)4. � 2-3 glasses or half bottles (20-40 cl)5. � 4-6 glasses (41-74 cl)6. � More then 6 glasses (a bottle or more) (≥75 cl)
14e. If you drank spirits that day you drank any alcohol, how mach did you drink? 1. � I never drank spirits 2. � I did not drank spirits on the last day that I drank alcohol 3. � Less then 2 drinks (<7 cl) 4. � 2-3 drinks (8-15 cl) 5. � 4-6 drinks (16-24 cl) 6. � More then 6 drinks (≥25 cl)
14f. Please indicate on this scale from 1 to 10 how drunk you would say you were that last day you drank alcohol. (If you felt on effect at all you should mark “1”
Heavily intoxicated, for example not remembering what happenedNot at all
1 2 3 4 5 6 7 8 9 10
� � � � � � � � � �� I never drink alcohol

- 49 -
The next questions are about alcohol consumption during the last 30 day
Think back over the LAST 30 DAYS. On how many occasions (if any) have you bought beer, cider, 15 alcopops, wine or spirits in a store (grocer store, liquor store, kiosk or petrol station) for your own consumption
Mark one box for each line Number of occasions
0 1-2 3-5 6-9 10-19 ≥20
a) Beer (do not include alcohol free or alcohol beer) � � � � � �b) Cider (do not include low alcohol cider) * � � � � � �c) Alcopops (premixed drinks with an alcohol content about 5%)* � � � � � �d) Wine � � � � � �e) Spirits (whisky, cognac, shot drinks etc), (also include spirits mixed
with soft drinks, excluding alcopops) � � � � � �
1 2 3 4 5 6
*Optional
Think back over the LAST 30 DAYS. On how many occasions (if any) have you drunk beer, cider, 16 alcopops, wine or sprits in a pub, bar, restaurant or disco
Mark one box for each line Number of occasions
0 1-2 3-5 6-9 10-19 ≥20
a) Beer (do not include alcohol free or alcohol beer) � � � � � �b) Cider (do not include low alcohol cider) * � � � � � �c) Alcopops (premixed drinks with an alcohol content about 5%)* � � � � � �d) Wine � � � � � �e) Spirits (whisky, cognac, shot drinks etc), (also include spirits mixed with soft drinks, excluding alcopops) � � � � � �
1 2 3 4 5 6
*Optional
Think back over the LAST 30 DAYS. On how many occasions (if any) have you had five or more 17 drink on one occasion? ( A “drink” is glass/bottle/can of beer (ca 50 cl), a glass/bottle/can of cider (ca 50 cl), 2 glasses/bottles of alcopops (ca 50 cl), a glass of wine (ca 15 cl), a glass of spirits (ca 5 cl) or a mixed drink)
1. � None 2. � 1 3. � 2 4. � 3-5 5. � 6-9 6. � 10 or more times

- 50 -
The next couple of questions are also about alcoholOn how many occasions (if any) have you been intoxicated from drinking alcoholic beverages, for 18 example staggered when walking, not being able to speak properly, throwing up or not remembering what happened? Mark one box for each line Number of occasions
0 1-2 3-5 6-9 10-19 20-39 ≥40
a) In your lifetime � � � � � � �b) During the last 12 months � � � � � � �c) During the last 30 days � � � � � � �
1 2 3 4 5 6 7
When (if ever) did you FIRST do each of the following things?19 Mark one box for each line
never ≤9 y. 10 y. 11 y. 12 y. 13 y. 14 y. 15 y. ≥16 y.
a) Drink beer (at last 1 glass) � � � � � � � � �b) Drink cider (at last 1 glass)* � � � � � � � � �c) Drink alcopops (at last 1 glass)* � � � � � � � � �c) Drink wine (at last 1 glass) � � � � � � � � �d) Drink spirits (at last 1 glass) � � � � � � � � �e) Get drunk on alcohol � � � � � � � � �
1 2 3 4 5 6 7 8 9
*Optional
How likely is it that each of the following things would happen to you personally, if you drink alcohol?20 Mark one box for each line
Very likely likely Unsure Unlikely Very Unlikely
a) Feel relaxed � � � � �b) Get into trouble with police � � � � �c) Harm my health � � � � �d) Feel happy � � � � �e) Forget problems � � � � �f) Not be able to stop drinking � � � � �g) Get a hangover � � � � �h) Feel more friendly and outgoing � � � � �i) Do something I would regret � � � � �j) Have a lot of fun � � � � �k) Feel sick � � � � �
1 2 3 4 5

- 51 -
BECAUSE OF YOUR OWN ALCOHOL USE, how often during the LAST 12 MONTHS have you 21 experienced the following?
Mark one box for each line Number of occasions
0 1-2 3-5 6-9 10-19 20-39 ≥40
a) Physical fight � � � � � � �b) Accident or injury � � � � � � �c) Serious problem with your parents � � � � � � �d) Serious problem with your friend � � � � � � �e) Performed poorly at school or work. � � � � � � �f)Victimized by robbery or theft � � � � � � �G)Trouble with police � � � � � � �h) Hospitalized or admitted to an emergency room � � � � � � �i) Engaged in sexual intercourse without condom � � � � � � �j) Engaged in sexual intercourse you regretted the next day � � � � � � �
1 2 3 4 5 6 7
Tranquillizers and sedative, like… (give examples that are appropriate) are sometimes
prescribed by doctors to help people to calm down, get to sleep or to relax. Pharmacies are not supposed to sell them without prescription.
Have you ever taken tranquillizers or sedatives because a doctor told you take them?22 1. � No, never 2. � Yes, but for less then 3 week 3. � Yes, for 3 week or more
The next questions ask about marihuana or hashish (cannabis)
How difficult do you think it would be for you to get marihuana or hashish (cannabis) if you wanted?23 1. � Impossible 2. � Very difficult 3. � Fairly difficult 4. � Fairly difficult 5. � Very easy 6. � Don’t know

- 52 -
On how many occasions (if any) have you smoked marihuana or hashish (cannabis)?24 Mark one box for each line
Number of occasions
0 1-2 3-5 6-9 10-19 20-39 ≥40
a) In your lifetime � � � � � � �b) During the last 12 months � � � � � � �c) During the last 30 days � � � � � � �
1 2 3 4 5 6 7
When (if ever) did you FIRST try marihuana or hashish (cannabis)?25 1. � never 2. � 9 years old or less 3. � 10 years old 4. � 11 years old 5. � 12 years old 6. � 13 years old 7. � 14 years old 8. � 15 years old 9. � 16 years old or older
Have you ever had the possibility to try marihuana or hashish (cannabis) without trying it?26 1. � No 2. � Yes → How many times has this happened in your life?
1. � 1-2 2. � 3-5 3. � 6-9 4. � 10-19 5. � 20-39 6. � 40 or more
The next questions ask about some other drugs.
How difficult it would be for you to get each of the following if you wanted?27 Mark one box for each line
Impossible Very difficult
Fairlydifficult
Fairlyeasy
Veryeasy
Don’tknow
a) Amphetamines (upper, pep pills, bennies, speed) � � � � � �b) Tranquillizers and sedative � � � � � �c) Ecstasy � � � � � �d) Inhalants (glue and other national examples) � � � � � �
1 2 3 4 5 6

- 53 -
On how many occasions (if any) have you used ecstasy? 28 Mark one box for each line Number of occasions
0 1-2 3-5 6-9 10-19 20-39 ≥40
a) In your lifetime � � � � � � �b) During the last 12 months � � � � � � �c) During the last 30 days � � � � � � �
1 2 3 4 5 6 7
On how many occasions (if any) have you use29 Inhalants (glue, etc) to get high? Mark one box for each line
Number of occasions
0 1-2 3-5 6-9 10-19 20-39 ≥40
a) In your lifetime � � � � � � �b) During the last 12 months � � � � � � �c) During the last 30 days � � � � � � �
1 2 3 4 5 6 7
On how many occasions in your lifetime (if any) have you use30 any of following drugs? Mark one box for each line
Number of occasions
0 1-2 3-5 6-9 10-19 20-39 ≥40
a)Tranquillizers and sedative (without doctors prescription) � � � � � � �b) Amphetamines � � � � � � �c) LSD or some other hallucinogens � � � � � � �d) Crack � � � � � � �e) Cocaine � � � � � � �f) Relevin � � � � � � �g) Heroin � � � � � � �h) ”Magic mushrooms” � � � � � � �i) GHB � � � � � � �j) Anabolic steroids � � � � � � �k) Drugs by injection (like heroin, cocaine, amphetamine) � � � � � � �l) Alcohol together with pills (medicaments) in order to get high � � � � � � �m) optional drug* � � � � � � �
1 2 3 4 5 6 7
*Optional
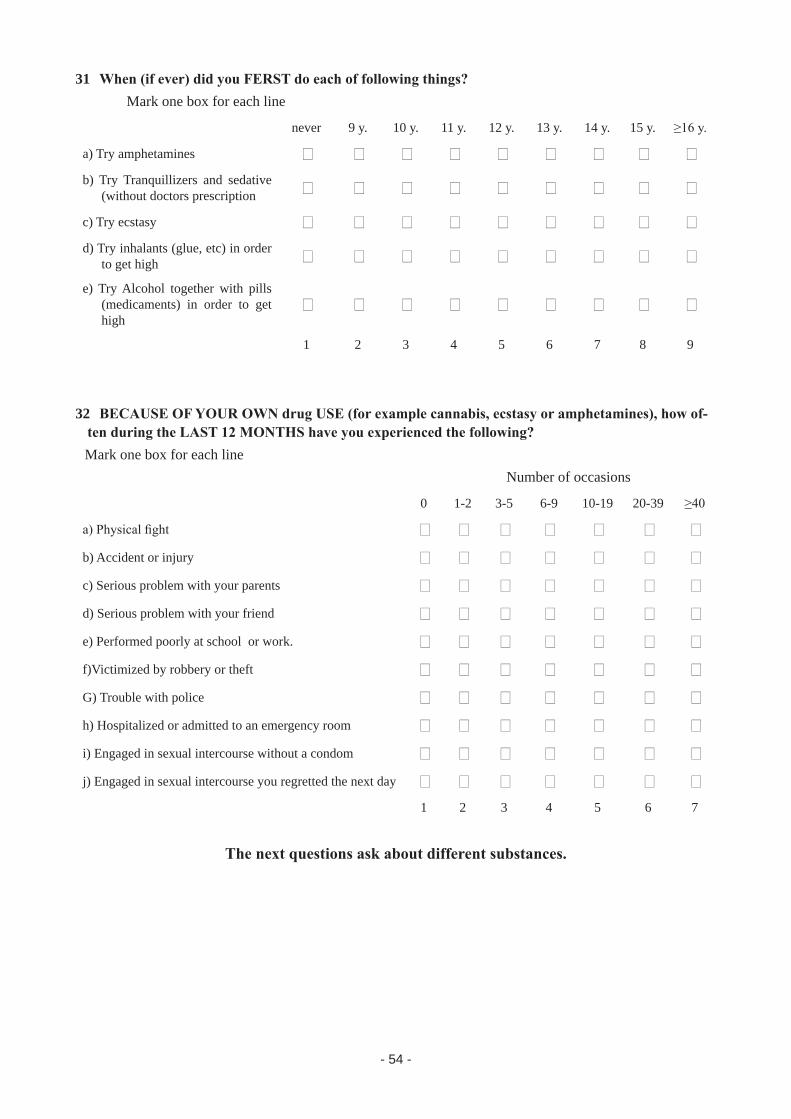
- 54 -
When (if ever) did you FERST do each of following things?31 Mark one box for each line
never 9 y. 10 y. 11 y. 12 y. 13 y. 14 y. 15 y. ≥16 y.
a) Try amphetamines � � � � � � � � �b) Try Tranquillizers and sedative
(without doctors prescription � � � � � � � � �
c) Try ecstasy � � � � � � � � �d) Try inhalants (glue, etc) in order
to get high � � � � � � � � �
e) Try Alcohol together with pills (medicaments) in order to get high
� � � � � � � � �
1 2 3 4 5 6 7 8 9
BECAUSE OF YOUR OWN drug USE (for example cannabis, ecstasy or amphetamines), how of-32 ten during the LAST 12 MONTHS have you experienced the following?
Mark one box for each line Number of occasions
0 1-2 3-5 6-9 10-19 20-39 ≥40
a) Physical fight � � � � � � �b) Accident or injury � � � � � � �c) Serious problem with your parents � � � � � � �d) Serious problem with your friend � � � � � � �e) Performed poorly at school or work. � � � � � � �f)Victimized by robbery or theft � � � � � � �G) Trouble with police � � � � � � �h) Hospitalized or admitted to an emergency room � � � � � � �i) Engaged in sexual intercourse without a condom � � � � � � �j) Engaged in sexual intercourse you regretted the next day � � � � � � �
1 2 3 4 5 6 7
The next questions ask about different substances.

- 55 -
Think back over the LAST 30 DAYS. How much money have you spent on tobacco, alcohol and 33 “plan”? Mark one box for each line Amount in Euro
0 1-3 or less(1 Big Mac)
4-6 (2 Big Mac)
7-15 (3-5 Big Mac)
16-30 (6-10 Big Mac) 31-70 (11-23
Big Mac)
71or more (24+ Big
Mac)
a) Tobacco � � � � � � �b) Alcohol � � � � � � �c) Cannabis � � � � � � �
1 2 3 4 5 6 7
How many of your friends would you estimate34 Mark one box for each line
none A few some Most All
a) Smoke cigarettes � � � � �b) Drink alcoholic beverages � � � � �c) Get drunk � � � � �d) Smoke marihuana or hashish (cannabis) � � � � �e) Take Tranquillizers and sedative (without doctors prescription � � � � �f) Take ecstasy � � � � �g) Use inhalants � � � � �
1 2 3 4 5
Do any of older siblings….35 Mark one box for each line
Yes No Don’t know Don’t have any older siblings
a) Smoke cigarettes � � � �b) Drink alcoholic beverages � � � �c) Get drunk � � � �d) Smoke marihuana or hashish (cannabis) � � � �e) Take Tranquillizers and sedative (without doctors prescription � � � �f) Take ecstasy � � � �g) Use inhalants � � � �
1 2 3 4
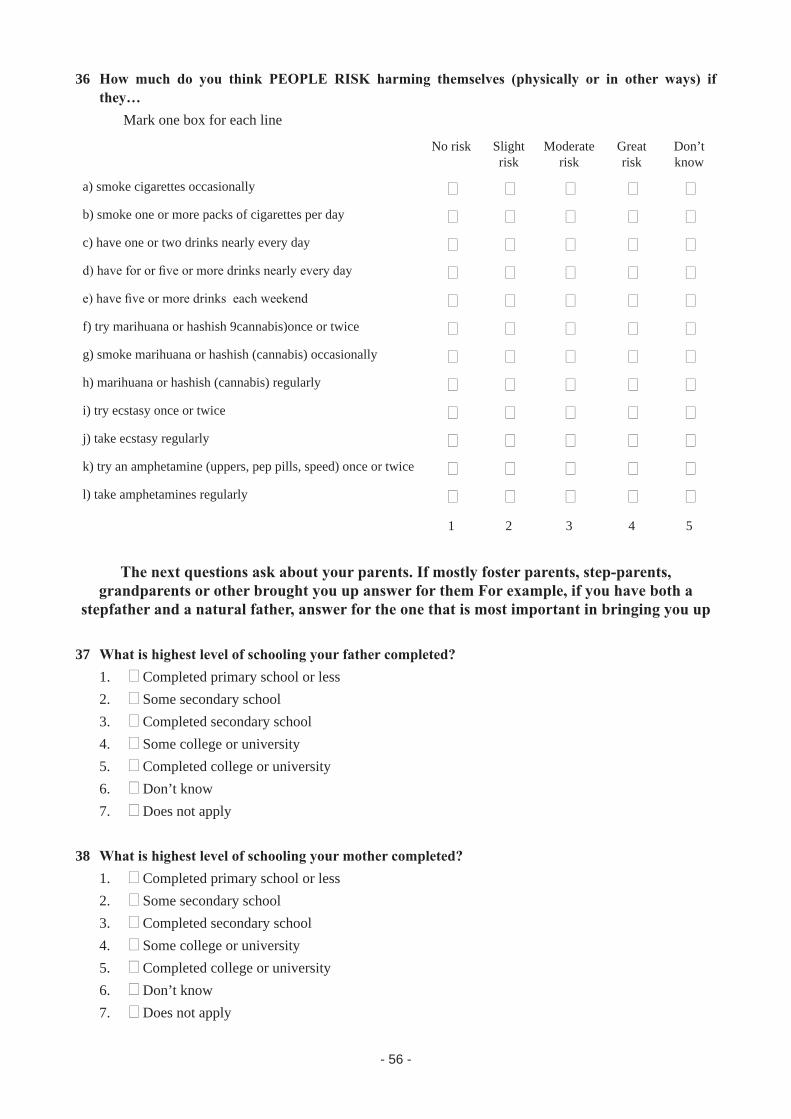
- 56 -
How much do you think PEOPLE RISK harming themselves (physically or in other ways) if 36 they… Mark one box for each line
No risk Slight risk
Moderate risk
Great risk
Don’t know
a) smoke cigarettes occasionally � � � � �b) smoke one or more packs of cigarettes per day � � � � �c) have one or two drinks nearly every day � � � � �d) have for or five or more drinks nearly every day � � � � �e) have five or more drinks each weekend � � � � �f) try marihuana or hashish 9cannabis)once or twice � � � � �g) smoke marihuana or hashish (cannabis) occasionally � � � � �h) marihuana or hashish (cannabis) regularly � � � � �i) try ecstasy once or twice � � � � �j) take ecstasy regularly � � � � �k) try an amphetamine (uppers, pep pills, speed) once or twice � � � � �l) take amphetamines regularly � � � � �
1 2 3 4 5
The next questions ask about your parents. If mostly foster parents, step-parents, grandparents or other brought you up answer for them For example, if you have both a
stepfather and a natural father, answer for the one that is most important in bringing you up
What is highest level of schooling your father completed?37 1. � Completed primary school or less 2. � Some secondary school 3. � Completed secondary school 4. � Some college or university 5. � Completed college or university 6. � Don’t know 7. � Does not apply
What is highest level of schooling your mother completed?38 1. � Completed primary school or less 2. � Some secondary school 3. � Completed secondary school 4. � Some college or university 5. � Completed college or university 6. � Don’t know 7. � Does not apply

- 57 -
How well off is your family compared to other families in your country?39 1. � Very mach better off 2. � Much better off 3. � Better off 4. � About the same 5. � Less well off 6. � Much less well off 7. � Very much less well off
Which of the following people live in the same household with you?40 Mark all that apply
1. � I live alone 2. � Father 3. � Stepfather 4. � Mother 5. � Stepmother 6. � Brother(s) 7. � Sister (s) 8. � Grandparent (s) 9. � Other relative (s) 10. � Non- relative (s)
How satisfied are you usually with….41
Very satisfied
satisfied Neither satisfied or not satisfied
Not so satisfied
Absolutely not satisfied
There is no such person
a) your relationship to your mother � � � � � �b) your relationship to your father � � � � � �c) your relationship to your friends � � � � � �
1 2 3 4 5 6
How often do the following statements apply to you? (A5 in 2003)43 Mark one box for each line
Almost always
often Sometimes Seldom Almost never
a) my parent (s) set definite rules about what I can do at home � � � � �b) my parent (s) set definite rules about what I can do outside at home � � � � �c) my parent (s) know whom I am with in the evenings � � � � �d) my parent (s) know where I am in the evenings � � � � �e)I can easily get warmth and caring from my mother/father � � � � �f)I can easily emotional support for my mother/father � � � � �

- 58 -
g)I can easily get money from my mother/father � � � � �h) I can easily get money as a gift from my mother/father � � � � �i) I can easily get warmth and caring form my best friend � � � � �j) I can easily get emotional support for my best friend � � � � �
1 2 3 4 5
Do your parents know where you spent Saturday?44 1. � Know always 2. � Know quite often 3. � Know sometimes 4. � Usually don’t know
If you have ever used marihuana or hashish (cannabis), do you think that you would have said so in 45 this questionnaire?
1. � I already said that I have used it 2. � Definitely yes 3. � Probably yes 4. � Probably not 5. � Definitely not
The next section includes questions about your parents’ thoughts about alcohol and drug use.A1 If you wanted smoke (or already do), do you think your father and mother would allow you to do so?
Mark one box for each line
Would allow (allows me) to smoke
Would not (does not) allows smoking at home
Would not (does not) allow smoking at all
Don’t know
a) Father � � � �b) Mother � � � �
1 2 3 4
A2 what do your mother’s reaction would be if you do the following things?Mark one box for each line
She would not allow it
She would discourage it
She would not mind
She would approve
Don’t know
a) Get drank � � � � �b) Smoke “plan” � � � � �c) Use ecstasy � � � � �
1 2 3 4 5

- 59 -
A3 what do your father’s reaction would be if you do the following things?Mark one box for each line
He would not allow it
He would discourage it
He would not mind
He would approve
Don’t know
a) Get drank � � � � �b) Smoke marihuana/hashish � � � � �c) Use ecstasy � � � � �
1 2 3 4 5
A4 How satisfied are you usually with….Mark one box for each line
Very satisfied
satisfied Neither satisfied or not satisfied
Not so satisfied
Absolutely not satisfied
a) The financial of your family? � � � � �b) Your health? � � � � �c) Yourself? � � � � �
1 2 3 4 5
A5 How mach money do you usually spend a week for your personal needs without your parents’ control? � � � � National currency
The following section is about what you think of yourself.
B1 Below is a list of statements dealing with your general feelings about yourself. Mark one box for each line to indicate if you agree or disagree.
Strongly agree Agree Disagree Strongly
disagree
a) On the whole, I am satisfied with myself � � � �b) At times I think I am on good at all � � � �c) I feel that I have a number of good qualities � � � �d) I am able to do things as well as most other people � � � �e) I feel I do not have much to be proud of � � � �f) I certainly feel useless at times � � � �g) I feel that I’m a person of worth, at least on an equal plane with others � � � �
h) I wish I could have more respect for myself � � � �i) All in all, I am inclined to feel that I am a failure � � � �j) I take a positive attitude myself � � � �
1 2 3 4

- 60 -
B2 During the LAST 7 DAY, how often….Mark one box for each line
Rarely or never Sometimes Several
timesMost of the times
a) have you lost your appetite, you did not want to eat � � � �b) have you had difficulty in concentrating on what you want to do � � � �c) have you felt depressed � � � �d) have you felt that you had to put great effort and pressure to do
the things you had to do � � � �
e) have you felt sed � � � �f) couldn’t you do your work (at home, at work, at school) � � � �
1 2 3 4
B3 How much do you agree or disagree with the following statements?Mark one box for each line
Totally agree
Rather agree
Don’t know
Rather disagree
Totally disagree
a) You can break most rules if they don’t seem to apply � � � � �b) I follow whatever rules I want to follow � � � � �c) In fact there are very few rules absolute in life � � � � �d) It is difficult to trust anything, because everything changes � � � � �e)In fact nobody knows what is expected of him/her in life � � � � �f)You can never be certain of anything in life � � � � �
1 2 3 4 5
The following questions concern behaviors, which may be against some social rules or the low. We hope that you will answer all the questions. Nevertheless, if you come across a question,
which you cannot answer honestly, we prefer that you leave it unanswered. Remember that your answers are anonymous.
B4 During the LAST 12 MONTHS, how often have you…. Mark one box for each line Number of occasions
0 1-2 3-5 6-9 10-19 20-39 ≥40
a) hit one of your teachers � � � � � � �b) got mixed into a fight at school or at work � � � � � � �c) taken part in fight where a group of your friends were against
another group� � � � � � �
d) hurt somebody badly enough to need bandages or a doctor � � � � � � �e) used any kind of weapon to get something from a person � � � � � � �

- 61 -
f) taken something not belonging to you, worth over (the equivalents of) $10
� � � � � � �
g) taken something from a shop without paying for it � � � � � � �h) set fire to somebody else’s property on purpose � � � � � � �i) damaged school property on purpose � � � � � � �j) got into trouble with the police for something you did � � � � � � �
1 2 3 4 5 6 7
B5 Has any of the following ever happened to you?Mark one box for each line
Not at all Once Twice 3-4 times 5 or more times
a) Run away from home for more one day � � � � �b) Thought of harming yourself � � � � �c) Attempted suicide � � � � �
1 2 3 4 5
The following questions concern behaviors, which may be against some social rules or the low. We hope that you will answer all the questions. Nevertheless,
if you come across a question, which you cannot answer honestly, we prefer that you leave it unanswered. Remember that your answers are anonymous.
C1 During the LAST 12 MONTHS, how often have you….Mark one box for each line Number of occasions
0 1-2 3-5 6-9 10-19 20-39 ≥40
a) participated in a group teasing an individual � � � � � � �b) participated in a group bruising an individual � � � � � � �c) participated in a group starting a fight with another group � � � � � � �d) started a fight with another individual � � � � � � �e) stolen something worth (give a rounded sum approx equivalent
to 2-3 movie theatre tickets)� � � � � � �
f) broken into a place to steal � � � � � � �g) damaged public or private on purpose � � � � � � �h) sold stolen goods � � � � � � �
1 2 3 4 5 6 7

- 62 -
C2 During the LAST 12 MONTHS, how often have you….Mark one box for each line Number of occasions
0 1-2 3-5 6-9 10-19 20-39 ≥40
a) been individually teased by a whole group of people � � � � � � �b) been bruised by a whole group of people � � � � � � �c) been in a group that was attacked by another group � � � � � � �d) had someone start a fight with another individual � � � � � � �e) had something worth (give a rounded sum approx equivalent
to 2-3 movie theatre tickets) stolen for you� � � � � � �
f) had someone break into your home to seal something � � � � � � �g) had something damage your belonging on purpose � � � � � � �h) sold stolen goods � � � � � � �
1 2 3 4 5 6 7
The section includes some questions about cannabis
D1 Have you used cannabis During the LAST 12 MONTHS? 1. � No 2. � Yes → Has the following happened to you During the LAST 12 MONTHS? Mark one box for each line
Never Rarely From time to time
Fairly often
Very often
a) Have you ever smoked cannabis before midday � � � � �b) Have you ever smoked cannabis when you were alone � � � � �c) Have you ever had memory problem when you smoked
cannabis? � � � � �
d) Have friends or members of your family told you that you ought to reduce or stop your cannabis use � � � � �
e) Have you ever tried to reduce or stop your cannabis use without succeeding � � � � �
f) Have you ever had problems because of your use of cannabis (argument, fight, accident, bed result at school, etc)? which � � � � �
1 2 3 4 5
D2 Are you part of a clique of friends, where using cannabis is part of your behavior when you meetNo1. Yes → 2. how often per month do you meet with member of this clique?
1. � Almost daily 2. � 3-4 times a week 3. � 1-2 time a week 4. � 1-3 times a month 5. � Lees then once a month

- 63 -
The next questions ask once more about cannabis
O1 In which of the following places do you think you could easily buy marihuana or hashish (cannabis) if you wanted to? Mark a all that apply
1. � I don’t know of any such place 2. � Street, park etc 3. � School 4. � Disco, bar etc 5. � House of a dealer 6. � Via the Internet 7. � Coffee shop*
8. � Other(s), please specify*Optiona l
O2 How likely that each of following would happen to you if you use marihuana or hashish (cannabis)?Mark one box for each line
Not at all Unlikely Maybe Quite likely Definitely
a) I perceive things more intensive � � � � �b) I can in longer follow a conversation property � � � � �c) I loose thread more quickly � � � � �d) I am not shy � � � � �e) I have difficult concerting � � � � �f) I am more outgoing � � � � �g) I can enjoy the moment intensely � � � � �h) I experience feeling more intensively � � � � �i) I am less inhibited � � � � �j) I may feel people are against me or persecuting me � � � � �
1 2 3 4 5
We want to find out how people begin to take illegal drags. We want you to think back to the very fast occasion (if any) on which you took any of them and tell us about it.
(Let us say again that any information you choose to give us about this will be strictly confi-dential/anonymous. Your name is not on this questionnaire and nobody can find it out
O3 If you have ever used any illegal drag like marihuana or hashish (cannabis), ecstasy or amphet-amines, how did you get it? Mark all that apply
1. � I have never used any illegal drag like marihuana or hashish (cannabis), ecstasy or amphetamines 2. � Given to me by an older brother or sister 3. � Given to me by a friend, a boy or girl, older then me
- 64 -
4. � Given to me by a friend my own age or younger 5. � Given to me by someone I have heard about but did not know personally 6. � Given to me by 7. � It was shared around a group of friends 8. � Bought from friend 9. � Bought from someone I have heard about but did not know personally 10. � Bought from a stranger 11. � Given to me by one of parents 12. � Took it at home without my parents permission 13. � None of these (please describe briefly how you did get it)
O4 What was (what were) the reason(s) for you to try this drug?Mark all that apply
1. � I have never used any illegal drag like marihuana or hashish (cannabis), amphetamines or ecstasy 2. � I wonted to feel high 3. � I did not want to stand out from the group 4. � I had nothing to do 5. � I was curious 6. � I wanted to forget my problem 7. � Other reason (s), please specify 8. � Don’t remember
We want to find out how people begin to take illegal drags. We want you to think back to the very fast occasion (if any) on which you took any of them and tell us about it.
(Let us say again that any information you choose to give us about this will be strictly confi-dential/anonymous. Your name is not on this questionnaire and nobody can find it out
E5 Think back over the LAST 30 DAYS. On how many days have you had any alcohol such as beer, champagne, wine or spirits to drink?
1. � Never during the last 30 day 2. � 1 day during the last 30 day 3. � 2 day during the last 30 day 4. � 3 day during the last 30 day 5. � 1 day a week 6. � 2 days week 7. � 3-4 days a week 8. � Every day or nearly every day during the last 30 day
O6 On a typical day during the LAST 30 DEYS when you drank alcohol such as beer, champagne, wine or spirits, how many drinks did you have?
1. � I never drink alcohol 2. � I have not been drinking alcohol during the last 30 day 3. � 1 drink 4. � 2 drinks

- 65 -
5. � 3 drinks 6. � 4 drinks 7. � 5 drinks 8. � 6 drinks 9. � 7 drinks 10. � 8 drinks 11. � 9 drinks 12. � 10 or more drinks
O7 Now think back over the LAST 30 DAYS. On how many occasions (if any) have you had any home made alcohol to drinkMark one box for each line Number of occasions
0 1-2 3-5 6-9 10-19 20-39 ≥40
a) Home made beer � � � � � � �b) Home made wine � � � � � � �c) Home made spirits � � � � � � �d) Smuggled beer � � � � � � �e) Smuggled wine � � � � � � �f) Smuggled spirits � � � � � � �
1 2 3 4 5 6 7
O8 Do you think that heavy drinking influences the following problems? Mark one box for each line
Yes, considerably
Yes, quite a lot
Yes, to some extent
Yes, but only a little
No
a) Traffic accident � � � � �b) Other accident � � � � �c) Violent crime � � � � �d) Family problems � � � � �e) Health problems � � � � �f) Relationship problems � � � � �g) Financial problems � � � � �
1 2 3 4 5
- 66 -
O9 Think of that last day on which you drank alcohol. Where you when you drank?Mark all that apply
1. � I never drink alcohol 2. � At home 3. � At someone else’s home 4. � Out on the street, in a park, beach or other open area 5. � At a bar or pub 6. � In a disco 7. � In a restaurant 8. � Other please (please describe)
O10 On how many occasions (if any) have you used moist snuff? Mark one box for each line
Number of occasions
0 1-2 3-5 6-9 10-19 20-39 ≥40
a) In your lifetime � � � � � � �b) During the last 12 months � � � � � � �c) During the last 30 days � � � � � � �
1 2 3 4 5 6 7
O11 How much moist snuff have you used during the LAST 30 DAYS? 1. � None at all 2. � Less than 1 box per week 3. � 1 box per week 4. � 2 boxes per week 5. � 3 boxes per week 6. � 4 or more boxes per week
The following questions are about yourself and things you might do
O12 what house work do you usually do at home? 1. � I do shopping 2. � I take care of younger sister/brother 3. � I take care of pets 4. � I cook 5. � I clean the house/apartment 6. � I do laundry 7. � I wash dishes 8. � I work on the household plot of land (garden) 9. � I take care of farm animals 10. � I care for elder family member 11. � I take out the rubbish 12. � I don’t usually do any house work

- 67 -
O13 How much TV or video do you estimate you watch on an average weekday? (QB3in 2003) 1. � None 2. � Half-hour or less 3. � About 1 hour 4. � About 2 hours 5. � About 3 hours 6. � About 4 hours 7. � 5 hours or more
O14 How good do you think you are at schoolwork, compared to other people your age? 1. � Excellent, I am probably one of the very best 2. � Well above average 3. � Above average 4. � Average 5. � Below average 6. � Well below average 7. � Poor, I am probably one of the worst
Now when you have reached the end of the questionnaire there are a few more questions we would like you to answer. Some of them are similar to questions
you have answered earlier, but they are not the same.
R1 On how many occasions (if any) have you been drunk from drinking alcoholic beverages? Mark one box for each line Number of occasions
0 1-2 3-5 6-9 10-19 20-39 ≥40
a) In your lifetime � � � � � � �b) During the last 12 months � � � � � � �c) During the last 30 days � � � � � � �
1 2 3 4 5 6 7
R2 Think back once more over the LAST 30 DAYS. How many times (if any) have you had five or more drinks in arrow?
1. � None 2. �1 3. � 2 4. � 3-5 5. � 6-9 6. � 10 or more times

- 68 -
Appendix 6
ESPADThe European School Survey Project on Alcohol and Other Drugs
Student questionnaireBefore you start, please read this
This questionnaire is part of an international study on alcohol, drugs and tobacco use among students your age. The survey is performed this year in more then 35 European countries. The project is done in coopera-tion with the Pompidou Group at the Council of Europe.
In your country the survey is done by The National Canter for Disease Control and Public Health. The re-sults will be presented in a national report.
Your class has been randomly selected to take part in this study. You are one out of about 500 students par-ticipating in the study.
This is an anonymous questionnaire, it does not include your name or any other information, which would identify you individually. When you have finished the questionnaire, please put it in the enclosed envelope and seal it yourself. Do not write your name on that either. The researcher will collect the envelopes after completion.
If the study is to be successful, it is important that you answer each question as thoughtfully and frankly as possible. Remember your answers are totally anonymous.
The study is completely voluntary. if there is any question, which you would find objectionable for any reason, just leave it blank.
This is not a test. There is no right or wrong answer. If you do not find answer that fits exactly, mark the one that comes closest. Please, mark the appropriate answer to each question by marking “X” in the box.
We hope you will find the questionnaire interesting.
Thank you in advance for your participation
Before beginning be sure to read the instructions on the coverPlease mark your answer to each question by
marking “X” in the appropriate box
The first questions ask for some background information about yourself and the kinds of things you might do
What is your sex?1.
2. � Male 3. � Female

- 69 -
2. When were you born?Year 19 � � Month: � � (Mark 01 for January, 02 for February.... ..... and 12 for December)
3. How often (if all) do you do each of the following?Mark one box for each line.
Never A few times a year
Once or twice a month
At least once a week
Almost every day
a) Play computer games...... � � � � �b) Actively participation sport, athletics or
exercising......... � � � � �
c) Read books for enjoyment ( do not count schoolbooks) � � � � �
d) Go out in the evening (to a disco, cafe, party etc).... � � � � �
e) Other hobbies (play an instrument, sing, draw, write)... � � � � �
f) Go around with friend to shopping centers, streets, parks etc just for fun.... � � � � �
g) Use the internet for leisure activities (chats, looking for music, playing games etc)... � � � � �
h) Play on slot machines (the kind in which you may win money)... � � � � �
1 2 3 4 5
4. During the LAST 30 DAYS on many days have you missed one or more lesson?Mark one box for each line.
None 1 day 2 days 3-4 days 5-6 days 7 days or more
a) Because of illness � � � � � �B) Because you skipped or “cat” � � � � � �c) For other reasons � � � � � �
1 2 3 4 5 6
5. Which of the following best describes your average grade at the end of the last term? 4. � High 5. � Medium 6. � Satisfactory 7. � Poor
The next major section of this questionnaire deals with cigarettes, alcohol and various other drugs. There is a lot of talk these days about these subjects, but very little accurate
information. Therefore, we still have a lot of to learn about the actual experiences and attitudes of people your age.
The following questions are about CIGARETTE SMOKING.
- 70 -
6. How difficult do you think it would be for you to get cigarettes if you wanted? 1. � Impossible 2. � Very difficult 3. � Fairly difficult 4. � Fairly difficult 5. � Very easy 6. � Don’t know
7. On how many occasions (if any) during your lifetime have you smoked cigarettes? Number of occasions
0 1-2 3-5 6-9 10-19 20-39 40 or more
� � � � � � �1 2 3 4 5 6 7
8. How frequently have you smoked cigarettes during the LAST 30 DAYS?1. � Not at all2. � Less than 1 cigarette per week3. � Less than 1 cigarette per day4. � 1-5 cigarette per day5. � 6-10 cigarette per day6. � 11-20 cigarette per day7. � More then 20 cigarette per day
9. How old you were when you did each of the following things for the first time?Mark one box for each line
Never ≤ 9 y. 10 y. 11 y. 12 y. 13 y. 14 y. 15 y. ≥16 y.
a) Smoke your first cigarette � � � � � � � � �b) Smoke cigarettes on a daily basis � � � � � � � � �
1 2 3 4 5 6 7 8 9
The next questions are about ALCOHOLIC BEVERAGES – Including beer, wine, champagne and spirits.
10. How difficult do you think it would be for you to get each of the following, if you wanted?Mark one box for each line
Impossible Very difficult
Fairly difficult
Fairly difficult
Very easy
Don’t know
a) Beer (do not include alcohol free or alcohol beer) � � � � � �b) Sparkling wine (champagne) � � � � � �c) Wine � � � � � �d) Spirits (whisky, cognac, vodka, baileys, martini,
liqueur short drinks etc), (also include spirits mixed with soft drinks, e.g. vodka+fanta)
� � � � � �
1 2 3 4 5 6

- 71 -
11. On how many occasions (if any) have you had any alcoholic beverage to drink? Mark one box for each line Number of occasions
0 1-2 3-5 6-9 10-19 20-39 ≥40
a) In your lifetime � � � � � � �b) During the last 12 months � � � � � � �c) During the last 30 days � � � � � � �
1 2 3 4 5 6 7
12. Think back over the LAST 30 DAYS. On how many occasions (if any) have you had any of the fol-lowing to drink?
Mark one box for each line Number of occasions
0 1-2 3-5 6-9 10-19 20-39 ≥40
a) Beer (do not include alcohol free or alcohol beer) � � � � � � �b) Sparkling wine (champagne) � � � � � � �c) Wine � � � � � � �d) Spirits (whisky, cognac, vodka, baileys, martini,
liqueur short drinks etc), (also include spirits mixed with soft drinks, e.g. vodka+fanta)
� � � � � � �
1 2 3 4 5 6 7
The following questions are about the last day you drank alcohol.
13. When did you drink alcohol last time? 1. � I never drank alcohol 2. � 1-7 days ago 3. � 8-14 days ago 4. �15-30 days ago 5. � 1 month-1 year ago 6. � more than 1 year ago
14. Think back over the LAST 30 DAYS that you drank any alcohol. Which of the following beverages did you drank on that day?
Mark all that apply 1. �I never drank alcohol 2. � Beer ( do not include alcohol free or alcohol beer) 3. � Sparkling wine (champagne) 4. � Wine 5. � Spirits (whisky, cognac, vodka, baileys, martini, liqueur short drinks etc)

- 72 -
14a. If you drank beer that day you drank any alcohol, how mach did you drink? 1. � I never drank beer2. � I did not drank beer on the last day that I drank alcohol3. � Less then a regular bottle or can (<500 ml)4. � 1-2 regular bottles or cans (500-1000 ml)5. � 3-4 regular bottles or cans (1500-2000 ml)6. � More then 4 regular bottles or cans (>2000 ml)
14b. If you drank Sparkling wine (champagne) that day you drank any alcohol, how mach did you drink?
1. � I never drank cider 2. � I did not drank cider on the last day that I drank alcohol 3. � Less then a regular bottle (<250 ml) 4. � 1-2 regular bottles (250-375 ml) 5. � 3-4 regular bottles (500-750 ml) 6. � More then 4 regular bottles (>750 ml)
14d. If you drank wine that day you drank any alcohol, how mach did you drink? 1. � I never drank wine2. � I did not drank wine on the last day that I drank alcohol3. � Less then 2glasses (>250 ml)4. � 2-3 glasses or half bottles (250-375 ml)5. � 4-6 glasses (500-750 ml)6. � More then 6 glasses (>750 ml)
14e. If you drank spirits that day you drank any alcohol, how mach did you drank? 1. � I never drank spirits 2. � I did not drank spirits on the last day that I drank alcohol 3. � Less then 2 drank (<100 ml) 4. � 2-3 drinks (100-150 ml) 5. � 4-6 drinks (200-300 ml) 6. � More then 6 drinks (>300 ml)
14f. Please indicate on this scale from 1 to 10 how drunk you would say you were that last day you drank alcohol. (If you felt on effect at all you should mark “1”
Heavily intoxicated, for example not remembering what happenedNot at all
1 2 3 4 5 6 7 8 9 10
� � � � � � � � � �� I never drink alcohol

- 73 -
The next questions are about alcohol consumption during the last 30 day
15. Think back over the LAST 30 DAYS. On how many occasions (if any) have you bought beer, cham-pagne, wine or spirits in a store (grocer store, liquor store, kiosk or petrol station) for your own con-sumption
Mark one box for each line Number of occasions
0 1-2 3-5 6-9 10-19 ≥20
a) Beer (do not include alcohol free or alcohol beer) � � � � � �b) Sparkling wine (champagne) � � � � � �c) Wine � � � � � �d) Spirits (whisky, cognac, vodka, baileys, martini, liqueur short
drinks etc), (also include spirits mixed with soft drinks, e.g. vodka+fanta)
� � � � � �
1 2 3 4 5 6
16. Think back over the LAST 30 DEYS. On how many occasions (if any) have you drunk beer, cham-pagne, wine or sprits in a pub, bar, restaurant or disco
Mark one box for each line Number of occasions
0 1-2 3-5 6-9 10-19 ≥20
a) Beer (do not include alcohol free or alcohol beer) � � � � � �b) Sparkling wine (champagne) � � � � � �c) Wine � � � � � �d) Spirits (whisky, cognac, vodka, baileys, martini, liqueur short drinks
etc), (also include spirits mixed with soft drinks, e.g. vodka+fanta)� � � � � �
1 2 3 4 5 6
17. Think back over the LAST 30 DAYS. On how many occasions (if any) have you had five or more
drink on one occasion? ( A “drink” is glass/bottle/can of beer (500 ml), glass/bottle/can of champagne (125 ml), glass of wine (125 ml), glass of spirits (100 ml) or a mixed drink)
1. � None 2. � 1 3. � 2 4. � 3-5 5. � 6-9 6. � 10 or more times

- 74 -
The next couple of questions are also about alcohol
18. On how many occasions (if any) have you been intoxicated from drinking alcoholic beverages, for example staggered when walking, not being able to speak properly, throwing up or not remembering what happened? Mark one box for each line Number of occasions
0 1-2 3-5 6-9 10-19 20-39 ≥40
a) In your lifetime � � � � � � �b) During the last 12 months � � � � � � �c) During the last 30 days � � � � � � �
1 2 3 4 5 6 7
19. When (if ever) did you FIRST do each of the following things? Mark one box for each line
never ≤9 y. 10 y. 11 y. 12 y. 13 y. 14 y. 15 y. ≥16 y.
a) Drink beer (at last 1 glass) � � � � � � � � �b) Drink champagne (at last 1 glass) � � � � � � � � �c) Drink wine (at last 1 glass) � � � � � � � � �d) Drink spirits (at last 1 glass) � � � � � � � � �e) Get drunk on alcohol � � � � � � � � �
1 2 3 4 5 6 7 8 9
20. How likely is it that each of the following things would happen to you personally, if you drink alcohol?Mark one box for each line
Very likely likely Unsure Unlikely Very Unlikely
a) Feel relaxed � � � � �b) Get into trouble with police � � � � �c) Harm my health � � � � �d) Feel happy � � � � �e) Forget problems � � � � �f) Not be able to stop drinking � � � � �g) Get a hangover � � � � �h) Feel more friendly and outgoing � � � � �i) Do something I would regret � � � � �j) Have a lot of fun � � � � �k) Feel sick � � � � �
1 2 3 4 5

- 75 -
21. BECAUSE OF YOUR OWN ALCOHOL USE, how often during the LAST 12 MONTHS have you experienced the following?
Mark one box for each line Number of occasions
0 1-2 3-5 6-9 10-19 20-39 ≥40
a) Physical fight � � � � � � �b) Accident or injury � � � � � � �c) Serious problem with your parents � � � � � � �d) Serious problem with your friend � � � � � � �e) Performed poorly at school or work. � � � � � � �f)Victimized by robbery or theft � � � � � � �G)Trouble with police � � � � � � �h) Hospitalized or admitted to an emergency room
� � � � � � �
i) Engaged in sexual intercourse without condom
� � � � � � �
j) Engaged in sexual intercourse you regretted the next day
� � � � � � �
1 2 3 4 5 6 7
Tranquillizers and sedative, like… (give examples that are appropriate) are sometimes
prescribed by doctors to help people to calm down, get to sleep or to relax. Pharmacies are not supposed to sell them without prescription.
22. Have you ever taken tranquillizers or sedatives because a doctor told you take them? 1. � No, never 2. � Yes, but for less then 3 week 3. � Yes, for 3 week or more
The next questions ask about “plan” (marihuana/hashish/cannabis)
23. How difficult do you think it would be for you to get “plan” if you wanted? 1. � Impossible 2. � Very difficult 3. � Fairly difficult 4. � Fairly difficult 5. � Very easy 6. � Don’t know
- 76 -
On how many occasions (if any) have you smoked “plan”?24. Mark one box for each line
Number of occasions
0 1-2 3-5 6-9 10-19 20-39 ≥40
a) In your lifetime � � � � � � �b) During the last 12 months � � � � � � �c) During the last 30 days � � � � � � �
1 2 3 4 5 6 7
25. How old were you when (if ever) try “plan” for first time? 1. � never 2. � 9 years old or less 3. � 10 years old 4. � 11 years old 5. � 12 years old 6. � 13 years old 7. � 14 years old 8. � 15 years old 9. � 16 years old or older
26. Have you ever had the possibility to try “plan” and didn’t take this chance? 1. � No 2. � Yes → How many times has this happens in your life?
1. � 1-22. � 3-53. � 6-94. � 10-195. � 20-396. � 40 or more
The next questions ask about some other drugs.
27. How difficult it would be for you to get each of the following if you wanted? Mark one box for each line
Impossible Very difficult
Fairlydifficult
Fairlyeasy
Veryeasy
Don’tknow
a) Amphetamines (upper, pep pills, bennies, speed, crack)
� � � � � �
b) Tranquillizers and sedative � � � � � �c) Ecstasy � � � � � �d) Inhalants (glue, acetone, petrol) � � � � � �
1 2 3 4 5 6
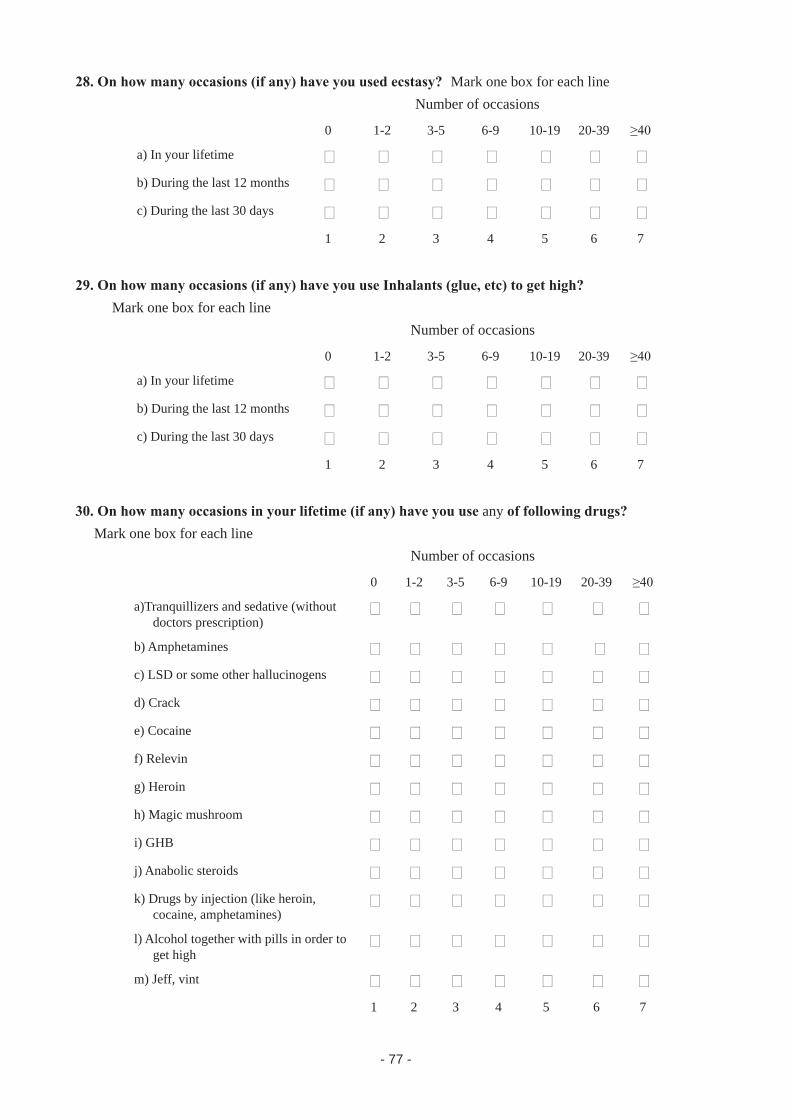
- 77 -
28. On how many occasions (if any) have you used ecstasy? Mark one box for each line Number of occasions
0 1-2 3-5 6-9 10-19 20-39 ≥40
a) In your lifetime � � � � � � �b) During the last 12 months � � � � � � �c) During the last 30 days � � � � � � �
1 2 3 4 5 6 7
29. On how many occasions (if any) have you use Inhalants (glue, etc) to get high? Mark one box for each line
Number of occasions
0 1-2 3-5 6-9 10-19 20-39 ≥40
a) In your lifetime � � � � � � �b) During the last 12 months � � � � � � �c) During the last 30 days � � � � � � �
1 2 3 4 5 6 7
30. On how many occasions in your lifetime (if any) have you use any of following drugs? Mark one box for each line
Number of occasions
0 1-2 3-5 6-9 10-19 20-39 ≥40
a)Tranquillizers and sedative (without doctors prescription)
� � � � � � �
b) Amphetamines � � � � � � �c) LSD or some other hallucinogens � � � � � � �d) Crack � � � � � � �e) Cocaine � � � � � � �f) Relevin � � � � � � �g) Heroin � � � � � � �h) Magic mushroom � � � � � � �i) GHB � � � � � � �j) Anabolic steroids � � � � � � �k) Drugs by injection (like heroin,
cocaine, amphetamines)� � � � � � �
l) Alcohol together with pills in order to get high
� � � � � � �
m) Jeff, vint � � � � � � �1 2 3 4 5 6 7

- 78 -
31. When (if ever) did you FIRST do each of following things? Mark one box for each line
never 9 y. 10 y. 11 y. 12 y. 13 y. 14 y. 15 y. ≥16 y.
a) Try amphetamines � � � � � � � � �b) Try Tranquillizers and sedative
(without doctors prescription� � � � � � � � �
c) Try ecstasy � � � � � � � � �d) Try inhalants (glue, etc) in order to
get high� � � � � � � � �
e) Try Alcohol together with pills (medicaments) in order to get high
� � � � � � � � �
1 2 3 4 5 6 7 8 9
32. BECAUSE OF YOUR OWN drug USE (for example cannabis, ecstasy or amphetamines), how of-ten during the LAST 12 MONTHS have you experienced the following? Mark one box for each line
Number of occasions
0 1-2 3-5 6-9 10-19 20-39 ≥40
a) Physical fight � � � � � � �b) Accident or injury � � � � � � �c) Serious problem with your parents � � � � � � �d) Serious problem with your friend � � � � � � �e) Performed poorly at school or work. � � � � � � �f)Victimized by robbery or theft � � � � � � �G) Trouble with police � � � � � � �h) Hospitalized or admitted to an emergency room � � � � � � �i) Engaged in sexual intercourse without a condom � � � � � � �j) Engaged in sexual intercourse you regretted the next day � � � � � � �
1 2 3 4 5 6 7
The next questions ask about different substances.
33. Think back over the LAST 30 DAYS. How much money have you spent on tobacco, alcohol and “plan”? Mark one box for each line Amount in Georgian Lari (GEL)
0 5-7 GEL 7-15 GEL 20-35 GEL 40-70 GEL 120-160 GEL 165 GEL
a) Tobacco � � � � � � �b) Alcohol � � � � � � �c) “plan” � � � � � � �
1 2 3 4 5 6 7

- 79 -
34. How many of your friends would you estimate Mark one box for each line
none A few some Most All
a) Smoke cigarettes � � � � �b) Drink alcoholic beverages � � � � �c) Get drunk � � � � �d) Smoke ”plan” � � � � �e) Take Tranquillizers and sedative (without doctors prescription � � � � �f) Take ecstasy � � � � �g) Use inhalants � � � � �
1 2 3 4 5
35. Do any of older siblings…. Mark one box for each line
Yes No Don’t know Don’t have any older siblings
a) Smoke cigarettes � � � �b) Drink alcoholic beverages � � � �c) Get drunk � � � �d) Smoke ”plan” � � � �e) Take Tranquillizers and sedative (without doctors prescription � � � �f) Take ecstasy � � � �g) Use inhalants � � � �
1 2 3 4
36. How much do you think PEOPLE RISK harming themselves (physically or in other ways) if they… Mark one box for each line
No risk Slight risk
Moderate risk
Great risk
Don’t know
a) smoke cigarettes occasionally � � � � �b) smoke one or more packs of cigarettes per day � � � � �c) have one or two drinks nearly every day � � � � �d) have for or five or more drinks nearly every day � � � � �e) have five or more drinks each weekend � � � � �f) try marihuana or hashish 9cannabis)once or twice � � � � �g) smoke ”plan” occasionally � � � � �h) smoke ”plan” regularly � � � � �i) try ecstasy once or twice � � � � �j) take ecstasy regularly � � � � �k) try an amphetamine (uppers, pep pills, speed) once or twice � � � � �l) take amphetamine � � � � �
1 2 3 4 5

- 80 -
The next questions ask about your parents. If mostly foster parents, step-parents, grandparents or other brought you up answer for them For example, if you have both a
stepfather and a natural father, answer for the one that is most important in bringing you
37. What is highest level of schooling your father completed? 1. � Completed primary school or less 2. � Some secondary school 3. � Completed secondary school 4. � Some college or university 5. � Completed college or university 6. � Don’t know 7. � Does not apply
38. What is highest level of schooling your mother completed? 1. � Completed primary school or less 2. � Some secondary school 3. � Completed secondary school 4. � Some college or university 5. � Completed college or university 6. � Don’t know 7. � Does not apply
39. How well off is your family compared to other families in your country?1. � Very mach better off2. � Much better off3. � Better off4. � About the same5. � Less well off6. � Much less well off7. � Very much less well off
40. Which of the following people live in the same household with you?
Mark all that apply 1. � I live alone 2. � Father 3. � Stepfather 4. � Mother 5. � Stepmother 6. � Brother(s) 7. � Sister (s) 8. � Grandparent (s) 9. � Other relative (s) 10. � Non- relative (s)

- 81 -
How satisfied are you usually with….41.
Very satisfied
satisfied Neither satisfied or not satisfied
Not so satisfied
Absolutely not satisfied
There is no such person
a) your relationship to your mother � � � � � �b) your relationship to your father � � � � � �c) your relationship to your friends � � � � � �
1 2 3 4 5 6
How often do the following statements apply to you? (A5 in 2003)42. Mark one box for each line
Almost always
often Sometimes Seldom Almost never
a) my parent (s) set definite rules about what I can do at home � � � � �b) my parent (s) set definite rules about what I can do outside at home � � � � �c) my parent (s) know whom I am with in the evenings � � � � �d) my parent (s) know where I am in the evenings � � � � �e)I can easily get warmth and caring from my mother/father � � � � �f)I can easily emotional support for my mother/father � � � � �g)I can easily get money from my mother/father � � � � �h) I can easily get money as a gift from my mother/father � � � � �i) I can easily get warmth and caring form my best friend � � � � �j) I can easily get emotional support for my best friend � � � � �
1 2 3 4 5
Do your parents know where you spent Saturday?43. 1. � Know always 2. � Know quite often 3. � Know sometimes 4. � Usually don’t know
If you have ever used marihuana or hashish (cannabis), do you think that you would have said so 44. in this questionnaire? 1. � I already said that I have used it 2. � Definitely yes 3. � Probably yes 4. � Probably not 5. � Definitely not

- 82 -
The next section includes questions about your parents’ thoughts about alcohol and drug use.
A1 If you wanted smoke (or already do), do you think your father and mother would allow you to do so? Mark one box for each line
Would allow (allows me) to smoke
Would not (does not) allows smoking at home
Would not (does not) allow smoking at all
Don’t know
a) Father � � � �b) Mother � � � �
1 2 3 4
A2 what do your mother’s reaction would be if you do the following things?Mark one box for each line
She would not allow it
She would discourage it
She would not mind
She would approve
Don’t know
a) Get drank � � � � �b) Smoke “plan” � � � � �c) Use ecstasy � � � � �
1 2 3 4 5
A3 what do your father’s reaction would be if you do the following things?Mark one box for each line
He would not allow it
He would discourage it
He would not mind
He would approve
Don’t know
a) Get drank � � � � �b) Smoke “plan” � � � � �c) Use ecstasy � � � � �
1 2 3 4 5
A4 How stultified are you usually with….Mark one box for each line
Very satisfied
satisfied Neither satisfied or not satisfied
Not so satisfied
Absolutely not satisfied
a) The financial situation of your family? � � � � �b) Your health? � � � � �c) Yourself? � � � � �
1 2 3 4 5
A5 How mach money do you usually spend a week for your personal needs without your parents’ control? � � � � GEL

- 83 -
The following section is about what you think of yourself.B1 Below is a list of statements dealing with your general feelings about yourself.
Mark one box for each line to indicate if you agree or disagree.
Strongly agree
Agree Disagree Strongly disagree
a) On the whole, I am satisfied with myself � � � �b) At times I think I am on good at all � � � �c) I feel that I have a number of good qualities � � � �d) I am able to do things as well as most other people � � � �e) I feel I do not have much to be proud of � � � �f) I certainly feel useless at times � � � �g) I feel that I’m a person of worth, at least on an equal plane with others � � � �h) I wish I could have more respect for myself � � � �i) All in all, I am inclined to feel that I am failure � � � �j) I take a positive attitude towards myself � � � �
1 2 3 4
B2 During the LAST 7 DAY, how often….Mark one box for each line
Rarely or never
Sometimes Several times
Most of the times
a) have you lost your appetite, you did not want to eat � � � �b) have you had difficulty in concentrating on what you want to do � � � �c) have you felt depressed � � � �d) have you felt that you had to put great effort and pressure to do
the things you had to do� � � �
e) have you felt sed � � � �f) couldn’t you do your work (at home, at work, at school) � � � �
1 2 3 4
B3 How much do you agree or disagree with the following statements?Mark one box for each line
Totally agree
Rather agree
Don’t know
Rather disagree
Totally disagree
a) You can break most rules if they don’t seem to apply � � � � �b) I follow whatever rules I want to follow � � � � �c) In fact there are very few rules absolute in life � � � � �d) It is difficult to trust anything, because everything changes � � � � �e)In fact nobody knows what is expected of him/her in life � � � � �f)You can never be certain of anything in life � � � � �
1 2 3 4 5
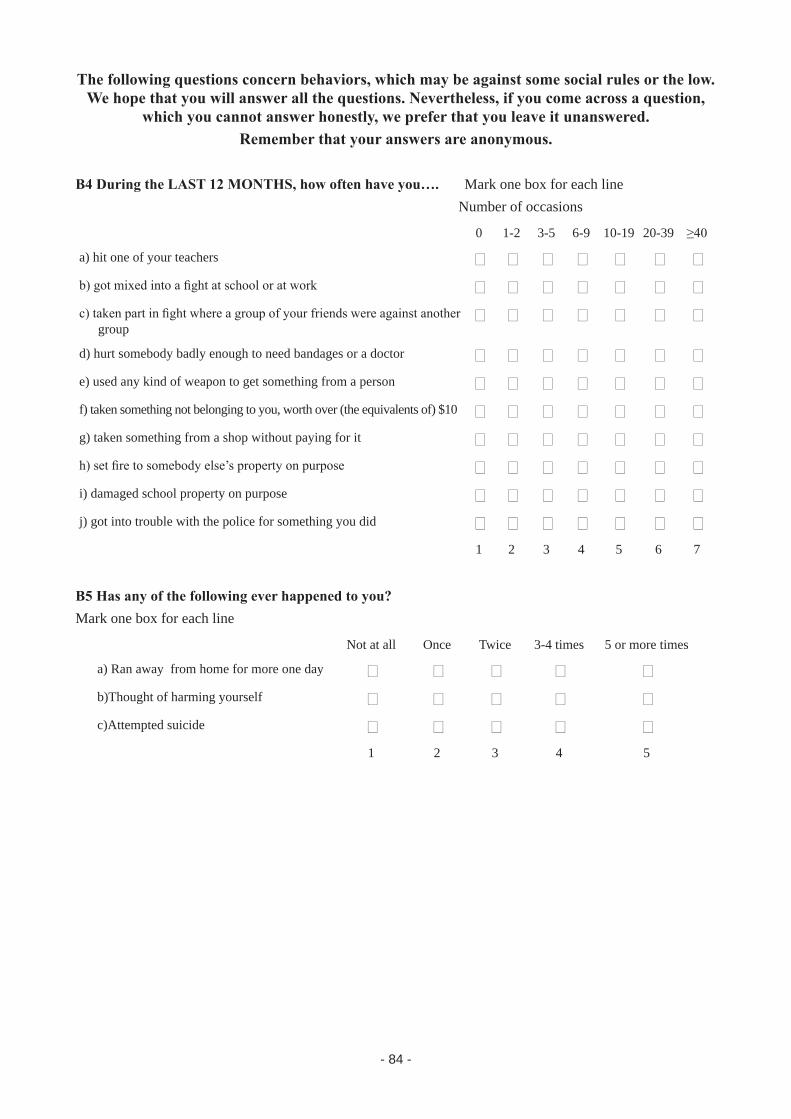
- 84 -
The following questions concern behaviors, which may be against some social rules or the low. We hope that you will answer all the questions. Nevertheless, if you come across a question,
which you cannot answer honestly, we prefer that you leave it unanswered. Remember that your answers are anonymous.
B4 During the LAST 12 MONTHS, how often have you…. Mark one box for each line Number of occasions
0 1-2 3-5 6-9 10-19 20-39 ≥40
a) hit one of your teachers � � � � � � �b) got mixed into a fight at school or at work � � � � � � �c) taken part in fight where a group of your friends were against another
group� � � � � � �
d) hurt somebody badly enough to need bandages or a doctor � � � � � � �e) used any kind of weapon to get something from a person � � � � � � �f) taken something not belonging to you, worth over (the equivalents of) $10 � � � � � � �g) taken something from a shop without paying for it � � � � � � �h) set fire to somebody else’s property on purpose � � � � � � �i) damaged school property on purpose � � � � � � �j) got into trouble with the police for something you did � � � � � � �
1 2 3 4 5 6 7
B5 Has any of the following ever happened to you?Mark one box for each line
Not at all Once Twice 3-4 times 5 or more times
a) Ran away from home for more one day � � � � �b)Thought of harming yourself � � � � �c)Attempted suicide � � � � �
1 2 3 4 5

- 85 -
The following questions concern behaviors, which may be against some social rules or the low. We hope that you will answer all the questions. Nevertheless, if you come across a question,
which you cannot answer honestly, we prefer that you leave it unanswered. Remember that your answers are anonymous.
C1 During the LAST 12 MONTHS, how often have you….Mark one box for each line Number of occasions
0 1-2 3-5 6-9 10-19 20-39 ≥40
a) participated in a group teasing an individual � � � � � � �b) participated in a group bruising an individual � � � � � � �c) participated in a group starting a fight with
another group� � � � � � �
d) started a fight with another individual � � � � � � �e) stolen something worth (give a rounded sum
approx equivalent to 2-3 movie theatre tickets)� � � � � � �
f)broken into a place to steal � � � � � � �g)damaged public or private on purpose � � � � � � �h)sold stolen goods � � � � � � �
1 2 3 4 5 6 7
C2 During the LAST 12 MONTHS, how often have you….Mark one box for each line Number of occasions
0 1-2 3-5 6-9 10-19 20-39 ≥40
a) been individually teased by a whole group of people � � � � � � �b) been bruised by a whole group of people � � � � � � �c) been in a group that was attacked by another group � � � � � � �d) had someone start a fight with another individual � � � � � � �e) had something worth (give a rounded sum approx equivalent to 2-3
movie theatre tickets) stolen for you� � � � � � �
f) had someone break into your home to seal something � � � � � � �g) had something damage your belonging on purpose � � � � � � �h) sold stolen goods � � � � � � �
1 2 3 4 5 6 7

- 86 -
The section includes some questions about “plan”
D1 Have you used cannabis During the LAST 12 MONTHS? 1. � No 2. � Yes → Has the following happened to you during the LAST 12 MONTHS? Mark one box for each line
Never Rarely From time to time
Fairly often Very often
a) Have you ever smoked cannabis before midday � � � � �b) Have you ever smoked cannabis when you were alone � � � � �c) Have you ever had memory problem when you smoked
cannabis?� � � � �
d) Have friends or members of your family told you that you ought to reduce or stop your cannabis use
� � � � �
e) Have you ever tried to reduce or stop your cannabis use without succeeding
� � � � �
f) Have you ever had problems because of your use of cannabis (argument, fight, accident, bed result at school, etc)? which
� � � � �
1 2 3 4 5
D2 Are you part of a clique of friends, where using cannabis is part of your behavior when you meet
No1. Yes → 2. how often per month do you meet with member of this clique?
1. � Almost daily 2. � 3-4 times a week 3. � 1-2 time a week 4. � 1-3 times a month 5. � Lees then once a month
The next questions ask once more about “plan”
E1 In which of the following places do you think you could easily buy marihuana or hashish? Mark a all that apply
1. � I don’t know of any such place 2. � Street, park etc 3. � School 4. � Disco, bar etc 5. � House of a dealer 6. � Via the Internet 7. � Coffee shop 8. � Other(s), please specify

- 87 -
E2 How likely that each of following would happen to you use “plan”? Mark one box for each line
Not at all Unlikely Maybe Quite likely Definitely
a) I perceive things more intensive � � � � �b) I can in longer follow a conversation property � � � � �c) I loose thread more quickly � � � � �d) I am not shy � � � � �e) I have difficult concerting � � � � �f) I am more outgoing � � � � �g) I can enjoy the moment intensely � � � � �h) I experience feeling more intensively � � � � �i) I am less inhibited � � � � �j) I may feel people are against me or persecuting me � � � � �
1 2 3 4 5
We want to find out how people begin to take illegal drags. We want you to think back to the very fast occasion (if any) on which you took any of them and tell us about it.
(Let us say again that any information you choose to give us about this will be strictly confi-dential/anonymous. Your name is not on this questionnaire and nobody can find it out
E3 If you have ever used any illegal drag like marihuana or hashish (cannabis), ecstasy or amphet-amines, how did you get it?
Mark all that apply 1. � I have never used any illegal drag like marihuana or hashish (cannabis), ecstasy or amphetamines 2. � Given to me by an older brother or sister 3. � Given to me by a friend, a boy or girl, older then me 4. � Given to me by a friend my own age or younger 5. � Given to me by someone I have heard about but did not know personally 6. � Given to me by 7. � It was shared around a group of friends 8. � Bought from friend 9. � Bought from someone I have heard about but did not know personally 10. � Bought from a stranger 11. � Given to me by one of parents 12. � Took it at home without my parents permission 13. � None of these (please describe briefly how you did get it)

- 88 -
E4 What was (what were) the reason(s) for you to try this drug?Mark all that apply
1. � I have never used any illegal drug like ”plan”, amphetamines or ecstasy 2. � I wonted to feel high 3. � I did not want to stand out from the group 4. � I had nothing to do 5. � I was curious 6. � I wanted to forget my problem 7. � Other reason (s), please specify 8. � Don’t remember
The section of the questionnaire includes some questions about alcohol
E5 Think back over the LAST 30 DAYS. On how many days have you had any alcohol such as beer, champagne, wine or spirits to drink?
1. � Never during the last 30 day2. � 1 day during the last 30 day3. � 2 day during the last 30 day4. � 3 day during the last 30 day5. � 1 day a week6. � 2 days week7. � 3-4 days a week8. � Every day or nearly every day during the last 30 day
E6 On a typical day during the LAST 30 DAYS when you drank alcohol such as beer, champagne, wine or spirits, how many drinks did you have?
1. � I never drink alcohol 2. � I have not been drinking alcohol during the last 30 day 3. � 1 drink 4. � 2 drinks 5. � 3 drinks 6. � 4 drinks 7. � 5 drinks 8. � 6 drinks 9. � 7 drinks 10. � 8 drinks 11. � 9 drinks 12. � 10 or more drinks

- 89 -
E7 Now think back over the LAST 30 DAYS. On how many occasions (if any) have you had any home made alcohol to drink Mark one box for each line Number of occasions
0 1-2 3-5 6-9 10-19 20-39 ≥40
a) Home made beer � � � � � � �b) Home made wine � � � � � � �c) Home made spirits � � � � � � �
1 2 3 4 5 6 7
E8 Do you think that heavy drinking influences the following problems? Mark one box for each line
Yes, considerably
Yes, quite a lot
Yes, to some extent
Yes, but only a little
No
a) Traffic accident � � � � �b) Other accident � � � � �c) Violent crime � � � � �d) Family problems � � � � �e) Health problems � � � � �f) Relationship problems � � � � �g) Financial problems � � � � �
1 2 3 4 5
E9 Think of that last day on which you drank alcohol. Where you when you drank?Mark all that apply
1. � I never drink alcohol 2. � At home 3. � At someone else’s home 4. � Out on the street, in a park, beach or other open area 5. � At a bar or pub 6. � In a disco 7. � In a restaurant 8. � Other please (please describe)

- 90 -
The following questions are about yourself and things you might do
E12 what house work do you usually do at home? 1. � I do shopping 2. � I take care of younger sister/brother 3. � I take care of pets 4. � I cook 5. � I clean the house/apartment 6. � I do laundry 7. � I wash dishes 8. � I work on the household plot of land (garden) 9. � I take care of farm animals 10. � I care for elder family member 11. � I take out the rubbish 12. � I don’t usually do any house work
E13 How much TV or video do you estimate you watch on an average weekday? 1. � None 2. � Half-hour or less 3. � About 1 hour 4. � About 2 hours 5. � About 3 hours 6. � About 4 hours 7. � 5 hours or more
E14 How good do you think you are at schoolwork, compared to other people your age? 1. � Excellent, I am probably one of the very best 2. � Well above average 3. � Above average 4. � Average 5. � Below average 6. � Well below average 7. � Poor, I am probably one of the worst

- 91 -
Now when you have reached the end of the questionnaire there are a few more questions we would like you to answer. Some of them are similar to questions you have answered earlier,
but they are not the same.
V1 On how many occasions (if any) have you been drunk from drinking alcoholic beverages? Mark one box for each line Number of occasions
0 1-2 3-5 6-9 10-19 20-39 ≥40
a) In your lifetime � � � � � � �b) During the last 12 months � � � � � � �c) During the last 30 days � � � � � � �
1 2 3 4 5 6 7
V2 Think back once more over the LAST 30 DAYS. How many times (if any) have you had five or more drinks in arrow?
1. � None 2. �1 3. � 2 4. � 3-5 5. � 6-9 6. � 10 or more times


![Alcohol and other drugs procedure[1]](https://img.dokumen.tips/doc/110x75/5883c4e81a28ab5c378b7537/alcohol-and-other-drugs-procedure1.jpg)