Embed Size (px)
Citation preview

The AGIR Conference - Brussels 1
Ageing, health and retirement in the EUWhat have we learned from the AGIR Project
Are we living longer and in better health?The AGIR project - WP1
N. Ahn, R. Génova, J. A. Herce and J. Pereira
ENEPRI – European Network of Economic Policy Research InstitutesFEDEA – Fundación de Estudios de Economía Aplicada
www.enepri.org – [email protected]
10th March 2005

The AGIR Conference - Brussels 2
Structure of the presentation:
1. Population, births and mortality since 1950
2. Longevity
3. Lifecourses
4. Health and disability
5. Ageing and health
6. Concluding comments

The AGIR Conference - Brussels 3
1. Population I
Population (x1000) 1950-2000
0
10000
20000
30000
40000
50000
60000
70000
80000
90000
B DK D E FI FR IRL I SW UK
1950
1975
2000
Support ratio (inverse of adr) 1950-2000
0
2
4
6
8
10
B DK D E FI FR IRL I SW UK
1950
1975
2000

The AGIR Conference - Brussels 4
1. Population II
Aged persons ratio (%) in the EU 1950-2000
6
8
10
12
14
16
18
20
B DK D E FI FR IRL I SW UK
1950
1975
2000
Average age in the EU 1950-2000
30
33
36
39
42
B DK D E FI FR IRL I SW UK
1950
1975
2000

The AGIR Conference - Brussels 5
1. Births IBirths in the EU 1950-2000
0
200000
400000
600000
800000
1000000
1200000
B DK D E FI FR IRL I SW UK
1950
1975
2000
Birth ratios (o/oo) in the EU 1950-2000
0
5
10
15
20
25
30
B DK D E FI FR IRL I SW UK
1975
2000
1950

The AGIR Conference - Brussels 6
1. Births II
Fertility rates in the EU 1950-2000
1,0
1,5
2,0
2,5
3,0
3,5
B DK D E FI FR IRL I SW UK
1950
1975
2000

The AGIR Conference - Brussels 7
1. Mortality I
Compression of mortality - The Spanish case 1900-2000
0
10000
20000
30000
40000
50000
60000
70000
80000
90000
100000
0 1 5 10 15 20 25 30 35 40 45 50 55 60 65 70 75 80 85 90 95 100105110
age
Surv
ivor
s
1900
1920
1940
1950
1960
1980
2000

The AGIR Conference - Brussels 8
1. Mortality II
Death risk in 2000 over death risk in 1975 in the EU
0,00
0,20
0,40
0,60
0,80
1,00
0 5 10 15 20 25 30 35 40 45 50 55 60 65 70 75 80 85 90 95
B D DK E F FIN SW IT UK Average
The AGIR Conference - Brussels 9
1. Mortality III
Survivors in 2000 over survivors in 1975 in the EU
0,01,02,03,04,05,06,07,08,09,0
10,011,012,013,014,015,016,017,018,019,020,021,022,023,0
0 5 10 15 20 25 30 35 40 45 50 55 60 65 70 75 80 85 90 95 100
age
UK (1981-2000)
E (1975-2000)
FI (1975-2000)
IT (1974-1998)
Average (1975-2000)
B (1948-2000)
DK (1950-2000)
D (West, 1956-1999
F (1950-2000)
SW (1950-2001)
Average (1950-2000)
The AGIR Conference - Brussels 10
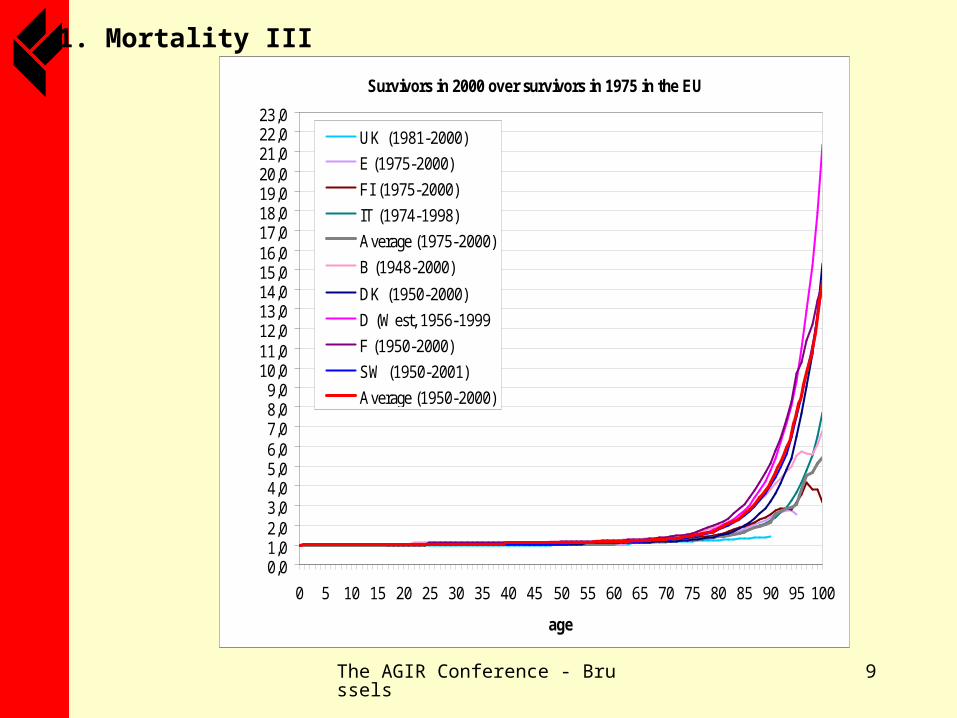
2. Longevity I
Life expectancy at birth in the EU 1950-2000
65
68
70
73
75
78
80
B DK D E FIN FR IT SW UK
1950
1975
2000
Median duration (50% survival) in the EU 1950-2000
687072747678808284
B DK D E FIN FR IT SW UK
1950
1975
2000

The AGIR Conference - Brussels 11
2. Longevity II
Modal duration (age of largest number of theoretical deaths) in the EU 1950-2000
70
75
80
85
90
B DK D E FIN FR IT SW UK
1950
1975
2000
Life endurance (10% survival) in the EU 1950-2000
82
84
86
88
90
92
94
96
B DK D E FIN FR IT SW UK
1950
1975
2000

The AGIR Conference - Brussels 12
2. Longevity III
Record age (age of oldest death) in the EU 1950-ca. 2000
95
100
105
110
115
120
125
B DK D E FIN FR IT SW UK
1950 1975 ca. 2000
Jeanne Calment (1997)

The AGIR Conference - Brussels 13
2. Longevity IV
Mesuring longevity in the EU (averages) 1950-2000
65,0
68,0
71,0
74,0
77,0
80,0
83,0
86,0
89,0
92,0
95,0
1950
1952
1954
1956
1958
1960
1962
1964
1966
1968
1970
1972
1974
1976
1978
1980
1982
1984
1986
1988
1990
1992
1994
1996
1998
2000
100,0
101,5
103,0
104,5
106,0
107,5
109,0
110,5
112,0
113,5
115,0
Lifeexpectancy
Medianduration
Modalduration
Lifeendurance
Record age(Right scale)

The AGIR Conference - Brussels 14
3. Lifecourses
Lifecourse age landmarks in the EU (averages) 1950-2000
0
5
10
15
20
25
30
35
40
45
50
55
60
65
70
75
80
85
9019
5019
6019
7019
7119
7219
7319
7419
7519
7619
7719
7819
7919
8019
8119
8219
8319
8419
8519
8619
8719
8819
8919
9019
9119
9219
9319
9419
9519
9619
9719
9819
9920
00
LE at 65 (+65)
DALE at 65 (+65)
HALE at 65 (+65)
Widowhood
Retirement
Inactivity
Pre-retirement
Invalidity
First child (women)
First marriage
Leav. p. home (E)
Leav. p. home (D)
First job
Leaving school

The AGIR Conference - Brussels 15
4. Health and disability I
Very Bad Bad Fair Good Very GoodShare of those with with Disability
91.79 83.43 40.66 8.35 2.59 22.23
Medical consultations per year
8.54 7.55 5.28 3.14 2.34 3.91
Proportion with Disability and annual medical consultation for Each Health Status – ECHP 1994
General Health StatusTotal
Problems with self assessed health status

The AGIR Conference - Brussels 16
4. Health and disability II
Average Health Status: ECHP 94(very bad=0, bad=1,..., very good=4)
1,0
1,5
2,0
2,5
3,0
3,5
4,0
15-19 20-24
25-29
30-34
35-39
40-44
45-49
50-54
55-59
60-64
65-69
70-74
75-79
80-84
85+
GermanyDenmarkNetherlandsBelgiumFranceUKIrelandItalyGreeceSpainPortugal

The AGIR Conference - Brussels 17
4. Health and disability III
Proportion in bad or very bad health: ECHP 94
0,0
0,1
0,2
0,3
0,4
0,5
0,6
0,7
15-19 20-24
25-29 30-34
35-39 40-44
45-49 50-54 55-59 60-64
65-69 70-74 75-79 80-84
85+
Germany
Denmark
Netherlands
Belgium
France
UK
Ireland
Italy
Greece
Spain
Portugal

The AGIR Conference - Brussels 18
4. Health and disability IV
Proportion with disability: ECHP 94
0,0
0,1
0,2
0,3
0,4
0,5
0,6
0,7
0,8
15-19 20-24
25-29
30-34
35-39
40-44
45-49
50-54
55-59
60-64
65-69
70-74
75-79
80-84
85+
Germany
Denmark
Netherlands
Belgium
France
UK
Ireland
Italy
Greece
Spain
Portugal

The AGIR Conference - Brussels 19
4. Health and disability V
Proportion with severe disability: ECHP 94
0,0
0,1
0,2
0,3
0,4
15-19 20-24
25-29
30-34
35-39
40-44
45-49
50-54
55-59
60-64
65-69
70-74
75-79
80-84
85+
Germany
Denmark
Netherlands
Belgium
France
UK
Ireland
Italy
Greece
Spain
Portugal

The AGIR Conference - Brussels 20
4. Health and disability VI
Country Year Survey Title Sample Size1987 400001993 260001995 84001997 84001999 Disability Survey 70000
1990-91 670001994 62000
1999-2000 1400001987 47001994 47002000 170001990 n.a.1995 n.a.2000 n.a.1997 10,000+2001 n.a.
France 1999 Living Conditions Survey n.a.Germany 1998 Health Survey 7100
Sweden
Belgium
Health Survey
Health Conditions and Use of Health Services
Health Survey
Health Survey
Health Survey
Availability of national Health Surveys data
Spain
Italy
Denmark

The AGIR Conference - Brussels 21
4. Health and disability VII
Proportion in Good Health: Italy vs Spain
0,0
0,2
0,4
0,6
0,8
1,0
0-4 5-9 10-14 15-19 20-24 25-29 30-34 35-39 40-44 45-49 50-54 55-59 60-64 65-69 70-74 75-79 80-84 85+
Italy 99-00 Spain 99

The AGIR Conference - Brussels 22
4. Health and disability VIII
Proportion in Bad Health: Italy 1990-2000
0,0
0,1
0,2
0,3
0,4
0,5
0-4 5-9 10-14 15-19 20-24 25-29 30-34 35-39 40-44 45-49 50-54 55-59 60-64 65-69 70-74 75-79 80-84 85+
1990-91 1994 1999-00

The AGIR Conference - Brussels 23
5. Ageing and health I
Life Expectancy in Good Health (LEGH)
Life Expectancy in Bad Health (LEBH)
Disability Free Life Expectancy (DFLE)
High levelUK(m,f); IRL(m,f);
NL(m,f); DK(m,f); B(m,f)I(m); P(m) UK (m,f)
Mid level GR(m,f); E(m,f); FR(m,f)GR(m); E(m); FR(m); no
pattern for femalesThe rest
Low level I(m,f); D(m,f); F(m,f)) UK(m); DK(m); B(m);
IRL(m); NL(m)D(m,f)
Level improvesIRL(m,f); GR(m); E(m,f);
B(f)IRL(m,f); E(m,f); GR(f);
DK(f); B(f)E(m,f); GR(m,f); IRL(m,f); I(m,f)
Level worsens F(m,f); P(m,f) P(m,f); FR(m); UK(f)DK(m,f); B(m,f); UK(m,f); P(m,f);
FR(m,f)
No patternB(m); DK(m,f); D(m,f);
I(m,f); UK(m,f)
B(m); DK(m); D(m); I(m,f); GR(m); NL(f);
F(f)NL(m,f)
Patterns in (morbidity) Adjusted Life Expectancies - Levels and trends - National Surveys ca. 1990 - ca. 2000

The AGIR Conference - Brussels 24
5. Ageing and health II
MALES 15 LEGH / LE
y = 1,971x - 76,58 R 2 = 0,1163
29
31
33
35
37
39
41
43
45
47
49
56,0 57,0 58,0 59,0 60,0 61,0 62,0 LE
LEGH
Predicting LEGH trhough LE? (Males at 15)

The AGIR Conference - Brussels 25
FEMALES 15 LEGH / LE
y = -1,154x + 115,86
R2 = 0,0378
20
25
30
35
40
45
50
55
63,0 63,5 64,0 64,5 65,0 65,5 66,0 66,5 67,0 67,5 68,0 68,5LE
LE
GH
5. Ageing and health III
Predicting LEGH trhough LE? (Females at 15)

The AGIR Conference - Brussels 26
5. Ageing and health IV
Two scenarios for Adjusted LEs:
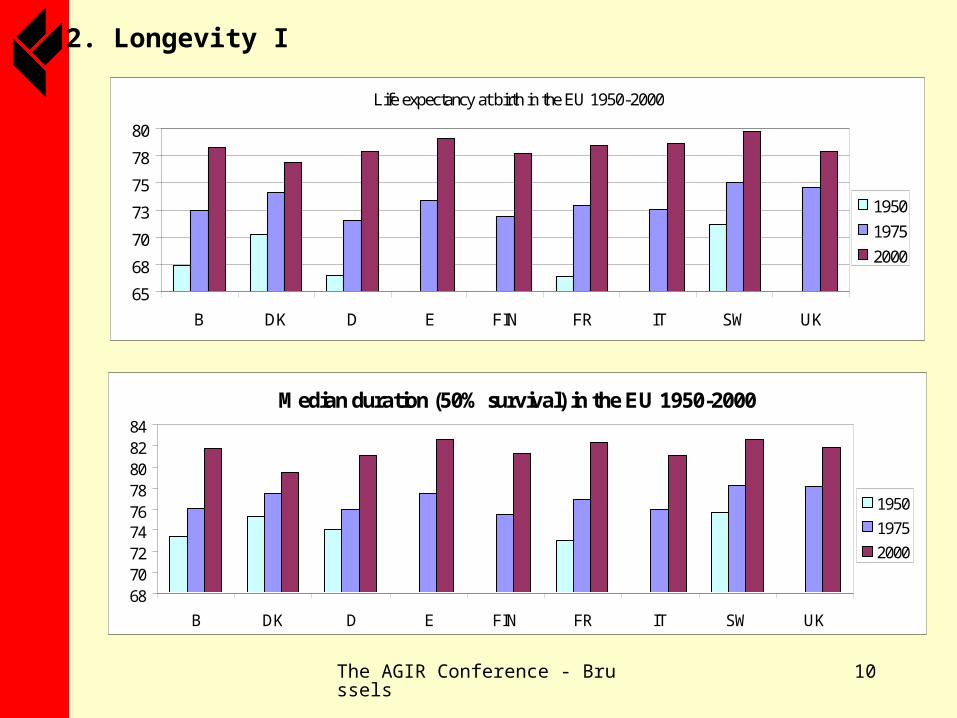
• CRM or “Constant Relative Morbidity: It implies keeping constant the ratio of years lived in good health (or bad health or free of disability) to the number of years lived (Stable weights)
• CAM or “Constant Absolute Morbidity: It implies equating any gain in life expectancy (in years) to an equal number of years lived in good health (or free of disability) (Compression Hypothesis)
The AGIR Conference - Brussels 27
5. Ageing and health V
Life Expectancy in Good Health. Females, age 15 Observed period (1994-98) and projected period (2000-2025)
Compression Hypothesis
20
24
28
32
36
40
44
48
52
56
60
1990 1995 2000 2005 2010 2015 2020 2025 2030
Year
Yea
rs o
f li
fe
BEL
DEN
GER
GRE
SPA
FRA
IRE
ITA
NET
POR
UK

The AGIR Conference - Brussels 28
5. Ageing and health VI
Life Expectancy in Good Health. Males, age 15 Observed period (1994-98) and projected period (2000-2025)
Compression Hypothesis
20
24
28
32
36
40
44
48
52
56
60
1990 1995 2000 2005 2010 2015 2020 2025 2030
Year
Yea
rs o
f li
fe
BEL
DEN
GER
GRE
SPA
FRA
IRE
ITA
NET
POR
UK

The AGIR Conference - Brussels 29
6. Concluding comments
1. European populations have been ageing since the first demographic transition ended before mid of XX century. The “second demographic transition” has made ageing more apparent. Survival has increased considerably and will be the leading driver of future ageing.
2. Longevity has been the result of compressed mortality rather than of extended limit to human life. Whether life endurance increases steadily, survivors ratios at extreme ages have increased manifold in last decades.
3. Lifecourses have evolved thus that number of working years is becoming closer to number of years after leaving activity. This heralds a much distorted future balance between “assets” and “liabilities”, or resources and needs of any kind (pensions, health, dependency) both at individual and aggregate levels.

The AGIR Conference - Brussels 30
6. Concluding comments
4. Assessing health status is a puzzle. Countries compare badly and time trends are difficult to discern from either national health surveys or the ECHP. However, there is a general pattern of health (or disability) adjusted life years keeping track with gains in unadjusted life expectancies.
5. A sophisticated projection of adjusted life expectancies cannot be done on the basis of the data available. Rather what can be done is to build scenarios that do not contradict plainly observed trends. Both CRM or CAM scenarios show that as life expectancy of Europeans increases, few more years free of health or disability impairments could also be at their hand. But that is not granted.