Embed Size (px)
Citation preview
Forthcoming in the Quarterly Journal of Economics
The Aggregate Effect of School Choice: Evidence from a two-stage experiment in India
Karthik Muralidharan† Venkatesh Sundararaman
10 February 2015
Abstract: We present experimental evidence on the impact of a school choice program in the Indian state of Andhra Pradesh (AP) that provided students with a voucher to finance attending a private school of their choice. The study design featured a unique two-stage lottery-based allocation of vouchers that created both a student-level and a market-level experiment, which allows us to study both the individual and the aggregate effects of school choice (including spillovers). After two and four years of the program, we find no difference between test scores of lottery winners and losers on Telugu (native language), math, English, and science/social studies, suggesting that the large cross-sectional differences in test scores across public and private schools mostly reflect omitted variables. However, private schools also teach Hindi, which is not taught by the public schools, and lottery winners have much higher test scores in Hindi. Further, the mean cost per student in the private schools in our sample was less than one-third of the cost in public schools. Thus, private schools in this setting deliver slightly better test score gains than their public counterparts (better on Hindi and same in other subjects), and do so at a substantially lower cost per student. Finally, we find no evidence of spillovers on public-school students who do not apply for the voucher, or on private school students, suggesting that the positive impacts on voucher winners did not come at the expense of other students. JEL Classification: C93, H44, H52, I21, O15 Keywords: school vouchers, school choice, private schools, peer effects, India, education, Right to Education Act, field experiments † Karthik Muralidharan: UC San Diego, NBER, J-PAL; [email protected] (Corresponding author) Venkatesh Sundararaman: World Bank; [email protected] We especially thank Michael Kremer for his involvement as a collaborator in the early stages of this project and for subsequent discussions. We also thank Abhijit Banerjee, Jim Berry, Julian Betts, Prashant Bharadwaj, Julie Cullen, Gordon Dahl, Jishnu Das, Esther Duflo, Pascaline Dupas, Roger Gordon, Gordon Hanson, Mark Jacobsen, Aprajit Mahajan, Paul Niehaus, Miguel Urquiola, several seminar participants, three anonymous referees and the editor Lawrence Katz for comments and suggestions. This paper is based on the Andhra Pradesh School Choice Project that was carried out under the larger program of the "Andhra Pradesh Randomized Evaluation Studies (AP RESt)", which was set up as a research partnership between the Government of Andhra Pradesh, the Azim Premji Foundation, and the World Bank. The majority of the funding for the project was provided by the Legatum Foundation and the Legatum Institute, with additional financial support from the UK Department for International Development (DFID), and the World Bank. Muralidharan also acknowledges financial support from a National Academy of Education/Spencer Foundation post-doctoral fellowship. We are deeply grateful to M Srinivasa Rao, B Srinivasulu, S Ramamurthy, and staff of the Azim Premji Foundation for their outstanding efforts in implementing the project in Andhra Pradesh, and to DD Karopady and Dileep Ranjekar for their constant support. We thank Gautam Bastian, Vikram Jambulapati, Naveen Mandava, Jayash Paudel, and Arman Rezaee for excellent research assistance at various stages of the project. The findings, interpretations, and conclusions expressed in this paper are those of the authors and do not necessarily represent the views of the Government of Andhra Pradesh; the Azim Premji Foundation; or the World Bank, its Executive Directors, or the Governments they represent.

1
1. Introduction
One of the most important trends in primary education in developing countries over the past
two decades has been the rapid growth of private schools, with recent estimates showing that
private schools now account for over 20% of total primary school enrolment in low-income
countries (Baum et al. 2014). The growing market share of fee-charging private schools is
especially striking as it is taking place in a context of increased spending on public education and
near universal access to free public primary schools, and raises important questions regarding the
effectiveness of private schools in these settings and the optimal policy response to their growth.
Opponents of the growth of private schooling argue that it has led to economic stratification
of education systems and has weakened the public education system by causing the middle class
to secede. They also worry that private schools compete by cream-skimming students, and attract
parents and students on the basis of superior average levels of test scores, but that they may not
be adding more value to the marginal applicant.1 Others contend that private schools in
developing countries have grown in response to failures of the public schooling system, that they
are more accountable and responsive to parents, that the revealed preference of parents suggests
that they are likely to be better than public schools, and that policymakers should be more open
to voucher-like models that combine public funding and private provision of education.2
There is, however, very little rigorous empirical evidence on the relative effectiveness of
private and public schools in low-income countries. Non-experimental studies have used several
approaches to address identification challenges, and have typically found that private school
students have higher test scores, but have not been able to rule out the concern that these
estimates are confounded by selection and omitted variables.3 Further, even experimental studies
of school choice to date (from anywhere in the world) have not been able to distinguish between
the effects of school productivity and changes in peer composition for voucher winners. For
instance, Hsieh and Urquiola (2006) argue that Chile's school voucher program led to increased
sorting of students among schools, but did not improve average school productivity.
1 This concern is supported by several studies across different contexts, which find that highly-demanded elite schools do not seem to add more value to student learning (see Zhang (2014) in China, Lucas and Mbiti (2014) in Kenya, Cullen et al. (2006) in Chicago, and Abdulkadiroglu et al (2014) in Boston and New York). 2 See Tooley and Dixon (2007), Muralidharan and Kremer (2008), Goyal and Pandey (2009), and Tooley (2009). 3 Existing approaches to identifying the causal effects of private schools in developing countries include controlling for observables (Muralidharan and Kremer 2008), incorporating a selection correction (Desai et al. 2009), using family fixed effects and within household variation (French and Kingdon 2010), aggregation of test scores to district-level outcomes (Bold et al 2011; Tabarrok 2013), and using panel data (Andrabi et al. 2011; Singh 2014).

2
We present experimental evidence on the impact of a school choice program in the Indian
state of Andhra Pradesh (AP) that featured a unique two-stage randomization of the offer of a
voucher (across villages as well as students). The design creates a set of control villages that
allows us to experimentally evaluate both the individual impacts of school choice (using the
student-level lottery) as well as its aggregate effects including the spillovers on non-applicants
and students who start out in private schools (using the village-level lottery). The experiment
was a large one that led to 23% of students in public schools in program villages moving to a
private school. Participation of private schools in the voucher program was voluntary, but they
were not permitted to selectively accept or reject voucher-winning students.
The main operating difference between private and public schools in this setting is that
private schools pay substantially lower teacher salaries (less than a sixth of that paid to public
school teachers), and hire teachers who are younger, less educated, and much less likely to have
professional teaching credentials. However, private schools hire more teachers, have smaller
class sizes, and have a much lower rate of multi-grade teaching than public schools. Using
official data and data collected during unannounced visits to schools, we find that private schools
have a longer school day, a longer school year, lower teacher absence, higher teaching activity,
and better school hygiene. We find no significant change in household spending or in time spent
doing homework among voucher-winning students, suggesting that the impact of school choice
on test scores (if any) is likely to be due to changes in school as opposed to household factors.
At the end of two and four years of the school choice program, we find no difference
between the test scores of lottery winners and losers on the two main subjects of Telugu (native
language of AP) and math, suggesting that the large cross-sectional test-score differences in
these subjects across public and private schools (of 0.65σ) mostly reflect omitted variables.
However, analysis of school time use data reveals that private schools spend significantly less
instructional time on Telugu (40% less) and math (32% less) than public schools, and instead
spend more time on English, and science and social studies (EVS). They also teach a third
language, Hindi, which is not taught in public primary schools (Hindi is not the main language in
AP, but is the most widely spoken language in India). We conduct tests in all these subjects after
four years of the voucher program and find small positive effects of winning the voucher on
English (0.12σ; p = 0.098), and EVS (0.08σ; p = 0.16), and large, positive effects on Hindi
(0.55σ; p < 0.001).
3
If we assume equal weights across all subjects, we find that students who won a voucher had
average test scores that were 0.13σ higher, and that the average student who attended a private
school using the voucher scored 0.26σ higher (p < 0.01). This positive impact is mainly driven
by Hindi (which is taught in private schools but not in public primary schools), and we find no
impact of winning a voucher on average test scores excluding Hindi. However, even without
assuming equal weights across subjects, we can still infer that private schools were more
productive than public schools because they were able to achieve similar Telugu and math test
scores for the lottery winners with substantially less instructional time, and use the additional
time to generate large gains in Hindi test scores. Further, the annual cost per student in the
public-school system is over three times the mean cost per student in the private schools in our
sample. Thus, students who win a lottery to attend private schools have slightly better test scores
(better on Hindi and same on other subjects) even though the private schools spend substantially
lower amounts per student.
These gains in test scores for voucher-winning students do not come at the expense of other
students who may have been indirectly affected by the voucher program. Comparing across
treatment and control villages, we find no evidence of spillovers on public-school students who
do not apply for the voucher. We also do not find any significant difference between the test
scores of applicants who are lottery losers across treatment and control villages. Finally, we find
no evidence of any negative spillovers on students who started out in private schools to begin
with. Taken together, we find no evidence of adverse effects on any of the groups of students
who experienced a change in their peer group as a result of the voucher program.
Turning to heterogeneity, we find limited evidence of variation in program impact by student
characteristics, but do find suggestive evidence of heterogeneity as a function of school and
market characteristics. In particular, instrumental variable (IV) estimates suggest that students
who switched from attending a public school to a Telugu-medium private school did better than
those attending an English-medium one (especially on non-language subjects).4 The IV estimates
have large standard errors and are not precise, but they suggest that private schools may have
been even more effective when students did not experience the disruption of changing their
medium of instruction. They also suggest that switching to English-medium schools may have
4 We instrument for medium of instruction of the school attended (which is a choice variable) with the medium of instruction of the nearest private school to each applicant for the voucher, and the interaction of receiving the voucher and the medium of instruction of the nearest private school. See details in section 4.4.2.
4
negative effects on first-generation learners' literacy in the native language and on their learning
of content in other non-language subjects. Finally, we also find suggestive evidence that the
impact of the vouchers may have been higher in markets with greater choice and competition.
Since Friedman (1962), the theoretical promise that greater school choice and competition
may yield better education outcomes has generated a large empirical literature, with the best-
identified studies typically using lottery-based designs to identify the impact of choice and better
schooling options.5 However, the results to date on school choice are quite mixed with most
studies typically finding zero to modest positive effects of receiving a voucher or attending a
more selective school on test scores (Rouse and Barrow 2009 review the evidence). On the other
hand, more recent studies have found significant positive effects of attending charter schools on
test scores (Hoxby et al. 2009; Abdulkadiroglu et al. 2011; Dobbie and Fryer 2011).
We add to this evidence base by providing the first experimental evidence on the impact of
school choice, and the relative performance of public and private schools in a developing
country.6 Further, our two-stage design allows us to conduct the first experimental analysis of
the spillover effects of school choice programs on non-applicants, on lottery losers, and on
private school students.
More generally, our results highlight that it is essential for the school choice literature to
recognize that schools provide vectors of attributes and may be horizontally differentiated in
their offerings. Note that our inference regarding the relative productivity of private and public
schools would have been wrong if we had not accounted for school time use patterns and had not
measured outcomes on additional subjects on the basis of analyzing the school time use data.
Similarly, evaluating school choice and charter school programs on a limited set of test scores
(typically in math and reading) may provide an incomplete picture of the impact of such
programs if they do not account for the full pattern of time use in these schools. Our suggestive
evidence of heterogeneity of impact by medium of instruction further highlights the centrality of
accounting for variation across schools' instructional programs for studying the relative
productivity of public and private schools, and the impact of school choice.
5 Studies of school choice and charter schools using lottery-based designs include Howell et al. (2002), Howell and Peterson (2002), Cullen et al (2006), Abdulkadiroglu et al. (2011), Dobbie and Fryer (2011), and Wolf et al. (2013). 6 Angrist et al. (2002, 2006) provide experimental evidence on vouchers in the middle-income setting of Colombia, and find positive effects of Colombia's PACES program. However, the program allowed vouchers to be topped up, and required students to maintain minimum academic standards to continue receiving the voucher. The estimates therefore reflect a combination of private school productivity, additional education spending, and student incentives.
5
The rest of this paper is structured as follows: Section 2 describes the AP School Choice
experiment (design, validity, and data collection); section 3 presents results on summary
statistics of school, teacher, and household inputs into education; section 4 presents the test score
results, and section 5 discusses policy implications, caveats, and directions for future research.
Tables A.1 to A.9 are available in an online appendix on the journal website.
2. The Andhra Pradesh (AP) School Choice Experiment
2.1 Background and Context
India has the largest school education system in the world comprising around 200 million
children. Primary school enrollments have steadily increased over the past two decades and over
96% of primary-school aged children are now enrolled in school. Nevertheless, education
quality is low with less than 40% of children aged 6 to 14 in rural India being able to read at the
second-grade level (ASER 2013). The majority of children in rural India are enrolled in free
government-run public schools (with additional benefits such as free textbooks, and mid-day
meals).7 However, the public education system in India is characterized both by inefficient
choices of inputs, as well as inefficient use of resources conditional on the choice of inputs.8
A prominent trend in India in the past two decades has been that parents are enrolling their
children in fee-charging private schools in increasing numbers. Annual data from the ASER
reports show that 29% of children between the ages of 6 and 14 in rural India attended fee-
charging private schools in 2013 compared to 18.7% in 2006, pointing to a rapid growth in the
market share of fee-charging private schools at a rate exceeding one percentage point per year
(ASER 2013). While annual data on private school market share is not available for urban areas,
this figure was estimated to be 58% in 2005 (Desai et al. 2009) and was recently estimated to be
over 65% for the medium-sized Indian city of Patna (Rangaraju et al. 2012).
The majority of these private schools are low-cost or "budget" private schools that cater to
non-affluent sections of the population, and per-student spending in these schools is significantly
7 Government-run public schools are referred to as "government schools" in India, with the term "public school" often referring to elite private schools (following the British convention). We use the term "public school" throughout this paper to refer to government-run public schools following the more standard use of the term. 8 As an example of inefficient choice of inputs, Muralidharan and Sundararaman (2013) show that locally-hired contract teachers are at least as effective as civil-service teachers in spite of the latter being paid five times higher salaries. The most striking evidence on inefficient use of inputs is perhaps the high rate of teacher absence. 26.2% of public-school teachers in rural India were found absent during unannounced visits to a nationally-representative sample of schools in 2003 (Kremer et al. 2005), and 23.6% were found absent in 2010 (Muralidharan et al. 2014).

6
lower than that in public schools (Tooley 2009). However, since private schools charge fees and
public schools are free, students attending private schools on average come from more affluent
households with higher levels of parental education (Muralidharan and Kremer 2008; also see
Table II – columns 1-3). Cross-sectional studies (as well as our baseline data) find that students
in private schools significantly outperform their counterparts in public schools, even after
correcting for observable differences between the characteristics of students attending the two
types of schools (Muralidharan and Kremer 2008; Desai et al. 2009; French and Kingdon 2010).
Nevertheless, these studies cannot fully address selection and omitted variable concerns with
respect to identifying the causal impact of attending a private school.9
The growth of private schools has led to concerns about increasing economic and social
stratification in education (Srivastava 2013), and has led to calls for expanding access to private
schools for all children, regardless of socioeconomic background – including experimenting with
voucher-based school choice programs (Shah 2005; Kelkar 2006). India's recently passed Right
to Education (RtE) Act includes a provision mandating that private schools reserve up to 25% of
the seats in their school for students from disadvantaged backgrounds, with a reimbursement of
fees by the government (subject to a maximum of the per-child spending in public schools).
If implemented as intended, this provision in the RtE Act could lead to India having the
world's largest number of children attending private schools with public funding. It may also
constitute the most ambitious attempt at school integration (across socio-economic classes) that
has ever been attempted (analogous to school desegregation in the US). Estimating the relative
productivity of public and private schools, and the spillover effects of moving children from
public to private schools are therefore especially policy relevant in this setting.
2.2 Conceptual Overview of Experiment Design
Experimental evaluations of school voucher programs to date typically feature excess
demand for a limited number of vouchers, which are allocated among applicants by lottery.
Such a design creates four groups of students as shown in Figure I (Panel A): non-applicants
(group 1), applicants who lose the lottery (group 2), applicants who win (group 3), and students
in private schools to begin with (group 4). The lottery is used to estimate the impact of winning a
9 Beyond selection, a major limitation in the cross-sectional comparisons is that private school students typically have two years of pre-school education (nursery and kindergarten) compared to public school students (who typically start in the first grade). Thus, comparisons of test score levels at a given primary school grade confound the effectiveness of private schools and the total years of schooling. Panel data approaches can mitigate this concern (Singh 2014) but are limited by the lack of annual panel data on test scores in representative samples.
7
voucher conditional on applying for it (comparing groups 3 and 2), and the impact of attending a
private school (using the lottery as an instrumental variable for attending a private school).
However, even this experimental design faces two limitations: a contaminated control group,
and an inability to estimate spillover effects that may negate (potential) gains estimated for
voucher winners. First, the departure of some voucher winners may have additional effects on
lottery losers (group 2) including changes in the peer group, changes in per-student resources
(especially class size), and behavioral changes by public school teachers in response to the
voucher program. These confounding factors could bias experimental studies to date, since the
control group is not unaffected by the voucher program. Second, existing studies cannot
experimentally estimate impacts on students left behind in public schools who did not apply for
the voucher and may be worse off from the departure of highly-motivated peers (group 1), or the
impact on students in private schools who may be worse off due to an influx of low-performing
students from public schools (group 4). Thus, even if group 3 does better than group 2 (the focus
of experimental studies to date), this may have come at the cost of poorer performance for
groups 1 and 4. Hence, a critical open question in the global literature on vouchers and school
choice is that of the "aggregate impact" of such programs (Hsieh and Urquiola 2006).
The Andhra Pradesh (AP) School Choice Project (that this paper is based on) aims to address
both these issues using a two-stage experiment, where villages are first randomized into control
and treatment groups, after which some applicants in the treatment villages are offered vouchers
using a second lottery (Figure I - Panel B). Since villages are randomized into treatment and
control status after baseline tests are conducted and after parents apply for the voucher,
comparing the lottery winners (3T) with lottery losers in control villages (2C) allows for an
uncontaminated estimate of the impact of school choice. Thus, applicants in group 2C are a
"pure" control group because they applied for the voucher and lost the lottery (at the village
level), but nothing changed for them because there was no voucher program in their villages.
The design also allows us to estimate three sets of spillovers, which have not been possible to
date. First, comparing groups 2T (control students with spillovers) and 2C (control students
without spillovers), provides an estimate of the extent to which ignoring spillovers to the control
group may bias existing voucher studies. Second, comparing groups 1T and 1C lets us estimate
the impact of school choice programs on the students "left behind" in public schools (who for
reasons of limited information or motivation choose to not apply for the voucher). Third,

8
comparing outcomes between groups 4T and 4C provides an estimate of whether students in
private schools are adversely affected by an influx of students from public schools (which is
what will happen under the school integration envisaged by the RtE Act). Overall, the key
innovation in our design is that the control villages provide a "system-level" counterfactual to the
voucher program enabling experimental comparisons that have not been possible to date.
2.3 The AP School Choice Experiment
Andhra Pradesh (AP) is the 5th most populous state in India, with a population of 85 million
(70% rural).10 Recent estimates suggest that over 35% of students in rural AP are enrolled in
private schools, compared to an all India average of 28% (ASER 2013). The AP School Choice
Project was implemented by the Azim Premji Foundation (one of India's leading non-profits
working on education).11 The school year in AP runs from mid-June to mid-April, and the
project started in the school year 2008-09, and continued for four years (preparatory work started
in the prior school year of 2007-08).
The AP School Choice project was carried out in five districts across AP over a universe of
180 villages that had at least one recognized private school.12 Baseline tests were conducted for
all students in two cohorts of all schools (public and private) in these villages in March-April
2008.13 This was followed by an invitation to apply for a voucher to parents of students in public
schools (who had taken the baseline test) in all 180 villages. The application specified the full
terms of the voucher including the fact that it would be allocated by lottery and that applying did
not guarantee receipt of the voucher. The voucher covered all school fees, textbooks,
workbooks, notebooks and stationery, and school uniforms and shoes, but did not cover transport
costs to attend a private school outside the village and did not provide any allowance in lieu of
the free mid-day meals that the public schools provide. The value of the voucher was paid
10 Note that the original state of AP was divided into two states on June 2, 2014. Since this division took place after our study, we use the term AP to refer to the undivided state. 11 The AP School Choice Project was carried out under the larger program of the "Andhra Pradesh Randomized Evaluation Studies (AP RESt)" which was set up as an education research partnership between the Government of Andhra Pradesh, the Azim Premji Foundation, and the World Bank. 12 These were the same districts as in the overall AP RESt project, and were representative of all the three major regions of AP (Muralidharan and Sundararaman 2010, 2011, 2013). The AP School Choice Project was conducted in different sub-districts and so there was no overlap in the schools/villages across these studies. 13 The cohorts covered were students attending kindergarten and grade 1 in the previous school year (2007-08), and the voucher covered the entire primary education of recipients from the school year 2008-09 (from grade 1 to 5 for the younger cohort and from grade 2 to 5 for the older cohort). Baseline tests were conducted in math and Telugu (native language of AP) for the older cohort and in Telugu for the younger cohort.
9
directly to the school, and books and materials were provided directly to the voucher households
by the schools.14
At the same time as the baseline tests, the Azim Premji Foundation (the Foundation) also
invited participation in the project from private schools in the sample villages, and school
participation was voluntary. The value of the voucher was set at the 90th percentile of the
distribution of the all-inclusive private school fees in the sampled villages, and schools were
asked to indicate if (a) they wanted to participate in the program by being willing to admit
economically disadvantaged students who would be awarded a voucher by the Foundation, and
(b) if so, how many seats they could make available to voucher students in each of the two
cohorts.15 The terms and conditions specified that the Foundation would directly pay the value of
the voucher to the school's bank account (in three installments per year, which was the typical
fee cycle of the schools). The only condition imposed on the schools was that they were not
allowed to select voucher students. If there was greater demand for a school than the number of
places offered, then the school could either admit all voucher recipients who wanted to attend the
concerned school or the Foundation would conduct a lottery to allocate the places among the
applicants. This was similar to admission protocols of most charter school programs in the US.16
Communication with schools, and elicitation of willingness to participate, was conducted
before the village-level randomization took place. Once the applications were completed, 90
villages (stratified by district) were assigned by lottery to be voucher villages (Figure I - Panel
A), while the other 90 villages continued "as usual" with no voucher program (Figure I – Panel
B). Conditional on being a "voucher village", a second lottery was conducted to offer the
vouchers to a subset of applicants. The design therefore created two lottery-based comparison 14 This was consistent with the standard practice that private schools had a recommended set of books, uniforms etc., which they procured in bulk and supplied to parents for a fixed fee. It was therefore easiest to have the voucher cover these payments directly as opposed to making cash payments to parents for these additional expenses. The communication regarding the voucher program and the application process was done by field staff of the Azim Premji Foundation during the summer break in May 2008. 15 At the time of starting the project, the 2005 draft of the Right to Education (RtE) Act was already in circulation and private schools knew that the stipulation regarding reserving seats for economically disadvantaged children in private schools was likely to be implemented. Thus, the communications to schools regarding the project was along the lines that this was a pilot project being done by the Foundation to help the Government of AP understand the impacts and implications of implementing this provision of the RtE Act. The value of the voucher was set at the 90th percentile of the fee distribution to ensure that the reimbursement was above marginal cost for all schools (while still being considerably below the benchmark of per-child spending in public schools). 16 In practice, participating schools accepted all applicants who indicated a preference for the school, and the Foundation never needed to conduct any such school-level lotteries. Field interviews suggest that the private schools in this setting were not "selective" on any criteria other than ability to pay fees, and were happy to accept all voucher-receiving students, since the Foundation could be relied on to make full and timely fee payments.

10
groups – those who did not get the voucher due to their village not being selected for the
program (group 2C in Figure I), and those who did not get the voucher due to losing the
individual level lottery conducted within voucher villages (group 2T in Figure I).
The allocation of villages and students to the voucher program by lottery ensured that the
treatment groups and the corresponding comparison groups are not significantly different on
observable characteristics including baseline test scores, parental education, assets, and caste.
Table I (Panel A) shows the balance between lottery winners and losers – first showing the
comparison with lottery losers in the treatment villages and then showing it with lottery losers in
control villages. Panel B shows the balance for the groups of students who will be used for the
spillover analysis – first showing the comparison between non-applicants across treatment and
control villages, and then showing it between students who start out in private schools across
these villages (for the representative sample of students in these groups who we track over time).
Out of 10,935 eligible households, a total of 6,433 households applied for the voucher (59%).
A total of 3,097 households had applied in the treatment villages, from which 1,980 were
selected by lottery to receive the voucher (64%). 1,210 of these 1,980 households accepted the
voucher and enrolled in a private school at the start of the project (61%). Thus, a total of 23% of
public school students in treatment villages accepted the voucher and moved to private schools,
and around 8% of the students in private schools (in the two treated cohorts) were those who had
transferred from the public school with the voucher. At the end of four years of the project, a
total of 1,005 students continued to avail of the voucher. Figure II shows the program design
with the actual number of students in each of the cells.
Table II presents summary statistics for the typical public and private school students
(columns 1-3); for applicants and non-applicants from public schools (columns 4-6), and for
those who accepted the voucher conditional on winning it and those who did not (columns 7-9).
Overall, the students who applied for and accepted the voucher had lower baseline test scores,
suggesting that students with lower test scores were more likely to leave the public schools if
given the opportunity to do so. Students belonging to historically disadvantaged scheduled
castes are equally likely to apply for the voucher, but less likely to accept it if awarded.
Nevertheless, the fraction of voucher accepting students who belonged to scheduled castes was
considerably higher than the fraction of scheduled caste students in a typical private school
(column 7 vs. column 1) suggesting that the provision of vouchers can significantly reduce

11
socio-economic stratification in private schools (which is one of the main concerns expressed
regarding the growth of private schools – see Srivastava and Walford 2007, and Srivastava 2013
for illustrative discussions).
Table A.1 presents voucher application and acceptance rates by observable student
characteristics.17 The main observable that is correlated with application (and especially with
acceptance) is distance to a private school. Students with a private school within half a kilometer
were 6.5 percentage points more likely to apply for a voucher and 16.8 percentage points more
likely to accept it if awarded. Students with an older sibling in the public school, in the older
cohort, and without a parent who has completed tenth grade were slightly less likely to apply, but
no less likely to accept if awarded. Scheduled caste students were no less likely to apply, but
were less likely to accept if awarded. Of course, the differences reported in Tables 2 and A.1 do
not affect our experimental estimates, but they help characterize the nature of selection on the
non-experimental margins of the study (application for and acceptance of the voucher).
2.4. Data and Attrition
We collect a rich set of survey data on school and teacher characteristics. Enumerators
conducted unannounced visits to schools during the four years of the project and measured
teacher absence and activity, classroom practices and processes, and school hygiene. They also
conducted household surveys to obtain data on household inputs into education – including
expenditure as well as student time-use data. The school surveys were carried out once a year in
all schools in the 180 project villages, while the household surveys were carried out in a
representative sample of households each year from all the four groups of students as indicated
in Figure II (in both treatment and control villages).
Data on learning outcomes was collected through independent student tests conducted at the
end of two and four years of the project. Tests in Telugu (native language of AP and the medium
of instruction in public schools), math, and English, were conducted at the end of two and four
years, while additional tests in science and social studies (EVS), and Hindi were administered at
the end of four years. All subjects except Hindi were administered as written tests, whereas the
Hindi tests were administered individually to students by enumerators. We attempted to
administer the written tests to the full set of students who had applied for the voucher (groups 2
17 Note that Table II presents mean values of observable characteristics among students who applied/accepted, whereas Table A.1. presents mean application/acceptance rates for students with and without specific characteristics.
12
and 3), and a representative sample of students who had either not applied or who were in the
private schools at the start of the project (groups 1 and 4). The Hindi tests were more expensive
to conduct (since they were done individually) and were administered to a representative sample
of the students who applied for the voucher. We verify that the samples are balanced across
treatment and control groups for all variables in Table I in all cases where we survey/test a
representative sample of students (tables available on request).
Field enumerators made extensive efforts to keep track of all students who were in the frame
of the study at the beginning, but some attrition was unavoidable.18 The two year attrition rate
was 10% and 15% in the treatment and control groups respectively, and the four-year attrition
rate was 15% and 19% in the two groups (Table A.2 – Panel A; columns 4, 5, 10, and 11). These
differences are statistically significant (columns 6 and 12), but we find no difference in
observable characteristics between the attritors across the treatment categories. We also estimate
a model of the probability of attrition from the sample using all observable characteristics
reported in Table I (collected before the lottery) and cannot reject the null that the same model
predicts attrition in both the treatment and control samples.
Given the balance of attrition on all observable characteristics (both individually and jointly),
the estimation sample is unlikely to be imbalanced on unobservables that may be correlated with
test score gains over the period of the study. Nevertheless, we test our results for robustness
using both inverse-probability reweighting as well as bounding (Lee 2009). The attrition rate in
the sample that is used to test for spillovers is around 33% (Table A.2 – Panel B), but the
differences between treatment and control students are not significant.19
3. Results – School, Teacher and Household Inputs
3.1 School and Teacher Inputs
Table III (Panel A) presents key summary statistics on private schools in our sample (using
data from only the control villages to ensure that the descriptive statistics represent "business as
18 Most of the attrition is due to students who had migrated and could not be found, as opposed to students still attending schools but not present for testing. The initial tests at the end of two years of the project were conducted in schools, but had high attrition rates (around 40%). This was followed by an intense effort by enumerators to track down all the students who had applied for the voucher and the conducting of an additional round of testing in each village outside school hours. This was conducted in November 2010 (around a third of the way into the third year of the program), and so the test score results corresponding to "two years" as described in the text are based on tests conducted around 2.33 years into the program. A similar protocol was followed for testing after four years. 19 There is a significant difference between treatment and control groups in this sample in 1 out of 24 comparisons, which is in line with expectations in a random sample (Table A.2 – Panel B). We control for the variables compared in Table A.2 in all our estimates of program impact.
13
usual" differences and are not affected by the treatment).20 On average, private schools in our
sample are considerably larger than their public counterparts. They have a longer school year (2
working weeks or 11 days longer per year), and have considerably lower pupil-teacher ratios
(around a third lower) than public schools. They are also more likely to have drinking water,
functional toilets (as well as separate toilets for girls), functional electricity, and to have a
computer, with the differences being quite stark on some of these measures. Public schools are
more likely to have a library (usually a collection of books and not a separate room) and radio.
Public school teachers are more likely to be male, are considerably older, have more years of
teaching experience, are more likely to have completed a college degree, and are much more
likely to have completed a teacher training course (Table III - Panel B). However, they are less
likely to be from the same village as the schools that they are assigned to, and are paid six times
higher salaries. This calculation understates the differences in total pay, because it does not
include the discounted value of the pension and other retirement benefits that civil-service
teachers obtain that are typically not available to private school teachers.
The total spending per-child spending in the public schools is over four times the mean per-
child spending in the private schools in our sample (Table III - Panel C).21 As the discussion
above suggests, the main driver of these differences in costs is the much higher salaries paid to
public school teachers. However, private schools hire more teachers per student, and also have
better infrastructure, as a result of which the differences in per-child expenditure are not as stark
as the differences in teacher salaries.
In addition to reporting on measures of school and teacher quality based on their
characteristics, we also measure school quality using direct observations of schools and teachers
conducted during unannounced visits to the schools during the four years of the project (a
representative sample of schools and teachers were observed each year). Private schools
20 There are no significant differences in mean private school characteristics across treatment and control villages, but we use only the control villages for the purposes of the summary statistics. We verify that being in treatment villages does not change the mean private school characteristics relative to control villages over the course of the study (results available on request). In other words, it appears as if schools used the additional resources provided by the voucher payments to either keep overall enrollments constant (by accepting voucher recipients instead of other students) or by hiring enough staff so that their mean characteristics (such as class size) did not change on average. More broadly, since this was a one-off experiment that was not repeated for later cohorts, we do not expect to see a significant supply-side response from private schools in response to the program (unlike what might be expected in a scaled-up steady state implementation of the RtE Act, or in a scaled up voucher system like in Chile). 21 Note that since salary expenditures are not reported at the school level, we compute average per-child spending in public schools from analysis of budget documents at the state-level (Dongre 2012).

14
significantly outperform public schools on all measures of observed classroom processes (Table
IV – Panel A). Classrooms in private schools are significantly more likely to be engaged in
active teaching (51% vs. 34%), have a greater likelihood of a teacher being in the classroom
(97% vs. 92%), and are much less likely to be multi-grade classrooms where more than one
grade is taught simultaneously by the same teacher (24% vs. 79%). Moreover, enumerators
coded teachers in private schools as being more likely to be in complete control of the class
(69% vs. 41%) and as more effective in teaching and maintaining discipline (50% vs. 36%).
We find from observations at the teacher level (Table IV – Panel B) that public school
teachers were considerably more likely to be absent than private school teachers (24% versus
9%) and less likely to have been actively teaching at the point of observation (35% versus
50%).22 Finally, enumerators also coded measures of school hygiene based on their observations
when they entered the schools (Table IV – Panel C) and we find that private schools are less
likely to have indicators of poor hygiene such as having garbage dumped on the school premises,
having stagnant water (breeding ground for mosquitos), or having a heavy presence of flies on
the school premises (a common carrier of pathogens from open human and animal waste).
3.2 Household Inputs
In addition to school-level factors, receipt of a voucher may also change household inputs
into education (Das et al. 2013; Pop-Eleches and Urquiola 2013). We collect data on time use as
well as household expenditure on education from a representative sample of students, and
compare these across treatment and control households. Columns 1 and 2 of Table V present the
cross-sectional comparison of average child time use and household education expenditure
between children attending private and public schools. Columns 4 and 5 present means of these
same metrics for students who were awarded the voucher and those who were not. Column 6
presents the estimate of the intent-to-treat (ITT) effect of receiving a voucher on time use and
expenditure, while column 7 presents the estimate of average treatment-on-treated (ATT) effect
on time use of attending a private school. Thus, comparing columns 7 and 3 provides a measure
of the extent to which time use and household expenditure patterns of voucher receiving students
who attended a private school had converged to the typical patterns of private-school students.
22 The discrepancy between the difference in teacher absence rates (15 percentage points) and the difference in the probability that a classroom does not have a teacher (5 percentage points) is partly explained by the fact that the most common response to teacher absence in public schools is to combine grades and have all students taught by the same teacher (as seen in the much higher rate of multi-grade teaching in public schools).

15
The typical private school student spends 43 minutes more per day in school, and an
additional 23 minutes per day on studying and doing homework at home (Table V, Panel A,
columns 1-3), which adds up to over an hour of extra school and study time per day and over 250
hours per year. Comparing columns 3 and 7, we see that the voucher receiving students who
attend a private school have completely caught up with the typical private school student in
terms of time spent in school. However, a striking result is that they do not appear to have
caught up in terms of time spent studying and doing homework at home. Also, the typical
private school student spends 20 minutes less per day playing with friends, while there is no
reduction in time spent playing with friends for the voucher winners. These results suggest that
study and play habits of voucher winners at home did not change over this period.23
Households with children attending private schools spend over five times as much money on
that child's education (Table V, Panel B, columns 1-3), which reflects private school fees and
additional required expenditures on textbooks and uniforms. Public schools are free, provide free
textbooks, and uniforms are optional. However, voucher-winning households spend a little less
on the education (of the winning child) relative to the control group (column 7), which is
consistent with the fact that the voucher pays for school fees, books, and uniforms/shoes.
In summary, household expenditure on education is slightly lower for voucher-winning
children, and we find no evidence of a change in home study habits of the voucher winners.
However, the average time spent in school does go up for voucher winners. Thus, any impact on
test scores for voucher winners is likely to be due to changes in school-level factors as opposed
to increases in household inputs.
4. Results – Test Scores
4.1 Impact of winning a voucher and attending a private school
Our main estimating equation for the impact of receiving the voucher takes the form:
∙ ∙ ∙ ∙ (1)
where represents normalized test scores for student i in subject s in village v, at the end
of n years of the experiment. Since test scores are highly correlated over time, we control for
23 Overall, around two thirds of the cost of the extra time spent in school (45 minutes/day) seems to have been borne by parents (30 minutes of reduced time on chores and work outside the home), while the remaining one third was borne by the student (15 minutes less of watching TV and free time).
16
baseline test scores to increase the precision of our estimates.24 We also include a set of district
fixed effects ( to absorb geographic variation and increase efficiency, and to account for the
stratification of the village-level lottery at the district level. The main estimate of interest is ,
which provides an unbiased estimate of the impact of winning a voucher on test scores (the
intent-to-treat or ITT estimate) since the voucher was assigned by lottery. We estimate both
with and without controlling for household socioeconomic characteristics shown in Table I.
As described in section 2, a key feature of our design is the ability to estimate the impact of
winning the voucher relative to the control group in control villages. The estimation sample
therefore includes the applicants who won the voucher lottery, and applicants whose villages
were not selected (by lottery) to receive the voucher. The estimation sample does not include the
applicants who lost the lottery but were in treatment villages (we use this sample later when
analyzing spillover effects). Test scores are normalized relative to the distribution of the public-
school students in the control villages on each test, since these students represent the "business as
usual" distribution of test scores. Standard errors are clustered at the village level to account for
common shocks to test scores that may occur at the village level.
While we focus our discussion on the ITT estimate, we also present the "average treatment
effect on the treated (ATT)" impact of attending a private school by scaling up the ITT estimate
above by the inverse of the voucher take up rate (defined as the fraction of voucher recipients
who accepted the voucher and stayed in a private school for two and four years respectively).25
These results are presented in Table VI for test scores at the end of two and four years of the
program, with Panel A showing the impact of being awarded a voucher and Panel B showing the
average causal impact of attending a private school for those who accepted the voucher and
24 The default baseline score that we control for is the score on the same subject, but in cases where no baseline test was conducted in the same subject, we control for the mean normalized test score across all subjects for which a baseline test was available (which provides a measure of baseline ability, and increases precision). 25 Instrumental variable (IV) estimates using the voucher (awarded by lottery) as an instrument for attending a private school yield similar estimates of the causal impact of attending a private school. However, there is one further challenge in interpreting this estimate which is the differential attrition rate in our sample between compliers and non-compliers (among voucher recipients). This does not affect the ITT estimates, but necessitates a further set of assumptions to yield unbiased IV estimates. We therefore prefer to present ATT estimates by scaling up the ITT estimates by the inverse of the take up rate, and focus most of our discussion on the ITT estimates. Note that there were no lottery losers who went to private school on their own and stayed there throughout the study, and the take up rate of the voucher is therefore equivalent to the differential take up rate across treatment and control groups. Finally, note that we do present an instrumental variable estimate in Table V (Column 7) on time use because that data is collected continuously every year and the private-school attending status of voucher-winning students changes over this period (from 61% at the start to 51% at the end of the project). Thus, the scale up factor between column 6 and 7 in Table V is slightly lower than that between Panel and Panel B in Table VI.
17
enrolled in a private school for two and four years. Results in Table VI includes the controls
shown in Table I (for greater precision), but are unchanged without the controls.
At the end of two and four years, we find that voucher lottery winners had slightly lower
scores on Telugu and math than lottery losers (not significant – columns 1, 2, 5, and 6), and
higher scores in English (0.19σ after two years, p = 0.02, and 0.12σ after four years, p = 0.098;
columns 3 and 7). The average impact across the three subjects that were assessed at the end of
two years was close to zero (Table VI – column 4). These results suggest that the large cross-
sectional differences in math and Telugu test scores (of 0.65σ) shown in Table II are mostly
driven by omitted variables and not by differential effectiveness of public and private schools.
However, a key determinant of education outcomes by subject is the allocation of
instructional time across different subjects.26 We present data from school time tables in Table
VII, and see that private schools have sharply different patterns of time allocation than public
schools. In particular, they allocate a lot less time per week to Telugu and math, which are the
two main subjects taught in the public schools - accounting for over 500 minutes/week, and
around 28% of total instructional time each. Private schools spend around 200 minutes less on
Telugu and 160 minutes less on math per week (40% and 32% less instructional time
respectively). On the other hand, they spend significantly more time on other subjects such as
English (~90 minutes/week), social studies (~65 minutes/week), science (~100 minutes/week),
Hindi (~215 minutes/week), and computer use (~45 minutes/week). They also spend an
hour/week more on "other" periods which include arts, crafts, sports, and study hall. Overall, we
see that the three subjects that were tested at the end of two years of the program account for
70% of the instruction time in public schools, but for less than 50% of that in the private schools.
Thus, limiting our analysis to these subjects may provide an incomplete picture of the impact
of the voucher. Based on the time table data, we also conducted tests in science/social studies
(EVS) and Hindi after four years of the voucher program.27 While this still does not account for
26 We thank Mark Jacobsen for this comment while discussing the two-year results, which prompted us to collect and analyze school time table data, and test additional subjects at the end of Year 4 based on the time table data. 27 Science and social studies are taught jointly under the subject title of "environmental studies" (EVS). Our EVS tests followed the public school curriculum and were administered in a standard written format. Hindi is not taught in the public schools, and so we could not administer a written test (which would result in more children being coded as scoring zero in Hindi relative to their true level of competence). Enumerators therefore administered individual oral tests to a representative sample of the universe of voucher applicants (which was balanced between treatment and control categories on all observables). The test follows the same format as that administered by the non-profit Pratham in their annual surveys of learning levels implemented across India (ASER 2013) and is therefore comparable with a benchmark measure of competence that has been widely used in India in the recent past.

18
all the subjects (computer use for instance), the tested subjects now account for over 80% of
instructional time in both types of subjects and are also closer to being equal across school types
(81% for private and 85% for public schools). The full set of test score results are presented in
Table VI – columns 5-8, and 10. Voucher-winning students score slightly better in EVS (0.08σ;
p = 0.16), and much better in Hindi (0.55σ, p < 0.001).
Since the test score gains are mainly found in Hindi, and since public schools do not teach
Hindi, we analyze the Hindi results in more detail at the individual question level (by skill) to
better understand what the program impact means in terms of actual ability to use Hindi. We
present these results in Table A.3, and see that attending a private school more than doubles the
probability of students reading letters correctly, and more than triples the probability of being
able to read words, sentences, and paragraphs.
If we weight all subjects equally (as in Kling, Katz, and Liebman 2007) and exclude Hindi
(which is not taught in public schools), the mean test score impact of winning a voucher is not
significantly different from zero (Table VI - column 10). If we include Hindi, we find that
students who won a voucher scored 0.13σ higher, and the average student who accepted the
voucher to attend a private school scored 0.26σ higher (column 12). While views on optimal
weights across subjects (and on whether Hindi should be treated equally with other subjects
given that it is not taught in public schools) may vary, we can still unambiguously infer that
private schools are more productive, because they deliver similar outcomes in Telugu and math
with less instructional time, and use the extra time to improve test scores in Hindi.
4.2 Robustness to attrition
The main threat to the results above is from the differential attrition noted in Table A.2. We
verify that our results are robust to this concern using two different procedures. First, we report
the ITT effects of winning a voucher using inverse probability reweighting to account for the
differential probability of attrition based on observables, and see that doing so barely changes the
estimated effects presented in Table VI – Panel A (Table A.4 - Panel A). Second, we present
conservative confidence intervals using the bounding procedure suggested by Lee (2009), and
find that the overall results are unchanged (Table A.4 - Panel B).
4.3 Spillover Effects
An important concern in the global school choice literature is that positive estimated effects
of vouchers from experimental studies may be overstating the benefits of private schools because

19
these estimates do not account for potential negative spillovers to students in the public schools
who do not apply for the voucher or for potential negative spillovers on the students who start in
the private schools, and who are exposed to lower-scoring peers from public schools as a result
of the voucher program (Hsieh and Urquiola 2006). Our two-stage design allows us to estimate
these spillovers. We calculate three different sets of spillovers as described in section 2.2, and
the estimating equations all take the same form as (1), but the right-hand side variable of interest
is now an indicator for being in a voucher village. The estimation samples comprise the
concerned group for whom we want to estimate the spillovers (lottery losers, non-applicants, and
students attending private schools before the school choice program) from both treatment and
control villages. The village-level lottery ensures that we obtain unbiased reduced form
estimates of these three spillovers.
Table VIII - Panel A compares the within-village control group to the across-village control
group. Note that the former is the traditional control group used in typical experimental studies
of school choice (the lottery losers in the treatment villages) and that this sample has not been
used so far in any of the analysis due to the possibility of spillovers as discussed in section 2.2.
We find no difference whatsoever between the groups, and the combined effects across subjects
are not only insignificant but close to zero.28 Panel B estimates if there were any spillovers on
non-applicants and we again find no significant effects on either individual subjects or on the
aggregate test scores across subjects. Thus, even though the literature has often worried about
the possibility of negative spillovers on students who are "left behind" in public schools in
response to voucher programs, these spillovers were not empirically salient in our setting even
though a large fraction (23%) of public school students moved out to private schools.29
In the Indian context, a greater concern has been the possibility that the Right to Education
Act clause on quotas in private schools would lead to negative spillovers on the students who
start out in the private schools (see Shah 2012 for an example). We estimate these spillovers in
Table VIII - Panel C and find that there are no significant negative spillovers on the students who
were in private schools to begin with. In addition to these average spillover effects on private 28 Our not finding any significant spillovers here suggests that the potential contamination of the "typical" control group (as discussed in section 2.2) in existing voucher studies is likely to be an empirically second-order issue. 29 Of course, the estimated 'non-effect' is a reduced form estimate that combines factors which could potentially hurt the students left behind (loss of motivated peers) as well as those that could help them (smaller class sizes if teacher allocations did not fully adjust to the departure of the voucher students, and potential positive teacher effort response to competition). We do not have enough power to explore these channels with adequate precision, but we do provide the first experimental reduced form estimates of these spillovers.
20
school students in the exposed cohorts, we also estimate the extent of spillovers as a function of
the number of voucher-winning students who join a particular private school.
Since this is endogenous, we first construct a measure of "potential exposure to voucher
students" for each private school (in both treatment and control villages) as the number of
voucher applicants for whom it is the nearest private school. We then construct an instrumental
variable for the number of voucher-winning students who join any given private school by
interacting the "potential exposure" with the (randomly-determined) fraction of these students
who win a voucher. The instrument will take a value of zero for all private schools in control
villages (where no vouchers were awarded), and can vary across private schools in treatment
villages. We present the IV estimates of spillovers on private school students as a function of the
number of voucher students received by the school in Table A.5, and again find no impact on the
test scores of students who started out in private schools.30 While set in India, these results are
consistent with those reported in Angrist and Lang (2004) who similarly find negligible impacts
on white students from the school desegregation conducted under the Boston Metco Program.
Taken together, our results suggest that the (small) test score gains for voucher winners are
not achieved at the cost of negative outcomes for any other group of students who may have
been indirectly affected by the voucher program. Of course, our results do not imply that peer
effects and sorting never matter for evaluations of school choice. But they do suggest more
broadly that while spillovers are an important theoretical concern in the school choice literature,
they do not appear to be empirically first-order in our context, and may not be so for lottery-
based studies of school choice in programs that do not allow private schools to select students.31
30 The instrument is relevant because distance is a strong predictor of primary school choice (first stage F-statistic is over 45 in Table A.5). We present the first stage regression in Table A.6 and see that the instrument strongly predicts the number of voucher students attending any given private school. Further, the village-level randomization (after inviting applications) allows us to define the "potential exposure" variable for every private school in both treatment and control villages. Thus, an alternative approach to using a linear IV for estimating spillovers (as shown in Table A.5) is to restrict our spillover analysis in Table VIII – Panel C to private schools (in treatment and control villages) with higher potential exposure to voucher students. We re-estimate the spillover effects reported in Table VIII –Panel C in samples restricted to the top 50% of private schools (by potential exposure to voucher students) and also the top 25%, and still find no evidence of spillover effects (results available on request). 31 Macleod and Urquiola (2012) develop a model of school choice under different selection regimes and show that many of the potential gains of choice and competition may not materialize in systems where private schools are allowed to select students, while also showing that choice and competition will typically improve outcomes if private schools are not allowed to select their students.

21
4.4 Heterogeneous effects
4.4.1 Heterogeneous effects by student characteristics
We test for heterogeneity of the impact of the voucher program along several student
characteristics including baseline scores, gender, parental literacy, and affluence, using a
standard linear interaction specification of the form:
∙ ∙ ∙ ∙ ∙
∙ (2)
where the parameter of interest is which estimates the extent to which the impact of the
vouchers is different for students with the concerned characteristic.
Table IX (Panel A) reports estimates of over two and four years. The main result is the
lack of any consistent evidence of heterogeneous effects along most student characteristics. In
particular, the baseline score can be treated as a summary statistic of educational inputs that
students had received up to the point when they enter the study, and the lack of any differential
treatment effects by baseline score suggests that the impacts of the program were broad based.32
We also estimate a similar specification to test for heterogeneity among the public school
students who did not apply for the voucher (group 1 in Figure I), and find no evidence of
differential spillover effects on non-applicants (Table IX - Panel B). Overall, we find limited
evidence of student-level heterogeneity for either the main effects or spillovers (this is also true
when we test for heterogeneity non-parametrically as a function of baseline test scores).
4.4.2 Heterogeneous effects by school characteristics
Our experiment was not designed to identify heterogeneous effects by school
characteristics,33 but we report some suggestive results that are likely to be important for future
research designed explicitly to study such heterogeneity. In particular, a key feature of private
school heterogeneity in India is the medium of instruction. All public schools in our sample teach
in Telugu, whereas over half the private schools use English as the medium of instruction. The
high actual and perceived returns to English in India have led to growing demand for English-
32 We do find that Muslim students, who are one of the most educationally disadvantaged groups in India (Sachar et al. 2006), benefited significantly more from receiving a voucher. These results are consistent with those found in the US by Howell and Peterson (2002) who report that educationally-disadvantaged groups gain the most from school choice programs. See the working paper version for details (Muralidharan and Sundararaman 2014). 33 Note that this is true of the experimental school choice literature in general, because even when a voucher is randomly assigned, the school attended is typically not. Indeed, the logic of school "choice" is based to a considerable extent on enabling better student-school matching on unobserved characteristics.

22
medium private schools.34 At the same time, it is possible that switching to being taught in
English may be disruptive to the learning of voucher-winning students (many of whom are first-
generation learners with illiterate parents). Thus, studying heterogeneous impacts of attending
private schools as a function of the medium of instruction is especially important in this context.
Since the choice of school attended (and its medium of instruction) is endogenous, we use the
medium of instruction of the nearest private school to each applicant household, and its
interaction with the receipt of the randomly-assigned voucher as instruments for the medium of
instruction of the private school attended. We define the following variables of interest:
_ _ = Student i attends an English Medium Private School
_ _ = Student i attends a Telugu Medium Private School
_ _ = Nearest Private School to student i teaches in English Medium
_ _ = Nearest Private School to student i teaches in Telugu Medium
and are interested in estimating and in the second-stage equation:
∙ ∙ _ _ ∙ _ _ ∙ (3)
where the endogenous variables are _ _ and _ _ , and the first-stage equations are:
_ _ _ _ ∙ ∙ _ _ ∙ _ _ ∙
∙ _ _ ∙ ∙ _ _ ∙ (4a/4b)
We use (4a) and (4b) to instrument for the two endogenous variables in (3), and present the
two first-stage regressions in Table A.7. The main parameters of interest ( and from the
IV estimation of (3) are presented in Table X – Panel A. A more conservative approach is to use
only the interactions as instruments, and we present the results from this specification in Table X
– Panel B.35 The estimation sample is the same as that in Table VI, and comprises the voucher
lottery winners in the treatment villages, and the lottery losers in the control villages.36
34 Munshi and Rosenzweig (2006), Azam, Chin, and Prakash (2011), Chakraborty and Kapur (2012), and Shastry (2012) all find significant positive labor market returns in India to knowledge of English. Several journalistic accounts and qualitative studies have noted the high perceived returns to English among parents, and the growing demand for English medium schools in India (see Bajaj and Yardley 2011, and Meganathan 2011 for examples). 35 Since the location decisions of English and Telugu medium schools may vary, the most conservative IV strategy is to use only the interactions as instruments (because these are comparing similarly located schools across treatment and control villages – which are chosen randomly). However, as we see in Table A.8, there is no difference in mean baseline scores of voucher applicants as a function of whether their nearest private school is in English or Telugu medium. So, our default specification uses all four instruments (for greater precision) and includes all variables in Table A.8 as controls (Panel A), but we also report results with the more conservative IV strategy (Panel B). 36 However, we have around 7% fewer observations in Table X than in Table VI due to missing household GPS data. The results in Table VI are unchanged when estimated in this truncated sample (available on request).
23
At the end of four years of the voucher program, we find that the causal impact of attending
an English-medium private school varies sharply by subject, with students doing worse (than
staying in the public school) in Telugu, math, and EVS; but much better in English, and Hindi.
The mean impact across subjects is positive (0.22σ) but not significant. On the other hand, the
estimated impact of attending a Telugu-medium private school is positive for every subject, and
the mean impact across subjects is positive (0.53σ) and significant (Table X – Panel A). The IV
estimates in Table X have large standard errors, and are much less precise than the main
estimates in Table VI. Nevertheless, some suggestive patterns emerge in the results.
The first is that the causal impact of attending a Telugu-medium private school (for students
who start out in public schools – which all teach in Telugu medium) on test scores in Telugu,
math, and EVS appears to be greater than that of attending an English-medium private school (p-
value of 0.15, 0.13, and 0.06 respectively). The second is that there appears to be a negative
impact of switching the medium of instruction on the learning of content in non-language
subjects. We see this most clearly in the last column of Table X – Panel A, where we present the
mean treatment effects across math and EVS (which are the two content subjects, while the other
three are language subjects). The difference in mean test scores across medium of instruction is
0.77σ, which is a very large effect (p = 0.07). The third is that private schools appear to be even
more effective than suggested by the estimates in Table VI (a mean treatment effect of 0.53σ
across subjects as opposed to 0.26σ), when their students are not also going through the
disruption of switching their medium of instruction.37
These results are only suggestive, and have several caveats. First, they are highly imprecise.
Using a more conservative IV strategy (reported in Table X – Panel B), we find similar
estimates, but the standard errors are too large for meaningful inference. Second, even with a
precise IV estimate, the medium of instruction will be correlated with other school
characteristics. However, we see that on average, the English-medium schools have superior
indicators of school quality – including facilities; teacher experience, qualifications, and salary;
and annual fees charged per child (Table A.9). Since our main result in Table X is that Telugu-
37 Recall that the point estimates are relative to attending public schools, and the impacts on Telugu and math reflect both the potentially higher private school "productivity effect", and the lower instructional time allocated to these subjects in the private schools. The results on EVS on the other hand reflect both the productivity effect and additional instructional time, and it is therefore not surprising that the estimated effects on EVS are much larger (when the medium of instruction is not disrupted). However, our focus in this table is on the relative impact of Telugu and English medium private schools (and less on the subject-level point estimates relative to public schools).
24
medium private schools appear to be more effective than English-medium ones, the superior
input-based quality indicators of the English-medium schools suggest that the differences shown
in Table X may be a lower bound on the relative advantage of native-language versus English-
medium instruction (for the population of public school students who applied for the voucher).
These results are consistent with the education psychology literature, which suggests that
first-generation learners may be better off being taught in their native language, which can be
reinforced at home (see Abadzi 2006 for a summary). Qualitative interviews by enumerators
with teachers and parents, suggest that one plausible reason for adverse effects of shifting to an
English-medium private school is that these schools use textbooks written in English for teaching
non-language subjects such as math, and EVS, and that reading textbooks in English was much
more difficult for students shifting from public schools.
In the development economics literature, Ramachandran (2012) provides recent evidence
from Ethiopia showing that a switch to mother-tongue instruction for primary school led to a
significant increase in education attainment. Jain (2014) examines historical data from colonial
India and finds that linguistically-mismatched districts (where the official language did not
match the local language) had lower rates of literacy and college graduation results. Our results
are consistent with these findings in aggregate data, and highlight the importance of more well-
identified research to directly estimate the impact of the medium of instruction on test scores.
4.4.3 Heterogeneous effects by market characteristics
The market-level experimental design allows us to test whether students who have greater
choice among schools benefit more from a voucher (Hoxby 2000). We use the distance data
described above to calculate the number of private schools within a one-kilometer radius of each
voucher applicant. Our measure of choice and competition is constructed separately for each
student, and can therefore generate variation at the student-level even for students living in the
same village. We estimate the relationship between the number of schools in an applicant's
choice set and test scores, both parametrically and non-parametrically. For the first, we use a
linear interaction of voucher receipt and the number of schools in the choice set in a specification
similar to (4). For the second, we estimate equation (4) with the "characteristic" being whether
the number of schools a student has in her choice set is in the top 25%, top 10%, or top 5% of the
distribution of the number of schools.

25
These results are presented in Table XI, and we find no significant effect of choice and
competition when estimated with a linear interaction between voucher receipt and the number of
schools in a student's choice set within one kilometer. However, while conducting the study in a
rural sample allows us to study spillovers by randomizing across villages, a limitation is that
around 50% of voucher applicants have only 0 (27%) or 1 (21%) private school within a one-
kilometer radius. Thus, the extent of choice and competition between private schools is quite
limited for many of the voucher applicants.
The non-parametric estimates might therefore be more appropriate in this context, and they
provide some suggestive evidence of the benefits of greater choice and competition, since we
find that voucher winners do significantly better when they have six or more schools within a
one kilometer radius of where they live (Table XI). We find evidence of larger impacts in areas
with more choice and competition in both the two-year and the four-year results, suggesting that
the heterogeneity is likely to be real and does not just reflect sampling variation. Further, we
find similar results when we consider heterogeneous impacts as a function of the number of
private schools in a half-kilometer radius and with the total number of schools in a half or one-
kilometer radius and not just the number of private schools (available on request).
However, these results are suggestive, since they are only significant in markets representing
the top 5% of the distribution of the extent of choice and competition, and the rural setting may
not be the best one to study heterogeneous impacts of school choice as a function of choice and
competition. However, urban India has much greater population and school density. A recent
geo-coded school census in the city of Patna found between 9 and 93 private schools within a
one kilometer radius of every public school, with the median being greater than 50 (Rangaraju et
al. 2012). Our results therefore suggest that the impact of a school voucher program may be
considerably larger in high-density urban settings. This is an important area for future research.
4.5. Cost Effectiveness
The combination of test score results (Table VI) and school time table data (Table VII)
already show that private schools are more productive than public schools because they are able
to produce similar levels of test scores in math and Telugu using substantially less instructional
time and use the extra time to produce higher test scores in other subjects - especially Hindi.
Further, the results in Table X suggest that private schools may be even more productive when
students attending them are not experiencing the disruption of switching their medium of

26
instruction. Finally, it is worth highlighting that the average cost per-student in the private
schools in our sample is less than one-third of the per-student costs in the public schools (Table
III - Panel C) and that the value of the voucher was only around 40% of the per-student costs in
the public schools. Thus, private schools produce (slightly) better academic outcomes at lower
cost and are unambiguously both more productive and cost-effective than public schools in India.
5. Discussion and Conclusion
We present evidence from the first experimental evaluation of the impact of a school choice
program and the first experimental evidence on the relative effectiveness of private and public
schools in a low-income country. Further, the two-stage experimental design also allows us to
estimate spillovers on non-applicants and students in private schools.
Our results on private school productivity suggest that it may be possible to substantially
increase human capital formation in developing countries like India by making more use of
private provision in the delivery of education. The costs of low productivity in public education
delivery may be especially high in low-income settings where low levels of human capital are
likely to be barriers both to economic growth and to the inclusiveness of growth, and where
fiscal constraints limit the total spending on education.
Our results showing no significant spillovers on private-school students from receiving
voucher recipients from public schools suggest that it may be possible to achieve greater levels
of social integration in private schools, as envisaged by the RtE Act, without the efficiency costs
that opponents of integration are concerned about.
Finally, our demonstration of the centrality of accounting for patterns of time use in
evaluating the effectiveness of private schools are perhaps the most general result for the global
literature on school choice. On the one hand, studies of vouchers and school choice that find no
effects on test scores may understate the benefits by not accounting for other subjects that the
private (or elite public) schools may be teaching. On the other hand, studies of charter schools
finding positive effects on test scores may overstate the benefits if charter schools focus more on
scores on high stakes tests and divert instructional time away from other subjects. In the absence
of data on long-term outcomes such as employment and wages, it is important for education
researchers to devise, test, and validate more content-neutral measures of learning that may
enable meaningful comparisons of outcomes across varying instructional programs.

27
The policy implications of our results for education in India are particularly timely, given the
provision in the RtE Act for 25% reservation in private schools for disadvantaged students (with
the government reimbursing private school fees). Our results suggest that this provision is likely
to not only reduce social stratification at limited cost to current students in private schools, but
also likely to increase average productivity in the education sector by increasing the share of
private schooling. This may thus be a rare example of a policy that improves equity, and
efficiency, and does so at a lower cost than the status quo.38
Nevertheless, there are important caveats to the broad implication that greater private sector
participation in education production (supported by public funding, and featuring enhanced
school choice) would improve the productivity of human capital formation. The first caveat is
that the private schools in our sample did not on average improve outcomes in math and Telugu
(though they spent less time and money, and were as a result more productive). In particular,
private schools did not do better on math and Telugu in spite of having a longer school year and
school day, substantially lower pupil-teacher ratios, and higher levels of teacher attendance and
effort. We point to four possible explanations for this result.
First, the total instructional time on math and Telugu was lower in private schools.39 Second,
private schools spend much less per student and hire teachers with lower levels of education,
training, and experience, and pay them much lower salaries. Thus, higher teacher effort in
private schools may be offset by lower teacher knowledge and experience. Third, we find
suggestive evidence that private schools are more effective if students are not also experiencing
a disruption in the medium of instruction (Table X) and thus the lack of an overall impact may
reflect the negative impacts of switching to English-medium schools for those who did so.
Fourth, there is suggestive evidence that a first-order binding constraint in Indian schools (both
public and private) is that the pedagogy mechanically follows the textbook as opposed to the
level of the students, who are typically way behind grade-level competencies (Banerjee and
Duflo 2011; Pritchett and Beatty 2012; Muralidharan 2013). In such a setting, the additional
38 Note that reimbursements to private schools are capped at the per-child spending in public schools. The increased social integration across economic classes may have broader social benefits as well. For instance, Rao (2014) finds evidence in Delhi that exposure to economically disadvantaged students increased pro-social preferences and behavior among privileged children attending private schools. 39 This is true in spite of the longer school year and lower teacher absence. Private schools have 5% more working days in a year (Table III), and 20% higher teacher attendance (Table IV). However, with 32% and 40% less time spent per week on math and Telugu, the total instruction time in these subjects is still only 85% of that of public schools for math and 75% for Telugu.
28
effort of private school teachers in transacting the curriculum may not translate into much
additional learning. To the extent that this last explanation is true, the productivity advantage of
private schools may mainly reflect their ability to pay lower teacher salaries as opposed to
superior effectiveness of instruction.
Thus, while it is plausible that increasing per-child spending in private schools to the same
level as public schools will lead to an increase in learning outcomes (perhaps by enabling the
hiring of better teachers), our results do not imply that increasing the time or money spent on
instruction in these subjects in private schools will lead to improved learning outcomes. For
instance, if the voucher value were to be increased to equal the level of per-student spending in
the public schools, it is possible that the private schools may respond by improving school
characteristics that are more visible to parents and improve their marketing prospects rather than
investing in more effective teaching.
We see an illustration of this issue when we consider the question of why private schools
choose the allocation of instructional time that they do. In particular, students may be better off
if private schools used their higher productivity to spend more time on the native language to
help students reach grade-appropriate reading levels in at least one language, as opposed to low
levels of knowledge in three languages.40 Interviews with head teachers suggest that an important
reason for this is that the low-cost private schools in our setting typically copy the curriculum of
elite private schools, which feature the three-language formula (comprising of the state language,
English, and Hindi) that is typical of the education that elites in India receive. Given the
socially-aspirational nature of private school attendance (see Bajaj and Yardley 2011), the
management of private schools we interviewed stated that it would be difficult for them to
remain competitive if they did not follow the standards of elite private schools (even if this
curriculum was not optimal for the typical student attending a low-cost private school).41
40 The literature on early childhood development in low-income countries suggests that returns to language competence are convex for the first language, because of the importance of being able to "read to learn" in at least one language (Abadzi 2006). The majority of public school students in AP are far behind grade-level competences in Telugu and math (Muralidharan and Zieleniak 2014), and cannot typically read fluently even in Telugu, which is their native language (ASER 2013). Since the mean impact on Telugu scores of going to private schools was zero, it is likely that the absolute level of competence in any language is low for voucher winners. 41 See DiMaggio and Powell 1983 for the classic reference on "isomorphism" between organizations where it is common to copy organizational "form" without delivering on the corresponding "function". Of course, it is also likely that knowledge of an additional language like Hindi (the most widely-spoken Indian language, and the fourth most spoken language in the world with over 500 million speakers) would have positive labor market returns (especially with growing migration of workers across Indian states). But, it is not clear that these returns are higher
29
This discussion points to the second caveat, which is that there may be a trade-off between a
libertarian approach to school choice that believes that parents will make optimal schooling
choices for their children and a paternalistic one that believes that parents (especially poor and
uneducated ones) may make misguided evaluations of school quality based on visible factors that
may not contribute to more effective learning (see Bau 2014 for an illustration). While we find
that private schools are much more productive than public schools from the perspective of a
social planner, it is not obvious that they represent a better value for the marginal parent who is
paying for private schools over a free public school. Since test scores did not improve in math
and Telugu, the marginal parent would have to place a high value on Hindi scores to justify
paying for the typical private school in our sample. While, we cannot rule out this possibility (or
that parents valued other non-academic aspects of private schools), it is also possible that parents
were not able to easily determine the effectiveness of schools at improving learning outcomes,
and it may be important to provide better and easily understandable information on determinants
of education quality to schools and parents (Hastings and Weinstein 2008; Andrabi et al. 2013).
A final caveat is that the social efficiency gains from the greater productivity of private
schools can be negated if the steady state system of allocation of students to schools features
high degrees of selectivity by schools (see Macleod and Urquiola 2012 for a theoretical treatment
of this issue). This insight is already incorporated in the rules that most charter schools in the US
operate under (they cannot be selective in who they accept), but it is important to apply it to the
way that the RtE Act will be implemented.
Our results and discussion point towards several avenues for future research. The first is to
better estimate an education production function relationship between instructional time per
subject and test scores, and on the role of the language of instruction. Second, the analysis in
this paper (and in most of the school choice literature) has focused exclusively on the impacts on
test scores and learning outcomes, and has ignored welfare gains to households from enhanced
choice and match quality. A natural extension for future work therefore is to use our market-level
experiment to estimate a structural model of school choice using revealed preference of program
take up, and estimate the welfare gains to households from introducing new schools into their
than those from increasing competence in the native language to enable better learning of core content subjects. This is an important area for future research.
30
feasible choice set by bringing their price down sharply through vouchers (Bresnahan and
Gordon 1996, Carneiro et al. 2013).
Three further sets of research questions are first order in the Indian context. First, it would
be important to replicate this experiment with the value of the voucher set equal to the per-
student spending in public schools to measure the extent to which the greater productivity of
private schools can translate into better absolute learning outcomes. Second, while we find
suggestive evidence on the positive effects of greater choice and competition, more conclusive
evidence will require running similar experiments in urban India – where the greater population
density allows for much more choice and competition between schools. Third, our estimates are
based on a voucher experiment with two cohorts of students, and do not capture the long-term
dynamic impacts of a school choice system. Doing so would require modeling (and measuring)
school entry and exit, as well as the endogenous price and quality responses of private schools in
response to a steady stream of public funding for students to attend private schools in (Nielson
2013 conducts such an exercise in Chile). Indian states are currently starting to implement the
RtE Act, and there is much fertile ground for future research to better understand education
markets in low-income settings and directly contribute to better education policy.
References:
Abadzi, H. 2006. Efficient Learning for the Poor: Insights from the Frontier of Cognitive Neuroscience. Washington DC: The World Bank.
Abdulkadiroglu, A., J. Angrist, S. M. Dynarski, T. J. Kane, and P. A. Pathak. 2011. Accountability and Flexibility in Public Schools: Evidence from Boston's Charters and Pilots. Quarterly Journal of Economics 126:699-748.
Abdulkadiroglu, A., J. Angrist, and P. A. Pathak. 2014. The Elite Illusion: Achievement Effects at Boston and New York Exam Schools. Econometrica 82 (1):137-196.
Andrabi, T., J. Das, and A. Khwaja. 2012. Report Cards: The Impact of Providing School and Child Test-scores on Educational Markets: Harvard Kennedy School.
Andrabi, T., J. Das, A. Khwaja, and T. Zajonc. 2011. Do Value-Added Estimates Add Value? Accounting for Learning Dynamics. American Economic Journal: Applied Economics 3 (July):29-54.
Angrist, J., E. Bettinger, E. Bloom, E. King, and M. Kremer. 2002. Vouchers for Private Schooling in Colombia: Evidence from a Randomized Natural Experiment. American Economic Review 92 (5):1535-1558.
Angrist, J., E. Bettinger, and M. Kremer. 2006. Long-term Consequences of Secondary School Vouchers: Evidence from Secondary School Records in Colombia. American Economic Review 96 (3):847-862.

31
Angrist, J., and K. Lang. 2004. Does School Integration Generate Peer Effects? Evidence from Boston's Metco Program. American Economic Review 94 (5):1613-1634.
ASER. 2013. Annual Status of Education Report: Aser Centre. Azam, M., A. Chin, and N. Prakash. 2013. The Returns to English Language Skills in India.
Economic Development and Cultural Change. Bajaj, V., and J. Yardley. 2011. Many of India's Poor Turn to Private Schools. The New York
Times, 30 December 2011. Banerjee, A., and E. Duflo. 2011. Poor Economics: MIT Press. Bau, N. 2014. School Competition and Product Differentiation: Harvard University. Baum, D., L. Lewis, O. Lusk-Stover, and H. Patrinos. 2014. What Matters Most for Engaging
the Private Sector in Education: A Framework Paper. Washington DC: World Bank. Bold, T., M. Kimenyi, G. Mwabu, and J. Sandefur. 2011. The High Return to Private Schooling
in a Low-Income Country: Center for Global Development Working Paper 279. Bresnahan, T., and R. Gordon, eds. 1996. The Economics of New Goods: National Bureau of
Economic Research. Carneiro, P., J. Das, and H. Reis. 2013. Parental Valuation of School Attributes in Developing
Countries: Evidence from Pakistan: University College London. Chakraborty, T., and S. Kapur. 2012. English Language Premium in a Globalizing Economy:
Evidence from a Policy Experiment in India: Indian Institute of Technology, Kanpur. Cullen, J. B., B. A. Jacob, and S. Levitt. 2006. The Effect of School Choice on Participants:
Evidence from Randomized Lotteries. Econometrica 74 (5):1191-1230. Das, J., S. Dercon, J. Habyarimana, P. Krishnan, K. Muralidharan, and V. Sundararaman. 2013.
School Inputs, Household Substitution, and Test Scores. American Economic Journal: Applied Economics 5 (2):29-57.
Desai, S., A. Dubey, R. Vanneman, and R. Banerji. 2009. Private Schooling in India: A New Educational Landscape. In India Policy Forum, edited by S. Bery, B. Bosworth and A. Panagariya. New Delhi: Sage.
DiMaggio, P. J., and W. W. Powell. 1983. The Iron Cage Revisited: Institutional Isomorphism and Collective Rationality in Organizational Fields. Americal Sociological Review 48 (2):147-160.
Dobbie, W., and R. G. Fryer. 2011. Are High-Quality Schools Enough to Increase Achievement Among the Poor? Evidence from the Harlem Children's Zone. American Economic Journal: Applied Economics 3 (3):158-187.
Dongre, A. 2012. What is the Per Child Expenditure in Government Schools? In Accountability Initiative. New Delhi.
French, R. J., and G. Kingdon. 2010. The relative effectiveness of private and government schools in Rural India: Evidence from ASER data. London: Institute of Education.
Friedman, M. 1962. Capitalism and Freedom. Chicago: University of Chicago Press. Goyal, S., and P. Pandey. 2009. How do Government and Private Schools Differ? Findings from
two large Indian states: World Bank. Hastings, J. S., and J. M. Weinstein. 2008. Information, School Choice, and Academic
Achievement: Evidence from Two Experiments. Quarterly Journal of Economics. Howell, W. G., and P. E. Peterson. 2002. The Education Gap: Vouchers and Urban Schools.
Washington DC: Brookings Institution.
32
Howell, W. G., P. J. Wolf, D. E. Campbell, and P. E. Peterson. 2002. School vouchers and academic performance: results from three randomized field trials. Journal of Policy Analysis and Management 21 (2):191-217.
Hoxby, C. 2000. Does Competition Among Public Schools Benefit Students and Taxpayers? American Economic Review 90 (5):1209-1238.
Hoxby, C., S. Murarka, and J. Kang. 2009. How New York City's Charter Schools Affect Achievement.
Hsieh, C.-T., and M. Urquiola. 2006. The effects of generalized school choice on achievement and stratification: Evidence from Chile's school voucher program. Journal of Public Economics 90 (1477-1503).
Jain, T. 2014. Common Tongue: The Impact of Language on Educational Outcomes: Indian School of Business.
Kelkar, V. January 16, 2006. Let Every Parent be a Consumer. India Today, January 16, 2006. Kling, J. R., J. B. Liebman, and L. F. Katz. 2007. Experimental Analysis of Neighborhood
Effects. Econometrica 75 (1):83-119. Kremer, M., K. Muralidharan, N. Chaudhury, F. H. Rogers, and J. Hammer. 2005. Teacher
Absence in India: A Snapshot. Journal of the European Economic Association 3 (2-3):658-667.
Lee, D. 2009. Training, Wages, and Sample Selection: Estimating Sharp Bounds on Treatment Effects. Review of Economic Studies 76 (3):1071-1102.
Lucas, A. M., and I. Mbiti. 2014. Effects of School Quality on Student Achievement: Discontinuity Evidence from Kenya. American Economic Journal: Applied Economics 6 (3):234-263.
Macleod, B. W., and M. Urquiola. 2012. Anti-Lemons: School Reputation, Relative Diversity, and Educational Quality: IZA Discussion Paper No. 6805.
Meganathan, R. 2011. Language Policy in education and the role of English in India: From library language to language of empowerment. In Dreams and Realities: Developing Countries and the English Language, edited by H. Coleman. London: British Council.
Munshi, K., and M. R. Rosenzweig. 2006. Traditional Institutions Meet the Modern World: Caste, Gender, and Schooling Choice in a Globalizing Economy. American Economic Review 96 (4):1225-1252.
Muralidharan, K. 2013. Priorities for Primary Education Policy in India’s 12th Five-year Plan. India Policy Forum 9:1-46.
Muralidharan, K., J. Das, A. Holla, and A. Mohpal. 2014. The Fiscal Costs of Weak Governance: Evidence from Teacher Absence in India. NBER Working Paper 20299.
Muralidharan, K., and M. Kremer. 2008. Public and Private Schools in Rural India. In School Choice International, edited by P. Peterson and R. Chakrabarti. Cambridge: MIT.
Muralidharan, K., and V. Sundararaman. 2010. The Impact of Diagnostic Feedback to Teachers on Student Learning: Experimental Evidence from India. Economic Journal 120 (546):F187-F203.
———. 2011. Teacher Performance Pay: Experimental Evidence from India. Journal of Political Economy 119 (1):39-77.
———. 2013. Contract Teachers: Experimental Evidence from India: NBER Working Paper 19440.
———. 2014. The Aggregate Effects of School Choice: Evidence from a Two-Stage Experiment: NBER Working Paper 19441.

33
Muralidharan, K., and Y. Zieleniak. 2014. Chasing the Syllabus: Meauring Learning Trajectories in Developing Countries with Longitudinal Data and Item Response Theory: UC San Diego.
Nielson, C. 2013. Targeted Vouchers, Competition Among Schools, and the Academic Achievement of Poor Students: Yale.
Pop-Eleches, C., and M. Urquiola. 2013. Going to a Better School: Effects and Behavioral Responses. American Economic Review 103 (4):1289-1324.
Pritchett, L., and A. Beatty. 2012. The negative consequences of over-ambitious curricular in developing countries: Harvard Kennedy School.
Rangaraju, B., J. Tooley, and P. Dixon. 2012. The Private School Revolution in Bihar: Findings from a Survey in Patna Urban.
Rao, G. 2014. Familiarity Does Not Breed Contempt: Diversity, Discrimination, and Generosity in Delhi Schools: Harvard.
Rouse, C. E., and L. Barrow. 2009. School Vouchers and Student Achievement: Recent Evidence and Remaining Questions. Annual Review of Economics 1:17-42.
Sachar, R., R. Basant, S. Hamid, A. Majeed, T. K. Oomen, and A. Shariff. 2006. Social, Economic, and Educational Status of the Muslim Community in India. New Delhi: Government of India.
Shah, G. R. 2012. India Opens a Door to Private Education. The New York Times, 19 August 2012.
Shah, P. 2005. Equity in Education. Business Standard, July 13, 2005. Shastry, K. 2012. Human Capital Response to Globalization: Education and Information
Technology in India. Journal of Human Resources 47 (2):287-330. Singh, A. 2014. The Private School Premium: Size and sources of the private school advantage
in test scores in India: Oxford. Srinivasa, M. N. 1962. Caste in Modern India and Other Essays: Asia Publishing House. Srivastava, P. 2013. Low-fee Private Schooling: aggravating equity or mitigating disadvantage:
Symposium Books. Srivastava, P., and G. Walford, eds. 2007. Private Schooling in Less Economically Developed
Countries: Asian and African Perspectives Oxford Studies in Comparative Education. Tabarrok, A. 2013. Private Education in India: A Novel Test of Cream Skimming.
Contemporary Economic Policy 31 (1):1-12. Tooley, J. 2009. The Beautiful Tree: A Personal Journey into How the World’s Poorest People
are Educating Themselves. New Delhi: Penguin. Tooley, J., and P. Dixon. 2007. Private Education for Low-Income Families: Results from a
Global Reseach Project. In Private Schooling in Less Economically Developed Countries: Asian and African Perspectives, edited by P. Srivastava and G. Walford: Oxford Studies in Comparative Education.
Wolf, P. J., B. Kisida, B. Gutmann, M. Puma, N. Eissa, and L. Rizzo. 2013. School Vouchers and Student Outcomes: Experimental Evidence from Washington, DC. Journal of Policy Analysis and Management 32 (2):246-270.
Zhang, H. 2014. The Mirage of Elite Schools: Evidence from Lottery-based School Admissions in China: Chinese University of Hong Kong.

Figure I: Design of AP School Choice Program
Panel A: Treatment Villages
Non
Panel B: Control Villages
Non
Figure II: Design of AP School Choice Program with Student Counts
Treatment Villages
Non
Control Villages
Non
Notes: All of groups 2T, 3T, and 2C were sampled for tests of learning outcomes after two and four years of the project. For other groups, numbers in parentheses are the sample size that was tracked (with the total population in brackets). The two numbers under group 3BT represent those who first accepted and started in a private school (1210) and those who were still in a private school at the end of 4 years (1,005). Conversely in group 3AT, 770 initially rejected the offer, while 975 were no longer availing the voucher at the end of 4 year
Group 2C
Applicants in Public Schools NOT awarded a
Voucher
[3,336]
Group 4C
Non‐voucher Students
in Private Schools
(1,106), [12,061]
Group 1C
Non‐Applicants in
Public Schools
(811), [2,337]
Group 1T
Non‐Applicants in
Public Schools
(743), [2,165]
Group 2T
Applicants in
Public
Schools NOT
awarded a
Voucher
[1,117]
Group 4T
Non‐voucher Students
in Private Schools
(1,152), [12,720]
Group T
Applicants in
Public
Schools
AWARDED
but DID NOT
ACCEPT a
Voucher
[770; 975]
Group T
Applicants in
Public
Schools
AWARDED
and
ACCEPTED a
Voucher
[1,210; 1,005]
Group 1T
Non‐Applicants in
Public Schools
Group 2T
Applicants in Public
Schools NOT awarded
a Voucher
Group 4T
Non‐voucher Students
in Private Schools
Group 3T
Applicants in Public
Schools AWARDED a
Voucher
Group 1C
Non‐Applicants in
Public Schools
Group 2C
Applicants in Public
Schools NOT awarded
a Voucher
Group 4C
Non‐voucher Students
in Private Schools
Group 3C
Does not exist
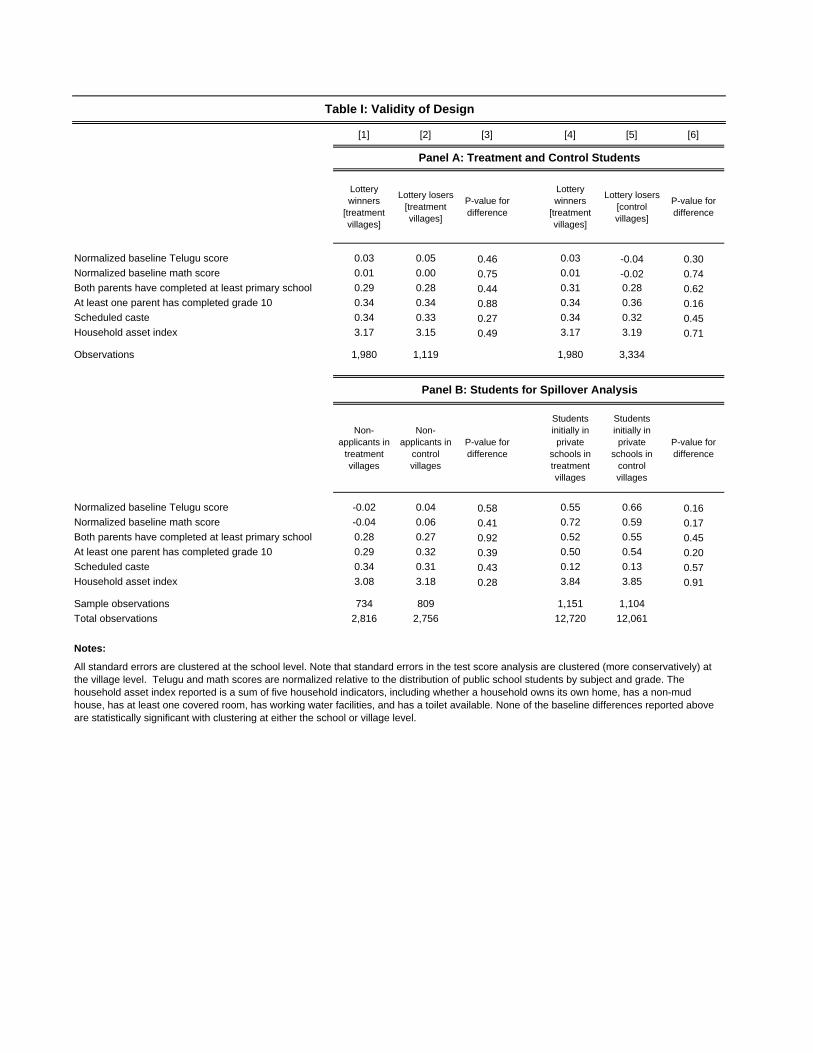
[1] [2] [3] [4] [5] [6]
Lottery winners
[treatment villages]
Lottery losers [treatment villages]
P-value for difference
Lottery winners
[treatment villages]
Lottery losers [control villages]
P-value for difference
Normalized baseline Telugu score 0.03 0.05 0.46 0.03 -0.04 0.30Normalized baseline math score 0.01 0.00 0.75 0.01 -0.02 0.74Both parents have completed at least primary school 0.29 0.28 0.44 0.31 0.28 0.62At least one parent has completed grade 10 0.34 0.34 0.88 0.34 0.36 0.16Scheduled caste 0.34 0.33 0.27 0.34 0.32 0.45Household asset index 3.17 3.15 0.49 3.17 3.19 0.71
Observations 1,980 1,119 1,980 3,334
Non-applicants in
treatment villages
Non-applicants in
control villages
P-value for difference
Students initially in private
schools in treatment villages
Students initially in private
schools in control villages
P-value for difference
Normalized baseline Telugu score -0.02 0.04 0.58 0.55 0.66 0.16Normalized baseline math score -0.04 0.06 0.41 0.72 0.59 0.17Both parents have completed at least primary school 0.28 0.27 0.92 0.52 0.55 0.45At least one parent has completed grade 10 0.29 0.32 0.39 0.50 0.54 0.20Scheduled caste 0.34 0.31 0.43 0.12 0.13 0.57Household asset index 3.08 3.18 0.28 3.84 3.85 0.91
Table I: Validity of Design
Panel A: Treatment and Control Students
Panel B: Students for Spillover Analysis
Sample observations 734 809 1,151 1,104
Total observations 2,816 2,756 12,720 12,061
Notes:
All standard errors are clustered at the school level. Note that standard errors in the test score analysis are clustered (more conservatively) at the village level. Telugu and math scores are normalized relative to the distribution of public school students by subject and grade. The household asset index reported is a sum of five household indicators, including whether a household owns its own home, has a non-mud house, has at least one covered room, has working water facilities, and has a toilet available. None of the baseline differences reported above are statistically significant with clustering at either the school or village level.
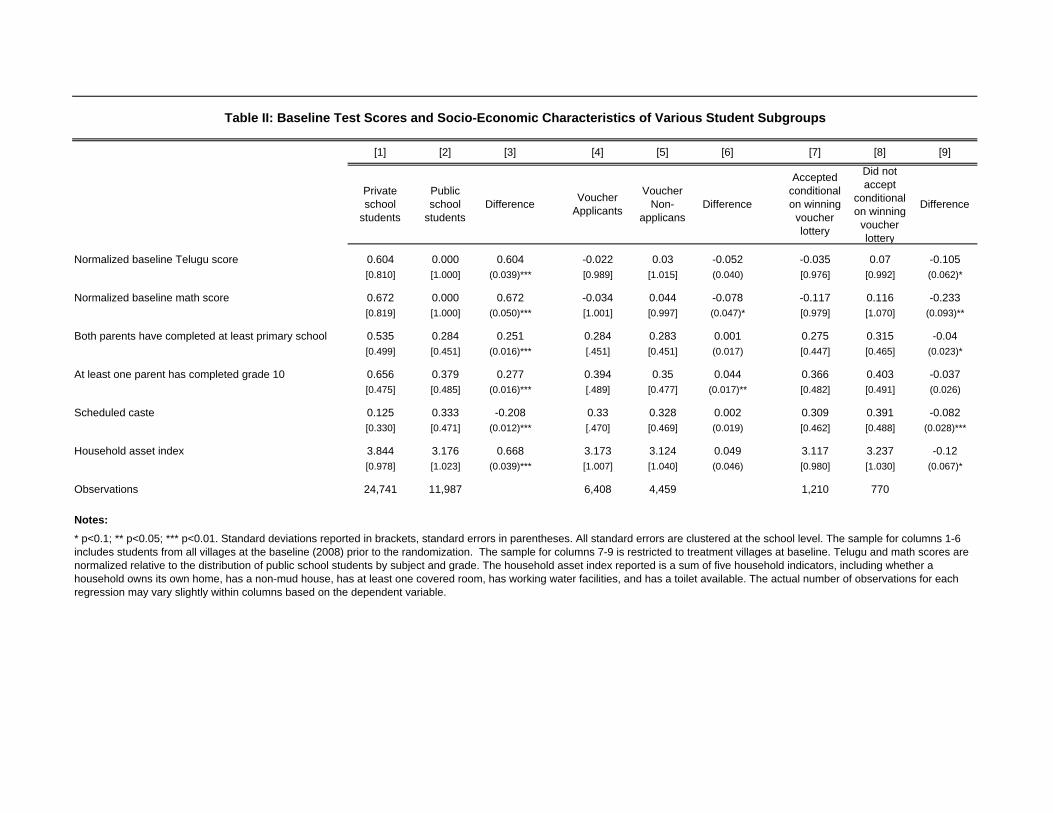
[1] [2] [3] [4] [5] [6] [7] [8] [9]
Private school
students
Public school
studentsDifference
Voucher Applicants
Voucher Non-
applicansDifference
Accepted conditional on winning
voucher lottery
Did not accept
conditional on winning
voucher lottery
Difference
Normalized baseline Telugu score 0.604 0.000 0.604 -0.022 0.03 -0.052 -0.035 0.07 -0.105[0.810] [1.000] (0.039)*** [0.989] [1.015] (0.040) [0.976] [0.992] (0.062)*
Normalized baseline math score 0.672 0.000 0.672 -0.034 0.044 -0.078 -0.117 0.116 -0.233[0.819] [1.000] (0.050)*** [1.001] [0.997] (0.047)* [0.979] [1.070] (0.093)**
Both parents have completed at least primary school 0.535 0.284 0.251 0.284 0.283 0.001 0.275 0.315 -0.04[0.499] [0.451] (0.016)*** [.451] [0.451] (0.017) [0.447] [0.465] (0.023)*
At least one parent has completed grade 10 0.656 0.379 0.277 0.394 0.35 0.044 0.366 0.403 -0.037[0.475] [0.485] (0.016)*** [.489] [0.477] (0.017)** [0.482] [0.491] (0.026)
Scheduled caste 0.125 0.333 -0.208 0.33 0.328 0.002 0.309 0.391 -0.082[0.330] [0.471] (0.012)*** [.470] [0.469] (0.019) [0.462] [0.488] (0.028)***
Household asset index 3.844 3.176 0.668 3.173 3.124 0.049 3.117 3.237 -0.12[0.978] [1.023] (0.039)*** [1.007] [1.040] (0.046) [0.980] [1.030] (0.067)*
Table II: Baseline Test Scores and Socio-Economic Characteristics of Various Student Subgroups
Observations 24,741 11,987 6,408 4,459 1,210 770
Notes:
* p<0.1; ** p<0.05; *** p<0.01. Standard deviations reported in brackets, standard errors in parentheses. All standard errors are clustered at the school level. The sample for columns 1-6 includes students from all villages at the baseline (2008) prior to the randomization. The sample for columns 7-9 is restricted to treatment villages at baseline. Telugu and math scores are normalized relative to the distribution of public school students by subject and grade. The household asset index reported is a sum of five household indicators, including whether a household owns its own home, has a non-mud house, has at least one covered room, has working water facilities, and has a toilet available. The actual number of observations for each regression may vary slightly within columns based on the dependent variable.
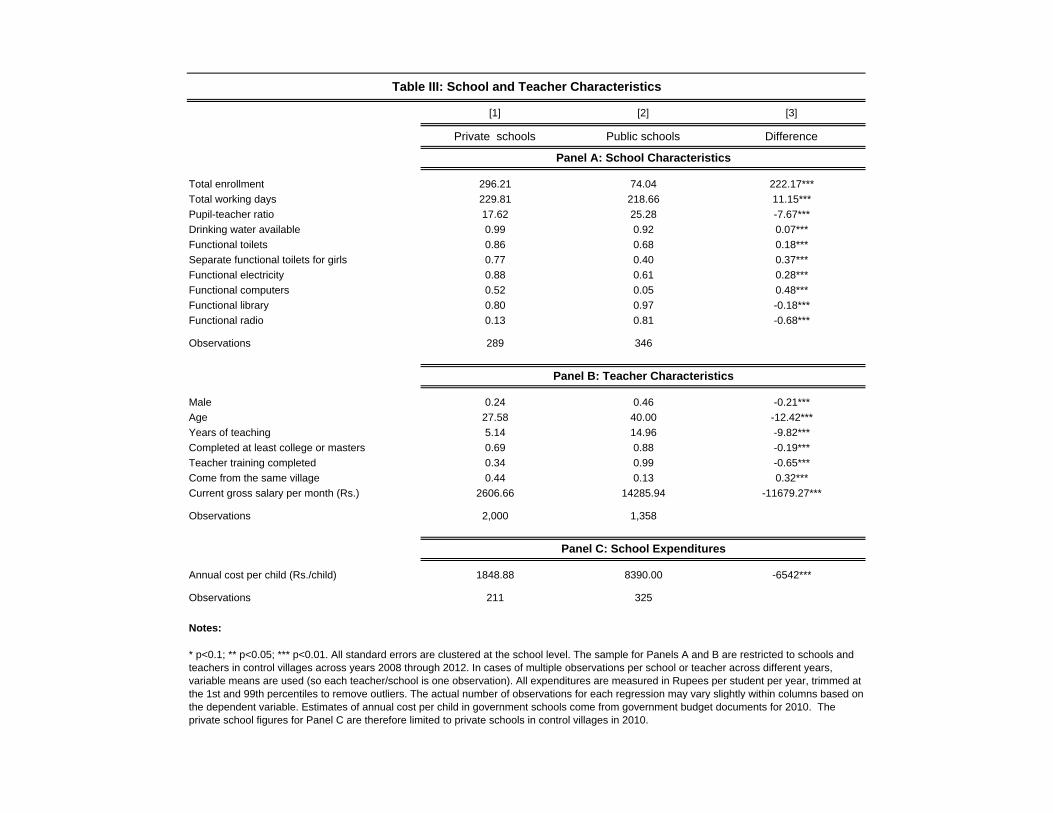
[1] [2] [3]
Private schools Public schools Difference
Total enrollment 296.21 74.04 222.17***
Total working days 229.81 218.66 11.15***
Pupil-teacher ratio 17.62 25.28 -7.67***
Drinking water available 0.99 0.92 0.07***
Functional toilets 0.86 0.68 0.18***
Separate functional toilets for girls 0.77 0.40 0.37***
Functional electricity 0.88 0.61 0.28***
Functional computers 0.52 0.05 0.48***
Functional library 0.80 0.97 -0.18***
Functional radio 0.13 0.81 -0.68***
Observations 289 346
Male 0.24 0.46 -0.21***
Age 27.58 40.00 -12.42***
Years of teaching 5.14 14.96 -9.82***
Completed at least college or masters 0.69 0.88 -0.19***
Teacher training completed 0.34 0.99 -0.65***
Come from the same village 0.44 0.13 0.32***
Current gross salary per month (Rs.) 2606.66 14285.94 -11679.27***
Observations 2,000 1,358
Annual cost per child (Rs./child) 1848.88 8390.00 -6542***
Observations 211 325
Notes:
Table III: School and Teacher Characteristics
Panel A: School Characteristics
Panel B: Teacher Characteristics
Panel C: School Expenditures
* p<0.1; ** p<0.05; *** p<0.01. All standard errors are clustered at the school level. The sample for Panels A and B are restricted to schools and teachers in control villages across years 2008 through 2012. In cases of multiple observations per school or teacher across different years, variable means are used (so each teacher/school is one observation). All expenditures are measured in Rupees per student per year, trimmed at the 1st and 99th percentiles to remove outliers. The actual number of observations for each regression may vary slightly within columns based on the dependent variable. Estimates of annual cost per child in government schools come from government budget documents for 2010. The private school figures for Panel C are therefore limited to private schools in control villages in 2010.
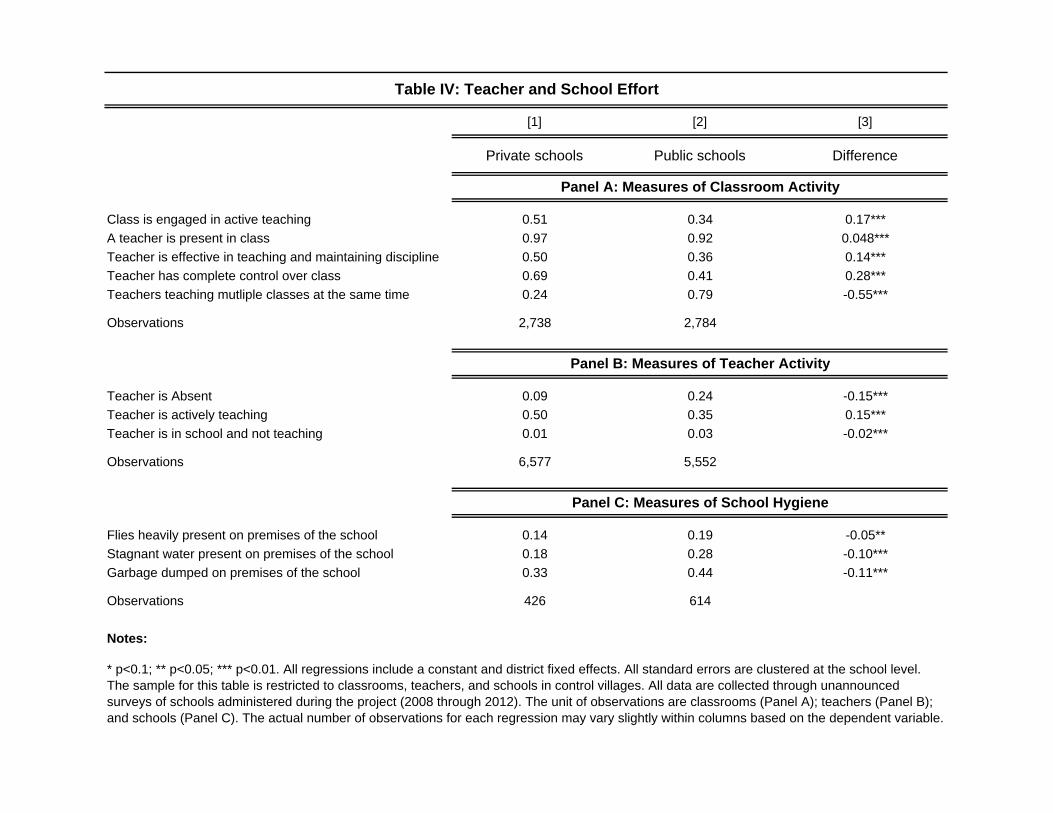
[1] [2] [3]
Private schools Public schools Difference
Class is engaged in active teaching 0.51 0.34 0.17***
A teacher is present in class 0.97 0.92 0.048***
Teacher is effective in teaching and maintaining discipline 0.50 0.36 0.14***
Teacher has complete control over class 0.69 0.41 0.28***
Teachers teaching mutliple classes at the same time 0.24 0.79 -0.55***
Observations 2,738 2,784
Teacher is Absent 0.09 0.24 -0.15***
Teacher is actively teaching 0.50 0.35 0.15***
Teacher is in school and not teaching 0.01 0.03 -0.02***
Observations 6,577 5,552
Flies heavily present on premises of the school 0.14 0.19 -0.05**
Stagnant water present on premises of the school 0.18 0.28 -0.10***
Garbage dumped on premises of the school 0.33 0.44 -0.11***
Observations 426 614
Notes:
Table IV: Teacher and School Effort
Panel A: Measures of Classroom Activity
Panel B: Measures of Teacher Activity
* p<0.1; ** p<0.05; *** p<0.01. All regressions include a constant and district fixed effects. All standard errors are clustered at the school level. The sample for this table is restricted to classrooms, teachers, and schools in control villages. All data are collected through unannounced surveys of schools administered during the project (2008 through 2012). The unit of observations are classrooms (Panel A); teachers (Panel B); and schools (Panel C). The actual number of observations for each regression may vary slightly within columns based on the dependent variable.
Panel C: Measures of School Hygiene

[1] [2] [3] [4] [5] [6] [7]
Private schools Public schools DifferenceApplicants
offered voucher
Applicants in control villages
Intention to treat estimate
Treatment on the treated estimate
Activity:
Time spent in school 423.53 380.25 43.28*** 409.34 383.38 25.96*** 46.93***
Studying and doing homework at home 75.99 52.72 23.27*** 59.83 56.86 2.97 5.38
Private tuition 25.15 16.62 8.53*** 21.95 17.43 4.52 8.17
Bathing/toilet/getting ready 55.11 61.7 -6.59*** 57.82 61.24 -3.42 -6.19
Time traveling to school 23.5 20.92 2.58 23.51 21.43 2.08 3.75
Working (outside/inside the house) 1.51 11.05 -9.54*** 5.46 9.36 -3.90* -7.14*
Chores 16.82 31.18 -14.36*** 21.62 34.45 -12.84*** -23.51***
Watching TV 75.88 83.38 -7.50** 80.57 84.04 -3.47 -6.28
Playing with friends 82.34 101.99 -19.65*** 100.88 99.73 1.15 2.08
Eating 43.57 44.69 -1.12 43.78 44.12 -0.34 -0.61
Free time 53.38 64.38 -11.00*** 56.69 62.13 -5.44 -9.96
Observations 652 1839 885 1212 2097
Household expenditure on student:
School admissions 140.58 14.95 125.63*** 34.35 31.23 3.12 5.76
Uniforms 416.68 200.41 216.27*** 171.14 237.07 -65.94*** -121.77***
Notebooks/textbooks 554.46 228.57 325.89*** 209.05 278.35 -69.29*** -127.40***
Special events 15.91 7.29 8.62*** 5.30 9.04 -3.74* -6.93*
Transportation 113.61 13.59 100.02*** 46.55 43.57 2.99 5.51
Private tuition 71.07 32.51 38.56*** 34.80 39.55 -4.75 -8.75
Total expenditure 2910.36 566.73 2343.64*** 774.94 892.69 -117.75 -215.95
Observations 634 1815 858 1182 2040
Notes:
Panel A: Student Time Use Diaries (Minutes per Day)
* p<0.1; ** p<0.05; *** p<0.01. All regressions include a constant and district fixed effects. All standard errors are clustered at the village level. In all columns in Panels A, the sample is based on student time-use diaries from a normal, non-sick school day. The sample for columns [1] through [3] is restricted to students and schools in control villages. The samples for columns [4] through [7] is applicants offered vouchers in treatment villages and applicants not offered vouchers in control villages. Data for both panels come from the household surveys administered between 2008 and 2012. The chores activity consists of preparing meals, caring for other children, and caring for the elderly. Total expenditure includes the categories listed and all other school-related expenditures. The actual number of observations for each regression may vary slightly within columns based on the dependent variable.
Table V: Household Inputs
Panel B: Household Student Expenditure (Rupees per Year)

[1] [2] [3] [4] [5] [6] [7] [8] [9] [10] [11]
Telugu score
Math scoreEnglish score
Combined across tests
Telugu score
Math scoreEnglish score
Science and social studies (EVS) score
Combined across tests
excluding Hindi
Hindi scoreCombined
across tests
Offered voucher -0.079 -0.053 0.185** 0.016 -0.017 -0.031 0.116* 0.083 0.036 0.545*** 0.133***
(0.055) (0.065) (0.079) (0.061) (0.051) (0.052) (0.070) (0.060) (0.048) (0.068) (0.045)
Total observations 4,620 4,620 4,525 13,765 4,385 4,385 4,217 4,243 17,230 1,696 18,926
Treatment observations 1,778 1,778 1,738 5,294 1,674 1,675 1,607 1,628 6,584 867 7,451
Control observations 2,842 2,842 2,787 8,471 2,711 2,710 2,610 2,615 10,646 829 11,475
Voucher recipient in private school -0.156 -0.104 0.364** 0.032 -0.033 -0.061 0.229* 0.164 0.071 1.074*** 0.262***
(0.108) (0.128) (0.156) (0.120) (0.100) (0.102) (0.138) (0.118) (0.095) (0.134) (0.089)
Total observations 4,620 4,620 4,525 13,765 4,385 4,385 4,217 4,243 17,230 1,696 18,926
Voucher recipients 997 997 982 5,294 945 946 911 920 6,584 510 7,451
Non-recipients 3,623 3,623 3,543 8,471 3,440 3,439 3,306 3,323 10,646 1,186 11,475
Notes:
Table VI: Test Score Impacts
Panel A: Impact of Winning a Voucher ("Intention to Treat" Effects)
Panel B: "Average Treatment on the Treated (ATT)" Effect of Attending a Private School (Scaling up "Intention to Treat" Effect by Inverse of Voucher Take-up Rate)
* p<0.1; ** p<0.05; *** p<0.01. All regressions control for baseline normalized test scores and include a constant and district fixed effects. All standard errors are clustered at the village level. All test scores are normalized relative to the distribution of public school students in control villages by subject and grade. Telugu, math, English and EVS (science and social studies) test scores are from written end of year tests; Hindi test scores are from an individual assessment administered to a representative sample of students. Combined scores are obtained by running a pooled regression across all test scores in each year, with Hindi test score observations weighted up by the inverse of the sampling probability of a student being selected to take the test from the universe of students. Controls include indicators for both parents having completed at least primary school, at least one parent having completed grade 10, and the household being a scheduled caste, as well as the household asset index defined in Table I. Students with a missing value on any control have all controls coded as "0" and an additional dummy is included in all regressions indicating these students to ensure that no observations are lost due to missing data on any individual control. Results are unchanged without controlling for these socioeconomic variables. The only result whose significance changes without socioeconomic controls (that improve precision) is the 4-year impact on English that moves from a p-value of 0.098 (with controls) to a p-value of 0.113 (without controls). Panel B reports coefficients and standard errors from Panel A scaled up by the inverse of the year 2 and year 4 voucher take-up rate of 1005/1980 (51%).
Year 2 Assessments Year 4 Assessments

[1] [2] [3]
Private schools Public schools Difference
Telugu 307.72 511.52 -203.81***
(6.36) (3.60) (6.99)
Math 339.75 500.69 -160.94***
(7.50) (3.36) (8.63)
English 322.68 235.52 87.17***
(7.96) (5.39) (9.69)
Social studies 239.21 173.24 65.96***
(6.29) (6.89) (9.84)
Science 205.52 104.58 100.94***
(9.09) (5.78) (9.44)
Hindi 215.78 0.01 215.77***
(6.08) (0.89) (6.41)
Moral science 16.85 20.11 -3.26
(4.82) (3.20) (5.56)
Computer use 46.7 0.51 46.19***
(6.50) (1.02) (6.80)
Other 311.66 250.29 61.37***
(14.55) (6.70) (16.20)
Total instructional time 2005.87 1796.47 209.4***
(13.73) (6.86) (14.46)
Break 461 473.18 -12.18
(9.14) (3.05) (10.58)
Total school time 2466.87 2269.65 197.22***
(17.46) (8.25) (19.79)
Observations 325 200
Notes:
Table VII: School Time Use - Instructional Time by Subject (Minutes per Week)
* p<0.1; ** p<0.05; *** p<0.01. All regressions include a constant and district fixed effects. All standard errors are clustered at the village level. The sample for this table is restricted to schools in control villages. All numbers are in minutes per week. "Other" includes sports/PE, arts and crafts, and study hall.
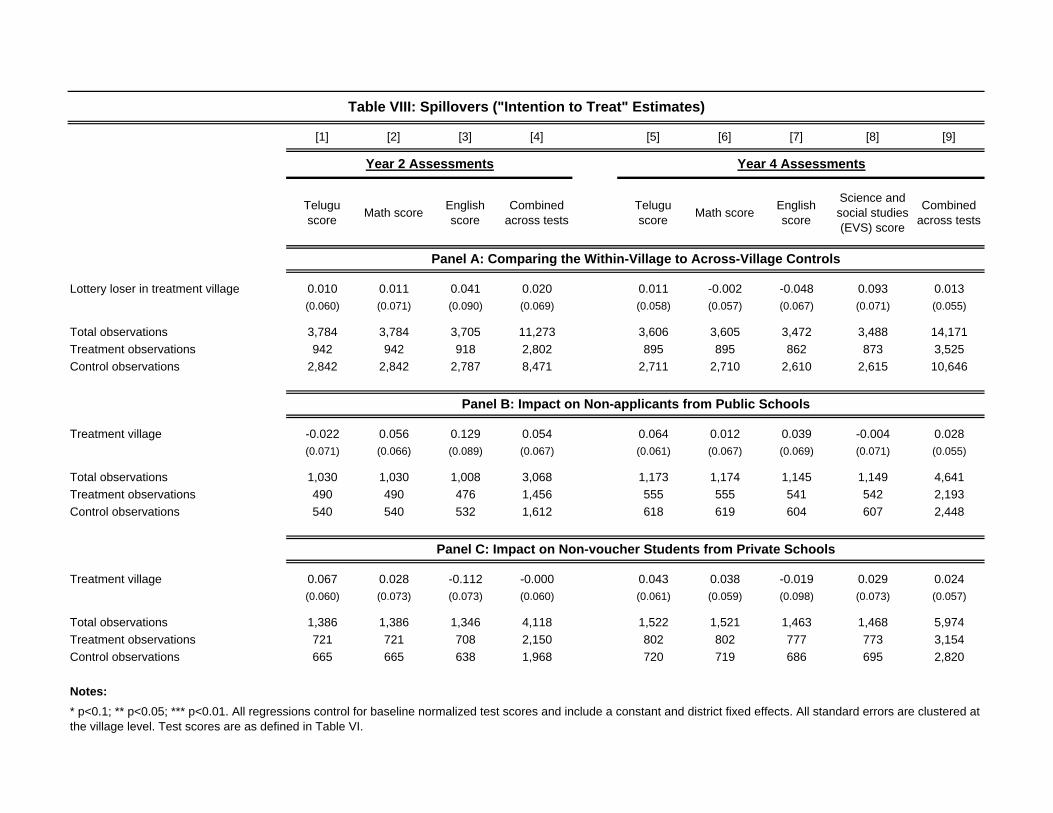
[1] [2] [3] [4] [5] [6] [7] [8] [9]
Telugu score
Math scoreEnglish score
Combined across tests
Telugu score
Math scoreEnglish score
Science and social studies (EVS) score
Combined across tests
Lottery loser in treatment village 0.010 0.011 0.041 0.020 0.011 -0.002 -0.048 0.093 0.013
(0.060) (0.071) (0.090) (0.069) (0.058) (0.057) (0.067) (0.071) (0.055)
Total observations 3,784 3,784 3,705 11,273 3,606 3,605 3,472 3,488 14,171
Treatment observations 942 942 918 2,802 895 895 862 873 3,525
Control observations 2,842 2,842 2,787 8,471 2,711 2,710 2,610 2,615 10,646
Treatment village -0.022 0.056 0.129 0.054 0.064 0.012 0.039 -0.004 0.028
(0.071) (0.066) (0.089) (0.067) (0.061) (0.067) (0.069) (0.071) (0.055)
Total observations 1,030 1,030 1,008 3,068 1,173 1,174 1,145 1,149 4,641
Treatment observations 490 490 476 1,456 555 555 541 542 2,193
Control observations 540 540 532 1,612 618 619 604 607 2,448
Treatment village 0.067 0.028 -0.112 -0.000 0.043 0.038 -0.019 0.029 0.024
(0.060) (0.073) (0.073) (0.060) (0.061) (0.059) (0.098) (0.073) (0.057)
Total observations 1,386 1,386 1,346 4,118 1,522 1,521 1,463 1,468 5,974
Treatment observations 721 721 708 2,150 802 802 777 773 3,154
Control observations 665 665 638 1,968 720 719 686 695 2,820
Notes:
* p<0.1; ** p<0.05; *** p<0.01. All regressions control for baseline normalized test scores and include a constant and district fixed effects. All standard errors are clustered at the village level. Test scores are as defined in Table VI.
Table VIII: Spillovers ("Intention to Treat" Estimates)
Year 2 Assessments Year 4 Assessments
Panel A: Comparing the Within-Village to Across-Village Controls
Panel B: Impact on Non-applicants from Public Schools
Panel C: Impact on Non-voucher Students from Private Schools
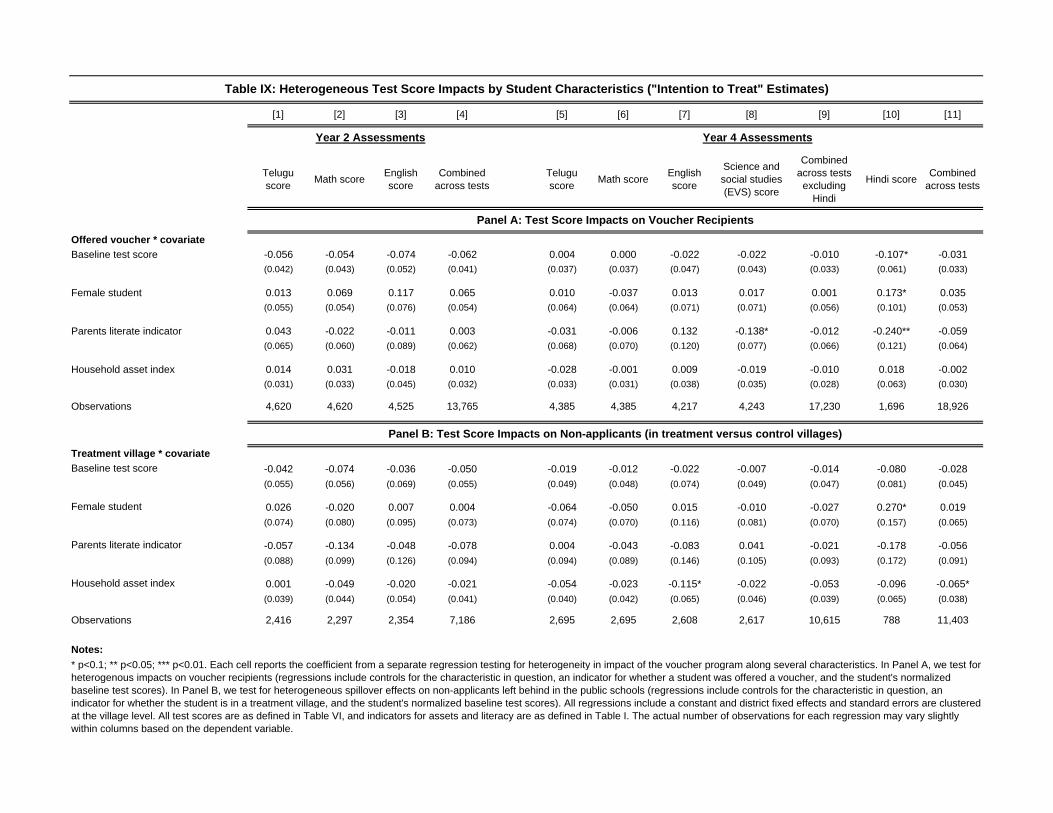
[1] [2] [3] [4] [5] [6] [7] [8] [9] [10] [11]
Telugu score
Math scoreEnglish score
Combined across tests
Telugu score
Math scoreEnglish score
Science and social studies (EVS) score
Combined across tests
excluding Hindi
Hindi scoreCombined
across tests
Offered voucher * covariate
Baseline test score -0.056 -0.054 -0.074 -0.062 0.004 0.000 -0.022 -0.022 -0.010 -0.107* -0.031
(0.042) (0.043) (0.052) (0.041) (0.037) (0.037) (0.047) (0.043) (0.033) (0.061) (0.033)
Female student 0.013 0.069 0.117 0.065 0.010 -0.037 0.013 0.017 0.001 0.173* 0.035
(0.055) (0.054) (0.076) (0.054) (0.064) (0.064) (0.071) (0.071) (0.056) (0.101) (0.053)
Parents literate indicator 0.043 -0.022 -0.011 0.003 -0.031 -0.006 0.132 -0.138* -0.012 -0.240** -0.059
(0.065) (0.060) (0.089) (0.062) (0.068) (0.070) (0.120) (0.077) (0.066) (0.121) (0.064)
Household asset index 0.014 0.031 -0.018 0.010 -0.028 -0.001 0.009 -0.019 -0.010 0.018 -0.002
(0.031) (0.033) (0.045) (0.032) (0.033) (0.031) (0.038) (0.035) (0.028) (0.063) (0.030)
Observations 4,620 4,620 4,525 13,765 4,385 4,385 4,217 4,243 17,230 1,696 18,926
Treatment village * covariate
Baseline test score -0.042 -0.074 -0.036 -0.050 -0.019 -0.012 -0.022 -0.007 -0.014 -0.080 -0.028
(0.055) (0.056) (0.069) (0.055) (0.049) (0.048) (0.074) (0.049) (0.047) (0.081) (0.045)
Female student 0.026 -0.020 0.007 0.004 -0.064 -0.050 0.015 -0.010 -0.027 0.270* 0.019
(0.074) (0.080) (0.095) (0.073) (0.074) (0.070) (0.116) (0.081) (0.070) (0.157) (0.065)
Parents literate indicator -0.057 -0.134 -0.048 -0.078 0.004 -0.043 -0.083 0.041 -0.021 -0.178 -0.056
(0.088) (0.099) (0.126) (0.094) (0.094) (0.089) (0.146) (0.105) (0.093) (0.172) (0.091)
Household asset index 0.001 -0.049 -0.020 -0.021 -0.054 -0.023 -0.115* -0.022 -0.053 -0.096 -0.065*
(0.039) (0.044) (0.054) (0.041) (0.040) (0.042) (0.065) (0.046) (0.039) (0.065) (0.038)
Observations 2,416 2,297 2,354 7,186 2,695 2,695 2,608 2,617 10,615 788 11,403
Notes:
* p<0.1; ** p<0.05; *** p<0.01. Each cell reports the coefficient from a separate regression testing for heterogeneity in impact of the voucher program along several characteristics. In Panel A, we test for heterogenous impacts on voucher recipients (regressions include controls for the characteristic in question, an indicator for whether a student was offered a voucher, and the student's normalized baseline test scores). In Panel B, we test for heterogeneous spillover effects on non-applicants left behind in the public schools (regressions include controls for the characteristic in question, an indicator for whether the student is in a treatment village, and the student's normalized baseline test scores). All regressions include a constant and district fixed effects and standard errors are clustered at the village level. All test scores are as defined in Table VI, and indicators for assets and literacy are as defined in Table I. The actual number of observations for each regression may vary slightly within columns based on the dependent variable.
Panel A: Test Score Impacts on Voucher Recipients
Panel B: Test Score Impacts on Non-applicants (in treatment versus control villages)
Table IX: Heterogeneous Test Score Impacts by Student Characteristics ("Intention to Treat" Estimates)
Year 4 AssessmentsYear 2 Assessments

[1] [2] [3] [4] [5] [6] [7] [8] [9] [10] [11]
Telugu score Math score English scoreCombined
across testsTelugu score Math score English score
Science and social studies (EVS) score
Hindi scoreCombined across
tests
Combined across non-language subjects (math & science/social studies)
Students attending private English medium schools
-0.078 -0.010 0.683*** 0.198 -0.272 -0.349 0.677** -0.197 1.379*** 0.223 -0.274
(0.164) (0.175) (0.232) (0.174) (0.244) (0.248) (0.339) (0.298) (0.250) (0.204) (0.255)
Students attending private Telugu medium schools
-0.033 0.062 0.408 0.143 0.259 0.255 0.043 0.746** 1.384*** 0.532*** 0.496*
(0.168) (0.197) (0.285) (0.202) (0.245) (0.254) (0.171) (0.313) (0.230) (0.181) (0.275)
Total observations 4,291 4,291 4,209 12,791 4,070 4,070 3,922 3,935 1,576 17,573 8,005
First-stage F-stat on first regressor 33.2 33.2 32.9 33.2 12.1 12.2 12.4 12.1 11.2 12.6 12.2
First-stage F-stat on second regressor 38.3 38.3 39.4 38.7 21.5 21.5 22.1 20.5 20.6 22.2 21.1
P-value of equality by medium 0.80 0.72 0.33 0.78 0.15 0.13 0.09 0.06 0.99 0.29 0.07
[1] [2] [3] [4] [5] [6] [7] [8] [9] [10] [11]
Students attending private English medium schools
-0.242 -0.173 0.595** 0.060 -0.523 -0.591 0.978** -0.104 1.426*** 0.213 -0.352
(0.231) (0.239) (0.289) (0.232) (0.385) (0.381) (0.460) (0.384) (0.365) (0.285) (0.360)
Students attending private Telugu medium schools
0.201 0.294 0.535 0.339 0.513 0.501 -0.274 0.651 1.337*** 0.542* 0.575
(0.252) (0.260) (0.417) (0.291) (0.450) (0.458) (0.376) (0.446) (0.328) (0.320) (0.442)
Total observations 4,291 4,291 4,209 12,791 4,070 4,070 3,922 3,935 1,576 17,573 8,005
First-stage F-stat on first regressor 38.4 38.4 38.2 18.3 17.7 17.8 18.1 17.6 16.2 38.4 17.8
First-stage F-stat on second regressor 30.6 30.6 31.1 25.1 25.4 25.4 25.2 25.1 20.2 30.8 25.4
P-value of equality by medium 0.3 0.2 0.9 0.5 0.2 0.2 0.1 0.3 0.9 0.5 0.2
Year 2 Assessments Year 4 Assessments
* p<0.1; ** p<0.05; *** p<0.01. In Panel A, we instrument for the medium of instruction of private school attended using the medium of instruction of the nearest private school and the interaction of receiving a voucher and the medium of instruction of the nearest private school. First stage regressions are shown in Table A.7. In Panel B, we instrument for the medium of instruction of private school attended using only the interaction of receiving a voucher and the medium of instruction of the nearest private school, and we control for the the closest private school being English medium and for the closest private school being Telugu medium. In both panels, we also control for mother's and father's education, scheduled caste status, and a household asset index as defined in Table I. Students with a missing value on any control have all controls coded as "0" and an additional dummy is included in all regressions indicating these students to ensure that no observations are lost due to missing data on any individual control. All regressions control for baseline normalized test scores. The results in this table do not include district fixed effects, because one of the districts has very few English-medium schools. All standard errors are clustered at the village level. The sample is around 7% smaller than that in Table VI (due to missing location data). All test scores are defined as in Table VI.
Table X: Heterogeneous Test Score Impacts (by Medium of Instruction - IV Estimates)
Panel A: Treatment on the Treated Effects by Medium of Instruction (all Four Instruments)
Panel B: Treatment on the Treated Effects by Medium of Instruction (only Interactions as Instruments)
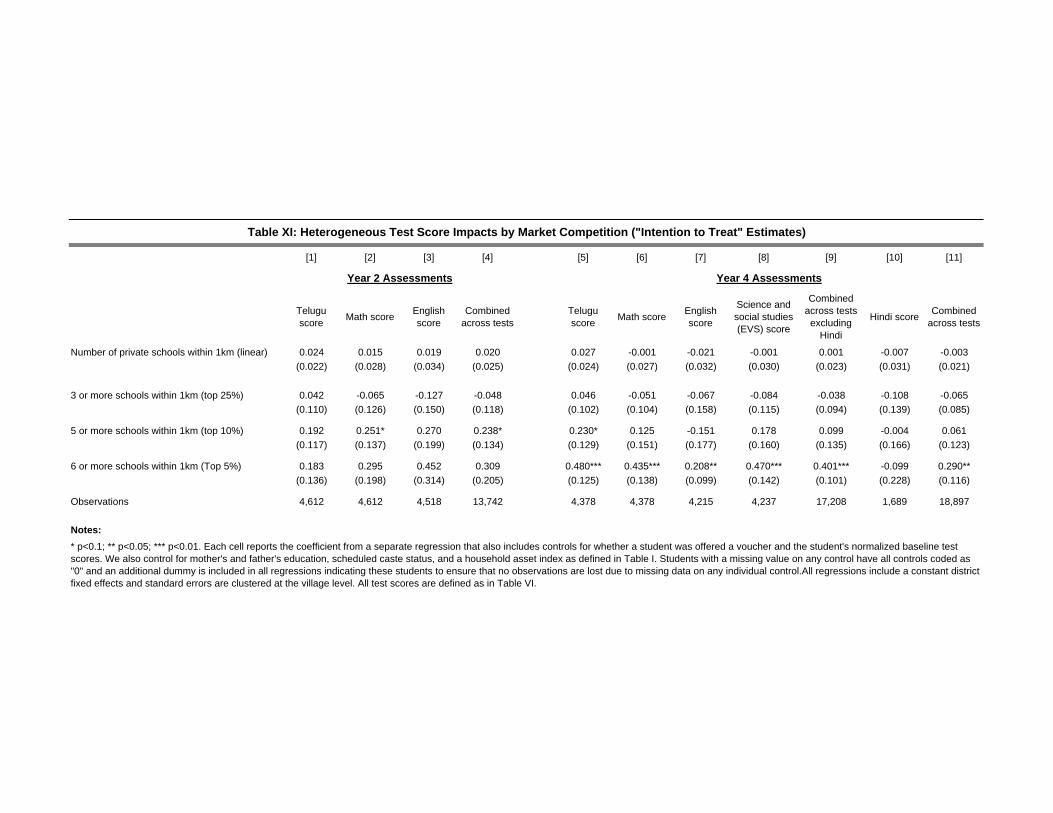
[1] [2] [3] [4] [5] [6] [7] [8] [9] [10] [11]
Telugu score
Math scoreEnglish score
Combined across tests
Telugu score
Math scoreEnglish score
Science and social studies (EVS) score
Combined across tests
excluding Hindi
Hindi scoreCombined
across tests
Number of private schools within 1km (linear) 0.024 0.015 0.019 0.020 0.027 -0.001 -0.021 -0.001 0.001 -0.007 -0.003
(0.022) (0.028) (0.034) (0.025) (0.024) (0.027) (0.032) (0.030) (0.023) (0.031) (0.021)
3 or more schools within 1km (top 25%) 0.042 -0.065 -0.127 -0.048 0.046 -0.051 -0.067 -0.084 -0.038 -0.108 -0.065
(0.110) (0.126) (0.150) (0.118) (0.102) (0.104) (0.158) (0.115) (0.094) (0.139) (0.085)
5 or more schools within 1km (top 10%) 0.192 0.251* 0.270 0.238* 0.230* 0.125 -0.151 0.178 0.099 -0.004 0.061
(0.117) (0.137) (0.199) (0.134) (0.129) (0.151) (0.177) (0.160) (0.135) (0.166) (0.123)
6 or more schools within 1km (Top 5%) 0.183 0.295 0.452 0.309 0.480*** 0.435*** 0.208** 0.470*** 0.401*** -0.099 0.290**
(0.136) (0.198) (0.314) (0.205) (0.125) (0.138) (0.099) (0.142) (0.101) (0.228) (0.116)
Observations 4,612 4,612 4,518 13,742 4,378 4,378 4,215 4,237 17,208 1,689 18,897
Notes:
* p<0.1; ** p<0.05; *** p<0.01. Each cell reports the coefficient from a separate regression that also includes controls for whether a student was offered a voucher and the student's normalized baseline test scores. We also control for mother's and father's education, scheduled caste status, and a household asset index as defined in Table I. Students with a missing value on any control have all controls coded as "0" and an additional dummy is included in all regressions indicating these students to ensure that no observations are lost due to missing data on any individual control.All regressions include a constant district fixed effects and standard errors are clustered at the village level. All test scores are defined as in Table VI.
Table XI: Heterogeneous Test Score Impacts by Market Competition ("Intention to Treat" Estimates)
Year 2 Assessments Year 4 Assessments

ONLINE APPENDIX: TABLES A.1 - A.9
The Aggregate Effect of School Choice: Evidence from a two-stage experiment in India
Karthik Muralidharan: UC San Diego, NBER, J-PAL Venkatesh Sundararaman: World Bank

Application rate for those with
characteristic
Application Rate for those without
characteristicDifference
Acceptance rate for those with characteristic
(conditional on winning)
Acceptance rate for those without
characteristic (conditional on
winning)
Difference
[1] [2] [3] [4] [5] [6]
Older sibling in public school 0.810 0.832 -0.022 0.567 0.595 -0.028
[0.392] [0.375] (0.013)* [0.496] [0.491] (0.031)
Private school exists within 0.5km 0.841 0.776 0.065 0.671 0.503 0.168
[0.376] [0.407] (0.022)*** [0.469] [0.500] (0.055)***
Private school exists within 1km 0.826 0.779 0.047 0.648 0.469 0.179
[0.385] [0.400] (0.025)* [0.477] [0.499] (0.067)***
Older cohort 0.779 0.849 -0.07 0.586 0.590 -0.004
[0.413] [0.363] (0.015)*** [0.494] [0.490] (0.028)
Both parents have completed at least primary school 0.832 0.817 0.015 0.546 0.605 -0.059
[0.378] [0.384] (0.014) [0.497] [0.490] (0.033)*
At least one parent has completed grade 10 0.84 0.813 0.027 0.569 0.597 -0.028
[0.366] [0.391] (0.012)** [0.496] [0.491] (0.025)
Scheduled caste 0.824 0.819 0.005 0.531 0.617 -0.086
[0.382] [0.384] (0.013) [0.499] [0.486] (0.028)***
Notes:
* p<0.1; ** p<0.05; *** p<0.01. Standard deviations reported in brackets, standard errors in parentheses. All standard errors are clustered at the village level. Note that the application rate in columns 1-2 appears higher than the overall application rate of 59% reported in the text because the non-applicants in the calculation of the 59% application rate include cases where the student completed a baseline test in the public school but where the parents could not be found for the baseline household survey or did not complete the household survey. This table only includes households who completed the baseline household survey.
Table A.1: Voucher Take-up (Application and Acceptance)
Correlates of Application and Acceptance

Lottery winners
[treatment villages]
Lottery losers [treatment villages]
P-value for difference
Lottery winners
[treatment villages]
Lottery losers [control villages]
P-value for difference
Lottery winners
[treatment villages]
Lottery losers [treatment villages]
P-value for difference
Lottery winners
[treatment villages]
Lottery losers [control villages]
P-value for difference
[1] [2] [3] [4] [5] [6] [7] [8] [9] [10] [11] [12]
Characteristics
Present during the test 0.90 0.84 0.00*** 0.90 0.85 0.01** 0.85 0.80 0.00*** 0.85 0.81 0.08*
Comparison of attritors
Normalized baseline Telugu score 0.05 0.13 0.41 0.04 0.09 0.71 0.03 0.14 0.17 0.02 0.10 0.46
Normalized baseline math score 0.06 0.03 0.83 0.06 0.10 0.86 0.05 0.01 0.72 0.05 0.10 0.78
Both parents have completed at least primary school 0.29 0.25 0.46 0.29 0.25 0.40 0.28 0.24 0.22 0.28 0.30 0.59
At least one parent has completed grade 10 0.33 0.32 0.81 0.33 0.34 0.81 0.33 0.29 0.27 0.33 0.38 0.23
Scheduled caste 0.38 0.33 0.41 0.39 0.32 0.23 0.38 0.41 0.46 0.38 0.34 0.41
Household asset index 3.15 3.02 0.18 3.15 3.08 0.66 3.15 3.10 0.48 3.15 3.21 0.71
Observations 1,980 1,117 1,980 3,336 1,980 1,117 1,980 3,338
Non-applicants in
treatment villages
Non-applicants in
control villages
P-value for difference
Students initially in private
schools in treatment villages
Students initially in private
schools in control villages
P-value for difference
Non-applicants in
treatment villages
Non-applicants in
control villages
P-value for difference
Students initially in private
schools in treatment villages
Students initially in private
schools in control villages
P-value for difference
Characteristics
Present during the test 0.66 0.67 0.83 0.62 0.60 0.39 0.75 0.76 0.63 0.70 0.65 0.18
Comparison of attritors
Normalized baseline Telugu score -0.03 0.07 0.52 0.58 0.72 0.15 -0.07 -0.02 0.81 0.51 0.75 .03**
Normalized baseline math score -0.03 0.11 0.43 0.76 0.69 0.60 -0.01 0.10 0.58 0.75 0.72 0.87
Both parents have completed at least primary school 0.26 0.25 0.86 0.57 0.61 0.33 0.18 0.22 0.51 0.57 0.63 0.25
At least one parent has completed grade 10 0.27 0.29 0.73 0.51 0.55 0.34 0.25 0.28 0.71 0.52 0.55 0.49
Scheduled caste 0.38 0.28 0.10 0.14 0.13 0.81 0.35 0.29 0.41 0.16 0.15 0.79
Household asset index 3.13 3.29 0.21 3.88 3.90 0.78 3.13 3.21 0.52 3.94 3.94 1.00
Observations 743 811 1,149 1,109 743 811 1,152 1,106
Notes:
Table A.2: Attrition
All variables are as defined in Table A.1. All standard errors are clustered at the village level (the same unit of analysis in Table 4)
Year 4 Assessments
Year 4 Assessments
Year 2 Assessments
Year 2 Assessments
Panel A: Voucher Winners and Losers
Panel B: Students for Spillover Analysis

Letters Words Sentences Paragraph Advanced
[1] [2] [3] [4] [5]
Offered voucher 0.234*** 0.171*** 0.122*** 0.121*** 0.025***
(0.028) (0.026) (0.023) (0.022) (0.009)
Mean in control 0.23 0.13 0.08 0.08 0.02
Total observations 1,696 1,696 1,696 1,696 1,696
No. of obs. (voucher recipients) 867 867 867 867 867
No. of obs. (voucher non-recipients) 829 829 829 829 829
0.461*** 0.337*** 0.240*** 0.238*** 0.049***
(0.055) (0.051) (0.045) (0.043) (0.018)
Total observations 1,696 1,696 1,696 1,696 1,696
No. of obs. (voucher acceptors) 510 510 510 510 510
No. of obs. (voucher non-recipients and non-acceptors) 1,186 1,186 1,186 1,186 1,186
Notes:
All regressions include a constant and district fixed effects. All standard errors are clustered at the village level. The Hindi test scores are based on the ASER measurement tool used by Pratham to measure basic literacy, and were administered individually to a random sample of voucher winning and losing students in June 2012. Panel B reports coefficients and standard errors from Panel A scaled up by the inverse of the year 2 and year 4 voucher take-up rate of 1005/1980.
Table A.3: Hindi Test Score Impacts by Question Type
Student Score (Fraction Correct) by Question Type
Panel A: Impact of Winning a Voucher ("Intention to Treat" Effects)
Panel B: Impact of Attending a Private School ("Treatment on the Treated" Effects, Scaling up Intention to
Treat Effects by Voucher Take-up Rate)
Attended a private school (using voucher as an instrument)

Telugu score
Math scoreEnglish score
Combined across tests
Telugu score
Math scoreEnglish score
Science and social studies (EVS) score
Combined across tests excluding
Hindi
Hindi scoreCombined
across tests
[1] [2] [3] [4] [5] [6] [7] [8] [9] [10] [11]
Offered voucher -0.081 -0.054 0.183** 0.014 -0.018 -0.031 0.115 0.082 0.036 0.542*** 0.137***
(0.055) (0.065) (0.079) (0.061) (0.051) (0.052) (0.070) (0.060) (0.048) (0.068) (0.045)
Total observations 4,620 4,620 4,525 13,765 4,385 4,385 4,217 4,243 17,230 1,696 18,926
Treatment observations 1,778 1,778 1,738 5294 1,674 1,675 1,607 1,628 6,584 867 7451
Control observations 2,842 2,842 2,787 8471 2,711 2,710 2,610 2,615 10,646 829 11475
[1] [2] [3] [4] [5] [6] [7] [8] [9] [10] [11]
Lower bound estimate -0.148 -0.142 0.076 -0.079 -0.076 -0.112 0.001 -0.010 -0.052 0.493 0.052
(0.031) (0.031) (0.039) (0.020) (0.036) (0.035) (0.046) (0.040) (0.019) (0.063) (0.020)
Upper bound estimate 0.028 0.041 0.262 0.110 0.059 0.045 0.199 0.200 0.138 0.591 0.220
(0.030) (0.030) (0.039) (0.019) (0.034) (0.033) (0.042) (0.041) (0.018) (0.062) (0.019)
Confidence interval low -0.208 -0.202 -0.001 -0.118 -0.145 -0.180 -0.090 -0.089 -0.089 0.368 0.014
Confidence interval high 0.087 0.099 0.337 0.147 0.125 0.109 0.281 0.280 0.174 0.712 0.256
Notes:
Year 2 assessments Year 4 assessments
* p<0.1; ** p<0.05; *** p<0.01. All regressions in Panel A control for baseline normalized test scores and include a constant and district fixed effects. All standard errors are clustered at the village level. Test scores are as defined in Table 4.
Table A.4: Robustness to Attrition (ITT Estimates)
Panel A: Inverse Probability Re-weighting
Year 2 Assessments Year 4 Assessments
Panel B: Lee Bounds
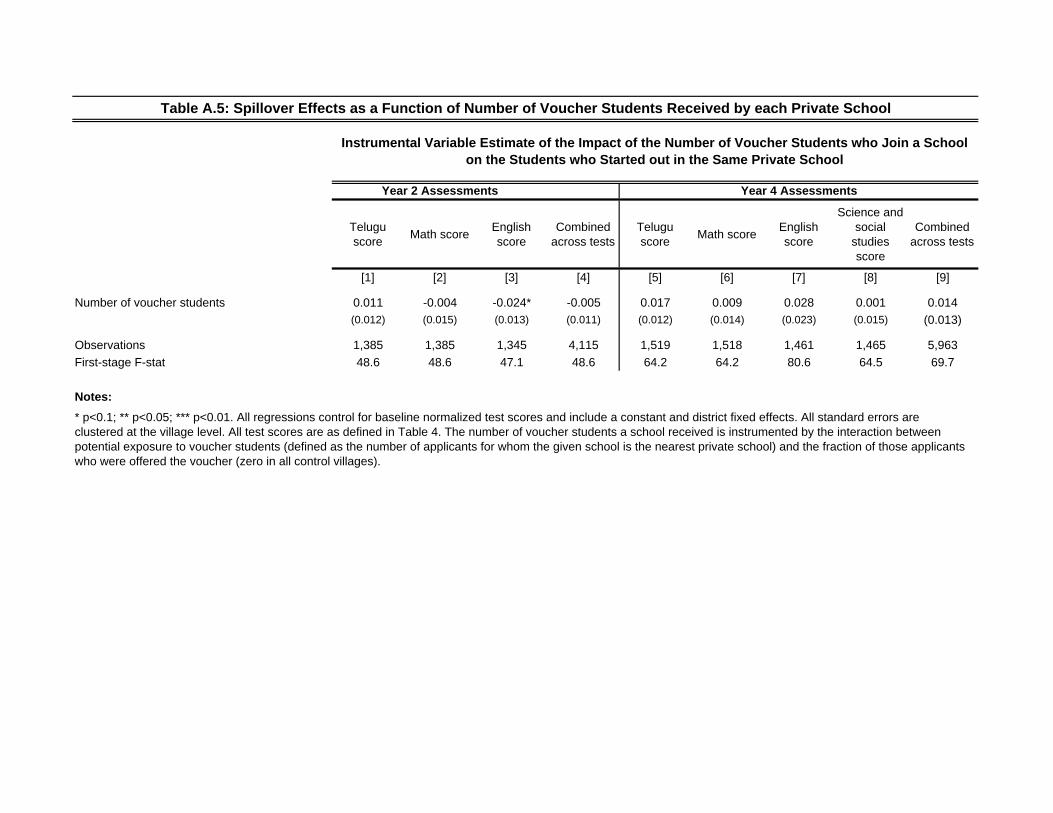
Telugu score
Math scoreEnglish score
Combined across tests
Telugu score
Math scoreEnglish score
Science and social
studies score
Combined across tests
[1] [2] [3] [4] [5] [6] [7] [8] [9]
Number of voucher students 0.011 -0.004 -0.024* -0.005 0.017 0.009 0.028 0.001 0.014
(0.012) (0.015) (0.013) (0.011) (0.012) (0.014) (0.023) (0.015) (0.013)
Observations 1,385 1,385 1,345 4,115 1,519 1,518 1,461 1,465 5,963
First-stage F-stat 48.6 48.6 47.1 48.6 64.2 64.2 80.6 64.5 69.7
Notes:
* p<0.1; ** p<0.05; *** p<0.01. All regressions control for baseline normalized test scores and include a constant and district fixed effects. All standard errors are clustered at the village level. All test scores are as defined in Table 4. The number of voucher students a school received is instrumented by the interaction between potential exposure to voucher students (defined as the number of applicants for whom the given school is the nearest private school) and the fraction of those applicants who were offered the voucher (zero in all control villages).
Year 4 Assessments
Table A.5: Spillover Effects as a Function of Number of Voucher Students Received by each Private School
Year 2 Assessments
Instrumental Variable Estimate of the Impact of the Number of Voucher Students who Join a School on the Students who Started out in the Same Private School
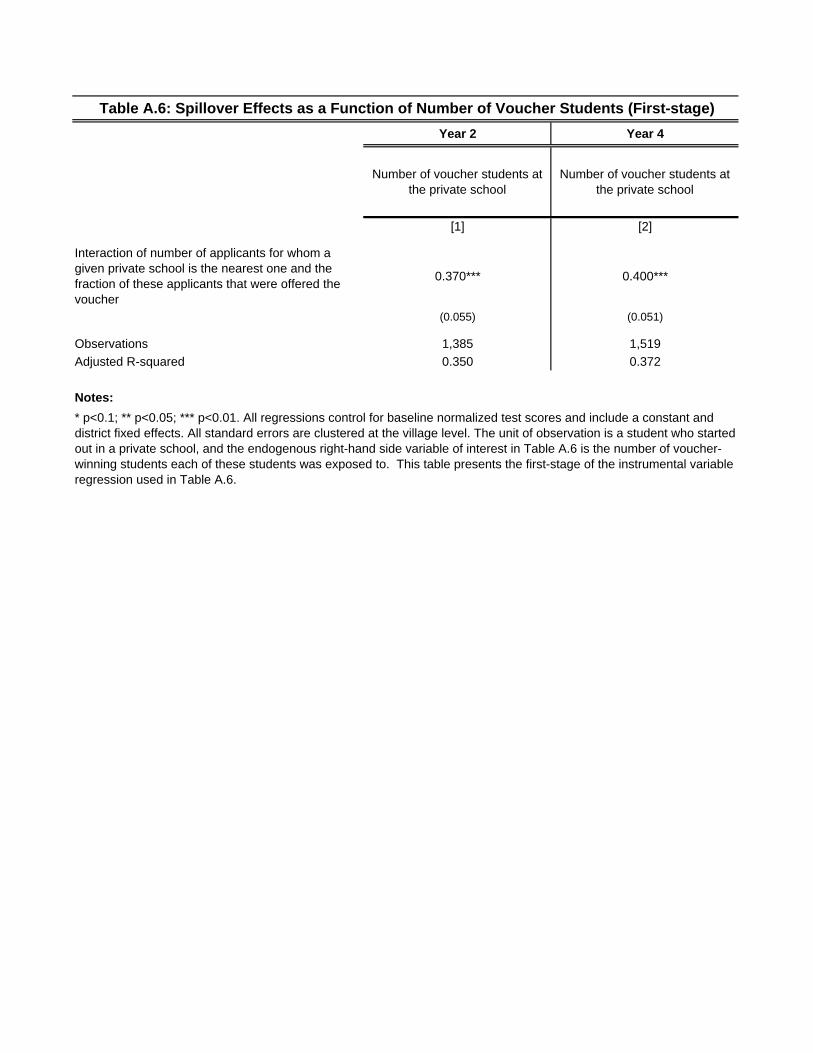
Year 2 Year 4
Number of voucher students at the private school
Number of voucher students at the private school
[1] [2]
Interaction of number of applicants for whom a given private school is the nearest one and the fraction of these applicants that were offered the voucher
0.370*** 0.400***
(0.055) (0.051)
Observations 1,385 1,519
Adjusted R-squared 0.350 0.372
Notes:
Table A.6: Spillover Effects as a Function of Number of Voucher Students (First-stage)
* p<0.1; ** p<0.05; *** p<0.01. All regressions control for baseline normalized test scores and include a constant and district fixed effects. All standard errors are clustered at the village level. The unit of observation is a student who started out in a private school, and the endogenous right-hand side variable of interest in Table A.6 is the number of voucher-winning students each of these students was exposed to. This table presents the first-stage of the instrumental variable regression used in Table A.6.
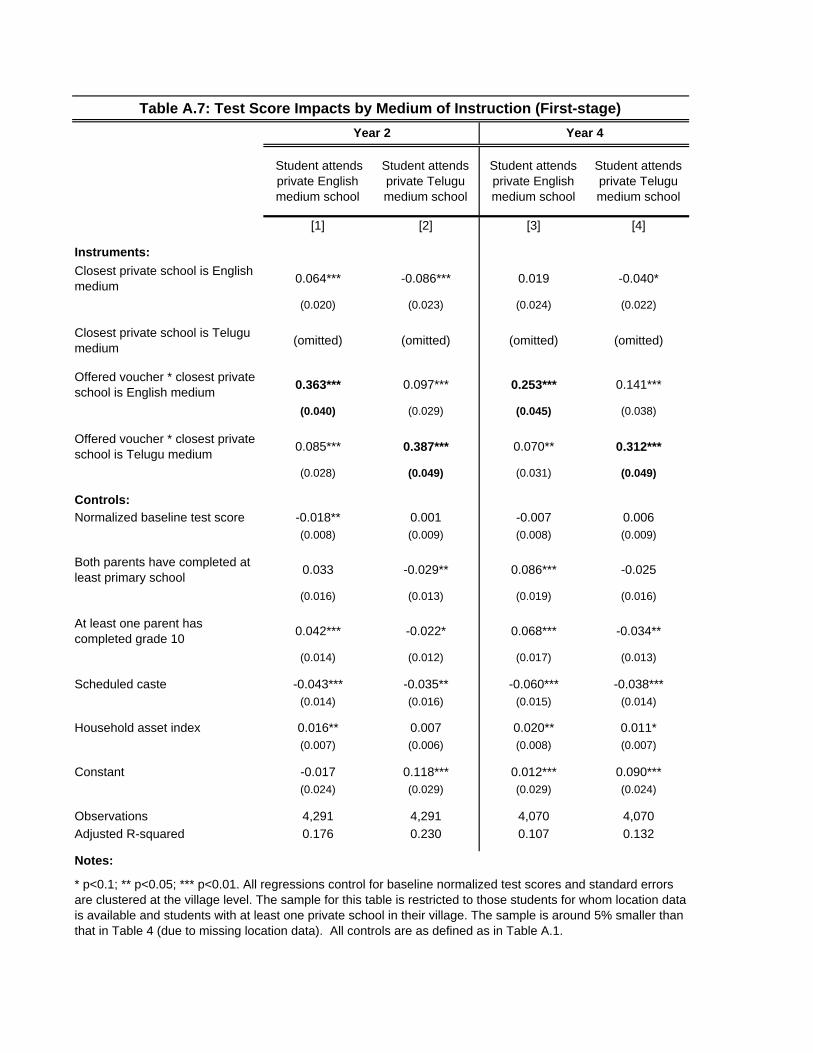
Student attends private English medium school
Student attends private Telugu medium school
Student attends private English medium school
Student attends private Telugu medium school
[1] [2] [3] [4]
Instruments:
Closest private school is English medium
0.064*** -0.086*** 0.019 -0.040*
(0.020) (0.023) (0.024) (0.022)
Closest private school is Telugu medium
(omitted) (omitted) (omitted) (omitted)
Offered voucher * closest private school is English medium
0.363*** 0.097*** 0.253*** 0.141***
(0.040) (0.029) (0.045) (0.038)
Offered voucher * closest private school is Telugu medium
0.085*** 0.387*** 0.070** 0.312***
(0.028) (0.049) (0.031) (0.049)
Controls:
Normalized baseline test score -0.018** 0.001 -0.007 0.006(0.008) (0.009) (0.008) (0.009)
Both parents have completed at least primary school
0.033 -0.029** 0.086*** -0.025
(0.016) (0.013) (0.019) (0.016)
At least one parent has completed grade 10
0.042*** -0.022* 0.068*** -0.034**
(0.014) (0.012) (0.017) (0.013)
Scheduled caste -0.043*** -0.035** -0.060*** -0.038***(0.014) (0.016) (0.015) (0.014)
Household asset index 0.016** 0.007 0.020** 0.011*(0.007) (0.006) (0.008) (0.007)
Constant -0.017 0.118*** 0.012*** 0.090***(0.024) (0.029) (0.029) (0.024)
Observations 4,291 4,291 4,070 4,070
Adjusted R-squared 0.176 0.230 0.107 0.132
Notes:
Table A.7: Test Score Impacts by Medium of Instruction (First-stage)
Year 2 Year 4
* p<0.1; ** p<0.05; *** p<0.01. All regressions control for baseline normalized test scores and standard errors are clustered at the village level. The sample for this table is restricted to those students for whom location data is available and students with at least one private school in their village. The sample is around 5% smaller than that in Table 4 (due to missing location data). All controls are as defined as in Table A.1.
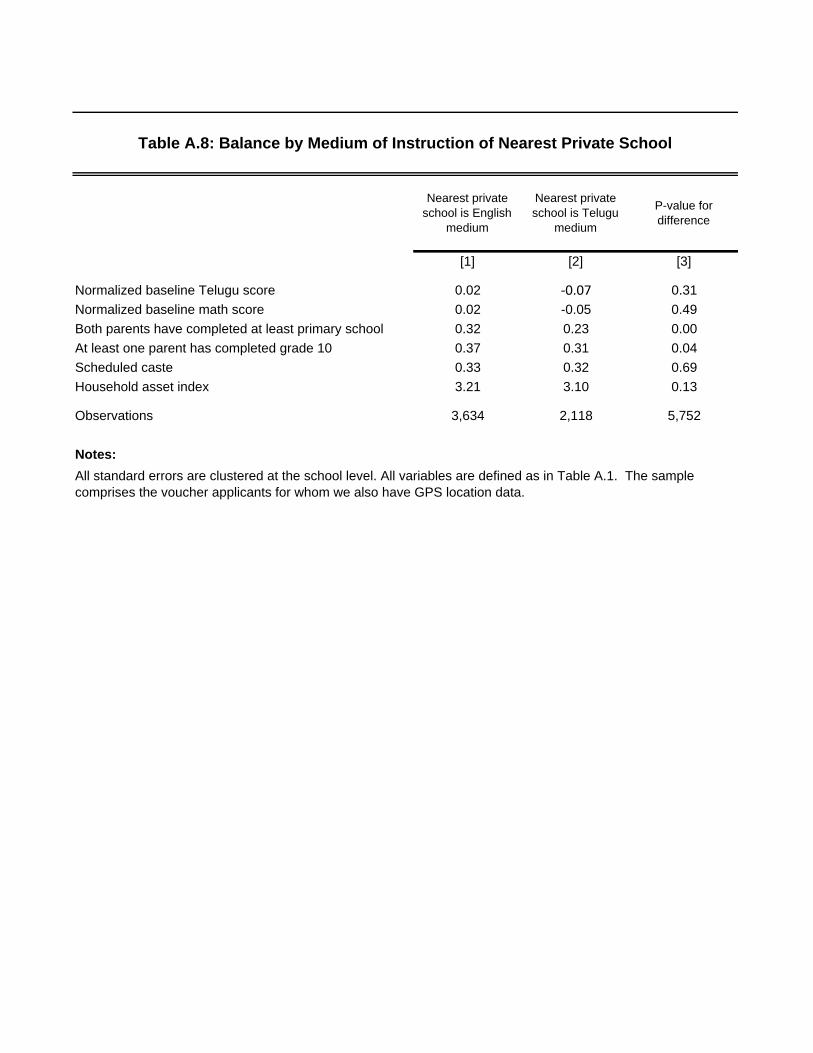
Nearest private school is English
medium
Nearest private school is Telugu
medium
P-value for difference
[1] [2] [3]
Normalized baseline Telugu score 0.02 ‐0.07 0.31
Normalized baseline math score 0.02 -0.05 0.49
Both parents have completed at least primary school 0.32 0.23 0.00
At least one parent has completed grade 10 0.37 0.31 0.04
Scheduled caste 0.33 0.32 0.69
Household asset index 3.21 3.10 0.13
Observations 3,634 2,118 5,752
Notes:
Table A.8: Balance by Medium of Instruction of Nearest Private School
All standard errors are clustered at the school level. All variables are defined as in Table A.1. The sample comprises the voucher applicants for whom we also have GPS location data.

Private English medium schools
Private Telugu medium schools
Difference
[1] [2] [3]
Total enrollment 353.22 214.33 138.89***
Total working days 229.46 230.00 -0.55
Pupil-teacher ratio 19.26 14.49 4.76***
Drinking water available 0.99 0.97 0.022*
Functional toilets 0.91 0.76 0.16***
Separate functional toilets for girls 0.79 0.72 0.073
Functional electricity 0.90 0.83 0.068*
Functional computers 0.67 0.29 0.38***
Functional library 0.80 0.78 0.01
Functional radio 0.12 0.13 -0.01
Observations 164 89
Male 0.24 0.25 -0.01
Age 33.27 31.97 1.29
Years of teaching 5.48 4.48 1.00***
Completed at least college or masters 0.81 0.49 0.32***
Teacher training completed 0.42 0.22 0.21***
Come from the same village 0.37 0.57 -0.20***
Current gross salary per month (Rs.) 2757.68 1919.07 838.61***
Observations 1215 720
Annual school fees charged per child (Rs./child) 1768.25 1021.92 746.33***
Observations 156 88
Notes:
* p<0.1; ** p<0.05; *** p<0.01. The sample for this table is restricted to schools and teachers in control villages across years 2008 through 2012. In cases of multiple observations per school or teacher across different years, variable means are used (so each teacher/school is one observation). School fees are measured in Rupees per student per year, trimmed at the 1st and 99th percentiles to remove outliers. The actual number of observations for each regression may vary slightly within columns based on the dependent variable.
Tabel A.9: School and Teacher Characteristics by Private School Medium of Instruction
Panel A: School Characteristics
Panel B: Teacher Characteristics
Panel C: School Fees