Embed Size (px)
Citation preview

The Advisors’ Inner Circle Fund III
StrategicGlobalAdvisors
SGA International Equity Fund
SEMI-ANNUAL REPORTJanuary 31, 2017
Investment Adviser:Strategic Global Advisors, LLC

THE ADVISORS’ INNER CIRCLE FUND III SGA INTERNATIONAL EQUITY FUNDJANUARY 31, 2017 (UNAUDITED)
TABLE OF CONTENTS
Letter to Shareholders . . . . . . . . . . . . . . . . . . . . . . . . . . . . . . . . . . . . . . . . . . 1
Schedule of Investments . . . . . . . . . . . . . . . . . . . . . . . . . . . . . . . . . . . . . . . . 3
Statement of Assets and Liabilities . . . . . . . . . . . . . . . . . . . . . . . . . . . . . . . . 11
Statement of Operations . . . . . . . . . . . . . . . . . . . . . . . . . . . . . . . . . . . . . . . . 12
Statement of Changes in Net Assets . . . . . . . . . . . . . . . . . . . . . . . . . . . . . . . 13
Financial Highlights . . . . . . . . . . . . . . . . . . . . . . . . . . . . . . . . . . . . . . . . . . . . . 14
Notes to Financial Statements . . . . . . . . . . . . . . . . . . . . . . . . . . . . . . . . . . . . 16
Disclosure of Fund Expenses . . . . . . . . . . . . . . . . . . . . . . . . . . . . . . . . . . . . . 27
Approval of Investment Advisory Agreement . . . . . . . . . . . . . . . . . . . . . . . . 29
The Fund files its complete schedule of investments with the Securities andExchange Commission (“SEC”) for the first and third quarters of each fiscal yearon Form N-Q within sixty days after period end. The Fund’s Form N-Q isavailable on the SEC’s website at http://www.sec.gov, and may be reviewedand copied at the SEC’s Public Reference Room in Washington, DC. Informationon the operation of the Public Reference Room may be obtained by calling1-800-SEC-0330.
A description of the policies and procedures that the Fund uses to determinehow to vote proxies relating to Fund securities, as well as information relatingto how a Fund voted proxies relating to fund securities during the most recent6-month period ended January 31, 2017, is available (i) without charge, uponrequest, by calling 1-866-778-6397; and (ii) on the SEC’s website athttp://www.sec.gov.

THE ADVISORS’ INNER CIRCLE FUND III SGA INTERNATIONAL EQUITY FUNDJANUARY 31, 2017 (UNAUDITED)
Dear Shareholders,
We are pleased to present the semi-annual report for the SGA InternationalEquity Fund (the “Fund”). The following commentary covers the four monthsfrom September 30, 2016 to January 31, 2017.
Performance Review
The Fund’s Institutional Shares returned 0.50%, net of fees, the periodSeptember 30, 2016 (Fund inception) to January 31, 2017, versus the MSCIEAFE Index (Net) (“MSCI EAFE”) benchmark return of 2.17%.
International developed markets as a whole performed well for the period,masking a deeply divergent set of returns across sectors and countries. Energystocks, which performed well for the period, tracked oil prices very closely,which also continued their climb. During the same period, Healthcare stockswere down dramatically, with uncertainty looming around the future of healthinsurance providers and weak currency translation of returns. The portfolio’sgenerally neutral stance relative to sector and currency enabled the portfolioto mitigate political and commodity swing pitfalls.
The Fund’s underperformance relative to the benchmark was primarily due tostock selection within the Energy and Financials sectors. Energy proved to be achallenge, as returns were not based on fundamentals but rather theunexpected and prolonged turn in commodity prices which may prove to betemporary. While Healthcare stocks were down for the period, the Funddelivered excess returns from stock selection, notably in Biotechnologycompanies.
From a country perspective, Switzerland was the largest contributor. Theprimary area of weak stock selection was the United Kingdom (“UK”), wherenegative results were largely due to not owning certain oil companies such asRoyal Dutch, which rebounded after weaker performance last year.
Portfolio Structure
Active sector weightings are generally a result of our bottom-up stock selectionprocess. Through our risk management and portfolio construction process, wegenerally keep sector weights fairly close to the MSCI EAFE benchmark, andmodest sector over- and under-weights are a result stock specific factors. As ofJanuary 31, 2017, all sector weights were within +/- 200 basis points of thebenchmark, with the largest overweight in Information Technology and largestunderweight in Utilities.
1

THE ADVISORS’ INNER CIRCLE FUND III SGA INTERNATIONAL EQUITY FUNDJANUARY 31, 2017 (UNAUDITED)
Market Outlook
While the US market responded positively to recent political events, globaleconomic growth has remained below expectations despite broad coordinationbetween a large number of central banks to stimulate economies throughsupportive monetary policy. The International Monetary Fund estimates thatglobal gross domestic product will grow 3.4% in 2017, a slight increase from2016, but lower than forecasts at the beginning of the year. We expect that theUS dollar could continue to rise if the Federal Reserve accomplishes its targetto raise short term interest rates three times in 2017. Growth in Japan will mostlikely remain tepid as the economy faces renewed deflation concerns andstructural demographic issues despite a tight labor market and accommodativemonetary policies. We expect the Euro currency will likely face increasedpressure with the recent rise of global populist movements. Political risks thatcharacterized 2016 have the potential to increase volatility in 2017 asGermany, France, and Italy have their elections. Lower revised forecasts for theUK’s economy indicate a slow-down, but we believe a recession is unlikely.Although geopolitical events can result in sharp short-term swings, we believecompany-specific fundamentals will drive long term value and stock prices. Wecontinue to focus our research on selecting companies with an attractivecombination of valuation, growth, investor sentiment and quality.
Past performance is no guarantee of future results. This material represents anassessment of the market environment at a specific point in tie and is notintended to be a forecast of future events or a guarantee of futureperformance. This information should not be relied upon by the reader asresearch or investment advice regarding the funds or any stock in particular.
2

THE ADVISORS’ INNER CIRCLE FUND III SGA INTERNATIONAL EQUITY FUNDJANUARY 31, 2017 (UNAUDITED)
SECTOR WEIGHTINGS†
21.1% Financials14.1% Consumer Discre�onary
13.9% Industrials10.7% Health Care
9.4% Consumer Staples8.6% Materials
6.8% Informa�on Technology4.9% Energy
3.8% Telecommunica�on Services2.8% Real Estate2.6% Exchange Traded Fund
1.3% U�li�es
† Percentages based on total investments.
SCHEDULE OF INVESTMENTS
COMMON STOCK — 99.7%
Shares Value
Argentina — 0.4%Ternium ADR . . . . . . . . . . . . . . . . . . . . . . . . . . . . . . . . . . . . . . . . . 220 $ 5,029
Australia — 5.5%Aristocrat Leisure . . . . . . . . . . . . . . . . . . . . . . . . . . . . . . . . . . . . . . 470 5,447Caltex Australia . . . . . . . . . . . . . . . . . . . . . . . . . . . . . . . . . . . . . . . 550 11,930Commonwealth Bank of Australia . . . . . . . . . . . . . . . . . . . . . . . . . 80 4,954Fortescue Metals Group . . . . . . . . . . . . . . . . . . . . . . . . . . . . . . . . 790 3,990Harvey Norman Holdings . . . . . . . . . . . . . . . . . . . . . . . . . . . . . . . . 2,000 7,584LendLease Group . . . . . . . . . . . . . . . . . . . . . . . . . . . . . . . . . . . . . . 650 6,946Macquarie Group . . . . . . . . . . . . . . . . . . . . . . . . . . . . . . . . . . . . . . 190 12,190Medibank Pvt . . . . . . . . . . . . . . . . . . . . . . . . . . . . . . . . . . . . . . . . . 3,000 6,143Rio Tinto . . . . . . . . . . . . . . . . . . . . . . . . . . . . . . . . . . . . . . . . . . . . . 140 7,080Sonic Healthcare . . . . . . . . . . . . . . . . . . . . . . . . . . . . . . . . . . . . . . 200 3,158
69,422
Austria — 1.4%ANDRITZ . . . . . . . . . . . . . . . . . . . . . . . . . . . . . . . . . . . . . . . . . . . . . 70 3,776Erste Group Bank . . . . . . . . . . . . . . . . . . . . . . . . . . . . . . . . . . . . . . 360 10,936OMV . . . . . . . . . . . . . . . . . . . . . . . . . . . . . . . . . . . . . . . . . . . . . . . . 90 3,144
17,856
Belgium — 0.8%Groupe Bruxelles Lambert . . . . . . . . . . . . . . . . . . . . . . . . . . . . . . . 50 4,253KBC Group . . . . . . . . . . . . . . . . . . . . . . . . . . . . . . . . . . . . . . . . . . . 90 5,831
10,084
The accompanying notes are an integral part of the financial statements.
3

THE ADVISORS’ INNER CIRCLE FUND III SGA INTERNATIONAL EQUITY FUNDJANUARY 31, 2017 (UNAUDITED)
COMMON STOCK — continued
Shares Value
Brazil — 0.6%Itau Unibanco Holding ADR . . . . . . . . . . . . . . . . . . . . . . . . . . . . . . 605 $ 7,145
Canada — 2.3%Canadian Imperial Bank of Commerce . . . . . . . . . . . . . . . . . . . . . 110 9,368Constellation Software . . . . . . . . . . . . . . . . . . . . . . . . . . . . . . . . . 17 7,678Dollarama . . . . . . . . . . . . . . . . . . . . . . . . . . . . . . . . . . . . . . . . . . . 200 7,573National Bank of Canada . . . . . . . . . . . . . . . . . . . . . . . . . . . . . . . . 100 4,317
28,936
China — 0.9%NetEase ADR . . . . . . . . . . . . . . . . . . . . . . . . . . . . . . . . . . . . . . . . . 46 11,679
Denmark — 3.1%Danske Bank . . . . . . . . . . . . . . . . . . . . . . . . . . . . . . . . . . . . . . . . . 380 12,649Novo Nordisk, Cl B . . . . . . . . . . . . . . . . . . . . . . . . . . . . . . . . . . . . . 190 6,824Pandora . . . . . . . . . . . . . . . . . . . . . . . . . . . . . . . . . . . . . . . . . . . . . 120 15,704Vestas Wind Systems . . . . . . . . . . . . . . . . . . . . . . . . . . . . . . . . . . . 50 3,496
38,673
Finland — 2.0%Neste . . . . . . . . . . . . . . . . . . . . . . . . . . . . . . . . . . . . . . . . . . . . . . . 340 11,840UPM-Kymmene . . . . . . . . . . . . . . . . . . . . . . . . . . . . . . . . . . . . . . . 600 13,602
25,442
France — 9.3%Atos . . . . . . . . . . . . . . . . . . . . . . . . . . . . . . . . . . . . . . . . . . . . . . . . 60 6,379AXA . . . . . . . . . . . . . . . . . . . . . . . . . . . . . . . . . . . . . . . . . . . . . . . . 560 13,735Klepierre ‡ . . . . . . . . . . . . . . . . . . . . . . . . . . . . . . . . . . . . . . . . . . . 410 15,557L’Oreal . . . . . . . . . . . . . . . . . . . . . . . . . . . . . . . . . . . . . . . . . . . . . . 46 8,360LVMH Moet Hennessy Louis Vuitton . . . . . . . . . . . . . . . . . . . . . . . 36 7,252Renault . . . . . . . . . . . . . . . . . . . . . . . . . . . . . . . . . . . . . . . . . . . . . . 50 4,500Safran . . . . . . . . . . . . . . . . . . . . . . . . . . . . . . . . . . . . . . . . . . . . . . . 230 15,568Sanofi . . . . . . . . . . . . . . . . . . . . . . . . . . . . . . . . . . . . . . . . . . . . . . . 180 14,474Societe BIC . . . . . . . . . . . . . . . . . . . . . . . . . . . . . . . . . . . . . . . . . . . 20 2,613Societe Generale . . . . . . . . . . . . . . . . . . . . . . . . . . . . . . . . . . . . . . 200 9,771Thales . . . . . . . . . . . . . . . . . . . . . . . . . . . . . . . . . . . . . . . . . . . . . . . 80 7,494TOTAL . . . . . . . . . . . . . . . . . . . . . . . . . . . . . . . . . . . . . . . . . . . . . . . 60 3,022Valeo . . . . . . . . . . . . . . . . . . . . . . . . . . . . . . . . . . . . . . . . . . . . . . . 130 7,932
116,657
The accompanying notes are an integral part of the financial statements.
4
THE ADVISORS’ INNER CIRCLE FUND III SGA INTERNATIONAL EQUITY FUNDJANUARY 31, 2017 (UNAUDITED)
COMMON STOCK — continued
Shares Value
Germany — 8.3%Allianz . . . . . . . . . . . . . . . . . . . . . . . . . . . . . . . . . . . . . . . . . . . . . . . 80 $ 13,541Bayer . . . . . . . . . . . . . . . . . . . . . . . . . . . . . . . . . . . . . . . . . . . . . . . 63 6,957Bayerische Motoren Werke . . . . . . . . . . . . . . . . . . . . . . . . . . . . . . 140 12,721Continental . . . . . . . . . . . . . . . . . . . . . . . . . . . . . . . . . . . . . . . . . . 57 11,119Covestro (A) . . . . . . . . . . . . . . . . . . . . . . . . . . . . . . . . . . . . . . . . . . 110 8,252Daimler . . . . . . . . . . . . . . . . . . . . . . . . . . . . . . . . . . . . . . . . . . . . . 70 5,240Deutsche Telekom . . . . . . . . . . . . . . . . . . . . . . . . . . . . . . . . . . . . . 330 5,757GEA Group . . . . . . . . . . . . . . . . . . . . . . . . . . . . . . . . . . . . . . . . . . . 150 6,192HeidelbergCement . . . . . . . . . . . . . . . . . . . . . . . . . . . . . . . . . . . . . 60 5,774HOCHTIEF . . . . . . . . . . . . . . . . . . . . . . . . . . . . . . . . . . . . . . . . . . . . 50 7,095SAP . . . . . . . . . . . . . . . . . . . . . . . . . . . . . . . . . . . . . . . . . . . . . . . . . 190 17,358United Internet . . . . . . . . . . . . . . . . . . . . . . . . . . . . . . . . . . . . . . . 100 4,177
104,183
Hong Kong — 1.7%CK Hutchison Holdings . . . . . . . . . . . . . . . . . . . . . . . . . . . . . . . . . . 500 5,979HKT Trust & HKT . . . . . . . . . . . . . . . . . . . . . . . . . . . . . . . . . . . . . . 3,000 4,175Power Assets Holdings . . . . . . . . . . . . . . . . . . . . . . . . . . . . . . . . . 500 4,782WH Group (A) . . . . . . . . . . . . . . . . . . . . . . . . . . . . . . . . . . . . . . . . 8,000 6,066
21,002
Hungary — 0.3%MOL Hungarian Oil & Gas . . . . . . . . . . . . . . . . . . . . . . . . . . . . . . . 50 3,526
Ireland — 0.5%Kerry Group, Cl A . . . . . . . . . . . . . . . . . . . . . . . . . . . . . . . . . . . . . . 90 6,336
Israel — 1.1%Taro Pharmaceutical Industries * . . . . . . . . . . . . . . . . . . . . . . . . . 50 5,225Teva Pharmaceutical Industries . . . . . . . . . . . . . . . . . . . . . . . . . . 280 9,166
14,391
Italy — 1.3%Ferrari . . . . . . . . . . . . . . . . . . . . . . . . . . . . . . . . . . . . . . . . . . . . . . 150 9,343Prysmian . . . . . . . . . . . . . . . . . . . . . . . . . . . . . . . . . . . . . . . . . . . . 260 6,753
16,096
Japan — 24.4%Asahi Group Holdings . . . . . . . . . . . . . . . . . . . . . . . . . . . . . . . . . . 200 7,032Astellas Pharma . . . . . . . . . . . . . . . . . . . . . . . . . . . . . . . . . . . . . . . 300 4,021Bandai Namco Holdings . . . . . . . . . . . . . . . . . . . . . . . . . . . . . . . . . 200 5,509Central Japan Railway . . . . . . . . . . . . . . . . . . . . . . . . . . . . . . . . . . 100 16,181
The accompanying notes are an integral part of the financial statements.
5

THE ADVISORS’ INNER CIRCLE FUND III SGA INTERNATIONAL EQUITY FUNDJANUARY 31, 2017 (UNAUDITED)
COMMON STOCK — continued
Shares Value
Japan — (continued)Daito Trust Construction . . . . . . . . . . . . . . . . . . . . . . . . . . . . . . . . 100 $ 13,985Fuji Electric . . . . . . . . . . . . . . . . . . . . . . . . . . . . . . . . . . . . . . . . . . . 3,000 17,776Fuji Heavy Industries . . . . . . . . . . . . . . . . . . . . . . . . . . . . . . . . . . . 100 4,021FUJIFILM Holdings . . . . . . . . . . . . . . . . . . . . . . . . . . . . . . . . . . . . . 100 3,875Hakuhodo DY Holdings . . . . . . . . . . . . . . . . . . . . . . . . . . . . . . . . . 200 2,462Hitachi Chemical . . . . . . . . . . . . . . . . . . . . . . . . . . . . . . . . . . . . . . 300 8,529Hitachi Metals . . . . . . . . . . . . . . . . . . . . . . . . . . . . . . . . . . . . . . . . 700 9,709Hoya . . . . . . . . . . . . . . . . . . . . . . . . . . . . . . . . . . . . . . . . . . . . . . . . 100 4,359Kajima . . . . . . . . . . . . . . . . . . . . . . . . . . . . . . . . . . . . . . . . . . . . . . 1,000 6,970Kao . . . . . . . . . . . . . . . . . . . . . . . . . . . . . . . . . . . . . . . . . . . . . . . . . 300 14,834KDDI . . . . . . . . . . . . . . . . . . . . . . . . . . . . . . . . . . . . . . . . . . . . . . . . 600 16,101Kirin Holdings . . . . . . . . . . . . . . . . . . . . . . . . . . . . . . . . . . . . . . . . . 400 6,547Mazda Motor . . . . . . . . . . . . . . . . . . . . . . . . . . . . . . . . . . . . . . . . . 200 2,955MEIJI Holdings . . . . . . . . . . . . . . . . . . . . . . . . . . . . . . . . . . . . . . . . 100 7,741Mitsubishi . . . . . . . . . . . . . . . . . . . . . . . . . . . . . . . . . . . . . . . . . . . 600 13,548Mitsubishi Electric . . . . . . . . . . . . . . . . . . . . . . . . . . . . . . . . . . . . . 800 12,197Mitsubishi Tanabe Pharma . . . . . . . . . . . . . . . . . . . . . . . . . . . . . . 600 12,004MS&AD Insurance Group Holdings . . . . . . . . . . . . . . . . . . . . . . . . 200 6,722Nippon Telegraph & Telephone . . . . . . . . . . . . . . . . . . . . . . . . . . 100 4,410NTT DOCOMO . . . . . . . . . . . . . . . . . . . . . . . . . . . . . . . . . . . . . . . . 400 9,588Oracle Japan . . . . . . . . . . . . . . . . . . . . . . . . . . . . . . . . . . . . . . . . . 100 5,597ORIX . . . . . . . . . . . . . . . . . . . . . . . . . . . . . . . . . . . . . . . . . . . . . . . . 700 10,583Shimizu . . . . . . . . . . . . . . . . . . . . . . . . . . . . . . . . . . . . . . . . . . . . . . 1,000 9,202Shionogi . . . . . . . . . . . . . . . . . . . . . . . . . . . . . . . . . . . . . . . . . . . . . 300 14,415Sumitomo Chemical . . . . . . . . . . . . . . . . . . . . . . . . . . . . . . . . . . . . 3,000 16,021Suruga Bank . . . . . . . . . . . . . . . . . . . . . . . . . . . . . . . . . . . . . . . . . . 300 6,855Teijin . . . . . . . . . . . . . . . . . . . . . . . . . . . . . . . . . . . . . . . . . . . . . . . 300 6,340Toho . . . . . . . . . . . . . . . . . . . . . . . . . . . . . . . . . . . . . . . . . . . . . . . . 200 5,766Toyota Motor . . . . . . . . . . . . . . . . . . . . . . . . . . . . . . . . . . . . . . . . . 200 11,662Yamaha . . . . . . . . . . . . . . . . . . . . . . . . . . . . . . . . . . . . . . . . . . . . . 300 9,166
306,683
Mexico — 0.7%Gruma, Cl B . . . . . . . . . . . . . . . . . . . . . . . . . . . . . . . . . . . . . . . . . . 690 9,266
Netherlands — 1.4%ABN AMRO Group (A) . . . . . . . . . . . . . . . . . . . . . . . . . . . . . . . . . . 300 7,044Koninklijke Ahold Delhaize . . . . . . . . . . . . . . . . . . . . . . . . . . . . . . 310 6,591Randstad Holding . . . . . . . . . . . . . . . . . . . . . . . . . . . . . . . . . . . . . . 70 4,065
17,700
Norway — 0.5%Orkla . . . . . . . . . . . . . . . . . . . . . . . . . . . . . . . . . . . . . . . . . . . . . . . 660 6,153
The accompanying notes are an integral part of the financial statements.
6

THE ADVISORS’ INNER CIRCLE FUND III SGA INTERNATIONAL EQUITY FUNDJANUARY 31, 2017 (UNAUDITED)
COMMON STOCK — continued
Shares Value
Portugal — 0.6%Galp Energia SGPS . . . . . . . . . . . . . . . . . . . . . . . . . . . . . . . . . . . . . 490 $ 7,204
Singapore — 1.0%DBS Group Holdings . . . . . . . . . . . . . . . . . . . . . . . . . . . . . . . . . . . . 900 12,114
South Africa — 0.5%Nedbank Group . . . . . . . . . . . . . . . . . . . . . . . . . . . . . . . . . . . . . . . 370 6,376
South Korea — 1.6%KB Financial Group ADR . . . . . . . . . . . . . . . . . . . . . . . . . . . . . . . . . 245 9,946Samsung Electronics GDR . . . . . . . . . . . . . . . . . . . . . . . . . . . . . . . 9 7,655S-Oil ADR . . . . . . . . . . . . . . . . . . . . . . . . . . . . . . . . . . . . . . . . . . . . 90 3,145
20,746
Spain — 2.4%Aena (A) . . . . . . . . . . . . . . . . . . . . . . . . . . . . . . . . . . . . . . . . . . . . . 80 11,603Red Electrica . . . . . . . . . . . . . . . . . . . . . . . . . . . . . . . . . . . . . . . . . 690 12,312Repsol . . . . . . . . . . . . . . . . . . . . . . . . . . . . . . . . . . . . . . . . . . . . . . 410 6,046
29,961
Sweden — 2.4%Atlas Copco, Cl A . . . . . . . . . . . . . . . . . . . . . . . . . . . . . . . . . . . . . . 280 8,973Hexagon, Cl B . . . . . . . . . . . . . . . . . . . . . . . . . . . . . . . . . . . . . . . . . 220 8,702Skandinaviska Enskilda Banken, Cl A . . . . . . . . . . . . . . . . . . . . . . . 1,120 12,580
30,255
Switzerland — 7.3%Actelion . . . . . . . . . . . . . . . . . . . . . . . . . . . . . . . . . . . . . . . . . . . . . 86 22,335Nestle . . . . . . . . . . . . . . . . . . . . . . . . . . . . . . . . . . . . . . . . . . . . . . . 180 13,151Novartis . . . . . . . . . . . . . . . . . . . . . . . . . . . . . . . . . . . . . . . . . . . . . 40 2,929Partners Group Holding . . . . . . . . . . . . . . . . . . . . . . . . . . . . . . . . . 10 5,040Roche Holding . . . . . . . . . . . . . . . . . . . . . . . . . . . . . . . . . . . . . . . . 35 8,241Swiss Life Holding . . . . . . . . . . . . . . . . . . . . . . . . . . . . . . . . . . . . . 57 17,229Swiss Re . . . . . . . . . . . . . . . . . . . . . . . . . . . . . . . . . . . . . . . . . . . . . 240 22,338
91,263
Taiwan — 0.5%Taiwan Semiconductor Manufacturing ADR . . . . . . . . . . . . . . . . . 210 6,491
United Kingdom — 16.9%3i Group . . . . . . . . . . . . . . . . . . . . . . . . . . . . . . . . . . . . . . . . . . . . . 2,300 20,254Auto Trader Group (A) . . . . . . . . . . . . . . . . . . . . . . . . . . . . . . . . . . 1,640 8,253
The accompanying notes are an integral part of the financial statements.
7
THE ADVISORS’ INNER CIRCLE FUND III SGA INTERNATIONAL EQUITY FUNDJANUARY 31, 2017 (UNAUDITED)
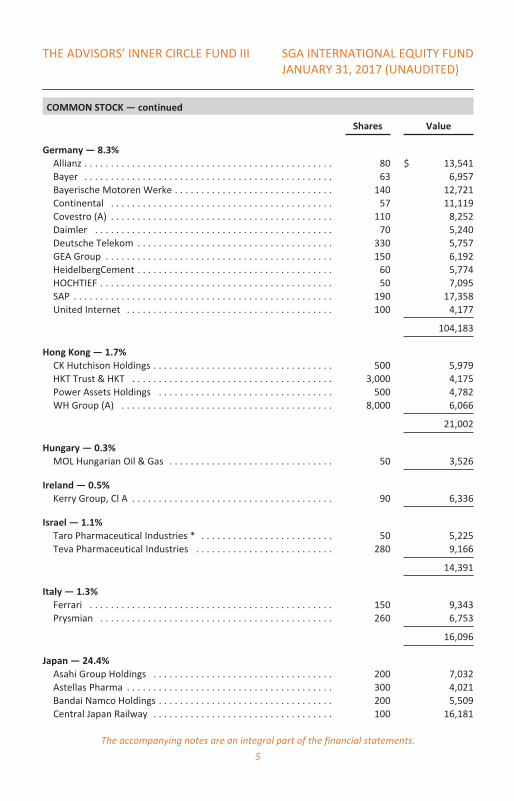
COMMON STOCK — continued
Shares Value
United Kingdom — (continued)Barclays . . . . . . . . . . . . . . . . . . . . . . . . . . . . . . . . . . . . . . . . . . . . . 4,650 $ 12,837BT Group, Cl A . . . . . . . . . . . . . . . . . . . . . . . . . . . . . . . . . . . . . . . . 2,380 9,097Bunzl . . . . . . . . . . . . . . . . . . . . . . . . . . . . . . . . . . . . . . . . . . . . . . . 150 3,942Carnival . . . . . . . . . . . . . . . . . . . . . . . . . . . . . . . . . . . . . . . . . . . . . 140 7,464Diageo . . . . . . . . . . . . . . . . . . . . . . . . . . . . . . . . . . . . . . . . . . . . . . 190 5,267GlaxoSmithKline . . . . . . . . . . . . . . . . . . . . . . . . . . . . . . . . . . . . . . . 1,240 23,836Glencore . . . . . . . . . . . . . . . . . . . . . . . . . . . . . . . . . . . . . . . . . . . . 1,000 4,107HSBC Holdings . . . . . . . . . . . . . . . . . . . . . . . . . . . . . . . . . . . . . . . . 970 8,254Intertek Group . . . . . . . . . . . . . . . . . . . . . . . . . . . . . . . . . . . . . . . . 100 4,267Johnson Matthey . . . . . . . . . . . . . . . . . . . . . . . . . . . . . . . . . . . . . . 140 5,726Lloyds Banking Group . . . . . . . . . . . . . . . . . . . . . . . . . . . . . . . . . . 6,000 4,901Mondi . . . . . . . . . . . . . . . . . . . . . . . . . . . . . . . . . . . . . . . . . . . . . . . 340 7,489Persimmon . . . . . . . . . . . . . . . . . . . . . . . . . . . . . . . . . . . . . . . . . . . 410 9,949Petrofac . . . . . . . . . . . . . . . . . . . . . . . . . . . . . . . . . . . . . . . . . . . . . 1,170 13,497Reckitt Benckiser Group . . . . . . . . . . . . . . . . . . . . . . . . . . . . . . . . 150 12,839RELX . . . . . . . . . . . . . . . . . . . . . . . . . . . . . . . . . . . . . . . . . . . . . . . . 600 10,741Unilever . . . . . . . . . . . . . . . . . . . . . . . . . . . . . . . . . . . . . . . . . . . . . 460 18,677WPP . . . . . . . . . . . . . . . . . . . . . . . . . . . . . . . . . . . . . . . . . . . . . . . . 920 21,342
212,739
TOTAL COMMON STOCK(Cost $1,242,885) . . . . . . . . . . . . . . . . . . . . . . . . . . . . . . . . . . . . 1,253,408
EXCHANGE TRADED FUND — 2.7%
iShares MSCI EAFE Index Fund(Cost $32,643) . . . . . . . . . . . . . . . . . . . . . . . . . . . . . . . . . . . . . . 563 33,572
TOTAL INVESTMENTS — 102.4%(Cost $1,275,528) . . . . . . . . . . . . . . . . . . . . . . . . . . . . . . . . . . . . $ 1,286,980
Percentages are based on Net Assets of $1,256,310.
* Non-income producing security.‡ Real Estate Investment Trust(A) Security exempt from registration under Rule 144A of the Securities Act of 1933. These
securities may be resold in transactions exempt from registration normally to qualifiedinstitutions. On January 31, 2017, the value of these securities amounted to $41,218,representing 3% of the net assets of the Fund.
The accompanying notes are an integral part of the financial statements.
8

THE ADVISORS’ INNER CIRCLE FUND III SGA INTERNATIONAL EQUITY FUNDJANUARY 31, 2017 (UNAUDITED)
ADR American Depositary ReceiptCl ClassEAFE Europe, Australasia and Far EastGDR Global Depositary ReceiptMSCI Morgan Stanley Capital International
The table below sets forth information about the level within the fair valuehierarchy at which the Fund’s investments are measured at January 31, 2017:Investments in Securities Level 1 Level 2 Level 3 Total
Common StockArgentina $ 5,029 $ — $ — $ 5,029Australia 69,422 — — 69,422Austria 17,856 — — 17,856Belgium 10,084 — — 10,084Brazil 7,145 — — 7,145Canada 28,936 — — 28,936China 11,679 — — 11,679Denmark 38,673 — — 38,673Finland 25,442 — — 25,442France 116,657 — — 116,657Germany 104,183 — — 104,183Hong Kong — 21,002 — 21,002Hungary 3,526 — — 3,526Ireland 6,336 — — 6,336Israel 14,391 — — 14,391Italy 16,096 — — 16,096Japan 306,683 — — 306,683Mexico 9,266 — — 9,266Netherlands 17,700 — — 17,700Norway 6,153 — — 6,153Portugal 7,204 — — 7,204Singapore 12,114 — — 12,114South Africa 6,376 — — 6,376South Korea 20,746 — — 20,746Spain 29,961 — — 29,961Sweden 30,255 — — 30,255Switzerland 91,263 — — 91,263Taiwan 6,491 — — 6,491United Kingdom 212,739 — — 212,739
Total Common Stock 1,232,406 21,002 — 1,253,408Exchange Traded Fund 33,572 — — 33,572
Total Investments in Securities $1,265,978 $21,002 $ — $1,286,980
Changes in the classifications between Levels 1 and 2 occurred throughout theperiod when foreign equity securities were fair valued using other observable
The accompanying notes are an integral part of the financial statements.
9

THE ADVISORS’ INNER CIRCLE FUND III SGA INTERNATIONAL EQUITY FUNDJANUARY 31, 2017 (UNAUDITED)
market based inputs provided by MarkIt in place of the closing exchange pricedue to events occurring after the close of the exchange or market on which theinvestment was principally traded. As of January 31, 2017, securities with atotal value $21,002 were classified as Level 2 due to the application of the fairvalue provided by MarkIt. There were no other significant transfers betweenLevel 1 and 2 securities for the period ended January 31, 2017. All othertransfers were considered to have occurred as of the end of the period. For theperiod ended January 31, 2017, there were no Level 3 securities.
For more information on valuation inputs, see Note 2 — Significant AccountingPolicies in the Notes to Financial Statements.
The accompanying notes are an integral part of the financial statements.
10
THE ADVISORS’ INNER CIRCLE FUND III SGA INTERNATIONAL EQUITY FUNDJANUARY 31, 2017 (UNAUDITED)
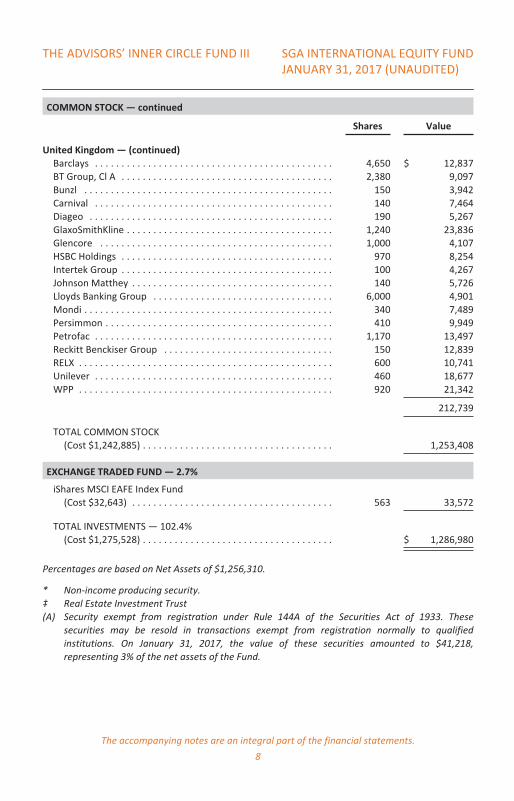
STATEMENT OF ASSETS AND LIABILITIES
Assets:Investments, at Value (Cost $1,275,528) . . . . . . . . . . . . . . . . . . . . . . . . . . . . . . . . $ 1,286,980Foreign Currency, at Value (Cost $77) . . . . . . . . . . . . . . . . . . . . . . . . . . . . . . . . . . . 79Cash . . . . . . . . . . . . . . . . . . . . . . . . . . . . . . . . . . . . . . . . . . . . . . . . . . . . . . . . . . . . . 12,937Receivable Due from Investment Adviser . . . . . . . . . . . . . . . . . . . . . . . . . . . . . . . . 31,944Receivable for Investment Securities Sold . . . . . . . . . . . . . . . . . . . . . . . . . . . . . . . 662Dividend and Interest Receivable . . . . . . . . . . . . . . . . . . . . . . . . . . . . . . . . . . . . . . 528Unrealized Gain on Foreign Spot Contracts . . . . . . . . . . . . . . . . . . . . . . . . . . . . . . 113Reclaim Receivable . . . . . . . . . . . . . . . . . . . . . . . . . . . . . . . . . . . . . . . . . . . . . . . . . 97Prepaid Expenses . . . . . . . . . . . . . . . . . . . . . . . . . . . . . . . . . . . . . . . . . . . . . . . . . . . 389
Total Assets . . . . . . . . . . . . . . . . . . . . . . . . . . . . . . . . . . . . . . . . . . . . . . . . . . . . . . . . . 1,333,729
Liabilities:Payable for Investment Securities Purchased . . . . . . . . . . . . . . . . . . . . . . . . . . . . . 9,378Distribution Fees Payable . . . . . . . . . . . . . . . . . . . . . . . . . . . . . . . . . . . . . . . . . . . . 40Payable to Investment Adviser . . . . . . . . . . . . . . . . . . . . . . . . . . . . . . . . . . . . . . . . 1,006Payable to Administrator . . . . . . . . . . . . . . . . . . . . . . . . . . . . . . . . . . . . . . . . . . . . . 9,317Chief Compliance Officer Fees Payable . . . . . . . . . . . . . . . . . . . . . . . . . . . . . . . . . . 2,317Shareholder Servicing Fees Payable . . . . . . . . . . . . . . . . . . . . . . . . . . . . . . . . . . . . 9,445Payable to Trustees . . . . . . . . . . . . . . . . . . . . . . . . . . . . . . . . . . . . . . . . . . . . . . . . . 1,598Unrealized Loss on Forward Foreign Spot Contracts . . . . . . . . . . . . . . . . . . . . . . . 4Other Accrued Expenses and Other Payables . . . . . . . . . . . . . . . . . . . . . . . . . . . . . 44,314
Total Liabilities . . . . . . . . . . . . . . . . . . . . . . . . . . . . . . . . . . . . . . . . . . . . . . . . . . . . . . 77,419
Net Assets . . . . . . . . . . . . . . . . . . . . . . . . . . . . . . . . . . . . . . . . . . . . . . . . . . . . . . . . . . $ 1,256,310
Net Assets Consist of:Paid-in Capital . . . . . . . . . . . . . . . . . . . . . . . . . . . . . . . . . . . . . . . . . . . . . . . . . . . . . . . $ 1,250,278Accumulated Net Investment Loss . . . . . . . . . . . . . . . . . . . . . . . . . . . . . . . . . . . . . . . (277)Accumulated Net Realized Loss on Investments and Foreign Currency
Transactions . . . . . . . . . . . . . . . . . . . . . . . . . . . . . . . . . . . . . . . . . . . . . . . . . . . . . . . (5,141)Net Unrealized Appreciation on Investments . . . . . . . . . . . . . . . . . . . . . . . . . . . . . . . 11,452Net Unrealized Depreciation on Foreign Currency and Translation of Other Assets
and Liabilities Denominated in Foreign Currencies . . . . . . . . . . . . . . . . . . . . . . . . . (2)
Net Assets . . . . . . . . . . . . . . . . . . . . . . . . . . . . . . . . . . . . . . . . . . . . . . . . . . . . . . . . . . $ 1,256,310
Institutional Shares:Net Assets . . . . . . . . . . . . . . . . . . . . . . . . . . . . . . . . . . . . . . . . . . . . . . . . . . . . . . . . $ 1,155,840Outstanding Shares of beneficial interest (unlimited authorization — no par
value) . . . . . . . . . . . . . . . . . . . . . . . . . . . . . . . . . . . . . . . . . . . . . . . . . . . . . . . . . . 115,014
Net Asset Value, Offering and Redemption Price Per Share* . . . . . . . . . . . . . . . . . $ 10.05
Investor Shares:Net Assets . . . . . . . . . . . . . . . . . . . . . . . . . . . . . . . . . . . . . . . . . . . . . . . . . . . . . . . . $ 100,470Outstanding Shares of beneficial interest (unlimited authorization — no par
value) . . . . . . . . . . . . . . . . . . . . . . . . . . . . . . . . . . . . . . . . . . . . . . . . . . . . . . . . . . 10,014
Net Asset Value, Offering and Redemption Price Per Share* . . . . . . . . . . . . . . . . . $ 10.03
* Redemption price may vary depending on length of time shares are held.
The accompanying notes are an integral part of the financial statements.
11

THE ADVISORS’ INNER CIRCLE FUND III SGA INTERNATIONAL EQUITY FUNDFOR THE PERIOD ENDEDJANUARY 31, 2017 (UNAUDITED)*
STATEMENT OF OPERATIONS
Investment Income:Dividends . . . . . . . . . . . . . . . . . . . . . . . . . . . . . . . . . . . . . . . . . . . . . . . . . . . . . . . . $ 3,782Less: Foreign Taxes Withheld . . . . . . . . . . . . . . . . . . . . . . . . . . . . . . . . . . . . . . . . . (183)
Total Investment Income . . . . . . . . . . . . . . . . . . . . . . . . . . . . . . . . . . . . . . . . . . . . . . 3,599
Expenses:Administration Fees . . . . . . . . . . . . . . . . . . . . . . . . . . . . . . . . . . . . . . . . . . . . . . . . 36,968Trustees’ Fees . . . . . . . . . . . . . . . . . . . . . . . . . . . . . . . . . . . . . . . . . . . . . . . . . . . . . 5,027Investment Advisory Fees . . . . . . . . . . . . . . . . . . . . . . . . . . . . . . . . . . . . . . . . . . . . 3,795Chief Compliance Officer Fees . . . . . . . . . . . . . . . . . . . . . . . . . . . . . . . . . . . . . . . . 2,317Distribution Fees, Investor Shares . . . . . . . . . . . . . . . . . . . . . . . . . . . . . . . . . . . . . 80Shareholder Serving Fees, Investor Shares . . . . . . . . . . . . . . . . . . . . . . . . . . . . . . 80Offering Costs . . . . . . . . . . . . . . . . . . . . . . . . . . . . . . . . . . . . . . . . . . . . . . . . . . . . . 24,303Transfer Agent Fees . . . . . . . . . . . . . . . . . . . . . . . . . . . . . . . . . . . . . . . . . . . . . . . . 16,685Legal Fees . . . . . . . . . . . . . . . . . . . . . . . . . . . . . . . . . . . . . . . . . . . . . . . . . . . . . . . . 12,307Audit Fees . . . . . . . . . . . . . . . . . . . . . . . . . . . . . . . . . . . . . . . . . . . . . . . . . . . . . . . . 9,445Printing Fees . . . . . . . . . . . . . . . . . . . . . . . . . . . . . . . . . . . . . . . . . . . . . . . . . . . . . . 7,688Custodian Fees . . . . . . . . . . . . . . . . . . . . . . . . . . . . . . . . . . . . . . . . . . . . . . . . . . . . 3,898Registration and Filing Fees . . . . . . . . . . . . . . . . . . . . . . . . . . . . . . . . . . . . . . . . . . 613Other Expenses . . . . . . . . . . . . . . . . . . . . . . . . . . . . . . . . . . . . . . . . . . . . . . . . . . . . 6,063
Total Expenses . . . . . . . . . . . . . . . . . . . . . . . . . . . . . . . . . . . . . . . . . . . . . . . . . . . . . . 129,269
Less:Waiver of Investment Advisory Fees . . . . . . . . . . . . . . . . . . . . . . . . . . . . . . . . . . . (3,795)Reimbursement of Expenses from Investment Adviser . . . . . . . . . . . . . . . . . . . . . (121,598)
Net Expenses . . . . . . . . . . . . . . . . . . . . . . . . . . . . . . . . . . . . . . . . . . . . . . . . . . . . . . . 3,876
Net Investment Loss . . . . . . . . . . . . . . . . . . . . . . . . . . . . . . . . . . . . . . . . . . . . . . . . . . (277)
Net Realized Gain (Loss) on:Investments . . . . . . . . . . . . . . . . . . . . . . . . . . . . . . . . . . . . . . . . . . . . . . . . . . . . . . (4,265)Foreign Currency Transactions . . . . . . . . . . . . . . . . . . . . . . . . . . . . . . . . . . . . . . . . (876)
Net Realized Loss . . . . . . . . . . . . . . . . . . . . . . . . . . . . . . . . . . . . . . . . . . . . . . . . . . . . (5,141)
Net Unrealized Appreciation (Depreciation) on:Investments . . . . . . . . . . . . . . . . . . . . . . . . . . . . . . . . . . . . . . . . . . . . . . . . . . . . . . 11,452Foreign Currency Translation . . . . . . . . . . . . . . . . . . . . . . . . . . . . . . . . . . . . . . . . . (2)
Net Unrealized Appreciation . . . . . . . . . . . . . . . . . . . . . . . . . . . . . . . . . . . . . . . . . . . 11,450
Net Realized and Unrealized Gain on Investments and Foreign CurrencyTransactions . . . . . . . . . . . . . . . . . . . . . . . . . . . . . . . . . . . . . . . . . . . . . . . . . . . . . . 6,309
Net Increase in Net Assets Resulting from Operations . . . . . . . . . . . . . . . . . . . . . . $ 6,032
* Commenced operations on September 30, 2016.
The accompanying notes are an integral part of the financial statements.
12
THE ADVISORS’ INNER CIRCLE FUND III SGA INTERNATIONAL EQUITY FUND
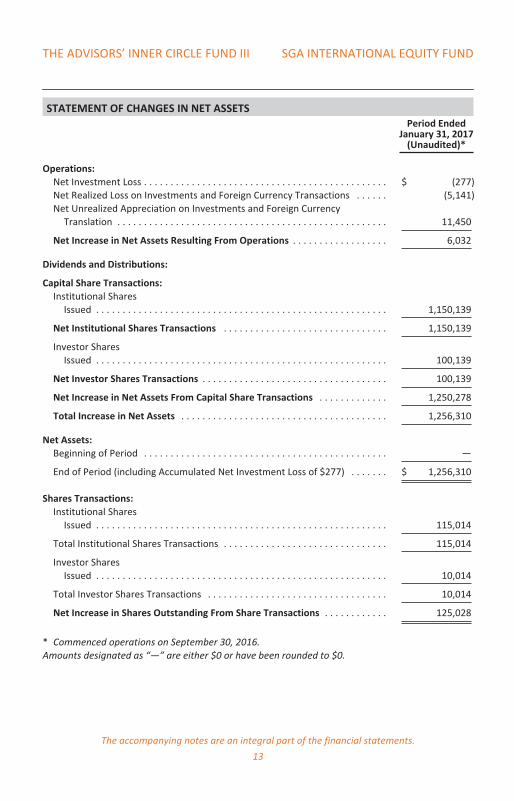
STATEMENT OF CHANGES IN NET ASSETSPeriod Ended
January 31, 2017(Unaudited)*
Operations:Net Investment Loss . . . . . . . . . . . . . . . . . . . . . . . . . . . . . . . . . . . . . . . . . . . . . . $ (277)Net Realized Loss on Investments and Foreign Currency Transactions . . . . . . (5,141)Net Unrealized Appreciation on Investments and Foreign Currency
Translation . . . . . . . . . . . . . . . . . . . . . . . . . . . . . . . . . . . . . . . . . . . . . . . . . . . 11,450
Net Increase in Net Assets Resulting From Operations . . . . . . . . . . . . . . . . . . 6,032
Dividends and Distributions:
Capital Share Transactions:Institutional Shares
Issued . . . . . . . . . . . . . . . . . . . . . . . . . . . . . . . . . . . . . . . . . . . . . . . . . . . . . . . 1,150,139
Net Institutional Shares Transactions . . . . . . . . . . . . . . . . . . . . . . . . . . . . . . . 1,150,139
Investor SharesIssued . . . . . . . . . . . . . . . . . . . . . . . . . . . . . . . . . . . . . . . . . . . . . . . . . . . . . . . 100,139
Net Investor Shares Transactions . . . . . . . . . . . . . . . . . . . . . . . . . . . . . . . . . . . 100,139
Net Increase in Net Assets From Capital Share Transactions . . . . . . . . . . . . . 1,250,278
Total Increase in Net Assets . . . . . . . . . . . . . . . . . . . . . . . . . . . . . . . . . . . . . . . 1,256,310
Net Assets:Beginning of Period . . . . . . . . . . . . . . . . . . . . . . . . . . . . . . . . . . . . . . . . . . . . . . —
End of Period (including Accumulated Net Investment Loss of $277) . . . . . . . $ 1,256,310
Shares Transactions:Institutional Shares
Issued . . . . . . . . . . . . . . . . . . . . . . . . . . . . . . . . . . . . . . . . . . . . . . . . . . . . . . . 115,014
Total Institutional Shares Transactions . . . . . . . . . . . . . . . . . . . . . . . . . . . . . . . 115,014
Investor SharesIssued . . . . . . . . . . . . . . . . . . . . . . . . . . . . . . . . . . . . . . . . . . . . . . . . . . . . . . . 10,014
Total Investor Shares Transactions . . . . . . . . . . . . . . . . . . . . . . . . . . . . . . . . . . 10,014
Net Increase in Shares Outstanding From Share Transactions . . . . . . . . . . . . 125,028
* Commenced operations on September 30, 2016.Amounts designated as “—” are either $0 or have been rounded to $0.
The accompanying notes are an integral part of the financial statements.
13
THE ADVISORS’ INNER CIRCLE FUND III SGA INTERNATIONAL EQUITY FUND
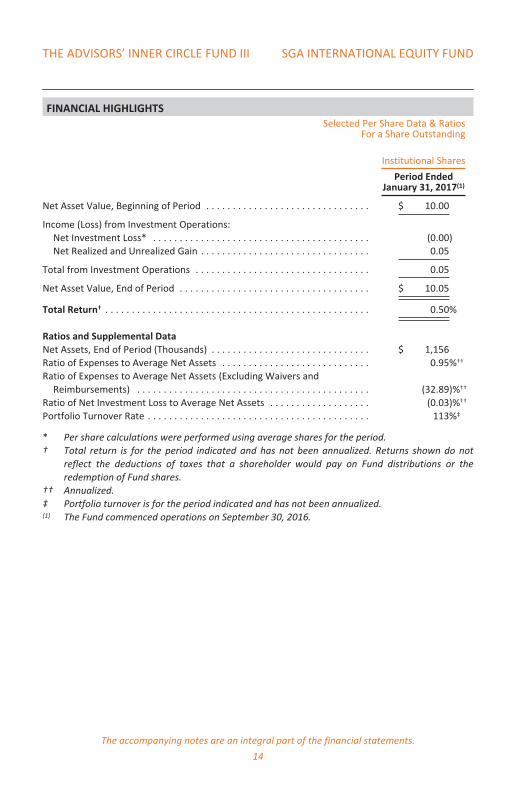
FINANCIAL HIGHLIGHTSSelected Per Share Data & Ratios
For a Share Outstanding
Institutional Shares
Period EndedJanuary 31, 2017(1)
Net Asset Value, Beginning of Period . . . . . . . . . . . . . . . . . . . . . . . . . . . . . . . $ 10.00
Income (Loss) from Investment Operations:Net Investment Loss* . . . . . . . . . . . . . . . . . . . . . . . . . . . . . . . . . . . . . . . . . (0.00)Net Realized and Unrealized Gain . . . . . . . . . . . . . . . . . . . . . . . . . . . . . . . . 0.05
Total from Investment Operations . . . . . . . . . . . . . . . . . . . . . . . . . . . . . . . . . 0.05
Net Asset Value, End of Period . . . . . . . . . . . . . . . . . . . . . . . . . . . . . . . . . . . . $ 10.05
Total Return† . . . . . . . . . . . . . . . . . . . . . . . . . . . . . . . . . . . . . . . . . . . . . . . . . . 0.50%
Ratios and Supplemental DataNet Assets, End of Period (Thousands) . . . . . . . . . . . . . . . . . . . . . . . . . . . . . . $ 1,156Ratio of Expenses to Average Net Assets . . . . . . . . . . . . . . . . . . . . . . . . . . . . 0.95%††
Ratio of Expenses to Average Net Assets (Excluding Waivers andReimbursements) . . . . . . . . . . . . . . . . . . . . . . . . . . . . . . . . . . . . . . . . . . . . (32.89)%††
Ratio of Net Investment Loss to Average Net Assets . . . . . . . . . . . . . . . . . . . (0.03)%††
Portfolio Turnover Rate . . . . . . . . . . . . . . . . . . . . . . . . . . . . . . . . . . . . . . . . . . 113%‡
* Per share calculations were performed using average shares for the period.† Total return is for the period indicated and has not been annualized. Returns shown do not
reflect the deductions of taxes that a shareholder would pay on Fund distributions or theredemption of Fund shares.
†† Annualized.‡ Portfolio turnover is for the period indicated and has not been annualized.(1) The Fund commenced operations on September 30, 2016.
The accompanying notes are an integral part of the financial statements.
14

THE ADVISORS’ INNER CIRCLE FUND III SGA INTERNATIONAL EQUITY FUND
FINANCIAL HIGHLIGHTSSelected Per Share Data & Ratios
For a Share Outstanding
Investor Shares
Period EndedJanuary 31, 2017(1)
Net Asset Value, Beginning of Period . . . . . . . . . . . . . . . . . . . . . . . . . . . . . . . $ 10.00
Income (Loss) from Investment Operations:Net Investment Loss* . . . . . . . . . . . . . . . . . . . . . . . . . . . . . . . . . . . . . . . . . . (0.02)Net Realized and Unrealized Gain . . . . . . . . . . . . . . . . . . . . . . . . . . . . . . . . 0.05
Total from Investment Operations . . . . . . . . . . . . . . . . . . . . . . . . . . . . . . . . . 0.03
Net Asset Value, End of Period . . . . . . . . . . . . . . . . . . . . . . . . . . . . . . . . . . . . $ 10.03
Total Return† . . . . . . . . . . . . . . . . . . . . . . . . . . . . . . . . . . . . . . . . . . . . . . . . . . 0.30%
Ratios and Supplemental DataNet Assets, End of Period (Thousands) . . . . . . . . . . . . . . . . . . . . . . . . . . . . . . $ 100Ratio of Expenses to Average Net Assets . . . . . . . . . . . . . . . . . . . . . . . . . . . . 1.45%††
Ratio of Expenses to Average Net Assets (Excluding Waivers andReimbursements) . . . . . . . . . . . . . . . . . . . . . . . . . . . . . . . . . . . . . . . . . . . . . 35.48%††
Ratio of Net Investment Loss to Average Net Assets . . . . . . . . . . . . . . . . . . . (0.54)%††
Portfolio Turnover Rate . . . . . . . . . . . . . . . . . . . . . . . . . . . . . . . . . . . . . . . . . . 113%‡
* Per share calculations were performed using average shares for the period.† Total return is for the period indicated and has not been annualized. Returns shown do not
reflect the deductions of taxes that a shareholder would pay on Fund distributions or theredemption of Fund shares.
†† Annualized.‡ Portfolio turnover is for the period indicated and has not been annualized.(1) The Fund commenced operations on September 30, 2016.
The accompanying notes are an integral part of the financial statements.
15

THE ADVISORS’ INNER CIRCLE FUND III SGA INTERNATIONAL EQUITY FUNDJANUARY 31, 2017 (UNAUDITED)
NOTES TO FINANCIAL STATEMENTS
1. Organization:
The Advisors’ Inner Circle Fund III (the “Trust”) is organized as a Delawarestatutory trust under a Declaration of Trust dated December 4, 2013. The Trustis registered under the Investment Company Act of 1940, as amended, as anopen-end management investment company with 17 funds. The financialstatements herein are those of the SGA International Equity Fund (the “Fund”).The investment objective of the Fund is to seek total return, consisting ofcurrent income and long-term capital appreciation. Under normalcircumstances, the Fund invests at least 80% of its net assets, plus anyborrowings for investment purposes, in equity securities. The Fund invests in atleast three countries, and invests at least 40% of its total assets in securities ofnon-U.S. companies. The Fund is classified as a diversified investmentcompany. Strategic Global Advisors, LLC. serves as the Fund’s investmentadviser (the “Adviser”). The Adviser has registered with the National FuturesAssociation as a “Commodity Pool Operator” under the Commodities ExchangeAct with respect to the Fund. The Fund currently offers Institutional Shares andInvestor Shares. The Fund commenced operations on September 30, 2016. Thefinancial statements of the remaining funds of the Trust are presentedseparately. The assets of each fund are segregated, and a shareholder’sinterest is limited to the fund in which shares are held.
2. Significant Accounting Policies:
The following is a summary of the Significant Accounting Policies followed bythe Fund.
Use of Estimates — The Fund is an investment company that applies theaccounting and reporting guidance issued in Topic 946 by the U.S.Financial Accounting Standards Board. The preparation of financialstatements in conformity with U.S. generally accepted accountingprinciples (“U.S. GAAP”) requires management to make estimates andassumptions that affect the fair value of assets and liabilities anddisclosure of contingent assets and liabilities at the date of the financialstatements and the reported amounts of increases and decreases in netassets from operations during the reporting period. Actual results coulddiffer from those estimates and such differences could be material.
Security Valuation — Securities listed on a securities exchange, market orautomated quotation system for which quotations are readily available(except for securities traded on NASDAQ), including securities traded over
16
THE ADVISORS’ INNER CIRCLE FUND III SGA INTERNATIONAL EQUITY FUNDJANUARY 31, 2017 (UNAUDITED)
the counter, are valued at the last quoted sale price on an exchange ormarket (foreign or domestic) on which they are traded on valuation date(or at approximately 4:00 pm ET if a security’s primary exchange isnormally open at that time), or, if there is no such reported sale on thevaluation date, at the most recent quoted bid price. For securities tradedon NASDAQ, the NASDAQ Official Closing Price will be used.
The prices for foreign securities are reported in local currency andconverted to U.S. dollars using currency exchange rates.
Investments in registered investment companies that trade on anexchange are valued at the last sales price or official closing price as of theclose of the customary trading session on the exchange where the securityis principally traded.
Securities for which market prices are not “readily available” are valued inaccordance with fair value procedures established by the Fund’s Board ofTrustees (the “Board”). The Fund’s fair value procedures are implementedthrough a fair value committee (the “Committee”) designated by theBoard. Some of the more common reasons that may necessitate that asecurity be valued using Fair Value Procedures include: the security’strading has been halted or suspended; the security has been de-listedfrom a national exchange; the security’s primary trading market istemporarily closed at a time when under normal conditions it would beopen; the security has not been traded for an extended period of time; thesecurity’s primary pricing source is not able or willing to provide a price; ortrading of the security is subject to local government imposed restrictions.When a security is valued in accordance with the fair value procedures,the Committee will determine the value after taking into considerationrelevant information reasonably available to the Committee.
For securities that principally trade on a foreign market or exchange, asignificant gap in time can exist between the time of a particular security’slast trade and the time at which the Fund calculates its net asset value.The closing prices of such securities may no longer reflect their marketvalue at the time the Fund calculates its net asset value if an event thatcould materially affect the value of those securities (a “Significant Event”)has occurred between the time of the security’s last close and the timethat the Fund calculates net asset value. A Significant Event may relate toa single issuer or to an entire market sector. If the Adviser of the Fundbecomes aware of a Significant Event that has occurred with respect to asecurity or group of securities after the closing of the exchange or market
17

THE ADVISORS’ INNER CIRCLE FUND III SGA INTERNATIONAL EQUITY FUNDJANUARY 31, 2017 (UNAUDITED)
on which the security or securities principally trade, but before the time atwhich the Fund calculates its net asset value, it may request that aCommittee meeting be called.
The Fund uses MarkIt Fair Value (“MarkIt”) as a third party fair valuationvendor. MarkIt provides a fair value for foreign securities in the Fundbased on certain factors and methodologies (involving, generally, trackingvaluation correlations between the U.S. market and each non-U.S.security) applied by MarkIt in the event that there is a movement in theU.S. market that exceeds a specific threshold established by theCommittee. The Committee establishes a “confidence interval” which isused to determine the level of correlation between the value of a foreignsecurity and movements in the U.S. market before a particular security isfair valued when the threshold is exceeded. In the event that thethreshold established by the Committee is exceeded on a specific day, theFund values its non-U.S. securities that exceed the applicable “confidenceinterval” based upon the fair values provided by MarkIt. In such event, it isnot necessary to hold a Committee meeting. In the event that the Adviserbelieves that the fair values provided by MarkIt are not reliable, theAdviser contacts the Administrator and can request that a meeting of theCommittee be held.
If a local market in which the Fund owns securities is closed for one ormore days, the Fund shall value all securities held in that correspondingcurrency based on the fair value prices provided by MarkIt using thepredetermined confidence interval discussed above.
In accordance with U.S. GAAP, the Fund discloses fair value of itsinvestments in a hierarchy that prioritizes the inputs to valuationtechniques used to measure the fair value. The objective of a fair valuemeasurement is to determine the price that would be received to sell anasset or paid to transfer a liability in an orderly transaction betweenmarket participants at the measurement date (an exit price). Accordingly,the fair value hierarchy gives the highest priority to quoted prices(unadjusted) in active markets for identical assets or liabilities (Level 1)and the lowest priority to unobservable inputs (Level 3). The three levelsof the fair value hierarchy are described below:
• Level 1 — Unadjusted quoted prices in active markets for identical,unrestricted assets or liabilities that the Fund has the ability to accessat the measurement date;
18

THE ADVISORS’ INNER CIRCLE FUND III SGA INTERNATIONAL EQUITY FUNDJANUARY 31, 2017 (UNAUDITED)
• Level 2 — Other significant observable inputs (includes quoted pricesfor similar securities, interest rates, prepayment speeds, credit risk,referenced indices, quoted prices in inactive markets, adjustedquoted prices in active markets, adjusted quoted prices on foreignequity securities that were adjusted in accordance with pricingprocedures approved by the Board, etc.); and
• Level 3 — Prices, inputs or exotic modeling techniques which areboth significant to the fair value measurement and unobservable(supported by little or no market activity).
Investments are classified within the level of the lowest significant inputconsidered in determining fair value. Investments classified within Level 3whose fair value measurement considers several inputs may includeLevel 1 or Level 2 inputs as components of the overall fair valuemeasurement.
For the period ended January 31, 2017, there have been no significantchanges to the Fund’s fair valuation methodology.
Federal Income Taxes — It is the Fund’s intention to qualify as a regulatedinvestment company for Federal income tax purposes by complying withthe appropriate provisions of Subchapter M of the Internal Revenue Codeof 1986, as amended. Accordingly, no provisions for Federal income taxeshave been made in the financial statements.
The Fund evaluates tax positions taken or expected to be taken in thecourse of preparing the Fund’s tax returns to determine whether it is“more-likely than-not” (i.e., greater than 50-percent) that each taxposition will be sustained upon examination by a taxing authority basedon the technical merits of the position. Tax positions not deemed to meetthe more-likely-than-not threshold are recorded as a tax benefit orexpense in the current period. The Fund did not record any tax provisionin the current period. However, management’s conclusions regarding taxpositions taken may be subject to review and adjustment at a later datebased on factors including, but not limited to, examination by taxauthorities (i.e., from commencement of operations, as applicable), on-going analysis of and changes to tax laws, regulations and interpretationsthereof.
As of and during the period ended January 31, 2017, the Fund did not havea liability for any unrecognized tax benefits. The Fund recognizes interestand penalties, if any, related to unrecognized tax benefits as income tax
19
THE ADVISORS’ INNER CIRCLE FUND III SGA INTERNATIONAL EQUITY FUNDJANUARY 31, 2017 (UNAUDITED)
expense in the Statement of Operations. During the period, the Fund didnot incur any significant interest or penalties.
Security Transactions and Investment Income — Security transactions areaccounted for on trade date. Costs used in determining realized gains andlosses on the sale of investment securities are based on the specificidentification method. Dividend income and expense are recorded on theex-dividend date. Interest income is recognized on the accrual basis fromsettlement date. Certain dividends from foreign securities will be recordedas soon as the Fund is informed of the dividend if such information isobtained subsequent to the ex-dividend date.
Foreign Currency Translation — The books and records of the Fund aremaintained in U.S. dollars. Investment securities and other assets andliabilities denominated in a foreign currency are translated into U.S.dollars on the date of valuation. The Fund does not isolate that portion ofrealized or unrealized gains and losses resulting from changes in theforeign exchange rate from fluctuations arising from changes in themarket prices of the securities. These gains and losses are included in netrealized and unrealized gains and losses on investments on the Statementof Operations. Net realized and unrealized gains and losses on foreigncurrency transactions represent net foreign exchange gains or losses fromforeign currency exchange contracts, disposition of foreign currencies,currency gains or losses realized between trade and settlement dates onsecurities transactions and the difference between the amount of theinvestment income and foreign withholding taxes recorded on the Fund’sbooks and the U.S. dollar equivalent of the amounts actually received orpaid.
Forward Foreign Currency Exchange Contracts — The Fund may enter intoforward foreign currency exchange contracts to protect the value ofsecurities held and related receivables and payables against changes infuture foreign exchange rates. A forward currency contract is anagreement between two parties to buy and sell currency at a set price ona future date. The market value of the contract will fluctuate with changesin currency exchange rates. The contract is marked-to-market daily usingthe current forward rate and the change in market value is recorded bythe Fund as unrealized gain or loss. The Fund recognizes realized gains orlosses when the contract is closed, equal to the difference between thevalue of the contract at the time it was opened and the value at the time itwas closed. Any realized or unrealized gains (losses) during the period are
20

THE ADVISORS’ INNER CIRCLE FUND III SGA INTERNATIONAL EQUITY FUNDJANUARY 31, 2017 (UNAUDITED)
presented on the Statement of Operations. Risks may arise fromunanticipated movements in the value of a foreign currency relative to theU.S. dollar. Risks may also arise upon entering into these contracts fromthe potential inability of counterparties to meet the terms of theircontracts and are generally limited to the amount of unrealized gain onthe contracts at the date of default. As of January 31, 2017, the Fund hadno open forward foreign currency contracts.
Expenses — Most expenses of the Trust can be directly attributed to aparticular fund. Expenses which cannot be directly attributed to aparticular fund are apportioned among the funds of the Trust based onthe number of funds and/or relative net assets.
Dividends and Distributions to Shareholders — The Fund distributessubstantially all of its net investment income annually. Any net realizedcapital gains are distributed annually. All distributions are recorded on ex-dividend date.
Deferred Offering Costs — Offering costs, including costs of printing initialprospectus, legal and registration fees, are amortized over twelve-monthsfrom inception of the Fund.
Redemption Fees — The Fund retains a redemption fee of 2.00% onredemptions of capital shares held for less than ninety days. For theperiod ended January 31, 2017, the Fund did not retain any fees. Feescollected are retained by the Fund for the benefit of the remainingshareholders and are included in capital shares transactions in theStatement of Changes in Net Assets.
3. Transactions with Affiliates:
Certain officers of the Trust are also employees of SEI Investments GlobalFunds Services (the “Administrator”), a wholly owned subsidiary of SEIInvestments Company, and/or SEI Investments Distribution Co. (the“Distributor”). Such officers are paid no fees by the Trust, other than the ChiefCompliance Officer (“CCO”) as described below, for serving as officers of theTrust.
The services provided by the (“CCO”) and his staff are paid for by the Trust asincurred. The services include regulatory oversight of the Trust’s Advisors andservice providers as required by SEC regulations. The CCO’s services and feeshave been approved by and are reviewed by the Board.
21
THE ADVISORS’ INNER CIRCLE FUND III SGA INTERNATIONAL EQUITY FUNDJANUARY 31, 2017 (UNAUDITED)
4. Administration, Distribution, Shareholder Servicing, Custodian and TransferAgent Agreements:
The Fund and the Administrator are parties to an Administration Agreementunder which the Administrator provides administration services to the Fund.For these services, the Administrator is paid an asset based fee, which will varydepending on the number of share classes and the average daily net assets ofthe Fund. For the period ended January 31, 2017, the Fund paid $36,968 forthese services.
The Fund has adopted the Distribution Plan (the “Plan”) for the Investor Shares.Under the Plan, the Distributor, or third parties that enter into agreementswith the Distributor, may receive up to 0.25% of the Fund’s average daily netassets attributable to Investor Shares. Under the Plan, the Distributor maymake payments pursuant to written agreements to financial institutions andintermediaries such as banks, savings and loan associations and insurancecompanies including, without limit, investment counselors, broker-dealers andthe Distributor’s affiliates and subsidiaries (collectively, “Agents”) ascompensation for services and reimbursement of expenses incurred inconnection with distribution assistance. The Plan is characterized as acompensation plan since the distribution fee will be paid to the Distributorwithout regard to the distribution expenses incurred by the Distributor or theamount of payments made to other financial institutions and intermediaries.The Trust intends to operate the Plan in accordance with its terms and with theFinancial Industry Regulatory Authority (“FINRA”) rules concerning salescharges.
The Fund has adopted a shareholder servicing plan (the “Service Plan”) underwhich a shareholder servicing fee of up to 0.25% of average daily net assets ofInvestor Shares of the Fund will be paid to other service providers. Certainbrokers, dealers, banks, trust companies and other financial representativesreceive compensation from the Fund for providing a variety of services,including record keeping and transaction processing. Such fees are based onthe assets of the Fund that are serviced by the financial representative. Suchfees are paid by the Fund to the extent that the number of accounts servicedby the financial representative multiplied by the account fee charged by theFund’s transfer agent would not exceed the amount that would have beencharged had the accounts serviced by the financial representative beenregistered directly through the transfer agent. All fees in excess of thiscalculated amount are paid by the Adviser. These fees are disclosed on theStatement of Operations as Shareholder Servicing Fees.
22

THE ADVISORS’ INNER CIRCLE FUND III SGA INTERNATIONAL EQUITY FUNDJANUARY 31, 2017 (UNAUDITED)
Brown Brothers Harriman & Co. acts as custodian (the “Custodian”) for theFund. The Custodian plays no role in determining the investment policies of theFund or which securities are to be purchased or sold by the Fund.
DST Systems, Inc. serves as the transfer agent and dividend disbursing agent forthe Fund under a transfer agency agreement with the Trust.
5. Investment Advisory Agreement:
Under the terms of an investment advisory agreement, the Adviser providesinvestment advisory services to the Fund at a fee calculated at an annual rateof 0.95% of the Fund’s average daily net assets. The Adviser has contractuallyagreed to reduce its fees and/or reimburse expenses to the extent necessary tokeep total annual fund operating expenses (excluding interest, taxes, brokeragecommissions, 12b-1 fees, acquired fund fees and expenses and non-routineexpenses (collectively, “excluded expenses”)) for Institutional Shares andInvestor Shares from exceeding certain levels as set forth below untilNovember 30, 2017 (each, a “contractual expense limit”). This agreement maybe terminated by: (i) the Board, for any reason at any time; or (ii) the Adviser,upon ninety (90) days’ prior written notice to the Trust, effective as of the closeof business on November 30, 2017. (the “Expense Limitation”). The Advisermay recover all or a portion of its fee reductions or expense reimbursements,up to the expense cap in place at the time the expenses were waived, within athree-year period from the year in which it reduced its fee or reimbursedexpenses if the Fund’s total annual fund operating expenses are below theExpense Limitation. As of January 31, 2017, the fees which were previouslywaived and reimbursed to the Fund by the Adviser which may be subject topossible future reimbursement, up to the expense cap in place at the time theexpenses were waived and reimbursed to the Fund, to the Adviser were$125,393 expiring in 2020.
6. Investment Transactions:
For the period ended January 31, 2017, the Fund made purchases of$2,675,760 and sales of $1,395,967 in investment securities other than long-term U.S. Government and short-term securities. There were no purchases orsales of long-term U.S. Government securities.
7. Federal Tax Information:
The amount and character of income and capital gain distributions to be paid, ifany, are determined in accordance with Federal income tax regulations, whichmay differ from U.S. GAAP.
23

THE ADVISORS’ INNER CIRCLE FUND III SGA INTERNATIONAL EQUITY FUNDJANUARY 31, 2017 (UNAUDITED)
The Federal tax cost and aggregate gross unrealized appreciation anddepreciation for the investments held (excluding foreign currency) by the Fundat January 31, 2017, were as follows:
Federal TaxCost
AggregateGross
UnrealizedAppreciation
AggregateGross
UnrealizedDepreciation
NetUnrealized
Appreciation
$ 1,275,528 $65,947 $(54,495) $11,452
8. Concentration of Risks:
As with all management investment companies, a shareholder of the Fund issubject to the risk that his or her investment could lose money. The Fund issubject to the principal risks noted below, any of which may adversely affectthe Fund’s net asset value (“NAV”) and ability to meet its investment objective.
Equity Risk — Since it purchases equity securities, the Fund is subject to the riskthat stock prices may fall over short or extended periods of time. Historically,the equity market has moved in cycles, and the value of the Fund’s securitiesmay fluctuate from day to day. Individual companies may report poor results orbe negatively affected by industry and/or economic trends and developments.The prices of securities issued by such companies may suffer a decline inresponse. These factors contribute to price volatility, which is the principal riskof investing in the Fund.
Foreign Company Risk — Investing in foreign companies, including directinvestments and investments through depositary receipts, poses additionalrisks since political and economic events unique to a country or region willaffect those markets and their issuers. These risks will not necessarily affect theU.S. economy or similar issuers located in the U.S. Securities of foreigncompanies may not be registered with the U.S. Securities and ExchangeCommission (the “SEC”) and foreign companies are generally not subject to theregulatory controls imposed on U.S. issuers and, as a consequence, there isgenerally less publicly available information about foreign securities than isavailable about domestic securities. Income from foreign securities owned bythe Fund may be reduced by a withholding tax at the source, which tax wouldreduce income received from the securities comprising the portfolio. Foreignsecurities may also be more difficult to value than securities of U.S. issuers.While depositary receipts provide an alternative to directly purchasing theunderlying foreign securities in their respective national markets andcurrencies, investments in depositary receipts continue to be subject to manyof the risks associated with investing directly in foreign securities.
24
THE ADVISORS’ INNER CIRCLE FUND III SGA INTERNATIONAL EQUITY FUNDJANUARY 31, 2017 (UNAUDITED)
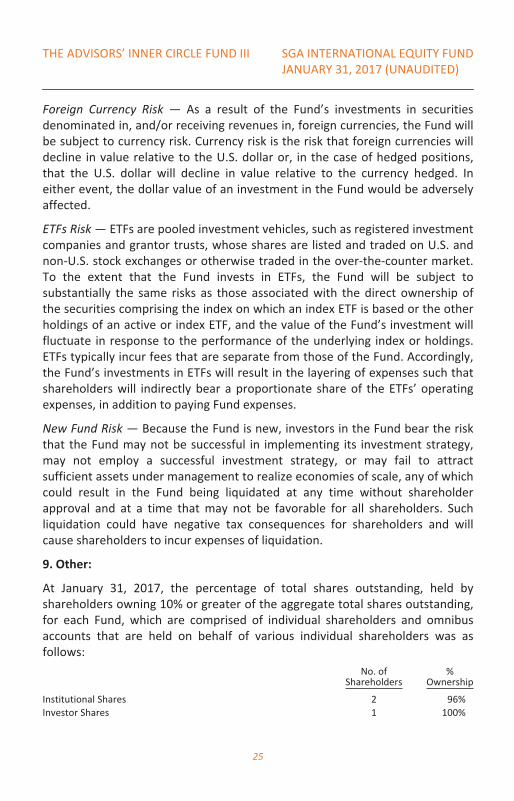
Foreign Currency Risk — As a result of the Fund’s investments in securitiesdenominated in, and/or receiving revenues in, foreign currencies, the Fund willbe subject to currency risk. Currency risk is the risk that foreign currencies willdecline in value relative to the U.S. dollar or, in the case of hedged positions,that the U.S. dollar will decline in value relative to the currency hedged. Ineither event, the dollar value of an investment in the Fund would be adverselyaffected.
ETFs Risk — ETFs are pooled investment vehicles, such as registered investmentcompanies and grantor trusts, whose shares are listed and traded on U.S. andnon-U.S. stock exchanges or otherwise traded in the over-the-counter market.To the extent that the Fund invests in ETFs, the Fund will be subject tosubstantially the same risks as those associated with the direct ownership ofthe securities comprising the index on which an index ETF is based or the otherholdings of an active or index ETF, and the value of the Fund’s investment willfluctuate in response to the performance of the underlying index or holdings.ETFs typically incur fees that are separate from those of the Fund. Accordingly,the Fund’s investments in ETFs will result in the layering of expenses such thatshareholders will indirectly bear a proportionate share of the ETFs’ operatingexpenses, in addition to paying Fund expenses.
New Fund Risk — Because the Fund is new, investors in the Fund bear the riskthat the Fund may not be successful in implementing its investment strategy,may not employ a successful investment strategy, or may fail to attractsufficient assets under management to realize economies of scale, any of whichcould result in the Fund being liquidated at any time without shareholderapproval and at a time that may not be favorable for all shareholders. Suchliquidation could have negative tax consequences for shareholders and willcause shareholders to incur expenses of liquidation.
9. Other:
At January 31, 2017, the percentage of total shares outstanding, held byshareholders owning 10% or greater of the aggregate total shares outstanding,for each Fund, which are comprised of individual shareholders and omnibusaccounts that are held on behalf of various individual shareholders was asfollows:
No. ofShareholders
%Ownership
Institutional Shares 2 96%Investor Shares 1 100%
25

THE ADVISORS’ INNER CIRCLE FUND III SGA INTERNATIONAL EQUITY FUNDJANUARY 31, 2017 (UNAUDITED)
In the normal course of business, the Fund enters into contracts that providegeneral indemnifications. The Fund’s maximum exposure under thesearrangements is dependent on future claims that may be made against theFund and, therefore, cannot be established; however, based on experience, therisk of loss from such claim is considered remote.
10. Regulatory Matters:
In October 2016, the SEC released its Final Rule on Investment CompanyReporting Modernization (the “Rule”). The Rule which introduces two newregulatory reporting forms for investment companies — Form N-PORT andForm N-CEN — also contains amendments to Regulation S-X which impactfinancial statement presentation, particularly the presentation of derivativeinvestments. Although still evaluating the impact of the Rule, managementbelieves that many of the Regulation S-X amendments are consistent with theFund’s current financial statement presentation and expects that the Fund willbe able to comply with the Rule’s Regulation S-X amendments by the August 1,2017 compliance date.
11. Subsequent Events:
The Fund has evaluated the need for additional disclosures and/or adjustmentsresulting from subsequent events through the date the financial statementswere issued. Based on this evaluation, no additional disclosures and/oradjustments were required to the financial statements as of.
26

THE ADVISORS’ INNER CIRCLE FUND III SGA INTERNATIONAL EQUITY FUNDJANUARY 31, 2017 (UNAUDITED)
DISCLOSURE OF FUND EXPENSES
All mutual funds have operating expenses. As a shareholder of a mutual fund,your investment is affected by these ongoing costs, which include (amongothers) costs for Fund management, administrative services, and shareholderreports like this one. It is important for you to understand the impact of thesecosts on your investment returns.
Operating expenses such as these are deducted from the mutual fund’s grossincome and directly reduce your final investment return. These expenses areexpressed as a percentage of the mutual fund’s average net assets; thispercentage is known as the mutual fund’s expense ratio.
The following examples use the expense ratio and are intended to help youunderstand the ongoing costs (in dollars) of investing in your Fund and tocompare these costs with those of other mutual funds. The examples are basedon an investment of $1,000 made at the beginning of the period shown andheld for the entire period from September 30, 2016 to January 31, 2017.
The table on the next page illustrates your Fund’s costs in two ways:
• Actual Fund Return. This section helps you to estimate the actual expensesafter fee waivers that your Fund incurred over the period. The “Expenses PaidDuring Period” column shows the actual dollar expense cost incurred by a$1,000 investment in the Fund, and the “Ending Account Value” number isderived from deducting that expense cost from the Fund’s gross investmentreturn.
You can use this information, together with the actual amount you invested inthe Fund, to estimate the expenses you paid over that period. Simply divideyour ending starting account value by $1,000 to arrive at a ratio (for example,an $8,600 account value divided by $1,000 = 8.6), then multiply that ratio bythe number shown for your Fund under “Expenses Paid During Period.”
• Hypothetical 5% Return. This section helps you compare your Fund’s costswith those of other mutual funds. It assumes that the Fund had an annual 5%return before expenses during the year, but that the expense ratio (Column 3)for the period is unchanged. This example is useful in making comparisonsbecause the Securities and Exchange Commission requires all mutual funds tomake this 5% calculation. You can assess your Fund’s comparative cost bycomparing the hypothetical result for your Fund in the “Expense Paid DuringPeriod” column with those that appear in the same charts in the shareholderreports for other mutual funds.
27
THE ADVISORS’ INNER CIRCLE FUND III SGA INTERNATIONAL EQUITY FUNDJANUARY 31, 2017 (UNAUDITED)
DISCLOSURE OF FUND EXPENSES (Concluded)
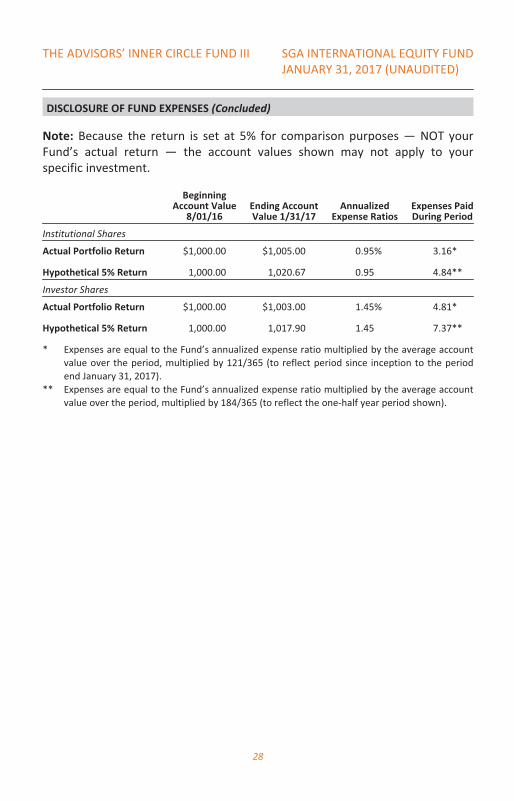
Note: Because the return is set at 5% for comparison purposes — NOT yourFund’s actual return — the account values shown may not apply to yourspecific investment.
BeginningAccount Value
8/01/16Ending AccountValue 1/31/17
AnnualizedExpense Ratios
Expenses PaidDuring Period
Institutional Shares
Actual Portfolio Return $1,000.00 $1,005.00 0.95% 3.16*
Hypothetical 5% Return 1,000.00 1,020.67 0.95 4.84**
Investor Shares
Actual Portfolio Return $1,000.00 $1,003.00 1.45% 4.81*
Hypothetical 5% Return 1,000.00 1,017.90 1.45 7.37**
* Expenses are equal to the Fund’s annualized expense ratio multiplied by the average accountvalue over the period, multiplied by 121/365 (to reflect period since inception to the periodend January 31, 2017).
** Expenses are equal to the Fund’s annualized expense ratio multiplied by the average accountvalue over the period, multiplied by 184/365 (to reflect the one-half year period shown).
28

THE ADVISORS’ INNER CIRCLE FUND III SGA INTERNATIONAL EQUITY FUNDJANUARY 31, 2017 (UNAUDITED)
APPROVAL OF INVESTMENT ADVISORY AGREEMENT
Pursuant to Section 15 of the Investment Company Act of 1940 (the “1940Act”), the Fund’s advisory agreement (the “Agreement”) must be approved:(i) by a vote of a majority of the shareholders of the Fund; and (ii) by the voteof a majority of the members of the Board of Trustees (the “Board” or the“Trustees”) of The Advisors’ Inner Circle Fund III (the “Trust”) who are notparties to the Agreement or “interested persons” of any party thereto, asdefined in the 1940 Act (the “Independent Trustees”), cast in person at ameeting called for the purpose of voting on such approval.
A Board meeting was held on June 23, 2016 to decide whether to approve theAgreement for an initial two-year term. In preparation for the meeting, theTrustees requested that the Adviser furnish information necessary to evaluatethe terms of the Agreement. The Trustees used this information, as well asother information that the Adviser and other service providers of the Fundpresented or submitted to the Board at the meeting, to help them decidewhether to approve the Agreement for an initial two-year term.
Specifically, the Board requested and received written materials from theAdviser and other service providers of the Fund regarding: (i) the nature, extentand quality of the services to be provided by the Adviser; (ii) the Adviser’sinvestment management personnel; (iii) the Adviser’s operations and financialcondition; (iv) the Adviser’s brokerage practices (including any soft dollararrangements) and investment strategies; (v) the Fund’s proposed advisory feeto be paid to the Adviser and overall fees and operating expenses comparedwith a peer group of mutual funds; (vi) the Adviser’s compliance program,including a description of material compliance matters and materialcompliance violations; (vii) the Adviser’s policies on and compliance proceduresfor personal securities transactions; (viii) the Adviser’s investment experience;(ix) the Adviser’s rationale for introducing the Fund as well as the Fund’sproposed objective and strategy; and (x) the Adviser’s performance inmanaging similar accounts.
Representatives from the Adviser, along with other Fund service providers,presented additional information and participated in question and answersessions at the meeting to help the Trustees evaluate the Adviser’s services, feeand other aspects of the Agreement. The Independent Trustees received advicefrom independent counsel and met in executive session outside the presenceof Fund management and the Adviser.
At the Board meeting, the Trustees, including all of the Independent Trustees,based on their evaluation of the information provided by the Adviser and other
29

THE ADVISORS’ INNER CIRCLE FUND III SGA INTERNATIONAL EQUITY FUNDJANUARY 31, 2017 (UNAUDITED)
service providers of the Fund, approved the Agreement. In considering theapproval of the Agreement, the Board considered various factors that theydetermined were relevant, including: (i) the nature, extent and quality of theservices to be provided by the Adviser; and (ii) the fees to be paid to theAdviser, as discussed in further detail below.
Nature, Extent and Quality of Services Provided by the Adviser
In considering the nature, extent and quality of the services to be provided bythe Adviser, the Board reviewed the portfolio management services to beprovided by the Adviser to the Fund, including the quality and continuity of theAdviser’s portfolio management personnel, the resources of the Adviser, andthe Adviser’s compliance history and compliance program. The Trusteesreviewed the terms of the proposed Agreement. The Trustees also reviewedthe Adviser’s proposed investment and risk management approaches for theFund. The most recent investment adviser registration form (“Form ADV”) forthe Adviser was provided to the Board, as was the response of the Adviser to adetailed series of questions which included, among other things, informationabout the investment advisory services to be provided by the Adviser to theFund.
The Trustees also considered other services to be provided to the Fund by theAdviser such as selecting broker-dealers for executing portfolio transactions,monitoring adherence to the Fund’s investment restrictions, and monitoringcompliance with various Fund policies and procedures and with applicablesecurities laws and regulations. Based on the factors above, as well as thosediscussed below, the Board concluded, within the context of its fulldeliberations, that the nature, extent and quality of the services to be providedto the Fund by the Adviser would be satisfactory.
Costs of Advisory Services
In considering the advisory fee payable by the Fund to the Adviser, the Trusteesreviewed, among other things, a report of the proposed advisory fee to be paidto the Adviser. The Trustees also reviewed reports prepared by the Fund’sadministrator comparing the Fund’s net and gross expense ratios and advisoryfees to those paid by a peer group of mutual funds as classified by Lipper, anindependent provider of investment company data. The Trustees reviewed proforma fee and expense information, as well as the management fees chargedby the Adviser to other clients with comparable mandates. The Trusteesconsidered any differences in management fees and took into account therespective demands, resources and complexity associated with the Fund and
30

THE ADVISORS’ INNER CIRCLE FUND III SGA INTERNATIONAL EQUITY FUNDJANUARY 31, 2017 (UNAUDITED)
other client accounts as well as the extensive regulatory, compliance and taxregimes to which the Fund is subject. The Board concluded, within the contextof its full deliberations, that the advisory fee was reasonable in light of thenature and quality of the services expected to be rendered by the Adviser. TheBoard also considered the Adviser’s commitment to managing the Fund and itswillingness to enter into an expense limitation and fee waiver arrangementwith the Fund.
Because the Fund was new and had not commenced operations, it did not yethave an investment performance record and it was not possible to determinethe profitability that the Adviser might achieve with respect to the Fund or theextent to which economies of scale would be realized by the Adviser as theassets of the Fund grow. Accordingly, the Trustees did not make anyconclusions regarding the Fund’s investment performance, the Adviser’sprofitability, or the extent to which economies of scale would be realized bythe Adviser as the assets of the Fund grow, but will do so during futureconsiderations of the Agreement.
Approval of the Agreement
Based on the Board’s deliberations and its evaluation of the informationdescribed above and other factors and information it believed relevant in theexercise of its reasonable business judgment, the Board, including all of theIndependent Trustees, with the assistance of Fund counsel and IndependentTrustees’ counsel, unanimously concluded that the terms of the Agreement,including the fees to be paid thereunder, were fair and reasonable and agreedto approve the Agreement for an initial term of two years. In its deliberations,the Board did not identify any absence of information as material to itsdecision, or any particular factor (or conclusion with respect thereto) or singlepiece of information that was all-important, controlling or determinative of itsdecision, but considered all of the factors together, and each Trustee may haveattributed different weights to the various factors (and conclusions withrespect thereto) and information.
31

NOTES
Strategic Global Advisors FundsP.O. Box 219009
Kansas City, MO 64121-90091-866-778-6397
Investment Adviser:Strategic Global Advisors, LLC
100 Bayview CircleSuite 650
Newport Beach, CA 92660
Administrator:SEI Investments Global Funds Services
One Freedom Valley DriveOaks, PA 19456
Distributor:SEI Investments Distribution Co.
One Freedom Valley DriveOaks, PA 19456
Legal Counsel:Morgan, Lewis & Bockius LLP
1701 Market StreetPhiladelphia, PA 19103
This information must be preceded or accompanied by acurrent prospectus for the Fund described.
SGA-SA-001-0100