Embed Size (px)
Citation preview

REVIEW OF SCIENTIFIC INSTRUMENTS 87, 014502 (2016)
The advanced LIGO input opticsChris L. Mueller,1,a) Muzammil A. Arain,1,b) Giacomo Ciani,1 Ryan. T. DeRosa,2Anamaria Effler,2 David Feldbaum,1 Valery V. Frolov,3 Paul Fulda,1 Joseph Gleason,1Matthew Heintze,1 Keita Kawabe,4 Eleanor J. King,5 Keiko Kokeyama,2 William Z. Korth,6Rodica M. Martin,1 Adam Mullavey,3 Jan Peold,7 Volker Quetschke,8 David H. Reitze,1,c)
David B. Tanner,1 Cheryl Vorvick,4 Luke F. Williams,1 and Guido Mueller11University of Florida, Gainesville, Florida 32611, USA2Louisiana State University, Baton Rouge, Louisiana 70803, USA3LIGO Livingston Observatory, Livingston, Louisiana 70754, USA4LIGO Hanford Observatory, Richland, Washington 99352, USA5University of Adelaide, Adelaide, SA 5005, Australia6LIGO, California Institute of Technology, Pasadena, California 91125, USA7Max-Planck-Institut für Gravitationsphysik, 30167 Hannover, Germany8University of Texas at Brownsville, Brownsville, Texas 78520, USA
(Received 27 July 2015; accepted 19 November 2015; published online 22 January 2016)
The advanced LIGO gravitational wave detectors are nearing their design sensitivity and should begintaking meaningful astrophysical data in the fall of 2015. These resonant optical interferometers willhave unprecedented sensitivity to the strains caused by passing gravitational waves. The input opticsplay a significant part in allowing these devices to reach such sensitivities. Residing between thepre-stabilized laser and the main interferometer, the input optics subsystem is tasked with preparingthe laser beam for interferometry at the sub-attometer level while operating at continuous waveinput power levels ranging from 100 mW to 150 W. These extreme operating conditions requiredevery major component to be custom designed. These designs draw heavily on the experience andunderstanding gained during the operation of Initial LIGO and Enhanced LIGO. In this article, wereport on how the components of the input optics were designed to meet their stringent requirementsand present measurements showing how well they have lived up to their design. C 2016 AIPPublishing LLC. [http://dx.doi.org/10.1063/1.4936974]
I. INTRODUCTION
A worldwide effort to directly detect gravitational radi-ation in the 10 Hz to a few kHz frequency range with largescale laser interferometers (IFOs) has been underway for thepast two decades. In the United States the Laser InterferometerGravitational-Wave Observatories (LIGO) in Livingston, LA(LLO) and in Hanford, WA, (LHO) have been operatingsince the early 2000’s. Initial and Enhanced LIGO (eLIGO)produced several significant upper limits but did not have thesensitivity to make the first direct detection of gravitationalwaves. During this time of operation a significant amountof effort was invested by the LIGO Scientific Collaborationto research and design Advanced LIGO (aLIGO), the firstmajor upgrade of Initial LIGO. In 2011 the Initial LIGOdetectors were decommissioned and installation of these up-grades started. The installation was completed in 2014 andthe commissioning phase has begun for many of the upgradedsubsystems at the LIGO observatories. This paper focuses onthe input optics (IO) of aLIGO.
The main task of the IO subsystem is to take the laser beamfrom the pre-stabilized laser system1 (PSL) and prepare and
a)Electronic mail: [email protected])Present address: KLA-Tencor, Milpitas, California 95035, USA.c)Present address: LIGO Laboratory, California Institute of Technology,
Pasadena, California 91125, USA.
inject it into the main IFO. The PSL consists of a master laser,an amplifier stage, and a 200 W slave laser which is injectionlocked to the amplified master laser. The 200 W output beamis filtered by a short optical ring cavity, the pre-mode cleaner,before it is turned over to the IO (see Figure 1). The PSL pre-stabilizes the laser frequency to a fixed spacer reference cavityusing a tunable sideband locking technique. The PSL alsoprovides interfaces to further stabilize its frequency and power.
The IFO is a dual-recycled, cavity-enhanced Michelsoninterferometer2 as sketched in Figure 2. The field enters the55 m folded power recycling cavity (PRC) through the powerrecycling mirror (PRM). Two additional mirrors (PR2, PR3)within the PRC form a telescope to increase the beam sizefrom ∼2 mm to ∼50 mm (Gaussian beam radius) before thelarge beam is split at the beam splitter and injected into thetwo 4 km arm cavities formed by the input and end test masses.The reflected fields recombine at the BS and send most of thelight back to the PRM where it constructively interferes withthe injected field.3 This leads to a power enhancement insidethe power recycling cavity and provides additional spatial, fre-quency, and amplitude filtering of the laser beam. The secondoutput of the BS sends light into the 55 m long folded signalrecycling cavity4 (SRC) which also consists of a beam reduc-ing telescope (SR2, SR3) and the partially reflective signalrecycling mirror (SRM).
This paper is organized as follows: Section II gives anoverview of the IO; its functions, components, and the
0034-6748/2016/87(1)/014502/16/$30.00 87, 014502-1 © 2016 AIP Publishing LLC This article is copyrighted as indicated in the article. Reuse of AIP content is subject to the terms at: http://scitationnew.aip.org/termsconditions. Downloaded to IP:
128.227.190.138 On: Fri, 22 Jan 2016 19:09:20

014502-2 Mueller et al. Rev. Sci. Instrum. 87, 014502 (2016)
FIG. 1. Sketch of the pre-stabilized laser (PSL) system. Red: Main beam, Green: Pick-off beam. The figure shows the low power master laser, thephase-correcting EOM, the amplifier stage, a high power Faraday isolator, and the high power slave laser. The pre-mode cleaner suppresses higher orderspatial modes of the laser beam. The VCO drives the AOM which shifts the frequency of the pick-off beam, allowing both the reverence cavity and the PMC tobe simultaneously resonant.
general layout. Section III discusses the requirements forthe IO. Section IV presents the core of this paper; it willdescribe individual IO components, their performance in pre-installation tests and the detailed layout of the IO. Section V
discusses the expected and measured in-vacuum performanceas known by the time of writing. The final integrated testingof the IO subsystem at design sensitivity requires the maininterferometer to be nearly fully commissioned to act as a
FIG. 2. Sketch of the main interferometer which consists of two 4 km arm cavities, the beam splitter, and the folded 55 m long power and signal recyclingcavities. The input optics is located between this system and the PSL shown in Figure 1.
This article is copyrighted as indicated in the article. Reuse of AIP content is subject to the terms at: http://scitationnew.aip.org/termsconditions. Downloaded to IP:
128.227.190.138 On: Fri, 22 Jan 2016 19:09:20

014502-3 Mueller et al. Rev. Sci. Instrum. 87, 014502 (2016)
reference for many of the required measurements; this will bediscussed in Section VI.
II. OVERVIEW OF THE INPUT OPTICS
Figure 3 shows a sketch of the first part of the input optics.This part is co-located with the PSL on the same optical tableinside the laser enclosure, outside of the vacuum system. Itprepares the laser beam for the injection into the vacuum sys-tem. The beam from the PSL is first routed through a half-waveplate and a polarizing beam splitter. These two elements forma manual power control stage which is used mainly duringalignment processes on the optical table. The following mirrortransmits 2.5% of the light. This light is used by the arm lengthstabilization (ALS) system during lock acquisition of the maininterferometer.5
Most of the light is sent through an electro-optic modu-lator which modulates the phase of the laser field with threedifferent modulation frequencies. Two of these frequencies areused by the interferometer sensing and control (ISC) systemto sense most of the longitudinal and alignment degrees offreedom of the mirrors inside the IFO and to stabilize thelaser frequency and the alignment of the laser beam into theinterferometer. The third frequency is used to control the inputmode cleaner. The two lenses L1 and L2 mode match the beamto the in-vacuum input mode cleaner (IMC). The next steeringmirror directs the beam through another half-wave plate insidea motorized rotation stage in front of two thin film polarizers.This second power control stage is used during operations toadjust the power to the requested level. The periscope raisesthe height of the beam and steers it into the vacuum system.The top mirror is mounted on a piezo-actuated mirror mount tofine tune the alignment of the beam into the vacuum chamber.A single piezo-actuated mirror is used because the Rayleigh
range of the beam (∼13 m) is too large to allow easy accessto the second degree of freedom with a second piezo-actuatedmirror.
Between the lenses is a wedge to pick off a small fractionof the laser beam for diagnostic purposes. A fast photode-tector monitors the residual amplitude modulation at the phasemodulation frequencies while a second photodetector moni-tors the DC power. A fraction of the main beam also transmitsthrough the bottom periscope mirror and is used to monitor thepower going into the vacuum system as well as the size, shape,and quality of the beam.
Following the periscope, the main beam is sent through ametal tube which includes a mechanical shutter and throughHAM16 into HAM2; all in-vacuum IO components aremounted on seismically isolated optical tables inside HAM2and HAM3. As shown in Figure 4, the beam passes over theFaraday isolator to a second periscope which lowers the beamto the in-vacuum beam height. The next element in the IOis the suspended IMC, a 33 m long (round-trip) triangularcavity. The two flat input and output mirrors, named MC1and MC3, respectively, are located in HAM2 while the thirdcurved mirror, MC2, is located in HAM3. Following MC3 aretwo suspended mirrors, IM1 and IM2, which steer the beamthrough the Faraday isolator. IM3 and IM4 are used to steerthe beam into the PRC. IM2 and IM3 are curved to modematch the output mode of the IMC to the mode of the maininterferometer.
Two of the steering mirrors, IM1 and IM4, transmit asmall fraction of the light creating three different auxiliarybeams which are used to monitor the power and spatial modeof the IMC transmitted beam, of the beam going into the IFO,and of the beam which is reflected from the IFO. The lattertwo beams are routed to IOT2R,7 an optical table on the rightside of HAM2, while the first beam and the field which is
FIG. 3. The IO on the in-air PSL table modulates the phase of the laser beam with the EOM, mode matches the light into the input mode cleaner (located insidethe vacuum system), and controls the power injected into vacuum system.
This article is copyrighted as indicated in the article. Reuse of AIP content is subject to the terms at: http://scitationnew.aip.org/termsconditions. Downloaded to IP:
128.227.190.138 On: Fri, 22 Jan 2016 19:09:20

014502-4 Mueller et al. Rev. Sci. Instrum. 87, 014502 (2016)
FIG. 4. A sketch of the in-vacuum components and beam directions within the input optics in HAM 2 and HAM 3. The red beam is the forward going mainbeam while the green beams are auxiliary beams. The main items in the in-vacuum input optics are the input mode cleaner (IMC) which is formed by the threemirrors MC1, MC2, and MC3; the Faraday isolator (FI); and the four suspended steering mirrors IM1-4 of which IM2 and 3 match the spatial mode of theIMC into the main interferometer. The recycling cavity mirrors PRM, PR2, and PR3 are not part of the input optics. The ISC sled in HAM3 belongs to theinterferometer sensing and control subsystem and provides alignment signals for the recycling cavity.
reflected from MC1 are routed to IOT2L on the left side ofHAM2. The position of the forward going beam through IM4is monitored with an in-vacuum quadrant photodetector whilea large fraction of this beam is also sent to an in-vacuumphotodetector array which is used to monitor and stabilize thelaser power before it is injected into the IFO. Most of the IFOreflected field goes back to the Faraday isolator where it isseparated from the incoming beam. This field is routed intoHAM1 where it is detected to generate length and alignmentsensing signals.
In HAM3, a small fraction of the intra-mode cleanerfield transmits through MC2 onto a quadrant photodetector tomonitor the beam position on MC2. The forward and back-wards traveling waves inside the PRC partly transmit throughPR2 and are routed into HAM1 and to an optical breadboardinside HAM3, respectively. These beams are used by ISC forsensing and control of the interferometer and for diagnosticpurposes. The breadboard uses a lens to image the beam withorthogonal Gouy phases onto two quadrant photodetectors tomonitor beam position and pointing inside the power recy-cling cavity. IOT2R and IOT2L host photodetectors and digitalcameras to monitor the power and beam sizes in each of thepicked-off beams. IOT2L also hosts the photodetectors whichare used by the interferometer sensing and control system togenerate length and alignment sensing signals for the inputmode cleaner.
While the figure shows all key components in the correctsequence, we intentionally left out the detailed beam routing,the baffles used to suppress scattered light and protect allcomponents from the laser beam in case of misalignments, andthe beam dumps to capture all ghost beams.
A complete document tree which contains all design andas-built layouts as well as drawings of all components is avail-able within the LIGO Document Control Center8 (DCC) underdocument number E1201013.9
III. INPUT OPTICS REQUIREMENTS
The aLIGO interferometer can be operated in differentmodes to optimize the sensitivity for different sources.10 Thesemodes are characterized by the input power and the micro-scopic position and reflectivity of the signal recycling mirror.The requirements for the aLIGO input optics are specifiedto simultaneously meet the requirements for all anticipatedscience modes and address all degrees of freedom of the laserfield. Requirements in aLIGO are defined for three distinctfrequency ranges: DC, the control band up to 10 Hz, and thesignal or detection band from 10 Hz to a few kHz. The require-ments in the detection band are defined in terms of linearspectral densities and include a safety factor of ten such that alltechnical noise sources are an order of magnitude less than thesum of the fundamental limiting noise sources. To first order,a perfectly symmetric Michelson interferometer is insensitiveto all input noise sources which is an often overlooked reasonfor its use in the first place. However, all degrees of freedomof the injected laser field couple via some asymmetry to theoutput signal. This drives the requirements in the control bandwhich are usually defined as RMS values. The more criticalrequirements for the IO are as follows.
A. Power
The high power science modes require to inject 125 W ofmode matched light into the interferometer with less than anadditional 5% in higher order modes. The PSL has to deliver165 W of light in an appropriate TEM00 mode. Consequently,the net efficiency of TEM00 optical power transmission fromthe PSL output to the main interferometer has to be above75%. This sets limits on accumulated losses in all opticalcomponents but also limits the allowed thermal lensing inthe EOM, the Faraday isolator, and the power control stages;
This article is copyrighted as indicated in the article. Reuse of AIP content is subject to the terms at: http://scitationnew.aip.org/termsconditions. Downloaded to IP:
128.227.190.138 On: Fri, 22 Jan 2016 19:09:20
014502-5 Mueller et al. Rev. Sci. Instrum. 87, 014502 (2016)
the reflective optics and fused silica lenses are much lesssusceptible to thermal lensing. Efficient power coupling isalso dependent on good mode matching between the recyclingcavities and the arm cavities in the main interferometer.
B. Power control
The injected power into the interferometer has to beadjustable from the control room from minimum to full powerfor diagnostic and operational purposes, to acquire lock of themain interferometer, and to operate between different sciencemodes. The rate of power change (dP/dt) has to be sufficientlysmall to limit the radiation pressure kick inside the IMC andthe main interferometer to a level that can be handled by thelength and alignment control system. It has to be sufficientlyfast to not limit the time to transition to full power after lockacquisition, i.e., it should be possible to change from minimumto maximum power within a few seconds.
Note that minimum power here cannot mean zero powerbecause of the limited extinction ratio of polarizers. Going tozero power requires actuation of the aforementioned mechan-ical shutter which can only be accessed manually between thelaser enclosure and HAM1. The emergency shutter is part ofthe PSL laser system and cuts the laser power at the source.Furthermore, the power control system within the IO is notused for actively stabilizing the laser power within the controlor the detection band.
C. Power fluctuations
Fluctuations in the laser power can couple through manydifferent channels to the error signal used to detect the differ-ential length of the interferometer arms, i.e., the gravitationalwave detection signal. The noise scales with the asymmetriesin the interferometer. Two different mechanisms are expectedto dominate the susceptibility of the interferometer to powerfluctuations. The optical power inside the arm cavities willpush the test masses outwards. Any change in power willcause fluctuations in that pressure which can lead to displace-ment noise at low frequencies. The susceptibility to radiationpressure noise scales with differences in the power build upinside the arm cavities and it is assumed that these differencesare below 1%. At high frequencies, direct coupling of powerfluctuations to the gravitational wave signal limits the allowedpower fluctuations. When the interferometer is held at its oper-ating point the two arm cavities are detuned by a few pm whichcauses some light to leak out to the dark port.11 Gravitationalwaves will modulate these offsets causing the light power atthe dark port to fluctuate. Obviously, power fluctuations in thelaser itself, although highly filtered by the interferometer, willcause similar fluctuations. The relative intensity noise in thedetection band has to be below 2 × 10⁻⁹/
√Hz at 10 Hz increas-
ing with f to 2 × 10⁻⁸/√
Hz at 100 Hz and remaining flat afterthis. Furthermore, the expected seismically excited motion ofthe test masses limits the allowed radiation pressure noise inthe control band to 10−2/
√Hz below 0.2 Hz. Above 0.2 Hz, the
requirements follow two power laws; initially f −7 then f −3,before connecting with the detection band requirement at10 Hz.
The IO does not provide any active element to changeor stabilize the laser power within the control or the detec-tion band. The PSL uses a first loop which stabilizes thelaser power measured with a photodetector on the PSL tableto 2 × 10⁻⁸/
√Hz between 20 and 100 Hz and meeting the
aforementioned requirements above 100 Hz. The PSL furtherstabilizes the injected power in the 20 Hz–100 Hz band withthe photodetector array shown (PSL-PD) in Figure 4 whichis placed after the IMC. The IO has to supply the auxiliarybeam for this array and maintain a sufficiently high correlationwith the injected beam and minimize the chances of additionalpower fluctuations within any of these two beams.
D. Frequency fluctuations
In the detection band, the laser frequency will ultimatelybe stabilized to the common mode of the two arm cavitieswhich are the most stable references available in this frequencyrange. At lower frequencies the arm cavities are not a goodreference and are made to follow the frequency referenceinside of the PSL. The input mode cleaner acts as a frequencyreference during lock acquisition and as an intermediate fre-quency reference during science mode. It is integrated intothe complex and nested laser frequency stabilization system.Based on the expected common mode servo gain the frequencynoise requirements for the IMC are set to
δν( f = 10 Hz)< 50 mHz/√
Hz,
δν( f ≥ 100 Hz)< 1 mHz/√
Hz.
These requirements can be expressed equivalently aslength fluctuations of the IMC:
δℓ( f = 10 Hz)< 3 · 10−15 m/√
Hz,
δℓ( f ≥ 100 Hz)< 6 · 10−17 m/√
Hz.
E. RF modulation frequencies
The main laser field consists of a carrier and multiplepairs of sidebands. The carrier has to be resonant in the armcavities and the power recycling cavity; the resonance condi-tion in the signal recycling cavity depends on the tuning andspecific science mode. One pair of sidebands must be resonantin the power recycling cavity, while the second pair mustresonate in both the power and signal recycling cavity. Themodulation signals of f1 = 9.1 MHz and f2 = 45.5 MHz areprovided by the interferometer sensing and control system.A third modulation frequency of f3 = 24.1 MHz is requiredto sense and control the input mode cleaner. The last pair ofsidebands should be rejected by the input mode cleaner so asnot to interfere with the sensing and control system of the maininterferometer.
F. RF modulation depth
The required modulation depths depend on the final lengthand alignment sensing and control scheme. This scheme islikely to evolve over the commissioning time but the current
This article is copyrighted as indicated in the article. Reuse of AIP content is subject to the terms at: http://scitationnew.aip.org/termsconditions. Downloaded to IP:
128.227.190.138 On: Fri, 22 Jan 2016 19:09:20
014502-6 Mueller et al. Rev. Sci. Instrum. 87, 014502 (2016)
assumption is that a modulation index of 0.4 for a 10 Vpp signaldriving the EOM is more than sufficient. Note that this onlyapplies to the two modulation frequencies which are used forsensing and control of the main interferometer; the modulationindex for the third frequency needs only to be large enough tocontrol the IMC.
The classic phase modulation/demodulation sensingscheme for a single optical cavity measures how much thecavity converts phase modulation into amplitude modulationwhen near resonance. Unfortunately all phase modulators alsomodulate the amplitude of the laser field. This amplitudemodulation can saturate the RF amplifiers and mixers in thedetection chain and generate offsets in the error signals whichhave to be compensated. aLIGO requires that the amplitudemodulation index is less than 10−4 of the phase modulationindex.12
G. RF modulation noise
Changes in the amplitude and phase of the RF modulationsignals can pollute the gravitational wave detection signal bychanging the power buildup of the carrier in the arm cavitiesor through cross coupling in the length and alignment sensingand control schemes. These effects were analyzed by the ISCgroup.10 The analysis uses specifications from a commercialcrystal oscillator manufacturer produced by Wenzel Asso-ciates, Inc. as the expected oscillator phase and amplitudenoise. These specifications for phase noise are 10−5 rad/
√Hz
at 10 Hz falling with 1/ f 3/2 to 3 × 10⁻⁷ rad/√
Hz at 100 Hz andthen a little faster than 1/ f to 2 × 10⁻⁸ rad/
√Hz at a kHz above
which they stay constant.10 The specifications for amplitudenoise are 10−7/
√Hz at 10 Hz falling with 1/f between 10 and
100 Hz and then with 1/
f until 1 kHz above which theystay constant at 3 × 10⁻⁹/
√Hz. These specifications have been
adopted as requirements although the analysis shows that theycould be relaxed at higher frequencies.
H. Beam jitter
Changes in the location and direction of the injected beamcan be described as scattering light from the TEM00 into aTEM10 mode. This light scatters back into the TEM00 modeinside a misaligned interferometer and creates noise in thegravitational wave signal.13 This is an example where noise inthe detection band, here beam jitter, couples to noise in the con-trol band, here tilt of the input test masses. It is expected thatthe test masses will all be aligned to better than 2 nrad RMSwith respect to the nominal optical axis of the interferometer.Under this assumption, the relative amplitude of the injected10-mode has to stay below 10−6/
√Hz at 10 Hz falling with
1/ f 2 until 100 Hz above which the requirement stays constantat 10−8/
√Hz.
I. Optical isolation
The Faraday isolator isolates the IMC from back reflectedlight from the main interferometer. The requirements for theisolation ratio are based on experience gained during the initialyears of operating LIGO and also VIRGO.14 Virgo operated
for a long time without a Faraday isolator between the modecleaner and the main interferometer and encountered prob-lems due to the uncontrolled length between the IMC andIFO15 (a parasitic interferometer). Initial and Enhanced LIGOnever encountered any major problems with insufficient op-tical isolation in the Faraday isolator. The requirements of30 dB for the optical isolation in the Faraday isolator were setbased on the experience in Initial LIGO, taking into accountthe higher injected power.
J. Additional requirements
It is well known that parasitic interferometers and scat-tered light together with mechanically excited surfaces can addfrequency and amplitude noise to a laser beam. The IO adopteda policy to limit the added noise to 10% of the maximumallowed noise (based on the main interferometer sensitivity);note that the allowed frequency and amplitude noise prior tothe input mode cleaner is significantly higher than after themode cleaner. This drives requirements on the residual motionof the optical components, the surface quality of all opticalcomponents and their coatings, and on the placement andefficiency of the optical baffles. The requirement to align the IOdrives requirements on actuation ranges for all optics and, lastbut not the least, the IO has to meet the stringent cleanlinessand vacuum requirements of aLIGO. These requirements arediscussed throughout the paper when relevant.
IV. INPUT OPTICS COMPONENTSAND FINAL LAYOUT
This section will first discuss the individual componentsand their measured performance. This will be followed by adescription of the optical layout which includes a discussionof beam parameters and mode matching between the variousareas.
A. Electro-optic modulators
The electro-optic modulators must use a material capableof withstanding CW optical powers of up to 200 W andintensities up to 25 kW/cm2. At these power levels the inducedthermal lensing, stress induced depolarization, and damagethreshold of the electro-optic material must be taken intoconsideration. Rubidium titanyl phosphate (RTP) was chosenmany years ago over other electro-optic materials, such asrubidium titanyl arsenate (RbTiOAsO4 or RTA) and lithiumniobate (LiNb03), as the most promising modulator materialafter a literature survey, discussions with various vendors,and corroborating lab experiments.16,17 RTP has a very highdamage threshold, low optical absorption, and a fairly highelectro-optical coefficient. Enhanced LIGO allowed for testingof the material and design over a one-year period at 30 W inputpower.18
The aLIGO EOM uses a patented design19 which isvery similar to the one used in eLIGO; both consist of a4 × 4 × 40 mm long wedged RTP crystal (see Figure 5). The2.85 wedges prohibit parasitic interferometers from buildingup inside the crystal and allow for separation of the two
This article is copyrighted as indicated in the article. Reuse of AIP content is subject to the terms at: http://scitationnew.aip.org/termsconditions. Downloaded to IP:
128.227.190.138 On: Fri, 22 Jan 2016 19:09:20

014502-7 Mueller et al. Rev. Sci. Instrum. 87, 014502 (2016)
FIG. 5. Images of the electro-optic modulator. The housing uses two modules; the crystal and the electrodes are placed in the lower module while the uppermodule houses the coils for the three resonant circuits. The left picture shows the inside of the lower module: the aLIGO EOM consists of a wedged RTP crystalwith three pairs of electrodes. The two 15 mm electrodes on the outside are used for the main modulation frequencies f1= 9.1 MHz and f2= 45.5 MHz. The7 mm electrodes in the middle are used for f3= 24.1 MHz. The crystal and the electrodes are clamped between two macor pieces. The right picture shows thefinal modulator (both modules) on a five axis alignment stage.
polarizations of the injected laser field with an extinction ratioof better than 105. This separation avoids polarization rotationwhich could otherwise convert phase modulation to amplitudemodulation. The AR coated surfaces have a rest reflectivity ofless than 0.1%. For aLIGO we use two 15 mm long pairs ofelectrodes for the two main modulation frequencies and one7 mm long pair for the auxiliary frequency used to controlthe IMC. A three electrode scheme was chosen over a singleelectrode design in order to simplify the circuitry designespecially with regard to the fact that the resonant frequenciesmust be precisely tuned after the interferometer lengths aredetermined. Each electrode pair forms a capacitor which is
part of a resonant circuit in the form of a π network where theadditional inductor and capacitor are used to simultaneouslymatch the resonance frequency and create the required 50Ωinput impedance.
After installation and alignment at both sites, initial testsconfirmed that the RTP crystals do not produce a signifi-cant thermal lens. An optical spectrum analyzer was used tomeasure the modulation index as a function of modulationfrequency for each of the three resonant circuits. The resultsare shown in Figure 6. The modulation indices for f1 and f2meet the requirements at both sites while the f3 modulationindex is still a little low, especially at LLO. However, early
FIG. 6. The measured modulation indices for both the Livingston and Hanford EOM with a 24 dBm drive. The data is shown together with a best fit to theexpected circuit response.
This article is copyrighted as indicated in the article. Reuse of AIP content is subject to the terms at: http://scitationnew.aip.org/termsconditions. Downloaded to IP:
128.227.190.138 On: Fri, 22 Jan 2016 19:09:20

014502-8 Mueller et al. Rev. Sci. Instrum. 87, 014502 (2016)
commissioning experience indicates that the modulationindices are sufficient for the aLIGO length and alignmentsensing scheme and it was decided to use the EOM as isfor now and potentially improve the resonant circuits later ifnecessary.
The residual amplitude modulation20 (RFAM) producedby the EOM was also characterized. The AM/PM ratio foreach of the three sidebands was measured to be 1.0 · 10−4,1.2 · 10−5, and 4.1 · 10−5 for the 9.1 MHz, 24.0 MHz, and 45.5MHz sidebands. All three measurements come out to be at orbelow the requirement of 10−4 derived by Kokeyama et al.12
Temporal variation of the RFAM generation was found tobe due primarily to temperature dependence which is able topush the AM/PM ratio at 9.1 MHz as high as 3 · 10−4. Thismay need to be addressed with a temperature stabilizationservo in the future if RFAM is found to be an issue duringdetector commissioning, but the design of the modulator wasleft unchanged until such an issue arises.
Detailed design drawings, assembly instructions, andtest reports are available under LIGO document numberT1300084.21
B. Faraday isolator
The Faraday isolator is a much more complicated opticaldevice compared to the EOM. It is more susceptible to thermallensing and its location after the mode cleaner amplifies therequirement to maintain a good spatial mode. The FI has tohandle between 20 and 130 W of laser power without signifi-cantly altering the beam profile or polarization of the beam.Like the EOM, the aLIGO FI is also very similar to the FIused in eLIGO.18 Both were designed to minimize and mitigatethermal lensing and thermal stress induced depolarization bycompensating these effects in subsequent crystals.22,23
The aLIGO FI design consists of a Faraday rotator, a pairof calcite-wedge polarizers, an element with a negative dn/dTfor thermal-lens compensation, and a picomotor-controlledhalf-wave plate for restoring the optical isolation in-situ. Inaddition, a heat sink is connected to the holders of the magneto-optical crystals to drain excess heat into the FI breadboard.The Faraday rotator is based on an arrangement developed byKhazanov et al.,24 that uses a pair of ∼1 cm long TerbiumGallium Garnet (TGG) crystals as magneto-optical elements,each nominally producing a 22.5 rotation of the electric fieldwhen placed in a magnetic field of about 1T. They are separatedby a ∼1 cm long piece of quartz that rotates the polarizationfield reciprocally by 67.5 ± 0.6. This arrangement (shownschematically at the top of Figure 7) allows thermally inducedbirefringence produced in the first magneto-optical element tobe mostly compensated in the second one. The HWP is a zero-order epoxy-free quartz half-wave plate. It is set to rotate thepolarization by an additional 22.5 to have 0 net rotation inthe forward going and 90 in the backward going direction.
All crystals were selected to minimize absorption, ther-mal beam distortion and surface roughness. Those made ofharder and non-hygroscopic materials, the half-wave plate,quartz rotator, and TGG crystals, are all super-polished (sur-face roughness below 0.5 nm) and received a custom low lossIBS AR coating with a rest reflectivity of less than 300 ppm.
The softer calcite polarizers and the deuterated potassiumdihydrogen phosphate (DKDP) crystal were procured from themanufacturers with their standard polishings and coatings. Thetwo calcite polarizers each have a thickness of ∼5 mm andare wedged at 8.5 to allow the orthogonally polarized beamsto separate sufficiently. The calcite wedges have an extinctionratio of at least 105 and more than 99% optical efficiency.
The magnetic field is created by a stack of seven magne-tized Fe-Nb magnetic disks25 each having a bore of 24 mmand a thickness of 19.7 mm. This stack produces a maximumaxial field of 1.16 T (LLO) and 1.55 T (LHO) near its centerwhich falls off towards the end. The difference in the magneticfield is caused by the selection of the magnetic materials andthe thermal treatment of the individual magnets.26 The TGGcrystals and quartz rotator are installed about 3 cm apart fromeach other before being fine tuned to produce 22.5 of rotationby adjusting their depth in the magnet. The entire FI is mountedon a 648 mm × 178 mm breadboard for convenient transferinto the horizontal access module (HAM) chamber after out-of-vacuum optimization.
After undergoing a thorough cleaning procedure, the FIwas assembled and aligned with the main PSL beam in thelaser enclosure. The optical table in the enclosure is madefrom stainless steel while the optical table in HAM2 is madefrom aluminum. The differences in magnetic susceptibility aresignificant enough to require the FI to be raised with an∼11 cmthick granite block visible in the bottom picture in Figure 7.The bottom periscope mirror in Figure 3 was removed and thebeam was sent via several mirrors through the Faraday isolator.This setting ensured that the beam parameters, beam size,and divergence angle, are very similar to the ones expectedin-vacuum.
The thermal lensing of the Faraday isolator was deter-mined from beam-scan measurements of a sample of the beamafter it was transmitted through the isolator for incident powersas high as 120 W at LLO and 140 W at LHO. At both sites,the diagnostic beam was focused with a lens of 1 m focallength and the beam profile was recorded with CCD or rotatingslit beam scans as a function of power for different DKDPcrystals. The thermal lens at the location of the Faraday wasthen computed using an ABCD matrix algorithm.
Figure 8 shows the thermal lensing measurements for theTGG crystals and different DKDP crystals at LHO and LLO.The magnitude of the thermal lensing in the DKDP is a nearlylinear function of the incident power if all other parameters areequal. In reality the absorption varies from sample to sampleand causes the selection of the DKDP to be somewhat stochas-tic, a fact which is evident in the small difference between the3.0 mm and 3.5 mm measurements at LLO.
The length of the DKDP crystal was chosen to compen-sate the a priori unknown thermal lensing in the TGG crys-tals. Based on experience from Initial and Enhanced LIGO,the expectation was that DKDP crystals between 3.5 mm and5.5 mm would be needed to compensate the thermal lensingin the TGG crystals. However, the absorption in the newlypurchased TGG crystals was lower than expected and even ourshortest crystals overcompensated. While the low absorptionin TGG is obviously good, it required to shorten the originallyordered DKDP. We choose 3.5 mm for both isolators instead
This article is copyrighted as indicated in the article. Reuse of AIP content is subject to the terms at: http://scitationnew.aip.org/termsconditions. Downloaded to IP:
128.227.190.138 On: Fri, 22 Jan 2016 19:09:20

014502-9 Mueller et al. Rev. Sci. Instrum. 87, 014502 (2016)
FIG. 7. Advanced LIGO Faraday isolator (from top to bottom): optical layout, design, and final product.
of the more optimum 3 mm because of concerns that a thinnerDKDP crystal might fracture inside the vacuum chamber un-der thermal stress. Both isolators meet the thermal lensingrequirements for aLIGO.
The isolation ratio was also measured as a function ofinput power. To do so the transmitted beam was reflected backunder a negligibly small angle to allow to separate the returnbeam from the incoming beam. The powers in the beam going
FIG. 8. Left graph: Thermal lens for various DKDP crystals measured in-air as a function of laser power. Right graph: Isolation ratio measured in-air at bothsites. The power is the injected power while the power inside the Faraday isolator is twice as high. Therefore 70 W incident power corresponds to ∼125 Winjected power during science mode when the near impedance matched interferometer reflects less than 10% of the light.
This article is copyrighted as indicated in the article. Reuse of AIP content is subject to the terms at: http://scitationnew.aip.org/termsconditions. Downloaded to IP:
128.227.190.138 On: Fri, 22 Jan 2016 19:09:20

014502-10 Mueller et al. Rev. Sci. Instrum. 87, 014502 (2016)
into and through the FI, and in the return beams in both polar-izations were measured to determine and optimize the opticalefficiency and the isolation ratio as a function of laser power.The results for both Faraday isolators are shown in Figure 8.For these measurements, the power inside the Faraday isolatoris twice the incident power. 70 W incident power or ∼140 Winside the FI is more than the maximum power we expectduring science mode when 125 W are submitted to the nearimpedance matched main interferometer and less than 10 Ware reflected. These results show that the in-air tested Faradayisolators meet the aLIGO requirements.
One problem with this approach of optimizing the isola-tion ratio before installation into the vacuum system is thatthe temperature dependence of the Verdet constant will causethe rotation of the two TGG crystals to shift after installation.This effect also causes a power dependent shift in the rotationangle. The motorized rotation stage allows to adjust the half-wave plate to compensate for these changes and to optimizethe isolation ratio in situ for the injected power. This in-situoptimization is important because it is planned to operateaLIGO with ∼20 W of injected power during the first scienceruns.
Historically, the Faraday isolator has always been one ofthe main sources of optical losses. The aLIGO FI consists ofseven optical elements with a total of fourteen optical surfaceseach contributing to the losses. The TGG crystals and theDKDP crystals are also known for absorbing a non-negligiblefraction of the light, hence the thermal lensing (which alsoreduces the power in the fundamental mode). The next culpritis the polarization rotation between the two polarizers. Ide-ally, the FI would have 0 in the forward and 90 rotation inthe backward direction. This is only possible when the TGGcrystals provide exactly 45 in both directions and the quartzrotator and the half-wave plate combined give exactly ∓45
in the forward and backward direction, respectively. Only theisolation ratio or the optical efficiency can be optimized in-situ by rotating the half-wave plate to compensate the afore-mentioned changes in the Verdet constant when moving fromlow to high power and from air to vacuum. The measuredoptical efficiency of the FI was 96.7% (±0.4%) for up to 70 Winput power at LLO and 97.7% (±0.4%) for up to 140 W atLHO.
Prior to installation of the LLO FI, the half-wave platewas temporarily adjusted to maximize the optical efficiencyrather than the isolation ratio. By measuring the residual powerdumped in transmission of the FI an upper limit was placedon the homogeneity of the polarization rotation as sampledby the beam at 36 ppm. Measuring the isolation ratio in thisconfiguration also allows for a measurement of the excess(or missing) rotation in the Faraday rotator with respect to theideal 45 which came out to be ∼1.6 at LLO.
C. Input mode cleaner
Suspended mode cleaners are a well-researched staple ofinterferometric gravitational wave detectors.27–29 The aLIGOIMC is a resonant triangular cavity consisting of the threemirrors MC1, MC2, and MC3 which form an isosceles triangleas shown in Figure 4. The purpose of the IMC within the input
optics is multifaceted. It suppresses spatial non-uniformitiesof the input laser beam while transmitting the diffractionlimited Gaussian mode. It passively suppresses frequency andpointing noise and serves as a reference for additional activesuppression. In addition, the IMC filters the polarization of theinput beam before being sent to the Faraday isolator. The inputand output couplers (MC1 and MC3, respectively) of the IMCare nominally flat with a transmissivity of 6000 ppm whilethe apex mirror (MC2) has a nominal radius of curvature of27.27 m and a transmissivity of 5 ppm. MC1 and MC3 areseparated by 46.5 cm while the distance between MC2 andMC1/MC3 is 16.24 m. This gives the IMC a free spectral rangeof 9.099 MHz, a finesse of 515, and a cavity pole of 8.72 kHz.
The reflected beam from the IMC is brought out-of-vacuum to the IOT2L table where it is detected with a narrow-band photodetector for length sensing via the Pound-Drever-Hall30 (PDH) technique. Some of the reflected beam is pickedoff and sent to two wavefront sensors,31,32 separated by 90 ofGouy phase, for angular sensing of the IMC. The light leakingthrough MC2 is sent to an in-vacuum quadrant detector foradditional angular information. In addition, a sample of thetransmitted light of the IMC is brought out-of-vacuum to theIOT2L table for diagnostics.
The three mirrors of the IMC are made of fused silica andhave a mass of 2.9 kg. They hang from the aLIGO small tri-ple suspensions33 which provide isolation from seismic noiseproportional to f −6 above the three resonant frequencies near1 Hz for all degrees of freedom except vertical and roll. Thevertical and roll degrees of freedom are isolated with bladesprings which provide isolation proportional to f −4 abovethe two blade spring resonances near 1 Hz. Each stage ofthe suspensions, including the mirror, have small permanentmagnets attached which can be actuated upon with electro-magnets attached to the suspension frame, known as opticalsensing electromagnetic acutators (OSEMs).34,35 The OSEMsalso incorporate shadow sensors which use the magnets asflags to sense the important degrees of freedom of each stage.The actuation strength gets progressively stronger at highersuspension stages with the middle and upper stages having,respectively, an actuation authority at DC that is∼20 times and∼1500 times that of the mirror. Staging the actuation strengthin this way prevents the applied force from spoiling the seismicisolation provided by the suspension.
Length sensing of the IMC is accomplished with the PDHtechnique by adding a 24.0 MHz sideband to the beam via theelectro-optic modulator and sensing the amplitude modulationinduced when the cavity is off resonance. This signal providesan accurate comparison between the round trip length of theIMC and the frequency of the laser which is used to quietthe laser frequency above ∼15 Hz and to quiet the cavitylength below ∼15 Hz. Controlling the cavity length employshierarchical control in which control at lower frequencies isoffloaded to the higher stages of the suspension. The mirrorstage is offloaded to the upper stages at frequencies below∼7 Hz, and the middle stage is offloaded to the top at frequen-cies below ∼100 mHz.
Angular sensing of the relative alignment between theinput beam and the IMC is achieved with differential wavefrontsensing,31,36 a variant of the PDH technique. This technique
This article is copyrighted as indicated in the article. Reuse of AIP content is subject to the terms at: http://scitationnew.aip.org/termsconditions. Downloaded to IP:
128.227.190.138 On: Fri, 22 Jan 2016 19:09:20

014502-11 Mueller et al. Rev. Sci. Instrum. 87, 014502 (2016)
provides independent error signals for all four relative de-grees of freedom and is used to force the cavity to followthe input beam with a bandwidth of ∼500 mHz. In addi-tion, the quadrant detector behind MC2 is used to servo twodegrees of freedom of the input beam with a bandwidth of∼10 mHz.
D. Auxiliary mirror suspensions
The HAM Auxiliary Suspensions (HAUXs), depicted inFigure 9, are single pendulum suspensions with the addition ofblade springs for vertical isolation. The main structure, madeof aluminum, fits in an envelope of 127 × 217 × 441 mm(D × W × H), weighs approximately 6 kg and consistsof a base, two side walls, two horizontal bars supportingfour A-OSEMs (a particular variation of the sensors/actuatorsdescribed in Subsection IV C), a stiffening slab connectingthe two walls and a top part supporting the blade springs. Thestructure is designed and tested to have the lowest structuralresonance above 150 Hz, so as not to interfere with the delicatecontrol loops of the LIGO seismic isolation platform on whichit is installed.
Two 250 mm long, 150 µm diameter steel music wiresrun from the tips of two 77 mm long, 500 µm thick taperedmaraging steel blades down to a lightweight circular aluminumholder containing the optic. The resonant frequencies of theoptic’s displacement and rotational degrees of freedom areall designed to be below 10 Hz which keeps them below theaLIGO measurement band. This is particularly important forthe degrees of freedom that directly couple into beam motion;length, pitch, and yaw. According to a numerical model, thependulum motion around the top suspension point (where thewires leave the blades) and the optic pitch motion aroundthe lowest suspension points (where the wires attach to theoptic holder) combine in two normal modes with frequen-cies just above and below 1 Hz. The same model shows that
the yaw motion around the vertical axis has a slightly lowerresonance at about 0.8 Hz.
The use of an optic holder allows for easy swapping ofthe optic and for the use of passive eddy current damping,while providing support for a balancing threaded rod, to finetune the optic’s pitch, and for the magnets of the four A-OSEMs, without the need of gluing them directly to the optic.The A-OSEMs are arranged in a square pattern thus provid-ing readout and actuation capabilities for the yaw, pitch andpiston degrees of freedom. The A-OSEMs are used for bothbeam pointing and local active damping. Passive eddy currentdamping along the other degrees of freedom is provided bytwo pairs of anti-parallel neodymium magnets attached to themain structure immediately above and below the optic holder;their distance from the holder can be changed to tune thedamping action. A set of fourteen soft-tip stoppers protrudefrom the main structure towards the optic holder and can beused to mechanically limit the motion of the optic as well asto securely clamp it during handling and transportation of thesuspensions.
The HAUXs were assembled on site and characterizedprior to installation by acquiring a complete set of transferfunctions (TFs) from force (torque) applied to the optic todisplacement (rotation) of the optic. For this measurement theA-OSEMs were used as both actuators and sensors. It is worthnoting that, although the role of the suspension is to isolatethe mirror from motion of the ground, measurement of TFsfrom force at the optic to displacement allows to predict theperformance of the suspensions.
TFs were acquired both before and after installation ofeddy current dampers, with the former providing a better toolto verify overall performance of the suspensions, since thedampers broaden the peaks and make it difficult to recognizecritical features in the TFs. Figure 10 shows one example ofsuch a TF (in this case, force versus displacement along thebeam axis) measured for the 4 different suspensions assembled
FIG. 9. The HAUX suspensions are used for the steering mirrors between the mode cleaner and the main interferometer. These are single stage suspensionswith blades for vertical isolation.
This article is copyrighted as indicated in the article. Reuse of AIP content is subject to the terms at: http://scitationnew.aip.org/termsconditions. Downloaded to IP:
128.227.190.138 On: Fri, 22 Jan 2016 19:09:20

014502-12 Mueller et al. Rev. Sci. Instrum. 87, 014502 (2016)
FIG. 10. Top: the length-to-length transfer functions measured for fourHAUX suspensions, plotted together with the prediction from a numericalmodel. The differences between nominally identical suspensions are com-patible with machining and assembly tolerances. The overall shift of all themeasured resonance peaks towards lower frequencies compared to the modelis explainable with inaccuracies in some of the parameters used in the model.Bottom: measured and modeled TF can be made to agree very well withrealistic variations of the model parameters from their nominal value. Here,the model was specifically fine tuned to match the TF measured on IM3.
at LHO, as well as the transfer function calculated from thenumerical model of the suspensions.
The variability between measured transfer functions,particularly the position of the resonance peaks, of nominallyidentical suspensions is well within what can be explained bymachining and assembly tolerances. Since they are of littleconsequence, no mechanism has been incorporated in theHAUX design to allow for post-assembly compensation ofthese errors and fine tuning of the resonances.
Of a different nature is the systematic shift of the resonantfrequencies of all measured TFs (including the ones not shownhere) towards lower values compared to those predicted. It ispossible to explain the observed discrepancy by assuming thatthe actual value of some of the parameters used in the numer-ical model, e.g., material properties or quantities estimatedfrom the CAD drawing, is different from the nominal one.Unfortunately, this procedure yields multiple possible combi-nations of realistic parameter values; the result obtained fromone particular choice of parameters is shown in the bottomof Figure 10. Identifying the correct value of the parameterswould have required a long dedicated measurement campaign;given the time constraints imposed by the aLIGO installa-tion schedule and the fact that a shift of resonances towardslower frequencies is actually an advantage, this was deemedunnecessary.
Regardless of the previous two observations, the transferfunctions show the expected overall behavior and isolation in
the measurement band, and the resonances are all below 10 Hz;the latter is true also for the degrees of freedom that are notnominally sensed by the A-OSEMs, but whose resonances arenevertheless detectable because of cross couplings into the A-OSEMs readout. The HAM auxiliary suspensions thus satisfythe design requirements.
E. Mode matching from the PSLto the main interferometer
In order to couple the maximum amount of light fromthe PSL into the interferometer, it is important that the spatialmode of the laser beam be properly matched to the spatialmode of the resonant interferometers downstream. The inputoptics is responsible for matching the mode from the PSLinto the IMC as well as matching the mode from the IMCinto the interferometer. In both cases Galilean telescopes areused to avoid tightly focused beams and shorten the telescopelengths.
The mode coming from the PSL is defined by the pre-mode cleaner (PMC, Figure 1) which has a waist size of550 µm. This is mode matched to the IMC by a pair of 50 mmdiameter lenses rigidly mounted on the PSL table betweenthe EOM and the power control stage. The first lens has afocal length of −459.5 mm, the second lens has a focal lengthof +1145.6 mm, the separation between the two is 838 mm,and the first lens is placed 890 mm from the PMC waist.The total distance from the PMC waist to the HR surface ofMC1 is roughly 10.9 m. The IMC mode has a waist locatedmidway between MC1 and MC3 (Figure 4) with a size of2.12 mm. The spatial mode of the IMC is mode matched tothe main interferometer by the suspended mirrors IM2 andIM3 (Figure 4) which sit before and after the FI, respectively.The focal length of IM2 is 12.8 m, the focal length of IM3 is−6.24 m, and the separation between them is 1.170 m. IM2is located 1.78 m downstream of the HR surface of MC3, andthe total distance from the HR surface of MC3 to that of PRM(Figure 2) is 4.59 m.
V. PERFORMANCE OF INPUT OPTICS
This section discusses the integrated tests performed onthe input optics after everything was installed into the vacuumsystem. Although the output power of the PSL is capable ofreaching 180 W, LIGO has chosen for technical reasons tooperate at powers below 30 W for the foreseeable future. Thislimitation prevented extended, in-vacuum tests of the FI andIMC at the high powers for which they were designed.
A. Power budget
A power budget of the IO was made at both sites using acalibrated power meter to measure optical powers at variouspoints throughout the system. Optical power at various keypoints in the vacuum system was inferred from these databy using the expected transmissivities of the pickoff mirrors,and power coupling between these key points was inferredfrom these data. Table I shows the calculated power coupling
This article is copyrighted as indicated in the article. Reuse of AIP content is subject to the terms at: http://scitationnew.aip.org/termsconditions. Downloaded to IP:
128.227.190.138 On: Fri, 22 Jan 2016 19:09:20
014502-13 Mueller et al. Rev. Sci. Instrum. 87, 014502 (2016)
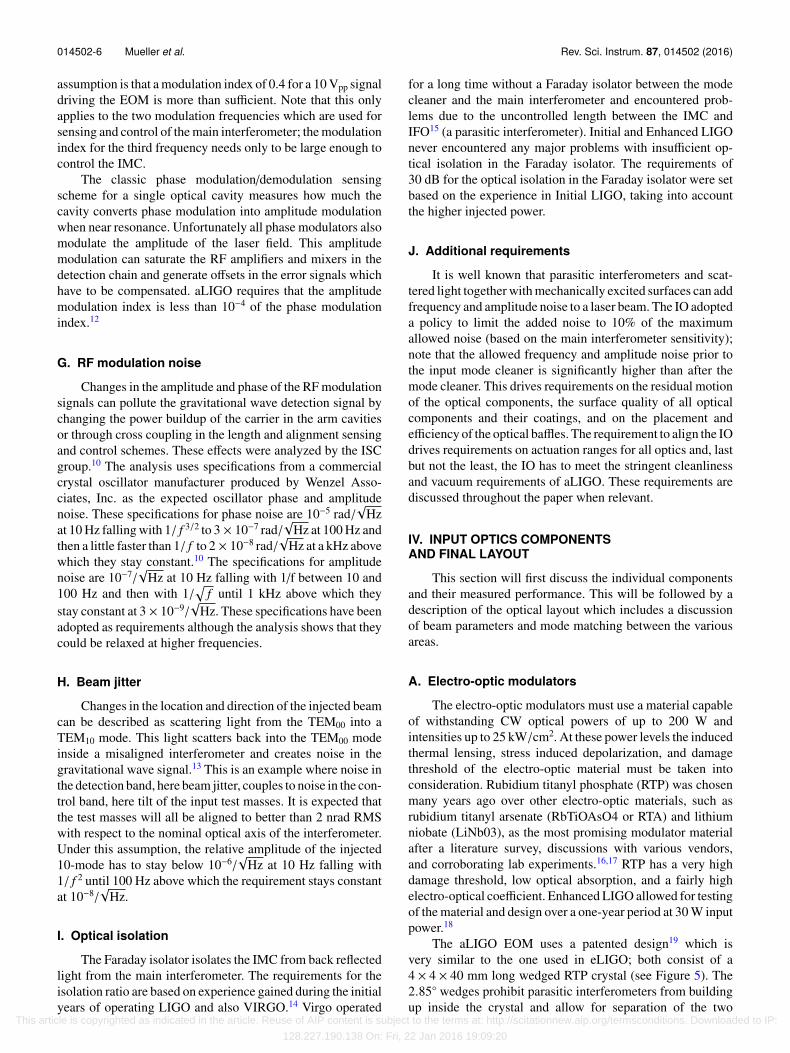
TABLE I. The transmitted power between various points in the input optics.The overall transmissivity of the IO does not include mode matching lossesinto the main interferometer.
Path Transmitted power (%)
PSL to MC1 95.3±1.3IMC mode matching 98.4±0.1IMC transmissivity 92.2±3.1MC3 to PRM 97.9±2.9Full IO: PSL to PRM 84.5±2.5
between the various key points of the IO for LLO (results aresimilar for LHO). Note that the overall IO efficiency of 84.5%does not include the mode mismatch into the interferometer.Measurement of the mode mismatch is complicated since itcompetes with the mode matching between the power recy-cling cavity and the arm cavities as well as the impedance of theinterferometer which, in turn, depends on knowing the precisereflectivity of all of the mirrors. The reflected light from theinterferometer when it is held on resonance sets an upper limiton the mode mismatch of ∼9%.
B. In-vacuum FI isolation ratio
The in-vacuum isolation performance of the Faradayisolator was measured at low power. The measurement wasmade by placing a pair of matched beamsplitters into thelaser beam on the PSL table between lenses L1 and L2 (seeFigure 3), each having a reflectivity of 32%, and a photodiodewas added to the backwards propagating beam from the IFO.With the IMC locked, the angle of PRM was adjusted in orderto maximize the power on the PD. Taking into account thelosses from mode matching to the IMC and the reflectivity ofPRM, an isolation ratio of 29.1 dB was measured at LLO and35.0 dB at LHO. Note that the HWP angle inside the FI was notadjusted to optimize the isolation ratio. The measured isolationratios appear to be sufficient and rotating the HWP in situ wasseen as an unnecessary risk.
C. IMC cavity pole
The IMC, like all optical cavities, acts as a low pass filterto variations in both laser frequency and intensity. The −3 dBpoint of this low pass filter, the so called cavity pole, is afunction of the reflectivity of the mirrors as well as the round-trip losses,
Ω0 =cL
1 − r2
1 − ℓr2
r2
1 − ℓr2
, (1)
where r is the amplitude reflectivity of MC1 and MC3 (as-sumed equal) and ℓ is the round-trip loss.
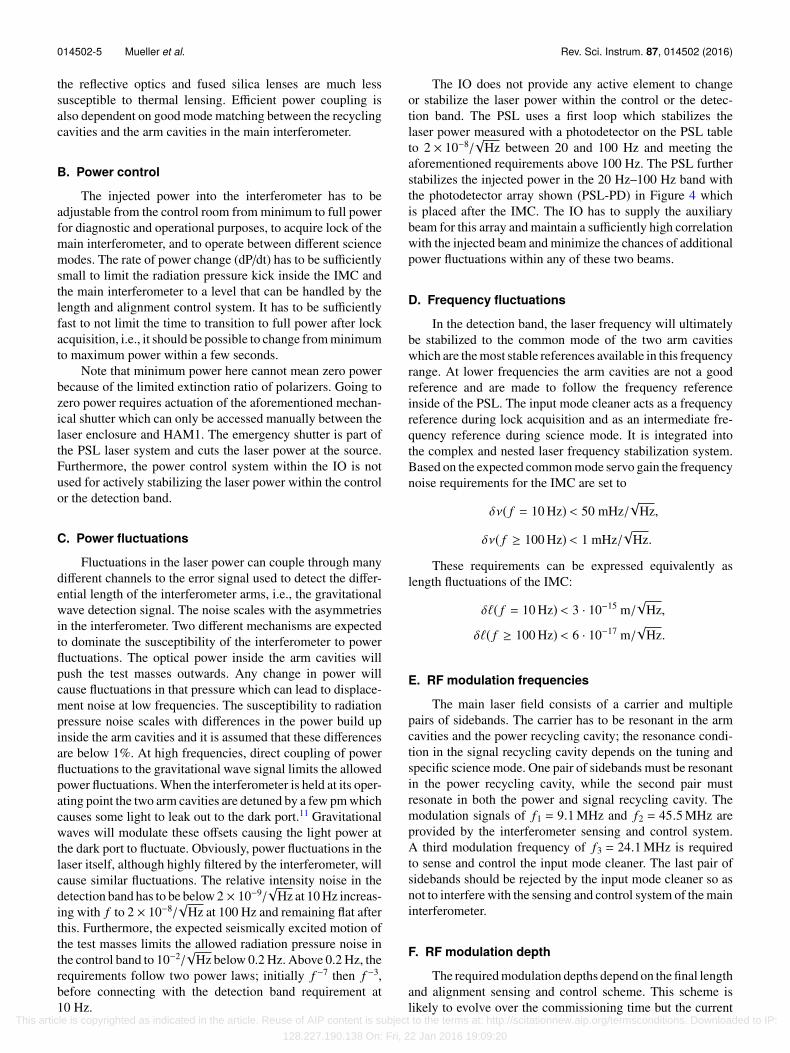
The cavity pole of the IMC was measured by amplitudemodulating the input beam and taking the transfer functionbetween a pickoff of the beam incident on the IMC and apickoff of the beam transmitted by the IMC. Figure 11 showsthe data taken at LLO together with a single pole fit to the data.
FIG. 11. The measured IMC cavity pole is shown together with a simplesingle pole fit and the fit residuals.
The fit has a pole frequency of 8686 ± 108 Hz which gives anIMC finesse of 522. Using the vendor measured transmissivityof MC1 and MC3, this gives a round-trip loss via (1) of ℓ= 164 ± 147 ppm.
D. IMC scattering
Scattering from the IMC mirrors was measured in-situ atLLO using calibrated digital (GigE) cameras. The availableviews of the optics were restricted by the vacuum system tofive different locations which gives seven different views ofthe three optics. The extra two views are due to the fact that thescattering from MC1 and MC3 can be seen in the reflection ofeach other for angles near the beam line. The cameras werecalibrated with a 1.064 µm laser source for various opticalpowers and camera exposure/gain settings.
The surface roughness of the IMC mirrors is required tohave a RMS deviation below 0.1 nm. This puts the mirrorsof the IMC into the smooth surface regime in which the fluc-tuations of the surface height are significantly less than thewavelength of the light. This regime of optical scattering isgoverned by the Rayleigh-Rice theory37 in which the angulardistribution of the scattered light is governed solely by thestatistical properties of the surface height fluctuations.38 Inparticular, the angular distribution of the scattered light isdetermined by a simple mapping from the two-dimensionalpower spectral density of the surface height variations. Eachspatial wavelength can be thought of as a diffraction gratingwhich contributes to the scattering at the first order deflectiongiven by
sin θs = sin θi ±λ
d, (2)
where d is the spatial wavelength of interest.Table II shows the results of these scatter measurements.
The angle of incidence, determined by the IMC geometry, andthe angle of scattering, determined by the available view of theoptic, taken with respect to the optic normal, are shown in thefirst two columns of the table. The second two columns show
This article is copyrighted as indicated in the article. Reuse of AIP content is subject to the terms at: http://scitationnew.aip.org/termsconditions. Downloaded to IP:
128.227.190.138 On: Fri, 22 Jan 2016 19:09:20

014502-14 Mueller et al. Rev. Sci. Instrum. 87, 014502 (2016)
TABLE II. The scattering results for the three mirrors of the input modecleaner. The incident and scattering angles, measured with respect to theoptic normal are shown together with the measured BRDF and the spatialwavelength which leads to diffraction at the scattering angle.
Optic θi (deg) θs (deg) BRDF (10−6 sr−1) d (µm)MC1 44.6 45.9 153 ± 5 66.6MC1 44.6 22.5 0.5 ± 0.1 3.3MC1 44.6 −42.8 0.025 ± 0.001 0.8MC2 0.8 2.0 5569 ± 71 50.8MC2 0.8 61.2 8.9 ± 1.9 1.2MC3 44.6 45.9 95.7 ± 4.6 66.6MC3 44.6 −42.8 0.102 ± 0.002 0.8
the measured bi-directional reflectance distribution function(BRDF) and the spatial wavelength of the surface deforma-tions which lead to scattering at that angle within the Rayleigh-Rice formalism. While the surface scatter of MC1 and MC3are roughly as expected, the surface scatter of MC2 is high bymore than an order of magnitude.
An estimate of the total integrated scatter (TIS) was madefor all three optics by first fitting the measured data to thefunction A/(θs − θi)2, where A is the fitting parameter. Thisfunction is empirically motivated and is typical of surface scat-tering seen from high quality laser line optics.39,40 Integratingthis function over azimuthal angles from π/2 down to thebeam divergence angle gives an estimate of the total scatterof light out of the beam. Doing so gives TIS values of 3.8 ppmfor MC1, 90.2 ppm for MC2, and 5.7 ppm for MC3. Thesemodel-dependent TIS values are only a rough estimate of thetotal scatter; a more accurate measurement would require amore complete measurement of the BRDF as a function ofangle which is not available with the constraints of the vacuumsystem.
E. IMC absorption
The total absorption of the mirrors in the IMC at LLO wasmeasured by tracking the frequency of the resonance of theTEM01 mode while the circulating power was intermittentlyincreased and decreased. For an ideal cavity with sphericalmirrors, the round-trip Gouy phase of the cavity is determinedentirely by the radii of curvature of the mirrors and the dis-tances between them. The location of the TEM01 resonance isdetermined by this round-trip Gouy phase, and measurementof its location therefore provides a precise method for measur-ing changes in the radii of curvature of the mirrors. To firstorder a mirror which is heated by optical absorption deformsspherically.41 Tracking of the location of this resonance whilemodulating the power therefore provides a method of measur-ing the absorption of the mirrors.
The location of the TEM01 resonance was measured bydriving the EOM with the RF output of a network analyzer,adding phase sidebands to the carrier beam which was held onresonance by the control system of the IMC. The signal of aRF photodiode in transmission of the IMC was demodulatedby the network analyzer so that, when the frequency sweptacross the TEM01 resonance, the beating between the sidebandand the carrier mapped out the resonance of the first order
TABLE III. The data and inferred absorption from numerous repetitions ofthe Gouy phase absorption measurements in the IMC. The Power and f01columns show the input power level and location of the TEM01 peak whilethe ∆ f01 and Abs. columns show the shift in this peak between power levelsand the inferred absorption.
Date Power (W) f01 (Hz) ∆ f01 (Hz) Abs. (ppm/mir.)
1/17/20133.11 29 266 891 ± 60
6230 ± 69 2.39 ± 0.0230.5 29 273 121 ± 35
7/23/20130.517 29 268 352 ± 65
245 ± 85 1.50 ± 0.461.034 29 268 597 ± 56
8/6/20130.203 29 267 831 ± 14
358 ± 15 1.42 ± 0.061.011 29 268 189 ± 6.4
9/30/20131.074 29 266 056 ± 39
1175 ± 54 1.53 ± 0.063.076 29 267 230 ± 37
6/17/20141.79 29 877 736 ± 46
2249 ± 79 0.50 ± 0.0110.24 29 875 487 ± 64
mode. In addition, offsets were inserted into the IMC angularcontrol loops in order to keep it slightly misaligned andenhance the relative TEM01 content of the sideband, and asmall portion of the transmitted beam was occluded beforebeing sent to the RFPD to enhance the beat signal betweenthe fundamental mode of the carrier and the TEM01 mode ofthe sideband. This setup was used to monitor the locationof the first order resonance of the IMC while the inputpower was intermittently increased and decreased. Furtherinformation about the details of this technique can be found inRef. 42.
Table III shows the results of several repetitions of thismeasurement at LLO over the course of nearly one and ahalf years. The second column shows the two power levelswhich were used for each measurement, the third columnshows the measured frequencies at those power levels, andthe fourth column shows the shift in the frequencies. The lastcolumn shows the amount of inferred absorption per mirrorbased on a numerical model developed using a finite elementsimulation to calculate the thermal deformation and a FFTbased beam propagation simulation to calculate the shift ofthe resonance. Although the absorption is slightly higher thanwas anticipated, the amount of inferred thermal lensing fromabsorption at this level only leads to a 0.3% reduction in powercoupled into the interferometer.
F. IMC length
The same setup used to measure the IMC absorption wasalso employed to measure the length of the IMC. By hold-ing the length of the IMC slightly off resonance, the phasemodulation (PM) impressed by the network analyzer via theEOM gets converted to amplitude modulation (AM) on eitherside of the cavity’s free spectral range. Precisely on resonancethe magnitude of this PM to AM conversion goes througha minimum, and the phase flips sign. Note that this is thesame effect on which the Pound-Drever-Hall technique forcavity locking is based.30 By scanning the sidebands acrosssuccessive free spectral ranges the length of the IMC wasmeasured at LLO to be 32 947.3 ± 0.1 mm and at LHO to be32 946.6 ± 0.1 mm.
This article is copyrighted as indicated in the article. Reuse of AIP content is subject to the terms at: http://scitationnew.aip.org/termsconditions. Downloaded to IP:
128.227.190.138 On: Fri, 22 Jan 2016 19:09:20
014502-15 Mueller et al. Rev. Sci. Instrum. 87, 014502 (2016)
G. IMC noise budget
The feedback signals to the length and frequency pathsof the IMC control system are a measure of the fluctuationsin these quantities. Understanding the source of these fluctu-ations is important because some noise sources will be sup-pressed either actively or passively while others, e.g., sensingnoises, can be impressed by the control system and inject noiseinto the main interferometer.
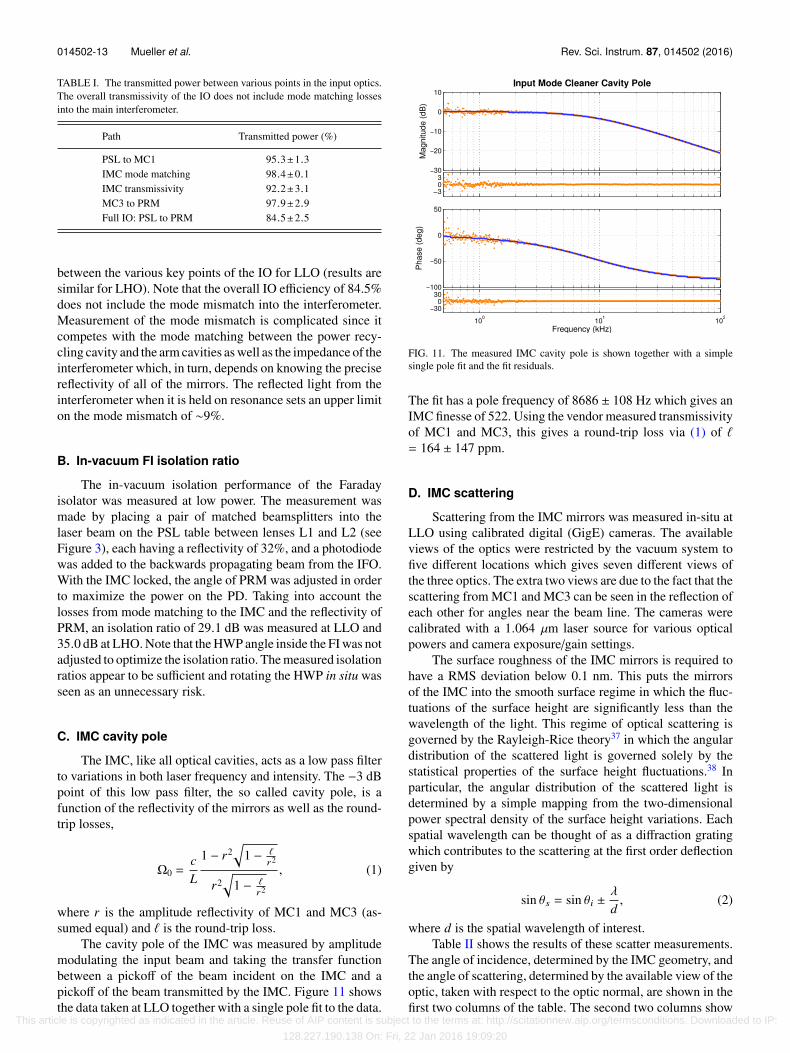
The noise budget for the IMC is shown in Figure 12.The red and orange curves show the feedback signals to thelength and frequency, respectively, and the dashed gray lineshows the coherent sum of these two. The other curves on theplot are a mixture of measured noise and theoretical predic-tions propagated to the error point with a controls model.At low frequencies, below ∼5 Hz, the dominant sources ofnoise are from seismic motion of the mirror suspensions andsensor noise injected through the active control loops. At highfrequencies, above ∼80 Hz, the dominant noise is caused byfrequency noise of the incident laser beam which is created, atleast in part, by vibrations of the injection bench on which thePSL is built (see yellow and orange trace in Figure 12).
The missing noise between 5 Hz and 80 Hz was the subjectof many investigations but is still not fully understood. Thelevel of the noise in this region averages around that shown inFigure 12 but fluctuates on day timescales by as much as anorder of magnitude but never coming down to the level of theunderstood noise.
The measured length control signal in this region indi-cates that the IMC length fluctuations could be significantlyhigher than the requirements set out in Section III. This couldpotentially mean that the frequency noise stability of the laserbeam sent to the interferometer will be a limiting noise sourcefor the advanced LIGO interferometers with the IMC oper-ating in its current state. However, since the source of thenoise is not understood, this is not a foregone conclusion. An
FIG. 12. The noise budget of the aLIGO input mode cleaner. The measurednoise in the length path is shown in red, the measured noise of the frequencypath is shown in orange, and the sum total of these two is shown in dashedgray. The sum total of the understood noises is shown in dashed black, andthe individual terms are discussed in the text.
out-of-loop measurement of the frequency noise requires thefull interferometer to be operational and will be described in afuture publication.
VI. OUTLOOK AND CONCLUSIONS
In summary, we have presented the design of the majorcomponents of the aLIGO input optics in full detail. Ourelectro-optic modulator is capable of simultaneously addingthree RF sidebands with minimal thermal lensing at CWpowers of up to 200 W all while maintaining a RFAM levelbelow 10−4. Our Faraday isolator design provides greater than30 dB of isolation at CW powers of up to 200 W (singlepass) with relatively small thermal lensing. The input modecleaner uses mirrors hanging from the aLIGO triple suspen-sions to provide sensing limited length noise fluctuations of∼1 fm/
√Hz above 10 Hz while transmitting 165 W of CW
laser power. Finally, the HAM auxiliary suspensions isolatethe laser beam from seismic fluctuations above their polefrequencies near 1 Hz while allowing for active control of thepointing of the laser beam into the interferometer.
We also presented a comprehensive set of tests of the fullintegrated input optics system which showed that the indi-vidual components of the input optics continue to function wellwhen integrated into the aLIGO interferometers. We showedthat the full integrated system is capable of delivering 84.5% ofthe incident power to the input of the main interferometer. Weshowed that the Faraday isolators provide greater than 29 dBof isolation at low power, a value which is expected to riseonce the half-wave plate has been optimized. The scatteredlight from the optics of the IMC was measured and foundto be below 6 ppm except for one mirror whose scatteringis expected to come down with a subsequent cleaning. Theabsorption of the IMC was also measured to be consistentlybelow 5 ppm per mirror over the course of nearly one and ahalf years. A noise budget for the IMC was presented whichindicates that the IMC is frequency noise limited above 100 Hzand can therefore serve as a reference for active control of theincident laser frequency variations.
1P. Kwee, C. Bogan, K. Danzmann, M. Frede, H. Kim, P. King, J. Pöld,O. Puncken, R. L. Savage, and F. Seifert, “Stabilized high-power lasersystem for the gravitational wave detector advanced LIGO,” Opt. Express20, 10617–10634 (2012).
2The LIGO Scientific Collaboration, “Advanced LIGO,” Classical QuantumGravity 32, 074001 (2015).
3B. J. Meers, “Recycling in laser-interferometric gravitational-wave detec-tors,” Phys. Rev. D 38, 2317 (1988).
4J. Mizuno, K. A. Strain, P. G. Nelson, J. M. Chen, R. Schilling, A. Rüdiger,W. Winkler, and K. Danzmann, “Resonant sideband extraction: A newconfiguration for interferometric gravitational wave detectors,” Phys. Lett.A 175, 273–276 (1993).
5A. J. Mullavey, B. J. Slagmolen, J. Miller, M. Evans, P. Fritschel, D. Sigg,S. J. Waldman, D. A. Shaddock, and D. E. McClelland, “Arm-length sta-bilisation for interferometric gravitational-wave detectors using frequency-doubled auxiliary lasers,” Opt. Express 20, 81–89 (2012).
6HAM: Horizontal Access Modules are nearly spherical vacuum chamberswith a diameter of about 2.8 m.
7IOT2R: Input Optics Table on the Right side of HAM2.8The LIGO Document Control Center (DCC) is an online repository ofdocuments produced by members of LIGO and the LIGO ScientificCollaboration. It is accessible from any modern web browser at the urlhttps://dcc.ligo.org.
This article is copyrighted as indicated in the article. Reuse of AIP content is subject to the terms at: http://scitationnew.aip.org/termsconditions. Downloaded to IP:
128.227.190.138 On: Fri, 22 Jan 2016 19:09:20

014502-16 Mueller et al. Rev. Sci. Instrum. 87, 014502 (2016)
9G. C. Ciani, D. Feldbaum, J. Gleason, M. Heintze, R. M. Martin, G.Mueller, C. L. Mueller, D. B. Tanner, and L. Williams, “aLIGO input opticsacceptance documentation,” LIGO Document Control Center, E1201013,2012.
10R. Abbott, R. X. Adhikari, S. W. Ballmer, L. Barsotti, M. Evans, P. Fritschel,V. V. Frolov, G. Mueller, B. J. J. Slagmolen, and S. J. Waldman, “AdvancedLIGO length sensing and control final design,” LIGO Document ControlCenter, T1000298, 2010.
11T. T. Fricke, N. D. Smith-Lefebvre, R. Abbott, R. Adhikari, K. L. Dooley, M.Evans, P. Fritschel, V. V. Frolov, K. Kawabe, J. S. Kissel, B. J. J. Slagmolen,and S. J. Waldman, “DC readout experiment in enhanced LIGO,” ClassicalQuantum Gravity 29, 065005 (2012).
12K. Kokeyama, K. Izumi, W. Z. Korth, N. Smith-Lefebvre, K. Arai, and R. X.Adhikari, “Residual amplitude modulation in interferometric gravitationalwave detectors,” J. Opt. Soc. Am. A 31, 81 (2014).
13G. Mueller, “Beam jitter coupling in advanced LIGO,” Opt. Express 13,7118–7132 (2005).
14The VIRGO Collaboration, “Advanced Virgo: A second-generation interfer-ometric gravitational wave detector,” Classical Quantum Gravity 32, 024001(2015).
15F. Acernese et al., “Results of the Virgo central interferometer commission-ing,” Classical Quantum Gravity 21, S395 (2004).
16University of Florida Input Optics Group, “Upgrading the input optics forhigh power operation,” LIGO Document Control Center, T060267, 2006.
17H. Albrecht, P. Villeval, and C. Bonnin, “Study of RTP crystal used aselectro-optic modulator,” in Advanced Solid-State Photonics (Optical So-ciety of America, 2006), p. MB3.
18K. L. Dooley, M. A. Arain, D. Feldbaum, V. V. Frolov, M. Heintze, D. Hoak,E. A. Khazanov, A. Lucianetti, R. M. Martin, and G. Mueller, “Thermaleffects in the input optics of the enhanced laser interferometer gravitational-wave observatory interferometers,” Rev. Sci. Instrum. 83, 033109 (2012).
19V. Quetschke, W. Wu, L. Williams, M. Arain, R. Martin, D. Reitze, D.Tanner, and G. Mueller, “Method and apparatus for modulating light,” USpatent 8,446,657 (2013).
20E. A. Whittaker, M. Gehrtz, and G. C. Bjorklund, “Residual amplitudemodulation in laser electro-optic phase modulation,” J. Opt. Soc. Am. B 2,1320–1326 (1985).
21V. Questchke, J. Gleason, L. Williams, R. M. Martin, and G. Mueller, “Inputoptics acceptance documentation: EOM electro-optic modulator,” LIGODocument Control Center, T1300084, 2013.
22I. Snetkov, I. Mukhin, O. Palashov, and E. Khazanov, “Compensation ofthermally induced depolarization in Faraday isolators for high average po-wer lasers,” Opt. Express 19, 6366–6376 (2011).
23E. Khazanov, N. Andreev, A. Mal’shakov, O. Palashov, A. Poteomkin, A.Sergeev, A. Shaykin, V. Zelenogorsky, I. Ivanov, R. Amin, G. Mueller,D. Tanner, and D. Reitze, “Compensation of thermally induced modaldistortions in Faraday isolators,” IEEE J. Quantum Electron. 40, 1500–1510(2004).
24E. Khazanov, N. Andreev, A. Babin, A. Kiselev, O. Palashov, and D. H.Reitze, “Suppression of self-induced depolarization of high-power laserradiation in glass-based Faraday isolators,” J. Opt. Soc. Am. B 17, 99–102(2000).
25K. Shiraishi, F. Tajima, and S. Kawakami, “Compact Faraday rotator foran optical isolator using magnets arranged with alternating polarities,” Opt.Lett. 11, 82–84 (1986).
26O. V. Palashov, D. S. Zheleznov, A. V. Voitovich, V. V. Zelenogorsky, E. E.Kamenetsky, E. A. Khazanov, R. M. Martin, K. L. Dooley, L. Williams,and A. Lucianetti, “High-vacuum-compatible high-power Faraday isolatorsfor gravitational-wave interferometers,” J. Opt. Soc. Am. B 29, 1784–1792(2012).
27B. Willke, N. Uehara, E. K. Gustafson, R. L. Byer, P. J. King, S. U. Seel,and R. L. Savage, “Spatial and temporal filtering of a 10-w nd: Yag laserwith a Fabry–Perot ring-cavity premode cleaner,” Opt. Lett. 23, 1704–1706(1998).
28A. Araya, N. Mio, K. Tsubono, K. Suehiro, S. Telada, M. Ohashi, and M.-K.Fujimoto, “Optical mode cleaner with suspended mirrors,” Appl. Opt. 36,1446–1453 (1997).
29K. D. Skeldon, K. A. Strain, A. I. Grand, and J. Hough, “Test of an 18-m-longsuspended modecleaner cavity,” Rev. Sci. Instrum. 67, 2443 (1996).
30R. Drever et al., “Laser phase and frequency stabilization using an opticalresonator,” Appl. Phys. B 31, 97–105 (1983).
31E. Morrison, B. J. Meers, D. I. Robertson, and H. Ward, “Automatic align-ment of optical interferometers,” Appl. Opt. 33, 5041–5049 (1994).
32P. Fritschel, N. Mavalvala, D. Shoemaker, D. Sigg, M. Zucker, and G.González, “Alignment of an interferometric gravitational wave detector,”Appl. Opt. 37, 6734–6747 (1998).
33N. A. Robertson, M. Barton, M. Meyer, J. Romie, C. Torrie, and J. Kissel,“Ham triple suspension final design document,” LIGO Document ControlCenter, T0900435, 2009.
34R. Abbott, M. Barton, B. Bland, B. Moore, C. Osthelder, and J. Romie,“Advanced LIGO OSEM final design document,” LIGO Document ControlCenter, T0900286, 2009.
35L. Carbone, S. M. Aston, R. M. Cutler, A. Freise, J. Greenhalgh, J. Heefner,D. Hoyland, N. A. Lockerbie, D. Lodhia, N. A. Robertson, C. C. Speake,K. A. Strain, and A. Vecchio, “Sensors and actuators for the advanced LIGOmirror suspensions,” Classical Quantum Gravity 29, 115005 (2012).
36H. Grote, G. Heinzel, A. Freise, S. Goßler, B. Willke, H. Lück, H. Ward,M. M. Casey, K. A. Strain, D. Robertson, J. Hough, and K. Danzmann,“Automatic beam alignment for the mode-cleaner cavities of GEO 600,”Appl. Opt. 43, 1938–1945 (2004).
37S. Schröder, A. Duparré, L. Coriand, A. Tünnermann, D. H. Penalver, andJ. E. Harvey, “Modeling of light scattering in different regimes of surfaceroughness,” Opt. Express 19, 9820–9835 (2011).
38E. L. Church, H. A. Jenkinson, and J. M. Zavada, “Relationship betweensurface scattering and microtopographic features,” Opt. Eng. 18, 182125(1979).
39F. Magaña Sandoval, R. X. Adhikari, V. Frolov, J. Harms, J. Lee, S. Sankar,P. R. Saulson, and J. R. Smith, “Large-angle scattered light measurementsfor quantum-noise filter cavity design studies,” J. Opt. Soc. Am. A 29,1722–1727 (2012).
40D. Gloge, E. L. Chinnock, and H. E. Earl, “Scattering from dielectricmirrors,” Bell Syst. Tech. J. 48, 511 (1969).
41W. Winkler, K. Danzmann, A. Rüdiger, and R. Schilling, “Heating by op-tical absorption and the performance of interferometric gravitational-wavedetectors,” Phys. Rev. A 44, 7022–7036 (1991).
42C. L. Mueller, P. Fulda, R. X. Adhikari, K. Arai, A. F. Brooks, R.Chakraborty, V. V. Frolov, P. Fritschel, E. J. King, D. B. Tanner, H. Ya-mamoto, and G. Mueller, “In-situ characterization of the thermal state ofresonant optical interferometers via tracking of their higher-order moderesonances,” Classical Quantum Gravity 32, 135018 (2015).
This article is copyrighted as indicated in the article. Reuse of AIP content is subject to the terms at: http://scitationnew.aip.org/termsconditions. Downloaded to IP:
128.227.190.138 On: Fri, 22 Jan 2016 19:09:20


![Advanced LIGO: Science aims, timescales - STFC EMS Italy KAGRA, Japan LIGO ... Input Power [W], (D Horizon, D ... • Calibrated gravitational wave strain is few TB per detector per](https://img.dokumen.tips/doc/110x75/5ad556317f8b9a5c638cf7cc/advanced-ligo-science-aims-timescales-stfc-ems-italy-kagra-japan-ligo-input.jpg)


