Embed Size (px)
Citation preview

The 65+ Population in Israel 2018
2
Facts and Figures 2018This document presents basic data about the elderly population in Israel, with regard to demography, education, economics, social life, health, and services for the elderly. The data includes updated information and indicates notable changes that have occurred over the years. Unless otherwise indicated, the term "elderly" refers to people age 65+, the data are for the year 2015 and they are from The 65+ Population in Israel: Statistical Abstract 2016 (eds. Jenny Brodsky, Yitschak Shnoor and Shmuel Be'er). The Abstract is based on an analysis of data from the Central Bureau of Statistics (CBS), the National Insurance Institute (NII), the Ministry of Health, and the Ministry of Labor and Social Affairs and Services.
3
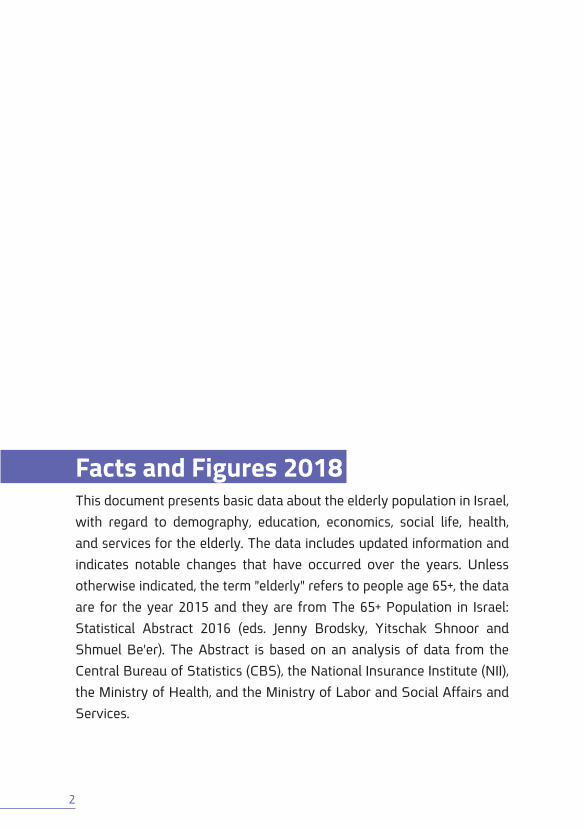
Demography| The Elderly Today and in the FutureIn 2015, the total population of Israel was 8.46 million, of whom 939,000 – 11% – were elderly. One in four households in the country included an elderly person age 65 or more.
Elderly Arabs (Muslims, Christians and Druze) constituted 8% of the elderly population. The Arab population is relatively young and only 4% of the Arab population were elderly, compared with 13% of the population of Jews and others (Jews, non-Arab Christians, and people with no religious classification).
The CBS population projections expect the number of elderly in Israel to reach 1.66 million in 2035. This means that the population of elderly will increase by 77% between 2015 and 2035, and the growth rate will be 2.2 times faster than that of the general population during this time. The percentage of Arabs within the elderly population is expected to increase from 8% in 2015 to 14% in 2035.
Age Pyramid (percentages), 2015
WomenMen
0
100+95-9990-9485-8980-8475-7970-7465-6960-6455-5950-5445-4940-4435-3930-3425-2920-2415-1910-14
5-90-4
7 6 5 4 3 2 1891011 114 5 6 7 8 9 103210
4
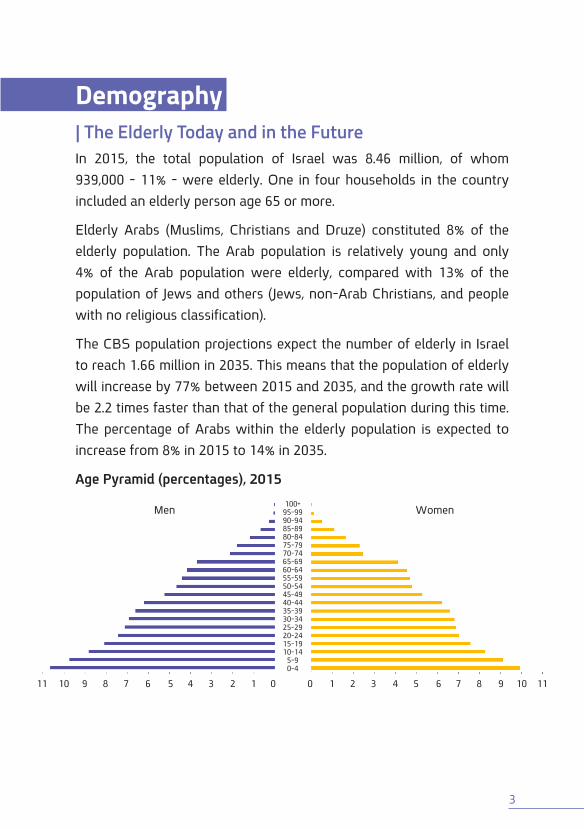
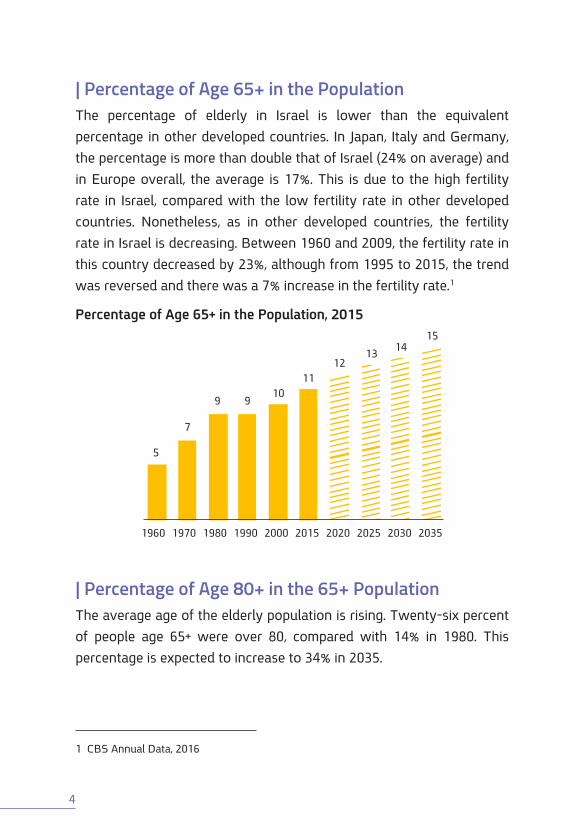
| Percentage of Age 65+ in the PopulationThe percentage of elderly in Israel is lower than the equivalent percentage in other developed countries. In Japan, Italy and Germany, the percentage is more than double that of Israel (24% on average) and in Europe overall, the average is 17%. This is due to the high fertility rate in Israel, compared with the low fertility rate in other developed countries. Nonetheless, as in other developed countries, the fertility rate in Israel is decreasing. Between 1960 and 2009, the fertility rate in this country decreased by 23%, although from 1995 to 2015, the trend was reversed and there was a 7% increase in the fertility rate.1
Percentage of Age 65+ in the Population, 2015
1960 1970 1980 1990 2000 2015 2020 2025 2030 2035
1011
151413
12
5
7
9 9
| Percentage of Age 80+ in the 65+ PopulationThe average age of the elderly population is rising. Twenty-six percent of people age 65+ were over 80, compared with 14% in 1980. This percentage is expected to increase to 34% in 2035.
1 CBS Annual Data, 2016
5
| Percentage of Women2
The percentage of women in the population varies by age, increasing concomitantly with age, reaching 63% in the 85+ cohort. The greater proportion of women among all elderly can be expressed by the “gender-ratio” index, which is the number of men per thousand women. The gender ratio at age 65+ (that is, the number of men age 65+ per thousand women age 65+) is 792. At age 85+, it decreases to 597.
| Place of Birth Twenty-two percent of the Jewish elderly were born in Israel, compared with 73% of the general population. Note that 23% of the elderly immigrated to Israel over the previous 26 years (since 1990), the decisive majority from the former Soviet Union.
| Geographical PerspectiveThirty-eight percent of the elderly were living in Israel’s 8 large cities: Jerusalem, Tel Aviv-Yafo, Haifa, Rishon Leziyyon, Petah Tikva, Ashdod, Beersheva and Netanya (the percentage of the total population living in these cities was 32%).
Although Jerusalem is a relatively “young” city (9% of the country’s elderly live there), as the largest city in Israel, it was home to more elderly people than any other city in the country – 77,000. Bat Yam, Kiryat Yam, Kiryat Motzkin and Haifa had the highest percentages of people per locality (20% on average, 2.3 times greater than that of Jerusalem).
2 CBS, Population Files, 2016

6
The Twenty Localities with the Highest Percentage of Age 65+ (percentages), 2015
16161616171717171818181818191919
20202121
The Twenty Localities with the Highest Number of Age 65+ (in thousands), 2015
910111213161719192727293031343536
55
65
77
National Total
11

7
| Family Status In 2014, 59% of the elderly were married, 26% were widowed, 11% divorced, and 3% single. There were significant differences by sex and by age: while 77% of the elderly men were married (82% of those ages 65-74 and 71% of those age 75+), only 45% of the elderly women were married (59% of those ages 65-74 and 30% of those age 75+).
| Holocaust SurvivorsAccording to updated 2016 data, some 200,000 Holocaust survivors age 70+ were then living in Israel – almost a third of all people in that age cohort. The Holocaust survivors are older than the total elderly population in Israel and the percentage of those age 80+ was 1.4 times greater than in the total population age 70+ (56% vs. 39%, respectively).
| Housing ArrangementsForty-five percent of the elderly living in the community lived with their spouses and no children; 23% lived alone; 12% lived with their spouses and children; 5% lived as single parents with children; and 14% lived in other household arrangements. The elderly not living in the community (approximately 2% of the elderly population) were in institutions (old age homes, hospitals for the chronically ill and nursing care facilities).
| Living Alone3
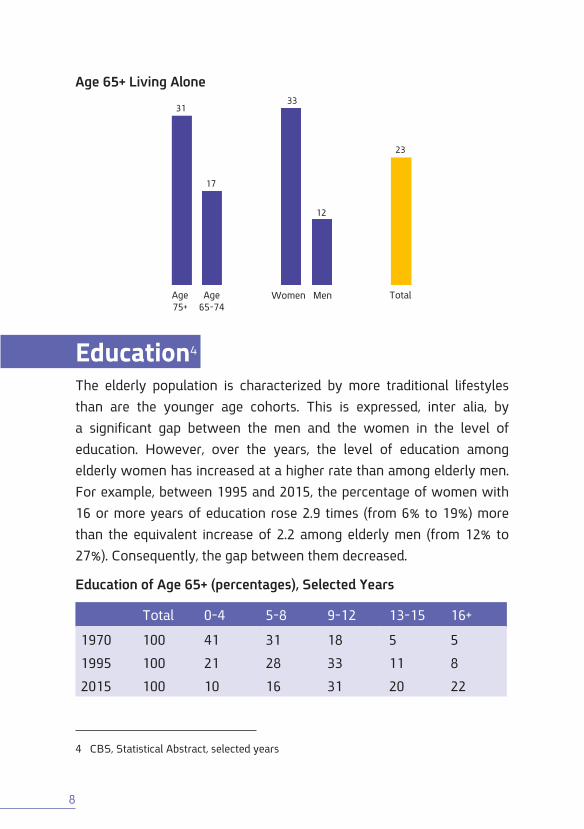
Twenty-three percent of the elderly lived alone. The percentage is higher in other developed countries (e.g., 35% or more in Scandinavian countries). The percentage of elderly living alone increases with age (31% among those age 75+ vs. 17% among those ages 65-74). More women than men were living alone (32% vs. 12%, respectively).
3 Data on elderly living in the community
8
Age 65+ Living Alone
Age 65-74
33
17
31
12
23
Women Men Total
Education4
The elderly population is characterized by more traditional lifestyles than are the younger age cohorts. This is expressed, inter alia, by a significant gap between the men and the women in the level of education. However, over the years, the level of education among elderly women has increased at a higher rate than among elderly men. For example, between 1995 and 2015, the percentage of women with 16 or more years of education rose 2.9 times (from 6% to 19%) more than the equivalent increase of 2.2 among elderly men (from 12% to 27%). Consequently, the gap between them decreased.
Education of Age 65+ (percentages), Selected Years
Total 0-4 5-8 9-12 13-15 16+
1970 100 41 31 18 5 5
1995 100 21 28 33 11 8
2015 100 10 16 31 20 22
4 CBS, Statistical Abstract, selected years
Age 75+

9
Economics| Employment5
Since the 1970s, there has been a significant decrease in the participation rate of people age 65+ in the labor force, particularly among the men. The participation rate among women age 65+ during this time was lower and has remained fairly stable over the years. Since the middle of the first decade of this century, there have been signs of an increase in the participation rate of the elderly in the labor force (both men and women). In 2015, 27% of the men age 65+ participated in the labor force, compared with 14% in 2000, and 11% of the women age 65+, compared with 4% in 2000. Among men and women ages 65-69, the participation rates were 50% and 27%, respectively. Retirement age in Israel is 67 for men and 62 for women.
Participation in Employment, Age 65+ (percentages), Selected Years
☯ Men ☯ Women
20%
345
1970
13%
207
1990
9%
144
2000
19%
2713
2015
| IncomeIn 2015, the average gross monthly income of men age 65+ was NIS 8,684 and that of women age 65+, NIS 5,074. Within this age cohort, 33% of the income of the men and 16% of the income of the women was from earnings from work. Among men age 67+ and women age 62+ who were
5 CBS, Labour Force Survey, selected years
10
not working, the percentage of those receiving a pension from work was 34% in 2005 and 45% in 2015 (54% of the men and 39% of the women).
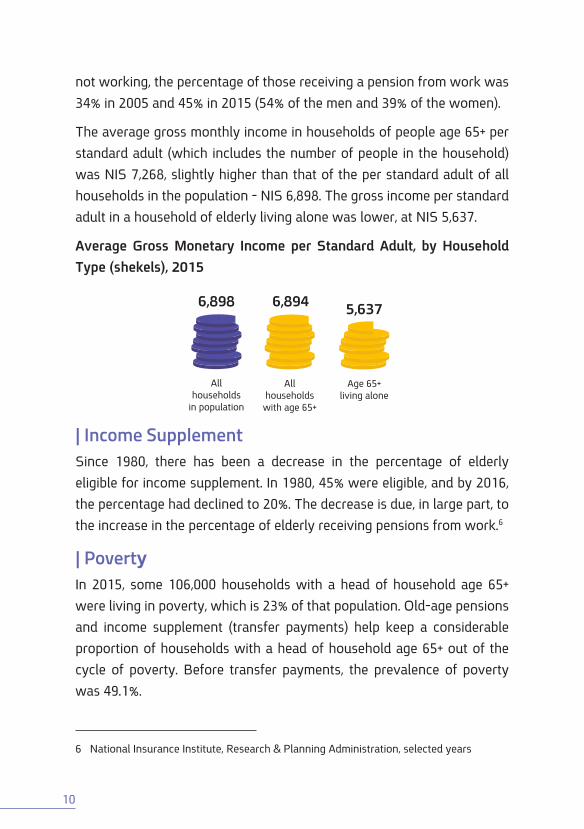
The average gross monthly income in households of people age 65+ per standard adult (which includes the number of people in the household) was NIS 7,268, slightly higher than that of the per standard adult of all households in the population – NIS 6,898. The gross income per standard adult in a household of elderly living alone was lower, at NIS 5,637.
Average Gross Monetary Income per Standard Adult, by Household Type (shekels), 2015
Age 65+ living alone
5,637
All households
in population
6,898
All households with age 65+
6,894
| Income SupplementSince 1980, there has been a decrease in the percentage of elderly eligible for income supplement. In 1980, 45% were eligible, and by 2016, the percentage had declined to 20%. The decrease is due, in large part, to the increase in the percentage of elderly receiving pensions from work.6
| PovertyIn 2015, some 106,000 households with a head of household age 65+ were living in poverty, which is 23% of that population. Old-age pensions and income supplement (transfer payments) help keep a considerable proportion of households with a head of household age 65+ out of the cycle of poverty. Before transfer payments, the prevalence of poverty was 49.1%.
6 National Insurance Institute, Research & Planning Administration, selected years
11
Social Life7
| LonelinessThirty-three percent of the elderly frequently or sometimes felt lonely, compared with 23% of people age 20+. The percentage of elderly women reporting that they frequently or sometimes felt lonely was higher than among elderly men (40% vs. 25%, respectively). The sense of loneliness increases concomitantly with age.
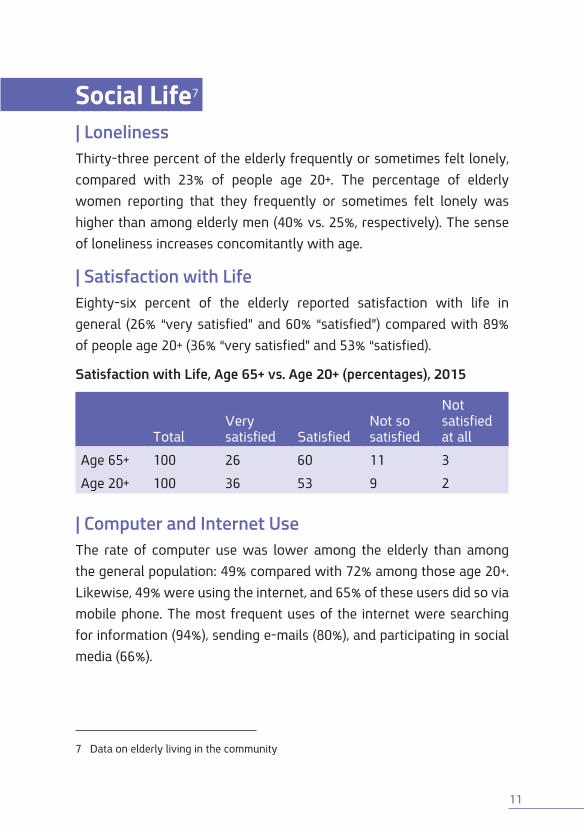
| Satisfaction with LifeEighty-six percent of the elderly reported satisfaction with life in general (26% “very satisfied” and 60% “satisfied”) compared with 89% of people age 20+ (36% “very satisfied” and 53% “satisfied).
Satisfaction with Life, Age 65+ vs. Age 20+ (percentages), 2015
TotalVery satisfied Satisfied
Not so satisfied
Not satisfied at all
Age 65+ 100 26 60 11 3
Age 20+ 100 36 53 9 2
| Computer and Internet UseThe rate of computer use was lower among the elderly than among the general population: 49% compared with 72% among those age 20+. Likewise, 49% were using the internet, and 65% of these users did so via mobile phone. The most frequent uses of the internet were searching for information (94%), sending e-mails (80%), and participating in social media (66%).
7 Data on elderly living in the community
12
Despite the relatively low utilization rate among the elderly, when reviewed over a 13-year period (2002-2015), the rate increased 8.2-fold (from 6% initially to 49% at the end of the period). The equivalent increase among the total population was 2.4-fold (from 32% to 77%). Along with other areas, this illustrates that the gaps between the elderly and younger age cohorts are narrowing with the passing of time.
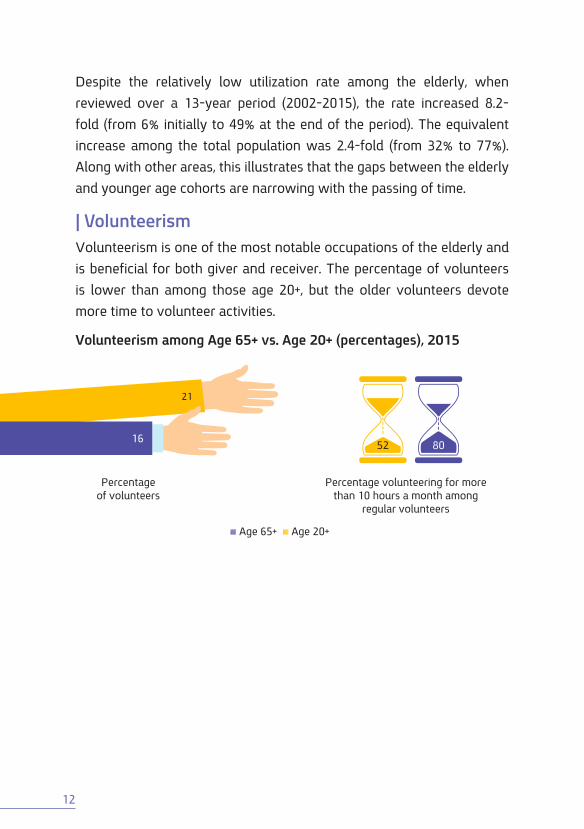
| Volunteerism Volunteerism is one of the most notable occupations of the elderly and is beneficial for both giver and receiver. The percentage of volunteers is lower than among those age 20+, but the older volunteers devote more time to volunteer activities.
Volunteerism among Age 65+ vs. Age 20+ (percentages), 2015
☯ Age 65+ ☯ Age 20+
21
8052
Percentage volunteering for more than 10 hours a month among
regular volunteers
Percentage of volunteers
16
13
Health| Life Expectancy Life expectancy for males at birth in Israel is one of the highest in the world, along with Switzerland, Iceland, Australia, Sweden, Japan and Italy – 81 years. Life expectancy for women in Israel is 2.5 years lower than in Japan, where it is the highest in the world – 84.3 compared with 86.8, respectively. At age 65, life expectancy is 19 years for men and 21 for women and at 80, 8.7 for men and 9.6 for women.
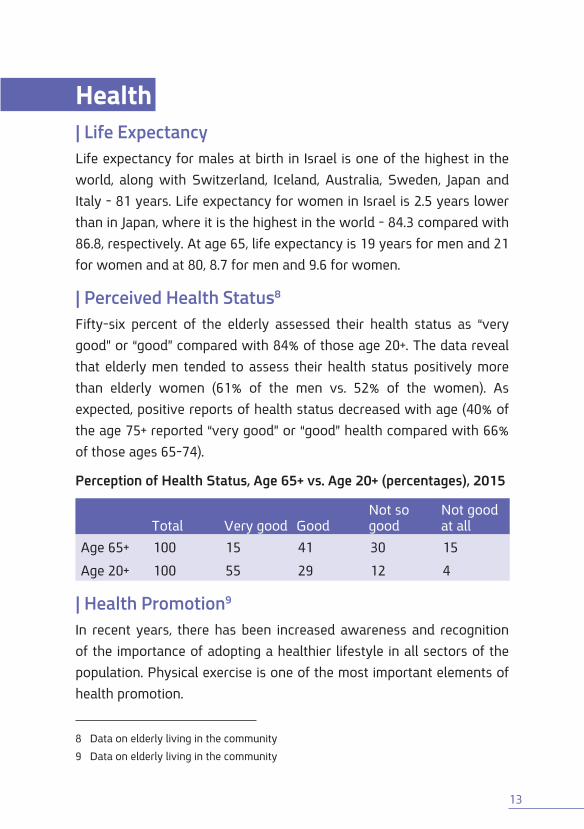
| Perceived Health Status8
Fifty-six percent of the elderly assessed their health status as “very good” or “good” compared with 84% of those age 20+. The data reveal that elderly men tended to assess their health status positively more than elderly women (61% of the men vs. 52% of the women). As expected, positive reports of health status decreased with age (40% of the age 75+ reported “very good” or “good” health compared with 66% of those ages 65-74).
Perception of Health Status, Age 65+ vs. Age 20+ (percentages), 2015
Total Very good GoodNot so good
Not good at all
Age 65+ 100 15 41 30 15
Age 20+ 100 55 29 12 4
| Health Promotion9
In recent years, there has been increased awareness and recognition of the importance of adopting a healthier lifestyle in all sectors of the population. Physical exercise is one of the most important elements of health promotion.
8 Data on elderly living in the community
9 Data on elderly living in the community

14
Forty percent of the elderly engaged in some form of physical exercise (41% of the men and 39% of the women) compared with 35% of those age 20+.10
| Disability11
Elderly with disabilities are defined as those who have great difficulty or are unable to perform activities of daily living (ADL) such as washing and dressing. The number of elderly with disabilities living in the community was estimated at 130,000, 14% of the elderly population living in the community (11% among the men and 17% among the women). The percentage rises with age (7% of those ages 65-74 and 24% of those age 75+). The number of those with limited mobility (walking or climbing stairs) was estimated to be 307,000 – 33% of the elderly population living in the community (28% among the men and 38% among the women). The percentage rises with age (23% of those ages 65-74 and 47% of those age 75+).
| Use of Health Services The rate of health service use among the elderly is higher than among younger age cohorts. For example, the percentage of hospitalizations among the elderly was higher by 50% than among the general population (22% vs. 15%, respectively). Ninety-three percent of those age 65+ had visited the family physician in the previous year and 66% had seen a specialist, compared with 84% and 52% respectively among the general population.12
10 CBS, Society in Israel Report No. 9, Persons Aged 55 and Over, 2017 (2014 data)
11 Data on elderly living in the community
12 CBS, Social Survey Table Generator, 2015
15
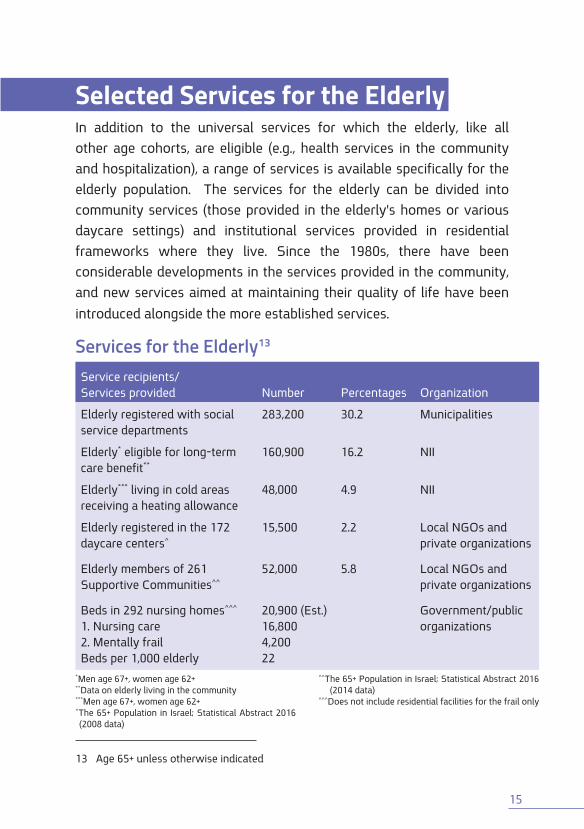
Selected Services for the ElderlyIn addition to the universal services for which the elderly, like all other age cohorts, are eligible (e.g., health services in the community and hospitalization), a range of services is available specifically for the elderly population. The services for the elderly can be divided into community services (those provided in the elderly’s homes or various daycare settings) and institutional services provided in residential frameworks where they live. Since the 1980s, there have been considerable developments in the services provided in the community, and new services aimed at maintaining their quality of life have been introduced alongside the more established services.
Services for the Elderly13
Service recipients/ Services provided Number Percentages Organization
Elderly registered with social service departments
283,200 30.2 Municipalities
Elderly* eligible for long-term care benefit**
160,900 16.2 NII
Elderly*** living in cold areas receiving a heating allowance
48,000 4.9 NII
Elderly registered in the 172 daycare centers^
15,500 2.2 Local NGOs and private organizations
Elderly members of 261 Supportive Communities^^
52,000 5.8 Local NGOs and private organizations
Beds in 292 nursing homes^^^
1. Nursing care2. Mentally frailBeds per 1,000 elderly
20,900 (Est.) 16,8004,20022
Government/public organizations
13 Age 65+ unless otherwise indicated
*Men age 67+, women age 62+**Data on elderly living in the community***Men age 67+, women age 62+^The 65+ Population in Israel; Statistical Abstract 2016 (2008 data)
^^The 65+ Population in Israel; Statistical Abstract 2016 (2014 data)
^^^Does not include residential facilities for the frail only

The 65+ Population in Israel 2018 Editors: Jenny Brodsky, Yitschak Shnoor, Shmuel Beer, Alexa NevilleProduced by Myers-JDC-Brookdale
JDC Hill, PO Box 3886, Jerusalem 91037, Israel Tel: (972-2) 655-7400 Fax: (972-2) 561-2391
[email protected] ■ brookdale.jdc.org.il ■ MJBInstitute