Embed Size (px)
Citation preview

The 2nd International Symposium on Integrated PET-MRI
Luncheon Seminar
Technical Specifications & Clinical Experience from Ingenuity TF PET/MR
Noriyuki Tomiyama Good afternoon, ladies and gentlemen. I’d like to open this luncheon seminar.
My name is Mori Tomiyama from Osaka University, I’ll take chair of this seminar. I’d like to introduce our speaker, Dr. Antonis Kalemis who is a distinguished scientist. I have his résumé here so please let me tell you his record briefly. Dr. Kalemis has an MSc and PhD in medical physics. He has been working for Phillips Healthcare since 2007 and now he is a clinical science manager at Phillips Healthcare. He has a lot of papers, peer-reviewed publications and he is a reviewer of some research grant applications. The title of his presentation is Technical Specifications & Clinical Experience from Ingenuity TF PET/MR. Dr. Kalemis, please. Antonis Kalemis
Thank you very much, I’d like in my turn to thank the organizers of this symposium and also to thank you for the opportunity to speak to you today. My presentation will be slightly different from the ones that we had this morning from the perspective that I won’t be talking about simultaneous acquisition systems but primarily my talk will focus on the system that you are seeing here which is a sequential acquisition system.
First I will try to explain our rationale and what we are doing at Philips in the area of PET/MR in general. And then I will describe the Ingenuity TF PET/MR, some technical characteristics, the components that these consisted of. And then I will continue and describe what we have observed at two out of the three sites that we have the system installed, since the beginning of 2010.
So here we are introducing a brand new modality, essentially. And in doing so there are several questions arising which can be summarized into three main categories. And these categories are whether there is a clinical reason for having PET/MR in the first place. Then it’s also the question that the majority of the presenters before me have addressed whether it’s feasible to have a PET/MR system. And the third, of course comes from the part whether it’s economically feasible both to have a, to build a scanner and also to maintain the scanner, and how this can be funded both for the manufacturer

and for the institution which will be running the system. So in this in Philips we are taking dual a strategy approach, we are addressing
these questions in two ways. The clinical questions we try to address by the system I will be describing later on. And the technical questions by getting into collaborations with different institutions and I will explain very briefly what we are doing in that area. And of course the economical questions are addressed through both of these issues, both of trying to understand what are the costs of developing a clinical system, and also whether there are any reimbursements coming up in the next years, and when that will happen and how.
So, we have collaborated in the past and are currently collaborating in two different projects which are funded by the European Union. Within these the first one is the HYPERImage project which is almost reaching its end. The main focus for that project was to develop the technology for simultaneous PET/MR and also all the knowhow, the software applications for making this happen, such as four dimensional PET/MR, motion attenuation corrections, functional data acquisition techniques, etc.
The SUBLIMA project which is a little bit less know is a project which has just started and the focus here shifts from the component development into system development. And the aim is quite ambitious; we aim to have a clinical system with time of flight (TOF) and depth of interaction (DOI) as well as all the clinical requirements that a modern system has for MR and for PET without compromising either modalities.
I won’t go into detail about this, I don't have the capacity, we’ve got a room of experts. I just want to say, probably you are aware of the news that Philips has our own silicone photomultiplier technology. There were some announcements from Philips research groups and there was also a presentation at the 2009 NSS/MIC [Nuclear Science Symposium and Medical Imaging Conference] where we received some quite positive feedback. The main advance of course as you know very well is that it has a fully digitized counting. We show that we can achieve 190ps timing resolution with the LYSO crystal in two crystals in coincidence. And of course, we managed to have the highest signal-to-noise ratio (SNR) by overcoming the dark-count problem.
So, before we start introducing this technology we had to think about whether it’s clinically meaningful to have that thing out in the field in the first place. And we did some homework quite a few years ago understanding what are the advantages of PET/MR versus the current technology which is PET/CT. And again, as you very well know, the main advantages are you have a superb high soft tissue contrast which allows you to do quite sophisticated applications. You’ve got advanced MRI sequences which

contribute and you are not limited by, of course, the dose to the patient, which this CT portion introduces when you do PET/CT. And this system is, apart from the application that we focused on to see whether it was feasible or not, we saw that the majority of publications which were coming out in the field at that age combining PET/CT with MR was primarily focusing on clinical and molecular imaging research.
So, we believe that a system was useful not just for developing, for a research institution but also for the clinic. And what our requirements for such a system was primarily to have a state-of-the-art PET and MR imaging, so no compromising either of the two modalities in any way. It should be easy to use by technologists and physicians. Definitely whole-body imaging because we believe that although the brain is a very important part of the body that PET/MR can contribute, there are also other applications which PET/MRI will be useful for in the future. And clinically validated and advanced applications for both modalities.
But what does it take to make the transition of PET/MR from being a research tool into being a clinical tool? There are a few requirements. One of them is that you have to have as many sites as possible where they use the system and contributing to the literature, and they add to the knowledge about the clinical advantages of such system in order to provide the evidence for clinical relevance and value for such a modality. And ultimately that will drive reimbursement for different countries of course for PET/MRI combined applications.
So, in order to achieve the reimbursement we had to consider, how many centers can invest actually today in such a scanner. And how many of them would use it just purely for research purposes, in what capacity and in how many countries. Because, don't forget, we don't just need American institutions to work with the system, we want institutions everywhere to use the system and contribute to build the expertise and also the security of the regulatory authorities of the country that at some point will allow the system to be reimbursed the scans from the system to be reimbursed. And how we can fast-track this adoption.
We came up with a proposal, it’s to offer a system that will allow the user to do PET/MR for clinical and translational research, plus you will be able to do clinical MRI and/or clinical PET which is going to be reimbursable today. So a system which allows you to do MR or PET and being reimbursed for that and offset your costs today and also do your PET/MR research. And the system we have introduced in last year’s RSNA [Radiological Society of North America (Annual Conference)] is the Ingenuity TF PET/MR. We received the CE mark which allows us to sell the system for clinical use in Europe last week. We have filed a 510(k) approval which is pending and we hope that

we will have it by February for the US market. And of course then for each individual market it needs to be localized and file the application with the local regulatory authority.
So, what is it comprised of? Two systems basically, quite familiar to the audience. The first one, this is the components of the system will be shipped from the factory in 2011. So our, there are differences with the currently installed systems and I will explain what are those. The MR component is the Achieva 3T TX with the multi-transmitter capability for the gradient. In the current system it’s not the TX series it’s the X series which has a single transmit. And the PET component is our Ingenuity TF camera with the capability of the Astonish TF which is a new, brand new product and I will explain what’s that later on. And of course, with the fastest timing resolution on the market. Again, the current systems which are in Mount Sinai [School of Medicine], and in Geneva, and in Dresden are with the Gemini, not the Ingenuity.
So, in a nutshell I will explain what we think are the advantages of the system from the MR perspective, first of all. We mainly focus on the gradient technology, so with the dual, with the simultaneous transmit you will be able to do 40% faster acquisitions than the standard Achiever systems. You have enhanced uniformity of the field of view (FOV) because of the multi-transmit and of course enhanced consistency between different patients; so you are not now any more being limited, you still have some limitations but at least the extent of the limitations that you had between thin and more obese patients because of the size has been reduced. And of course you have better SNR and a very fast reconstructor to back up all this.
Just some examples of what is possible, this is a diffusion weighted image with the standard gradients and this is with the quasar dual gradients. Exactly the same characteristics of the sequence but if you see here there are quite big differences in the resolution of the image.
This is an image of the pelvis, this is with the single transmit and this is the dual transmit. And you observe 35% almost faster acquisitions.
And also with homogeneity it is another example of breast imaging, this is again with the Achiever X series and this is with the Achiever TX. So you have enhanced uniformity and contrast without actually having to do anything more than just your standard protocols in the MR. And I will now speak a little bit about the PET. Actually my background is in nuclear medicine so I have to ask you to excuse my ignorance for the MR that's why I try to go through the [previous] slides as fast as possible before.
So the Ingenuity TF PET/MR is basically based on the continuous detector

design technology which it is consistent in all of our scanners. The pixel detector has 28,000 almost [presentation slide shows 28,336] crystals 4x4x22mm, and optically connected panels. So you've got seven photomultiplier tubes (PMT) detecting each event. This gives the benefit that the light collection drops off only at the edges of the FOV and not within the FOV like with the block detector design. You've got very small light collection variability which allows us to have an energy resolution of less than 12% and that also allows us to have a very good timing resolution.
Now we had to modify the system as it was in the PET/CT from [=for] the PET/MR in order to overcome problems with the crosstalk. This is an individual PMT in the Ingenuity TF PET/CT and this is basically we shield each individual PMT tube and also apart from the shielding we also have to re-orientate the tubes in order to be parallel with the magnetic field. So this is how it looks, this is one of the panels in the detector. And apart from that of course as you have noticed we have placed the two systems well outside the 50 gauss line, and in order to achieve that, the distance is 2.5 meters away and both the MR and the PET systems are shielded at the front.
So, as I said, one of the differentiations with our competition is that we are using continuous detector system, continuous detector design but also we have a completely different reconstructor. Yes, it is a 3D reconstructor as with everyone else but the similarities I think stop here. We are reconstructing in LOR [line-of-response] space so we don't use sinograms. Each individual LOR is being used individually in the interpolative algorithm. We don't use a voxelized model for the object but we use Kaiser-Bessel based functions. And of course we are using a listmode TOF reconstruction so we don't have time bins we are using again individually each LOR. And these… Here technology allows us to not have the post-filtering step but we are modeling the smoothness of the image within the reconstructor itself.
What was added? These were all features of our systems so far, what we have added more [=additionally] in 2011 is the Astonish TF capability of doing even better reconstruction because the reconstructor is so fast that we actually don't have to cut corners as we did in the past to speed the reconstruction. So now we are looking at are 30 seconds per bed position reconstruction while the competition is about 75 seconds per bed position and 45 minutes for the whole body as we know.
And this reconstruction gives 30% better contrast than conventional PET without increasing dose or time. As I said, 30 seconds per bed position for standard FDG scans which is about 5-minute whole-body acquisition. 2mm voxels for the whole-body scans. Now we have the opportunity to do PSF modeling within the scans that was not possible with Philips products before. And we’ve got 30 seconds as I said the

reconstruction [speed] per bed. And this is an example of what it can achieve. This is a 4mm voxel with TOF.
This is a 2mm voxel, again with TOF. You see the differentiation of the malignancy is much more profound than here, and this is without the PSF modeling. If you want to use PSF modeling for example in areas where TOF is not as capable, as for example in the brain, now you have the ability to do so.
And going back into the PET/MR features, of course the main feature is the attenuation correction for this system. So we are using a very fast sequence for whole-body imaging. We do 4-minute acquisition with 3x3x5mm. This follows a fully automated segmentation without any user interaction and then we are using a 3-segment approach. So we segment air, lung and soft tissue. We use a truncation compensation for the PET image and of course we are using templates for the RF coil so you don't have to take out the RF coils to do the PET acquisition. The system recognizes what coil you are using and compensates for that.
This is some validation of the algorithm. This is before the actual, This was originally done by simulating MR acquisition. So this was done from data from University of Aachen. This is the PET with the CT attenuation correction, this is with the simulated MR attenuation correction. We have observed at that time very small differences in our approach between the SUV [standardized uptake value] quantification.
And this is also, when we did the phantom scans we also observed that the contrast recovery was basically without any particular difference. This is the MR attenuation correction contrast recovery percentage, and this is again for the CT. And each of these points are different spheres. The correlation is basically very good and on the line of identity.
I spoke about truncation quantification errors. This is the image of when you don't correct for truncation and this is the corresponding once you have corrected. Once you have corrected for truncations we saw that the difference in the SUV, the inaccuracies in SUV will fall below 1%, while before it was quite significant.
And we also consider, as everyone else, how much the system, one system interferes with the other and how the whole experience can be more integrated rather than having two systems apart. So what we first went and did was comparing MR images and this is just one instance of them. Whether there are any differences between single stand alone MR and PET/MR and we haven’t seen any difference what so ever.
Then all of our thinking when we are developing the acquisition and reconstruction software was, as I have said, to have uniform feeling so this is how the

MR acquisition plan looks like and from the same user interface you will be planning also the bed acquisition, everything is… the form is very natural. And this, we did several mappings of energy resolution and TOF resolution here is the energy centroid maps. Here is without, just the PET alone. Here is the PET without shielding. And this is after our shielding efforts. Basically the uniformity was as good as with the stand-alone system.
So I said we had two systems installed since 2010, now there are three systems in the field. The first system which came online was in Mount Sinai in New York. The second one was in Geneva, University of Geneva. And now we have installed, only last month if I remember correctly, the third system, which is in Dresden in Germany.
So, the Mount Sinai system actually was installed in 2009 in December. The main use of this system, this was our alpha system so we were evaluating the MR attenuation correction versus the CT [attenuation correction] and also we were optimizing the protocol workflows. The principal investigator is Prof. Zahi Fayad who is particularly interested in cardiac imaging and therefore the main research that is being conducting there is cardiac. So, viability and ischemia analysis, stem cell therapy monitoring, and plaque imaging.
This is the first study, one of the first studies that we were comparing the systems for attenuation correction, so at that stage we had all of the patients first being scanned on the G Discovery PET/CT that they had on the department, then after some time going up to the next floor and being scanned on our PET/MR system. So you’ll see two characteristics, one is a very high injected activity because of the current some of the protocols in the US. Because of the need for extended acquisitions for the two systems. The PET/MR was usually done quite later after the PET scan. And this is the PET image from the PET/MR system and the fused image with the MR.
And the same patient here is the TF PET/MR with attenuation correction and here is the attenuation correction with the PET/CT. We observed very good [results], what we observed actually in simulations and phantoms we’ve also seen within the field and we were quite happy about that.
This is another patient from the same department with liver metastasis. Again, quite high injected activity and here is the PET/MR data set and the PET/CT. I think it’s quite, we were quite happy at that time also now about the image quality and the results of the attenuation correction methodology that we followed.
Another patient, again this is the PET/MR 1 hour and 40 minutes after the FDG injection and this was one hour after the FDG injection so this was much faster, the gap between the two acquisitions. And, as I said earlier the site focuses primarily on

cardiac imaging, so this is a fused image of FDG targeting vulnerable plaques and here is the CT image of the vessel with the FG image overlaid. If we see the same patient with the PET/MR we clearly see why PET/MR has the capacity to be the leading modality in this area because you see very good delineation of the vessels.
The next installation was in Geneva, the first patient was scanned on April 8th. The installation in Geneva was also very interesting from the point of view that the hospital didn’t have the space to put the system, so our installation team actually installed the whole of the system in this container outside Geneva in a warehouse. So we installed it there and with a lorry we brought it overnight into the hospital, we placed it within this block and we just plugged the cables in and it actually works and this is how the system looks today.
So the principal investigator here is Prof. Osman Ratib imaged [=in the photograph] here and the department is primarily focusing in oncology and potentially we will also extend the scope for neurology. But the main project that we have identified is tumor perfusion and characterization, uterine and ovarian tumor staging, prostate brachytherapy planning, and increased specificity for breast tumor detection.
This was the first patient who was scanned, again we had the dual scannings. One on the Siemens Biograph, which is these images here. And then go follow with the PET/MR. Again, therefore there’s quite a big delay between the inject activity and the PET/MR acquisitions.
This is one of the first images that we saw from the department and it actually gave us a very interesting… actually convinced us that there is clearly a need in the clinic for this system so this was a lady who had some breast cancer before and she underwent some surgery. And then the MRI observed some masses there, it wasn’t known whether there was some scar tissue or whether there was a recurrence. If you see the PET you clearly see there are some uptakes. When you fuse the image basically you have – and if we see it in magnification – there you see what the PET/MR as a modality can bring. Both because the positioning of the patient for breast imaging is completely different. It doesn't suppress the breast, actually we scan in front position, so the breast is not suppressed as I said and the MR gives you a full view of the anatomy of the breast. And of course you've got the sensitivity of the PET which highlights the area where malignancy probably exists.
The second patient, the 70 year-old female with breast cancer history and chemotherapy treatment for liver metastasis. When we did the PET/MR we saw that there was some nodule in the lung and of course an uptake in the liver. Here the inject activity was 380MBq and the uptake time for PET/MR was 250 minutes. We can see, if
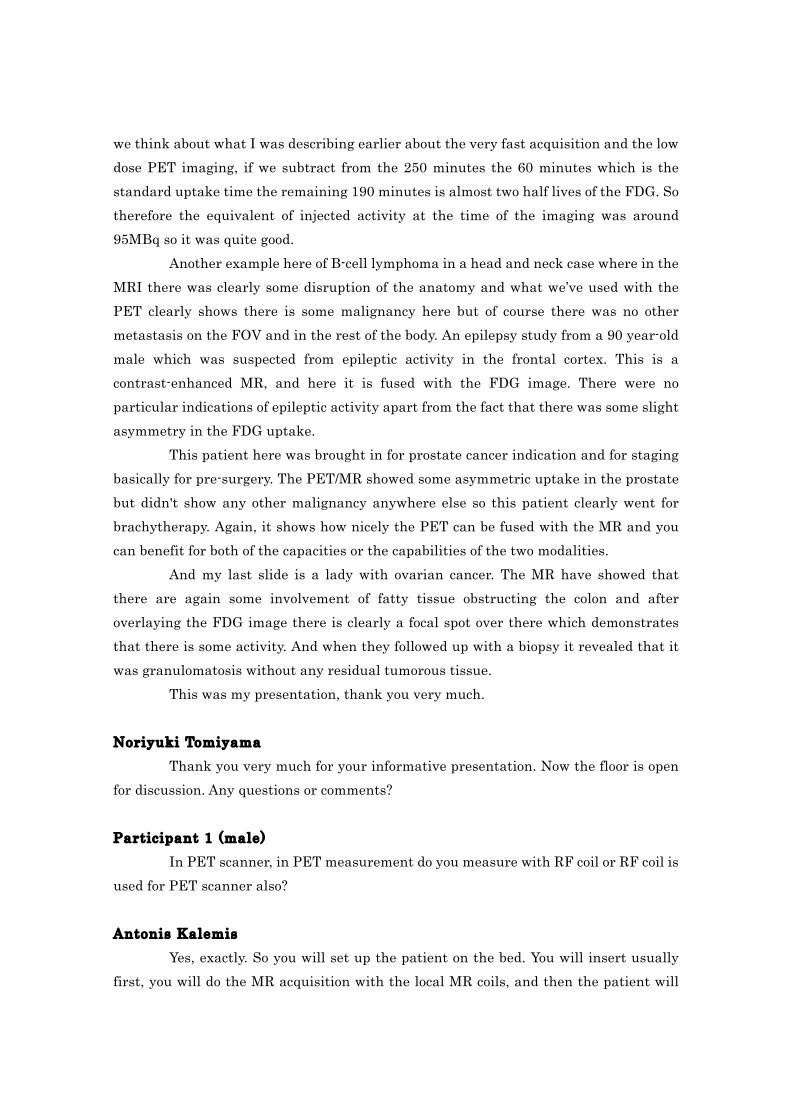
we think about what I was describing earlier about the very fast acquisition and the low dose PET imaging, if we subtract from the 250 minutes the 60 minutes which is the standard uptake time the remaining 190 minutes is almost two half lives of the FDG. So therefore the equivalent of injected activity at the time of the imaging was around 95MBq so it was quite good.
Another example here of B-cell lymphoma in a head and neck case where in the MRI there was clearly some disruption of the anatomy and what we’ve used with the PET clearly shows there is some malignancy here but of course there was no other metastasis on the FOV and in the rest of the body. An epilepsy study from a 90 year-old male which was suspected from epileptic activity in the frontal cortex. This is a contrast-enhanced MR, and here it is fused with the FDG image. There were no particular indications of epileptic activity apart from the fact that there was some slight asymmetry in the FDG uptake.
This patient here was brought in for prostate cancer indication and for staging basically for pre-surgery. The PET/MR showed some asymmetric uptake in the prostate but didn't show any other malignancy anywhere else so this patient clearly went for brachytherapy. Again, it shows how nicely the PET can be fused with the MR and you can benefit for both of the capacities or the capabilities of the two modalities.
And my last slide is a lady with ovarian cancer. The MR have showed that there are again some involvement of fatty tissue obstructing the colon and after overlaying the FDG image there is clearly a focal spot over there which demonstrates that there is some activity. And when they followed up with a biopsy it revealed that it was granulomatosis without any residual tumorous tissue.
This was my presentation, thank you very much. Noriyuki Tomiyama
Thank you very much for your informative presentation. Now the floor is open for discussion. Any questions or comments? Participant 1 (male)
In PET scanner, in PET measurement do you measure with RF coil or RF coil is used for PET scanner also? Antonis Kalemis
Yes, exactly. So you will set up the patient on the bed. You will insert usually first, you will do the MR acquisition with the local MR coils, and then the patient will

come out on the bed, the bed will rotate with the coils inserted and do the acquisition on the bed. Participant 1 (male)
Is that possible to attenuate the RF coil, the PET measurement? Dr. Pichler said that is the source of artifacts. Antonis Kalemis
Yes. Well, what we have done is we have taken all the Achiever RF coils and we have measured the attenuation component, so therefore each, when you are using a specific coil, the information of which coil you are using is being fed into the reconstructor, so the reconstructor uses a template of that coil to compensate for the attenuation. Noriyuki Tomiyama
Any other questions? Okay? I have a question. At first this new Ingenuity TF MR/PET, I think at first, I thought this PET/MR is very, very useful in the field of neuroradiology but you showed me some slides which show it is useful in other fields. For example, oncology.
And one of the most important points, for example radiation dose and scanning time. I think if we scan PET and MR separately… can we shorten the scanning time using PET/MR rather than using PET and MR separately? Antonis Kalemis
First of all, theoretically, if you have the opportunity to have a PET system a PET/CT system and MR system side-by-side the patient would go directly from one system to the other. Then again you would have faster workflow if you had the Ingenuity TF PET/MR because in this occasion here the patient doesn't go anywhere, he stays on the table, the table rotates, it’s very fast it doesn't give dizziness to the patient of course but we rotate the patient very fast. There is a 4-minute acquisition, whole-body acquisition for localization and amalgamation correction. And then you've got another 5-minute acquisition for whole-body PET. So in 9 minutes plus some overheads for the set up of the patient, so let’s say in 13 minutes you have 1 PET/MR acquisition.
However we have to consider that in a real life department, usually the PET/CT resides in the nuclear medicines basement and the MR is somewhere else. So

the patient actually doesn't go from one scanner to the other. He has to go through different departments and also has to go, to fit into different slots in the department because you cannot, for example in your hospital, you cannot allocate the time for your MR system directly after the PET because the PET usually as it stands today, it takes much longer or actually it takes longer to do the acquisition time, so the 2 systems are not identical. And also you have different patients coming into the radiology department and different into the nuclear medicines department. So what basically this system offers to a clinical setting is that you really have the opportunity to do one-stop exams for PET and MR. Noriyuki Tomiyama
I have a question. When for example in the United States or Europe, which department, radiology department or nuclear medicine department? Which department is this new machine installed? Antonis Kalemis
That’s a very interesting question. I must say that this depends purely on the hospital. For example in the University of Geneva where there is a very good collaboration between the radiology and nuclear medicine, and professor Ratib is also the head of both radiology and nuclear medicine, the scanner is being installed actually outside the radiology corridor. But there is no particular meaning because the users, the technologists they use the Ingenuity TF MR/PET both for PET and for MR. In Mount Sinai to be honest I don't know where exactly the system is installed, but from discussions that we have with potential customers currently, we see that there is both interest from the nuclear medicine department and the MR and usually you need to have a very good collaboration between those 2 departments. Noriyuki Tomiyama
Yeah, I see. Because this new machine must to be very, very expensive, so when we want to buy this new machine radiologists and nuclear medicine department chiefs also have to collaborate, I think.
Any other questions? Please. Participant 2 (male, Japanese)
I have a question about PET attenuation correction based on MRI data. So in your talk you said MRI image is segmented into three parts, so air, lung and soft tissue.
Then, so how do you deal with bone? Antonis Kalemis
As I said from simulations and from observing real patients we haven’t seen such a big difference in between PET/CT, CTAC [AC=attenuation correction] and MRAC in the bone area. Now of course, I must tell you that this implementation of attenuation correction is the first approach, and we were very happy that it worked very well. Of course we are not just standing and saying that this is going to be in two years time or in one year time the same algorithm, we have currently quite an interesting research program with different, both internally and externally, researching different approaches in MR. But our current implementation, I must stress that we received very good results, very good correlation of the SUVs. Noriyuki Tomiyama
Any other comments or questions? Okay? Thank you very much. I’d like to close this luncheon seminar by thanking doctor Kalemis. Thank you very much.

Lecture III
PET-MRI in Neuroscience
Eku Shimosegawa Good afternoon. So we’ll move on to Lecture III. My name is Eku Shimosegawa
from Osaka University and the Chairman for Lecture III, titled PET-MRI in Neuroscience presented by Dr. Gregory Sorenson. I would like to introduce Dr. Sorenson shortly. He is the Director of the Center for Biomarkers in Imaging in Massachusetts General Hospital, and he is a Professor for Radiology Department of the Harvard Medical School. He is a neuroradiologist and I think that he is one of the most active and famous researchers in the MRI field, especially in the perfusion and diffusion MRI imaging. So are you ready? Gregory Sorensen
Yes. Eku Shimosegawa
So, please start. Gregory Sorensen
Alright. So, thank you. Thanks for sticking around for the last talk. It’s a real pleasure to be here with you. I love coming back to Japan. It’s very hisashiburi. It’s wonderful to be here.
So, here’s the outline of what I hope to share with you today. I want to talk a little bit about who I am and who my Center is. Then I want to address, at a very high level, why I think we need a new imaging technology. We’ve heard over the past two days about all the challenges of this new expensive methodology; do we really need something like this or not? Then I want to talk specifically about why PET and MRI belong together, and I’m going to talk about some potential clinical applications. I want to go over an idea I call “mechanistic neuroimaging”, or “mechanistic imaging”, and why I think PET and MR together do such a good job of this.
So let me begin by introducing the Martinos Center, where I’m the co-director and where we work. So this is the Google Earth view of where Boston is and if we zoom in on Boston, this is the city of Boston; I know many of you in the audience have visited this. So MGH is Massachusetts General Hospital; it’s located here near the river. One of

the great things about being at MGH is there are many other fantastic institutions nearby that we leverage. So, for example, here’s MIT, many of my graduate students come from MIT – and our post-doctoral fellows; we have Harvard Medical School just down the road; we have the main Harvard University campus also not so far away; and, perhaps most important of all, we have the Red Sox, a very important part of the Boston team. Our Center is located over here, where the little A is.
So if we zoom in on this area, these are the buildings where we’re located, these two buildings here, and I thought I’d give you just a quick overview of the equipment that we have. So currently we have installed the following equipment. Relevant to this discussion, the brain PET system is sitting next to a cyclotron, and then we have a number of other MRI systems that I’ll talk some about. 3T scanners, including the new Connectome scanner to try and map human brain connectivity. 7T, MEG and we are just about to install – oh, and some preclinical systems. So those were all the clinical human systems – preclinical systems ranging from 4.7T to 15T, MicroPET systems; we’re just buying a new MicroPET/SPECT/CT combination and we expect to take delivery in the new few months on the whole-body MR-PET, so we’ll have two MR-PET systems; one for brain, one for whole-body; and developing a Parallel Transmit 3T system. Overall, there are about 90 principle investigators, hundreds of students and post-docs, it’s a large enterprise all funded by the NIH individually, one grant at a time. It’s a very vibrant place. I encourage you to come visit and spend some time with us. We welcome visitors.
Okay, so that’s who we are. Now let’s talk about this question about a new imaging modality. As you probably know, the number of MRI scanners installed and the number of PET scanners installed, and the number sold every year, differ by about one order of magnitude, roughly speaking. So every year, there’s roughly 300-400 PET systems sold worldwide and there are roughly 3,000 or so MRI systems sold worldwide, so 10 times more MRI. For imaging the brain, the utilization is probably 2 orders of magnitude more. So why would we talk? Why would we have this conference today? What is the real benefit to our science and to patients? I think the answer to this, we need to step back a little bit and look at where we are as a culture and the real challenges we face in looking at our unmet medical needs.
There are actually a number of ways to examine the unmet medical needs that we have. One is just to see how people die. But more sophisticated health policy analysts realize that as far as we know, everyone dies at some point. So looking at the cause of death may not be the most informative way to think about how to reduce human suffering. Instead, the health analysts now talk about the burden of disease as measured by “disability × how long your disability lasts”. So someone who is disabled

half as much as being dead, but 10 times as long, has a bigger burden of disability then someone who just dies after one year of a disease.
When you look at this by location, the United Nations and the Harvard School of Public Health have been studying this kind of burden now for many years and you get a list that looks like this. You actually see that the single most common cause of disability in terms of disability, life years lost, is actually depression. In fact, if we look at the top 10, we see that six of the top ten are actually neurological illnesses; they’re brain-related diseases. This is because, although cardiovascular disease is important, it happens frequently at the end of life and the patients do not suffer for a long, long period of time with their heart disease. They have a heart attack and they die. This shortens their life, but perhaps not so much because they were older, whereas depression can strike someone who is very young. Similarly, a stroke can strike people who are very young and cause many years of disability; of severe disability. You can see the list; same thing, head trauma, alcohol. Another interesting thing about this list is that we in medicine have very little to offer many of these patients. For stroke, we still don’t have very many good treatments. For depression, we’re still struggling. For head trauma, as you know, we have very little to offer people who suffer head trauma. Alcohol abuse and other addictive disorders, we have very poor treatments for these diseases. So in fact, when we look at this list, there are many, many unmet medical needs, many problems we need to solve, and people we could help.
In addition to these easy to quantify, relatively speaking, burdens, there is another kind of burden that’s very important that I want to discuss and that is “medical errors”; mistakes that physicians make. This has become very popular to talk about in Boston because of some very spectacular mistakes. So, for example, just a few years ago in 1994, in Boston, a newspaper reporter was given 4 times her chemotherapy dose and died from an overdose of chemotherapy due to someone reading the chart wrong, the orders wrong. The next year, someone had the wrong leg cut off. Just a few months ago, my own surgeon admitted in the New England Journal that he had performed surgery in the wrong place and in the New England Journal article he goes through all the reasons why these kinds of errors can occur.
In fact, this is not new. We have evidence, very good documentation, that medical errors are many centuries old. Back in 1852, there was a New York Times article about how incorrect anesthesia at MGH led to a patient dying. We even have evidence of incorrect brain surgery. You can see one surgery done here and later, another surgery done here many thousands of years ago. So people have been making mistakes in surgery for many thousands of years. In fact, one fifth of all orthopedic

surgeons admit, they’re willing to admit, that they’ve done surgery in the wrong location during at some point during their career. Of course, there are probably more surgeons who will not admit it, but still have committed these kinds of errors.
So medical errors are a big problem and there is quite a bit of effort focused on reducing errors. In the United States, there was a big Institute of Medicine report in 2000 talking about how many thousands of people die every year from medical errors. What we’re now starting to realize is that, even with all this effort to reduce things like wrong surgery and incorrect medication, misdiagnosis, incorrect diagnosis, is actually an even bigger problem for medical errors.
This was highlighted in a JAMA article just a little over a year ago. Somewhere, again, in the tens of thousands of misdiagnoses occur every year. About 5% of all the autopsies that we do reveal diagnostic errors that would’ve changed the patients’ treatment and prolonged their life, had the diagnosis been made correctly. If you look at the amount of harm that this misdiagnosis causes, it’s actually a much greater amount of suffering than the medical errors that we were talking about with wrong surgeries. And in fact, one metric for this is the damages awarded by courts, and the damages for malpractice by misdiagnosis are actually larger then malpractice by medical errors. In fact, we really need new diagnostic methods because we’re really erroneously diagnosing many, many illnesses, and this is now increasingly well-documented. This is especially true in the neurological illnesses where we thing that a patient might have diagnosis X and in fact they have diagnosis Y and we give them the wrong treatment for many years.
In fact, diagnostic tools are very powerful. In the Stanford-Dartmouth Survey of Medical Innovations, a few years ago, they listed 30 important medical innovations. They asked physicians which one of these is the most important to them. What they said was “Diagnostic Imaging” was the single most important innovation that has occurred in the last 30 years. Not by a little was this ranking listed high. MRI and CT, this was in 2001, so it was before PET had come on to the scene. Diagnostic imaging is incredibly valuable to physicians because without the correct diagnosis, they cannot implement the correct treatment.
So we desperately need improvements in our diagnostic tools because even with the tools we have, we are frequently making diagnostic errors. Here’s the implications; better diagnosis is a major medical need, physicians value these diagnostic tools, and we really need new methods and tools to improve this and we need to change the way we think about making diagnoses. So this, I would say, would be the big picture setting for why we are thinking about MRI and PET together; why you have now a

conference about PET and MR, and really what is driving our field forward. We really have tremendous unmet medical needs.
Let’s talk about where this tool, MR and PET or PET-MR, might actually be put to use in the near term. Here are some of the neurological illnesses. I’ll talk about some non-neurological illnesses in a minute. Cancer, stroke, Alzheimer’s disease, head trauma; these are all substantial problems where we have limited therapeutic options, poor understanding of the underlying pathophysiology and limited diagnostic tools, honestly. We need better diagnostic tools for each of these. Not so much diagnosis of cancer, but monitoring the therapies, how we know whether patients have responded to therapies or not. In stroke, we do now have a powerful diagnostic tool but very limited ways of knowing how the patients are responding. Alzheimer’s, you are all very familiar with it of course. Head trauma, it’s easy to see the patient has had head trauma but the implications pathophysiologically are very difficult to sort out.
So with this very high level medical view, now let’s talk about what we might learn if we put PET and MRI together. So, you guys are all the experts here. I don’t need to tell you that no one tool provides it all, that each has its own strengths and weaknesses, and many speakers already today and yesterday have talk about these strengths and how they could be combined.
Let’s talk specifically though about what we could do with one and the other together simultaneously. Of course, we have the molecular specificity from PET, and of course we have the anatomy from MR. I’d like to re-review some things that have already been discussed today; we’ve talked about attenuation correction and I’ll point out that I think this is incredibly important in people who move, which is basically everyone; everyone who is alive, moves in the scanner. So, we don’t like scanning dead patients. They don’t reimburse very well. So we typically scan living patients and they typically move. Motion correction, of course, is important for the raw images as well as attenuation correction. And one near-term application that I’ll talk about, that hasn’t really been discussed yet, is image-based arterial input function estimation.
I’d like to begin with this case outside the brain because it highlights, even in the non-simultaneous setting, the benefit from simple anatomic-pathologic-radiologic correlation. So this is a woman with melanoma. She has a hot-spot that’s very obvious on her head scan. Everyone knows that this could be cancer, but in a female, it could be the ovary. By doing a CT scan, we don’t get much help because it’s hard to know what exactly is here, and although we see a clear circumscribed focus of tissue level signal intensity, we don’t know is this a metastasis or is this the normal ovary. On the MRI, on the other hand, the ovary has a very classic characteristic appearance of a cluster of

grapes; you can see normal ovary in red here, normal ovary in red here and a mass aligned with the green arrow here and when we co-register, it’s very clear now to see that this actually is a metastasis. I think pelvic oncology will be one of the biggest places where we will benefit from combined MR and PET together, and this is actually something that benefits from simultaneity because of the motion of the bowels during the intestines during the scan time.
So with that question outside the body, let’s again focus again on inside of you. We already heard a number of speakers talk about how MR can be used to do attenuation correction. We’ve been exploring the ultra-short TE sequence. And here you can see the CT-based attenuation maps and the MRI-based new maps; they’re quite similar to each other and our data that was published late last year suggests that in fact, we can get very good image quality using the MRI-based methods. So I think, as both Dr. Pichler and others have said today, that I think that the MRI attenuation correction-based methods are essentially going to work. Are they fully solved? No, not yet. But is there light at the end of this tunnel and are the solutions workable? I think so.
Now, I wanted to talk again to focus on motion correction. This is actually a serious issue, especially as we image more and more elderly patients, who might be demented and have a difficult time holding still. So to prove this method would work, we first took just a phantom and moved it in different positions and when you average this acquisition together, you get the standard PET “blur-o-gram” where basically, the motion just all blurs together and it’s very difficult to make a good diagnosis. With MRI, we can recover the intrinsic diagnostic power of the PET scan. In fact, this would be one theme that I would emphasize over and over; one of the things MRI can do that PET users should be happy about is that it can give them back the power that PET brings to begin with, but that is lost because it can’t do, for example, motion correction. By using simultaneous MRI to monitor the movement, we can actually bring PET back to its full strength.
Here’s an example, in a volunteer, where you can monitor every 3 seconds the head motion with the MRI scan, collect the listmode data and then recover the high quality PET scan that otherwise, would’ve been blurry. This is again done using the existing brain PET prototype that we’ve had installed, like Dr. Pichler has had, that you have already heard about. Okay, that’s straightforward and I think that’s a reasonable explanation.
But what about more complex motion? Here I want to present some of the work that George El Fakhri has done. He started off with a phantom, looking at radioactive

sources and then monitoring this with MRI, and by doing listmode capture and the tagging methods that have been established now in MR for more than 20 years, we can actually very clearly monitor the deformations of tissue and use this information to correctly reconstruct the PET listmode data.
When he does this in phantoms, you can actually see that the improvement that you get using MRI is better than the gating. The gating is good for motion correction, but its higher noise. If you don’t correct, you just get motion artifacts but lower noise. The MRI together lets you have both; it improves motion correction and lower noise. So now he started to do this in non-human primates. You can see again, the tagging of the abdomen, the listmode data and the reconstruction that allows when looking at the heart, the blurry image or the noisy image to become crisper using the combined methods. So you can imagine lung nodules that we can now start to resolve as the patients breathe during their 15 or 20 minute acquisition, again all patients that we scan are breathing and so their lungs are moving, and so now we’ll be able to have a method that could track this.
Another, I think, very good opportunity for us, we don’t know how important it will be but I am optimistic about this opportunity, is using the image to recover an imaged-based arterial input function. So here’s an example of a brain study where we collected dynamic PET frames. We chose readings of interest based on the high resolution MRA [Magnetic Resonance Angiography] that we can do simultaneously, so we know precisely where the head is all the time, we can do motion correction during, before and after, and then we can use these regions of interest to identify an arterial input function. This is even more correct than the radial artery because if there’s carotid stenosis or other problems, we can actually get the true arterial input function that feeds this particular organ. Of course, we can still do venous sampling from a tabelied analysis, but you can actually see this figure, these data, come from these regions of interest off of this dynamic scan.
You can see in the early frames, there is simply not enough signal and even in the later frames from the PET scan, to know exactly where the arteries are. But that’s why we have the MRI scan. It’s very good at finding the arteries, and it’s very straightforward then to label where we should draw the arterial input function from. This again will allow PET to recover what it’s always had; quantitative capabilities. So PET has always been a true quantitative method if you do arterial input functions, and in most of our subjects that means putting an arterial line in which is burdensome, and painful, and not really well-accepted. With this kind of method, just like we do in the heart, we can use image-based methods to recover the quantitative ability that PET has

had all along. Now, I have mentioned a couple of these, but let me just summarize again what
I think are some of the advantages of simultaneity. One I haven’t talk about so far is the convenience for the patients. Patients really like just having one scan instead of two. The MRI scan is a certain duration, we collect PET data the entire time and, as was mentioned yesterday, this actually gives us better PET quality than we would have gotten otherwise. There’s no extra time for the patient, it’s very convenient; they really appreciate one less scan. The throughput is also nicer because one room now is constantly putting through patients instead of having to take twice as long to do first the PET, and then the MR, now we can do them together. I already mentioned a couple of other issues about coregistration, quantification; we’ll talk again about better partial volume correction; I think this is particularly important in Alzheimer’s disease; and I hope to talk a little later in my talk about a real opportunity of simultaneity which is the opportunity for “smart probes” which I think will really leverage some of the strengths that MR brings to the table.
Now, here is a list of some of the early applications that I can see that I know our team is already excited about. I’ve already shown you an example of pelvic oncology, and we think breast oncology has a lot of opportunity, cardiac imaging, lymphoma, and as I mentioned, lung imaging.
Let me return now again to my list of neurologic diseases and focus on a couple of specific examples just quickly. I wanted to talk a little bit about this idea of “mechanistic imaging”. This is not physiologic imaging, it’s not functional imaging, it’s really talking about the disease pathways; the pathways in which diseases occur, the pathophysiology if you will. So it’s much more about the context of the questions rather than the specific imaging modality. Consider, for example, FDG PET. In some settings, it’s highly mechanistic, but in other settings, it gives us no insight into the disease pathophysiology at all. So it’s not really about the technology, but more about how we ask the questions.
So one topic that we might want to use mechanistic approaches to, is in cancer effect treatment, how do these anti-angiogenic agents work today. Most of you know that the big mystery here is that the anti-angiogenic agents, although popular, don’t actually seem to kill the tumor. So even though we thought that anti-angiogenesis would shrink the blood vessels, and therefore lead to the shrinkage of the tumor; this does not seem to be happening. In addition, they only seem to work when they’re given with another agent, very mysterious. Even more mysterious, there’s no dose response relationship to these agents. If we give more, the patients don’t get a better response. So
this leads us to wonder what is really going on with anti-angiogenesis, and this has been a major question in the field. Just an example, in the brain, this is before anti-angiogenic therapy, this is after anti-angiogenic therapy, and we can see marked reduction of contrast, but we don’t really know what this means; is the tumor gone or is it not? And this highlights one of the limitations of conventional MR Imaging and why we need better improved modalities.
One of the theories about what’s going on in angiogenesis is an idea that there’s not a killing of the vessels but in fact, normalization of the vessels. That in fact, this rarely happens because the tumor outsmarts our treatment. But this normalization might actually happen and the idea here is that the abnormal tumor vessels, before they become shrunken and starved, they actually become more like the normal vessels. This theory actually supports, or helps explain, a number of those things that we notice because it would explain why, for example, we need combination therapy with a cytotoxic. Normalizing the blood flow would actually improve the delivery of a cytotoxic agent. It would explain why there is no dose-response relationship; giving a bigger dose might just short circuit to when we get here and the tumor outsmarts our therapy rather than allowing for better normalization. So this question about the normalization hypothesis is an important one. Clinically and scientifically, could we use imaging to actually address this? And I think we can and I think it’s for addressing questions like these, that a combination of PET and MR together could be particularly useful at. The idea here is that maybe there’s a window in time and dose where you get normalization. If we give too much dose, we get toxicity. If we give too long a dose, we get excessive shunting away. And too little of either, we get no effect. Could we see this?
How about we explore this in patients or in animals? If we think that this is happening and we block angiogenesis with VEGF [vascular endothelial growth factor] inhibiters, we should see a series of things: smaller vessels, less permeable vessels, less downstream effects. And in fact, in animal models, that’s exactly what we see when we do two photon microscopy of animal models of tumors, we can see that that the large abnormal vessels become normal within just a few days, and they decrease their density, and they decrease their diameter, interestingly, within a few days.
So here is another one of the themes that I want to talk with you about. PET can do so much, but as Dr. Pichler mentioned, so can MR. In fact, I think the real wins will be when we bring the strengths of both modalities together. Not just simply anatomy and simply, say, glucose uptake, but instead the richer, more productive methods that both can bring to the table. So it actually helps both of us if we can start to learn what PET can do for MR and what MR can do for PET. So I want to spend a couple

of slides talking about how we might look for especially this: the mean diameter. How might we look for a vessel diameter? As far as I know, there is not a way to look at average microvessel diameter with PET, but there is actually a way to do this with MRI.
If we’re interested in looking at the microvasculature, some groups now more than 10 years ago, almost 12 years ago, proposed some methods to do so-called “vessel caliber imaging” (VCI), and this has now been replicated by a number of different groups, it exploits a trick of MR physics where the small vessels and the big vessels have differential sensitivity to the introduction of a paramagnetic contrast agent. Basically, we inject and we get a gradient echo, and [?] a spin echo and a gradient echo image at the same time, and the difference between how these two kinds of images react to the injection of gadolinium help us understand the size of the microvessels. We can actually make different kinds of blood volume maps based on spin echo or gradient echo. So here’s a gradient echo CBV map, a spin echo CBV map and Dr. Weisskopf and others showed years ago that, in fact, the ratio of these two gives us a relative map of the microvessel diameter. That’s kind of interesting. What could we do with that? Well, if we knew the microvessel diameter, we could look for vascular normalization. We could actually see if the vessels become more normal over time.
And, in fact, that’s precisely a set of experiments we carried out. We took patients with glioblastoma, double base-lined so we could get an estimate of the ability of the vessel caliber method to be reproducible, and then we gave VEGF inhibiter and looked over time at the reduction of enhancement, but also at the normalization of the microvessels over time. So we could actually identify that there was in fact this change in the microvessels using this advanced MR technique.
We have another MR technique that measures permeability called DCE-MRI. It’s a very complicated method if you’re not familiar with it. Now is not the day to learn about it other than it looks at something that PET people have been looking at for a long time, which is the egress of the tracer out of the microvasculature.
And again, just like using the same tracer connector principles that PET has pioneered many decades ago, we can identify transfer coefficients out and in to the blood vessels. With that, we can make maps like PET people do, but now with MR, of estimates of how fast the gadolinium in this case is leaking out. With that, we can actually, just like we looked at with the microvessel diameter, we can look at the permeability change over time and with MR, we can look at the downstream changes including decreases in edema and water mobility.
So now you can start to see that we have got a rich menu of options here. We can look at microvessel diameter, we can look at microvessel permeability, and we can

look at edema as well. In fact, using diffusion MRI, you know that we can also study the white matter connectivity. This is the basis of the Connectome Project where we make white matter tracts and look at this serial over time and based on this, we can make these tractograms before and then after treatment; in this case again, before and after the treatment with this anti-vascular agent and we can see a reemergence of the white matter tracts. So we have a broad range of tools that we can bring. How might PET fit into this?
Well I’ll get to that in a second. Notice here that we have this window of normalization. So it’s abnormal, then it gets more normal, and then it becomes abnormal again. This is kind of the typical pattern. We published this a couple of years ago that there is about a 1-2 month window of so-called vascular normalization. Importantly, we can now start to use these changes to understand who is responding and who is not responding. I don’t know if you’re aware of this, but these anti-VEGF treatments are very expensive. They’re about $10,000 a month and so knowing who is responding early could save the whole system a lot of money and a lot of toxicity to the patients. So these are some data we collected where we compared early response on a various combination of MRI changes and compared the time to either progression or death with these changes and showed that early changes in permeability correlated with survival. So a patient with a big change survived a long time. Patients with little change didn’t survive so long. Importantly, we could actually identify groups of patients who were going to survive a long time based on these findings versus a little bit of time, and most importantly, this is just after one single dose of the treatment. So within a day, we had the beginnings of a handle on who’s responding and who’s not responding to these treatments. This is all based largely on the microvascular permeability and other morphometric changes.
We’ve been able to do this in other tumors besides glioblastoma. This was work we published just over a year and a half ago in the New England Journal, looking at patients with neurofibromatosis and vestibular schwannoma, and giving them again anti-VEGF treatment, we could see decreases in permeability. This happened in a number of patients where we could see an imaging response and even more impressively, in these patients, we actually saw a hearing response. So the patients improved their hearing, which is very unusual in bilateral acoustic neuromas.
Now, how could this help PET and how could the combined MR-PET scanner work together? Well one of the big mysteries is while we see this change in the vascularity, are we really affecting the tumor’s underlying biology? Are we changing the growth rates of this? This was attempted to be answered by the UCLA [University of

California, Los Angeles] group a couple of years ago. They looked at patients before and after anti-VEGF treatment using FLT PET. You can see the reduction in the amount of FLT retention there is before versus after treatment. This is interesting. Maybe something is really going on. Maybe we are really affecting the tumor. On the other hand, we know that FLT especially is delivered to the brain through a disrupted blood-brain barrier. If fact, in a normal blood-brain barrier, FLT has a hard time crossing. So the question really is; is this change really just the gadolinium change? In fact, one of my very cynical MRI friends looked at this figure and he said, “Hey! I’ll take this MRI scan, I’ll put it into Photoshop, and I’ll invert it and in fact, I think the gadolinium predicts exactly what’s going on with the FLT.” Now I think that’s overstating it.
In fact when we look at these, there’s actually some very interesting differences between the FLT and the gadolinium rough map. You could imagine…in fact, now we are starting to see why we would want simultaneous imaging. What if we could measure this permeability using Ktrans [pretreatment transfer constant] and DCE-MRI [dynamic contrast enhanced MRI] and we could measure FLT uptake and correct the FLT retention for the permeability of the blood-brain barrier? This would really allow us to really know whether this change is due to a delivery change, or due to a metabolic change in the underlying tumor, and how much each of these components was playing into each other. This is actually the experiments that we are starting to do now were we give FLT but also do dynamic contrast enhanced MRI to try to bring these two pieces of information together. There’s no way the MRI can really give us a thymidine turnover – right, that’s a very powerful tool that a PET can provide us – but without knowing the permeability, we’re in the dark as to what the true cause of a diminishment of FLT retention is.
So, as you’ve seen, we’ve now started to collect this combined simultaneous MR-PET data. This was our very first patient with an interesting cutaneous glioma that’s extending; and we can see that both on the MR and on the PET; and, as many others have mentioned, it’s very straight forward now to collect simultaneous PET and MR and in fact, while we’re collecting the PET data, we can collect the full rich data set of MRI data that we’re used to. There’s no interference with the scanner and we can actually collect the full dynamic data set, not just these images that I’m showing you here, but also DCE-MRI and DSC-MRI [dynamic susceptibility contrast MRI] and all the time collecting whatever kind of PET data we want, listmode etc., while we’re doing the injection and afterwards.
So here’s some examples in those patients. While we are collecting the dynamic

and other kinds of MR data, we can collect FDG and this is over serial time points. We’ve also started to explore other tracers. So this is a misonidazole, a hypoxia tracer that we are very interested in because you can see that the focus of hypoxia is actually quite different then the MRI scan, there’s large MRI abnormalities. While there is still also a large PET abnormality, it’s in different locations. So precise coregistration, precise simultaneous measurement we think is very powerful because it lets us be as precise as we can about the implications that we draw.
In fact, in hypoxia, especially with FMISO [fluoromisonidazole], there is data to suggest that the single static image approach could be erroneous. This was published some years ago where they noticed that if they did dynamic data, the two different voxels, A and B, had two very different time courses. One quite flat, one very high uptake and then low uptake would wash out, but these could look identical if you didn’t process the data right. If you processed the data off a dynamic, you could actually see that this was very hypoxic, whereas this was just wash-in and wash-out, shown here, and they just happened to collect one single image time point here. So it looked like the two were identical when in fact all this was just increased blood flow of the hypoxia tracer. So the ability to collect serial data, again, while we're collecting the MRI this is no problem because the patients are in the MRI scanner anyway getting all these different MRI scans. I think it’ll be a major patient convenience and actually let us do better exams.
Most of you saw this JAMA [Journal of the American Medical Association] article just from a week or so ago last week. The food and drug administration met in Washington DC to discuss florbetapir AV 45 and its approval. I was at that meeting. There’s a lot of enthusiasm for the use of amyloid-binding tracers and if you were listening to the webcast, you heard Dr. Sperling and many others say there’s really no substitute, in all the MRI methods we have, for the molecular specificity of the amyloid agent. And in fact, this paper showed how correlation with pathology really was so strong in the PET tracer, it’s very interesting that the amyloid burden is really only about 8% here and yet we can see much better uptake here. We’re still not sure exactly of all the reasons. You know better than I do why there’s white matter uptake due to lipids etc., but overall the diagnostic power of this is quite strong, and although Avid [Avid Radiopharmaceuticals] had some challenges around how they do the readings, in the end I think it’ll probably be hopefully a year or maybe a little less before we see this agent on the market, at least in the United States.
Of course here in Japan as well as in the United States, where there are robust MRI data that show that while MRI can be very sensitive and specific, it’s still not,

pathologically, molecularly linked. So really, the combination of MRI and PET together I think will be very powerful in Alzheimer’s disease. Again, we’ve started to collect this data; this is simultaneous MR and PET, in Alzheimer’s disease, in this case with FDG. Of course, we know that as patients undergo hippocampal and other forms of degeneration, there’s atrophy. When we see decreased FDG uptake or decreased amyloid binding, is that because of atrophy or not? With the combined simultaneous imagines, we’ll be able to correct the partial volume effects and exclude CSF [cerebrospinal fluid] more accurately than we could if we were to do them separately. We think that this will be a very powerful use, and in fact, if florbetapir gets approved as I expect it will some time in 2011, I think we will see a huge increase in demand for brain PET scans using the amyloid tracer. All of these patients already get MRI scans, every single one, and so combining the two together will be a major advantage for scheduling. In fact, in our own database, we’ve noticed that about 20% of all the patients who have PET scans are already getting clinically-indicated MRI scans. About a fifth of our patients already need both anyway so why not do them together, save the time, save the efficiency, and make it more convenient for the patient?
I’ll just say a couple of words about head trauma. We know that there is some blood flow and other changes, we know that there are MRI changes. Could we do more with this? Absolutely, we need to do more. We need to potentially do this by radiolabeling improved therapies. One of the fastest one on our track is to radiolabel cancer therapies. Temozolomide is one that we’re one that we’re very interested in because of its widespread use in melanoma and in brain cancer and so we’ll be able to image that. If the vascular normalization hypothesis I talked about before is really true, we should actually see changes in the delivery of this agent. Now would be very interesting.
You’ve heard a number of people talk about molecular imaging with MR and I want to say just a few interesting words about this, because I think this is really where MR could catapult us forward by combining it with PET. Of course, we can do spectroscopy, but you’re probably also aware that the methods that have been used in the lab, such as 2D, or COSY, or toxi MR spectroscopy are now starting to be used in patients. There are a number of recent publications just on this method that lets us separate out overlapping things like lipids from lactate. So these methods, I think, will give us increased molecular specificity using MR that will couple very nicely with the PET tracers.
As you heard in the introduction, I’ve been long interested in stroke. We now know that the simple idea of a diffusion-perfusion mismatch, or even a CMRO2 [cerebral

metabolic rate of oxygen]-OEF [oxygen extraction fraction] mismatch that have been described on PET, is probably overly simplistic; that there are probably multiple molecular penumbras ranging from hypoxia, spreading depression, protein synthesis, heat shock protein expression, all kinds of things we need to be able to image and we want to be able to image this full chain of pathophysiological responses.
One particular thing that we are very interested in in stroke has been the change in pH. This very interesting paper back from 1993 looked at optical dyes in rabbits and noticed the changes in blood flow, but also noticed that there were changes in pH, and that the pH changes actually correlated best with the different regions, normal penumbra that goes on to infarction or not, and dead tissue. So there’s been a real interest in trying to measure pH for some time. There are MRI methods that have been published; this was good work from the Johns Hopkins Group maybe now more than 5 years ago. Phil Sun has been trying to do this in MRI using the so-called “CEST [chemical exchange saturation transfer] methods” and this, I think, has some promise, but not as much promise as I think MR-PET could do. How might that happen?
Well here is where the idea of a combined simultaneous MR-PET probe could really be powerful. What do I mean by this? Well, you probably know that for years, people have been developing so-called “smart MR probes”. These are probes that change their MR signal relaxation based on the local microenvironment; so, for example, if calcium is expressed, their relaxivity changes, or if for example when a neuron fires, or if there is some other change in the micro-environment. In fact, a number of groups have identified that there are compounds such as the one shown here that, depending on the pH, you either get a little bit of relaxivity or a lot of relaxivity because the different pH shelters or opens access to the gadolinium ion. This is the fundamental concept behind a smart MR Probe.
The problem with the smart MR probes, and the reason that they’ve not really caught on more, is that when you see signal changes, you don’t know whether the T1 differences are due to differences in the change from the smartness or the change from the concentration. So here, different concentrations of gadolinium can give you a range of signals, or the same concentration of gadolinium but different pHs can give you different things. So here, I’ve actually got equal signal because the concentrations are different even though the pHs are different. So in practice, we can’t separate these apart – until now. Now that we have a combined MR-PET scanner, we can put a gadolinium and a copper or other moiety on [to the probe] for PET quantification of absolute concentration, use the MRI for Δsignal change, the smartness, and with that, we can actually resolve what the actual true pH is.

So for the first time, we can get an accurate in vitro and in vivo measure of pH using the combined methods of both MR and PET. And what’s particularly exciting about this, is this uniquely measures extracellular pH, which, if you‘ve been following the stem cell literature and other changes, this extracellular pH that’s so important. So finally now, this is just the first of many potential smart probes where we combine the MR and the PET together to open up whole new vistas of things that we can sense, whole new mechanistic pathways that we can start to explore, that we could never do any other way, and again, only possible simultaneously. By the time you move from the washer to the dryer in the washer-dryer PET-MR method, then you’ve changed what the pH might be. Even in the 10 minutes, things change so quickly.
Other smart probes that we’re working on include fibrin-binding agents, this is gadolinium but we’ve also… Initially, this part binds the fibrin together, and of course fibrin is a very important target. You can see clot here on the MRI. But wouldn’t this be nice if you could also get high sensitivity with PET? In fact, we’ve started to do that by replacing those gadolinium with PET moieties and so you can actually see in this rat model that we have just published recently, the ability to see a combined hybrid MR and PET tracer.
Before I return to my last MR thing, I wanted to say just one or two other things about where I think a real big opportunity is in neuroscience. You all are familiar with this science paper from a couple of years ago where the comatose patients were put into the MRI scanner and they gave them instructions. Even though the patients were in a coma and had been in comas for many years, that they discovered that some of these patients, their brains were awake and they could actually activate their brains the same as your brain or my brain would activate. And so, fMRI can truly probe the state of the brain in ways that no other modality can. So imagine a PET combination with an fMRI experiment where you are looking at nicotinic receptor binding. During attention states, with fMRI, you know the attention states for real because you can actually see whether the attention circuitry of the brain is focused on a problem while you’re measuring the receptor binding. So I think this is really the breakthrough potential for understanding how the brain works.
I’ll just show you one interesting trick to show you how far MRI has come. We know that the visual cortex actually has a geographic representation of what is seen, but it’s a distorted representation. Most of you know this from your textbooks that this is not a one-to-one mapping geographically, but it’s actually stretched. It’s a homuncular mapping. But, in fact, we know the stretching, it’s not actually hard to map the stretching to then quantify it and then basically, we can present this kind of a stimulus

that’s curved or stretched, and on the brain cortex we’ll actually get a pattern that fits this distortion. So, for example, because we flattened the cortex, we can actually see what’s actually written on the flattened cortex. We actually realize that we could provide a visual stimulation that would let us write on the surface of the brain. We asked one of our students to write out the name of our Center, MGH Center for Functional Neuroimaging. He couldn’t do the whole letter, whole alphabet, but he did manage to get – using fMRI, this pattern – MGH written on the surface of the brain. So MRI is this very rich and sophisticated methodology.
I wanted to close by telling you about a molecular imaging technique from MR that I don’t think you are aware of that I think again will complement very nicely the PET methodology. Let’s just talk about this for a moment. We talk a lot about molecular imaging with MR, but in fact it’s quite challenging. Typically, we need before and after. So for example, the iron oxide particles, you must get a before scan and then wait a day and get an after scan. So this is very cumbersome; something that they don’t usually tell you unless you read the papers very closely; it’s logistically not very possible. A big challenge with PET and with MR is there is no way to tell bound from unbound probe. In PET, we usually wait for things to wash out, in nuclear medicine. That’s why we do gallium scans at 3 days. We wait for the unbound probe to wash out. In MR, it’s the same problem with most molecular imaging agents; we can’t tell when we are bound to the target versus it’s just circulating and everywhere. Wouldn’t it be nice to fix that problem? The solution for that is a method called “dynamic relaxation enhancement MR” or dreMR. Let me tell you a little bit about this dreMR methodology. We’ll talk a little bit about high count to high target count as well.
So here’s an example of a probe that will actually let us do this. To really understand dreMR, you need to think a little bit about targeting; what’s bound vs. unbound? This is one target, albumin, and this is one targeting agent called MS-325 that has a gadolinium and then a targeting moiety, and it gets bound or unbound to the albumin. When it’s bound on the albumin, it’s much brighter. It’s about 10 times brighter, its relaxivity is about 10 times higher, than when it’s not bound, it’s got an R1 of about 4 unbound and of about 40 when it’s bound. This is because the slower tumbling of albumin allows the gadolinium to more efficiently exchange relaxivity with the water and so we get a much higher signal when we’re bound. So now you’re starting to get the hint of how we might tell bound from unbound. In fact, when we look at so-called NMRD [nuclear magnetic relaxation dispersion] curves, the tissue relaxation rates, we see that most tissue is fairly flat over a wide range of field strengths. However, certain gadolinium agents, especially bound versus unbound agents, have a big

difference between when they’re bound and when they’re unbound. So for example, at 1.5T, the MS-325 unbound has low relaxivity, but bound it has very high relaxivity. So we can actually see the difference between the unbound and the bound state simply by noticing the difference in relaxivity. Okay, well that’s interesting, but how might we really exploit that? Well, imagine if we shifted the field in this direction like dreMR does; that’s the dynamic part. In that case, we would see very little change here because there’s not much difference between, say, 2T and 1T. But on this curve, there’s a big difference between 2T and 1T. So we could identify where the bound versus the unbound MR is.
Now, before I show you the images, why would we be interested in albumin? Albumin is in the blood stream, so that’s interesting, but it turns out that albumin is also accumulated in a number of diseases, including cancer. For some reason, when you bind a chemotherapy drug to albumin, you get a much higher benefit from the drug than when you don’t, and that seems to be because cancers slurp up albumin for reasons nobody really understands. It’s also involved in many other diseases; inflammation for example, maybe even mental illness.
So how could we actually exploit this? Well, given that we’ve now described that changes in relaxivity as a function of binding and field strength can be identified, we could change the magnetic field by changing or deltaing the B0. So if we change the magnetic field, we can actually identify bound from unbound. So for example, let’s take a series of test tubes and we’ll either put water and the gadolinium agent, or just water, or water, gadolinium agent and the albumin in different concentrations, so from low concentration to high concentration. Here we should see binding and we should see a change in relaxivity on that curve. If we go from 1.5 Tesla to 1.65 Tesla and then subtract them, we actually see changes that are only present in the bound molecules. We can identify bound from unbound using this method. This might seem confusing to you, but in fact, it makes a lot of sense. Only when we have a bound agent that has a difference in its relaxivity from low field to high field, that we’ll see this signal change and the unbound stuff all subtracts out.
So we’ve actually started testing this in animals. So here are some implanted tumors. We can give the agent pre versus post, you don’t really see very much that’s specific, but when we do the dreMR, especially if we colorize it, in the tumor where the albumin is aggravated we can see this specific bound contrast agent.
Then, because we had a little solenoid, and because I had broken my finger, we said let’s see if this works in inflammation. So here’s my finger fracture. I, of course, had to image it at 7T because we can. So then we tried an experiment. So here is the coil

with my hand in it. This is just a regular 1.5T scanner. This is what shifts the field up or down. Then we shifted the field from 1.35T up to 1.65T and looked for the change in signal. In fact, we saw in the injured finger, a bigger change then we see in the normal tissue, and a much bigger change then in just the phantom with just water and unbound, and in fact we can make an image and see exactly where the albumin is located with this contract agent. So now we finally have a way to find bound from unbound with the MRI method. We can combine this now in the future with PET tracers and be able to tell when our PET tracer is actually bound versus unbound. This direct protein imaging I think will have a huge potential for identifying all kinds of interesting phenomenon including the ones that I’ve talked about so far.
Alright, I realize I’m running long on my time so let me conclude here. I think MRI and PET really are meant for each other. I think while MRI continues to be a rich and powerful tool with lots of opportunities, the things that PET brings to it are unique and incredibly compelling. I think because we have so many unmet medical needs, we can find areas where despite the high cost of MR-PET, the cost of an improved diagnosis will be beneficial and our society will say, “Okay, if I can correctly diagnose mental illness, I can save all kinds of downstream costs. If I can correctly diagnose depression, I can keep people at work much longer, and this will be a cost effective reason for us to do MR-PET.”
With that, let me show you my famous video about a 7T. Most of you have seen this before, but in case you haven’t, it’s a lot of fun. This is our 7T, this is our dollar bill. Anna Moore, one of our molecular imaging scientists, I asked her to let go of the dollar bill on the gantry, and you can see that the 7T is so powerful that it just pulls the dollar bill in. We say that the 7T just “sucks up money” very easily! In fact, this is how we fundraise for our MR-PET scanner! So please come to Charlestown and bring a hundred dollar bill, and you can try this as well.
So with that, I would just like to thank the many wonderful people that I get to work with at MGH. Please send me an e-mail or please give us a visit sometime.
Thank you very much for your attention. Eku Shimosegawa
Thank you very much Dr. Sorenson and I’d like to use now time for discussion. Dr. Hatazawa? Gregory Sorensen
Stunned silence!

Jun Hatazawa
Thank you. Thank you very much. I really understand the merit of combination of PET and MRI. I’m much interested in the brain circulation and sometimes we would like to know the capillary blood volume to interpret our PET data.
For example, the oxygen extraction is limited when the blood flow decreases. If we have no limitation in the brain, the oxygen has no limitation to defuse to the brain, the patient can survive more and more, but the limitation is there. The reason is now considered to arise from the capillary blood volume; when the perfusion pressure decreases, then the capillary blood volume may decrease. Then that’s the reason why the oxygen extraction fraction does not come to 100%.
If we can measure the capillary blood volume in patients, especially in acute stroke patients, and chronic ischemic patients, and oxygen metabolism, then we can understand more and more deeply, the pathology, pathophysiology of the patients. We can choose better therapeutic strategies, for example, to increase the blood pressure, to increase the perfusion pressure, maybe.
Another very good example of the PET and MR combination is hypoxia in the brain tumor. In the early PET study, we already reviewed the tumor blood flow is luxury perfusion. But in the tissue, it’s hypoxic. That means that delivery of the oxygen from blood to the tissue is somewhat disturbed. That’s the reason of tissue hypoxia in the brain, in the tumor. So the target of the therapy, one of the therapies, is to remove such barriers and just you mentioned anti-VEGF therapy, or remodeling of the blood vessels, or normalization in the blood vessels. So this kind of new strategy to treat the patient is now provided by PET-MRI combination, I think, so I’m much impressed by your clinical imaging of PET-MRI. Thank you very much. Gregory Sorensen
No, my pleasure. Thanks for your excellent comments. I don’t know if we know whether anti-VEGF therapy really will normalize hypoxia or not. This is still an open question, but a very important one. Eku Shimosegawa
Dr. Kanno? Iwao Kanno
Thank you very much. You included a very huge amount of materials in your

talk. I’d like to ask you one question about… You showed AV 45, PIB marker. If you combine that study with the perfusion study or any kind of perfusion study if you have done, I am curious, how about the uptake of AV45 and visual perfusion? If you have something with experience? Gregory Sorensen
We do, but I’m ashamed to tell you I don’t have a lot of familiarity with it. We, at our center, have been mainly using PIB, not AV45, just because it has been more available to us. I think once the florbetapir is for sale, it will be more widely used, but most of our data has been with PIB. I think so far that our data are showing that the decrease in binding and the decrease in perfusion are just as you would expect, that the more binding there is, the more abnormal the perfusion… Iwao Kanno
So that means that it’s a very good correlation between PIB uptake and perfusion? Gregory Sorensen
Yes. I think what people really want to know, actually, and where I think perfusion will be interesting is in these occasional cases of vasogenic edema, after treatment for Alzheimer’s disease. You are probably aware that there have been a few reported cases of the anti-bodies causing brain abnormalities that are suggestive of vasogenic edema. These seem to be related to amyloid in the vessels. So correlating perfusion, things like susceptibility MR, edema measurements with T2, but the amyloid binding, this would be a really powerful question because of this potential toxicity for these agents.
So I think this is exactly like how Dr. Hatazawa was saying; this is exactly where MR and PET combination together could be so powerful because, yes, we can see changes in binding and we can see changes in perfusion, but unless we can measure them near the same time, we can’t really tease apart the implications of the disease and the therapy. We still don’t know, for example, is vasogenic edema common in the natural history of Alzheimer’s, or is it really only with the therapy? We don’t really know this. So I don’t have enough data to answer your question in detail, but I think you’re focusing on exactly the question we all want to know. Iwao Kanno
Thank you very much. Gregory Sorensen
Yes, thank you. Very interesting. Eku Shimosegawa
So generally speaking, there are two types of simultaneous PET-MR system; one is the separate gantry type and the other is a combined type. So what do you think the actual necessity in the combined type of PET-MR system is in the clinical usage?
Gregory Sorensen
That’s a very good question. It’s one that we’ve been giving some thought to. I think that there are some diseases where only with simultaneous, clinically, will we be able to make an accurate diagnosis. I think there will be a few cases in the pelvis, although most of the cases probably don’t require this. I think that the quantification that we want to do with PETs will require true simultaneity. Now, you can say, “When is quantification important in PET for diagnosis?” Well, I don’t know the answer to that. I think for many years we’ve all been hoping that quantitative measures of PET would actually provide benefit. Will this be true? I think this remains to be seen, but at least we will still have the tools to answer that question. Certainly, I think things like small abnormalities that move, so for example lung nodules, I don’t know how to do that without simultaneity. I think with simultaneous imaging, we will be able to track the movement of the nodule, we will be able to track the movement of the heart and correct for that—

Discussion
Jun Hatazawa We planned a lot of time for each of the speakers including the discussion part
but I think the discussion was so hot and not finished yet. So in this part of the symposium we will discuss more about PET/MRI, especially the technological problems and the future direction. First we will start the discussion on the technological or methodological issues.
Seiichi Yamamoto
My interest in the problem in the PET/MRI system, my main interest is interference between PET and MRI. I would like to discuss about this matter and before that I will show what kind of interferences can be observed in PET and MRI. I prepared some slides for this, will you please show them.
I will summarize about the interferences between SiPM (or APD) PET and MRI on PET/MRI, and if we have enough time we can discuss about the temperature dependent gain of SiPM (APD) PET system.
Probably most of you are now familiar with the interference problem. What is the interference between MRI and other instrumentation? The interference problem is image artifacts or noise on MRI and other modality instruments when used simultaneously.
The MRI/EEG combined system is a good example for understanding the interference phenomena. The EEG is, in Japanese nouha, brain activity.
Simultaneous measurements of MRI/EEG and interference. I was doing this kind of work more than ten years ago. First I was measuring simultaneously MRI and we tried to measure the EEG using electrode and line and the signal is converted to a light signal and transferred outside of the MRI.
This is while measuring the EEG near the MRI magnetic field, this is the carbon fiber-based electrode and line, and the signals are transferred outside of the MRI. This is the instrumentation for converting the EEG signal to the optical signal and again transferred outside of the MRI.
This is the EEG signal outside of the MRI. We can observe a very good alpha wave. This is the frequency domain. We can see a peak in 10Hz. When the subject is measured inside of the MRI we can see these kinds of signals. It looks like the brain activity is increased in MRI. This is frequency domain data; we can see higher activity in 10hHz but observe a lot of other frequencies also. I first thought that inside the MRI

brain activity really is increased but it is an artifact. Why is the EEG signal amplitude increased? The reason is this phenomenon is
called “balistocardiogram”. This is a body movement-related artifact. It was published already several years ago, when I observed it for the first time.
This is the phenomenon of the heart beat, caused by the movement of the heart beat, the body, even the brain is moved less than 1mm, so the line vibrates a very small distance. The movement of the line or electrode induced current, this is because of Faraday’s Law. We observed this current as an artifact. This is without RF signal. With RF signal, this induced current is larger than the maximum amplitude of the amplifier, it becomes saturated, so I cannot measure EEG inside of the MRI. I gave up measuring EEG inside of the MRI after I observed these phenomena.
Interference between Si-PM (APD) PET and MRI will be much more serious because photosensors and electronics are usually installed in MRI.
The possible interference between SiPM PET and MRI is: Interference on PET from MRI: RF induced signals detected by SiPM PET detectors, eddy current related temperature change of PET – I have never… I did not observe this phenomenon yet, but I heard it is possible; interference on MRI from PET: susceptibility artifact of the PET detector ring, signal to noise degradation of MRI from PET electronics noises, and eddy current related artifacts in MRI images. A lot of interferences can occur.
I will show you what kinds of phenomena are observed in my system. These are induced RF signals detected by PET detectors. RF coil emits RF signals, it is detected by PET detectors, this is the oscilloscope signal measured by this phenomena; this is the RF signal. If the signal is bigger than the lower energy threshold of the PET detector, in sinograms we can observe these kinds of spots. These are sinograms of point source; this point produces serial artifacts on the reconstructed image. These are RF signal detector-related interferences.
Eddy current related temperature change came from the gradient signal producing eddy current in the PET detector ring and temperature going up and pulse height usually going down because of the temperature-dependent gain of the SiPM or APD system.
Susceptibility artifact from PET: different susceptibility material was close to the FOV of the MRI; this distorts magnetic field. When I positioned the GSO block near the RF coil, we can observe the distortion of the image and the non-uniformity in the phantom images.
The signal to noise degradation of MRI from PET electronics noise: RF signal noise from the noise of the ground line is emitted to the RF signal, and the signal is

detected by the RF coil of the MRI. This is the image without PET. This is the image with PET. In my SiPM PET-MRI system this phenomenon is most serious.
Eddy current related artifact came from the gradient signal. If we positioned conductive material near gradient signal, it produces eddy current. Eddy currents produced another change of the magnetic field. It produces smoothing of edges or sometimes serious artifacts.
I’d like to ask the people working with SiPM (APD) PET-MRI systems, or like that, “What kind of interferences were observed in your combined system?” and “If you observed interferences how do you, or did you, or will you solve the problems?”
I’d like to ask Dr. Hong, in your first paper on SiPM and measuring MRI, you observed the RF signal and it must be a very serious problem. Light on please. Do you still think it is a problem? Seong Jong Hong
I’d like to say it depends on many parameters, you are right, when we presented my results last year, we saw a lot of interference in the PET system from the RF, the system we changed the magnetic shield, the RF shield. We changed the electronics board. We also changed the cables. I think it really depends on many situations. I think it is difficult to say only just the one change could solve the problems. Seiichi Yamamoto
At the last meeting you used optical fibers to avoid the interference problems, right? Seong Jong Hong
I think the optical fibers don’t have anything to do with these RF interferences. I think it’s more related to your electronics – how you measure the PET system performance with the electronics, and shielding and cables, things like that. I think it is more or less related to the whole system, rather than just one component. Maybe some other people can answer the question, because in our case we are using the clinical MRI, but I think some people are using the 7T MRI, which is for the high tesla MRI, and I think they might have different kind of problems. Maybe they might have some different approaches to solve the problems. Seiichi Yamamoto
Dr. Pichler, could you advise us about the interference problem? You know best

in this room, I think. What kind of phenomena did you observe and what kind of problem was easy to solve? Can you comment on that? Bernd Pichler
We found mainly problems at the beginning when we used too thick copper shielding, so once we reduced it to several micrometers, then interferences were gone. I think we are too scared of interferences, maybe because two worlds come together, the PET and the MRI, and those engineers and physicists who designed the PET, they have no or only little experience of how to design an MRI, and the MRI folks on the other side, they don’t have experience in designing PET. So, the frequencies are very different, which is a headache, but also it helps us because usually the electric frequency we are working with in PET does not necessarily interfere with MRI and vice versa. So this is one thing which really helps us, that we are working in nanoseconds range in analog PET and in milliseconds range in MRI. If we layout the system very carefully, it should not provide a big headache. Especially since the MRI also need electronics in their field, and we should not forget that they have amplifiers for the receive/transmit coils and so on, and they did it also in a way that it does not interfere with their MR signals. So I guess the PET engineers, physicists, have just listened more on the MRI, what they know already: what materials can you use, what frequencies you should avoid, and then it should be quite straightforward to develop a combined system without any interferences. Seiichi Yamamoto
You mean that we need MRI specialists for … Bernd Pichler
At least you should consult with one, yes.
Seiichi Yamamoto The slide of the interference with PET-MRI does not contain any fault, do I
understand that correct? For the interference of PET-MRI, is possibly that all? Don’t you have any other possibility of interferences? Do you think that what I mentioned is all we have to care about? Bernd Pichler
I think that is all, yes.

Seiichi Yamamoto
Oh really? Thank you. Anyone who observed any phenomena? Prof. Tsui? Didn’t you have some interference problems on SPECT/MRI? Benjamin Tsui
Yes, we did find a few problems in the beginning, but we solved them. I mentioned a couple of them in my talk, but other things like the RF coil design, the first one we got was not very good. It’s kind of noisy, you pick up some noise, even outside of the MR system, and it just does receiving, so we improved on that. And I also mentioned when you turn on the counting, I don’t know about PET, but in our case, if you start counting, the counting actually will create some frequency which also interferes a little bit with the RF. So again you have the question of how big it is, to manage. We found a little bit of that. We also found at the early stage it was the collimator material, as I mentioned. If you saw that it is not as good so we go to powder. Those kinds of things we do see and we are also solving them one at a time. Seiichi Yamamoto
Thank you. Can someone comment on the interference of PET and MRI or give some observations on PET-MRI? Gregory Sorensen
I can just say that from the measurements we made in the brain PET prototype system, that the kinds of artifacts you showed, we do not have this problem. I don’t know all the things that the manufacturer did to resolve these issues, but we scanned many people with the insert in and also with the insert out, we’ve published the same kinds of data that Dr. Pichler showed in his pre-clinical and clinical systems. We don’t see these interference problems. So I am sure that they were there, but that there was much professional engineering at work to try to eliminate the problems, and I would not have guessed, like Dr. Pichler said, the counter-intuitive solution that thinner copper, rather than thicker copper, was the solution. But my guess is that professional engineers know these kinds of tricks or at least have explored them with his help and other people’s help.
So in practice the system makes both the brain PET system and the images we have seen from the simultaneous whole body system in Munich, they look fine, they don’t have these issues. I will also say we do a lot of EEG in the magnets and EEG in

our MEG, and so these kinds of electrical interference problems we are very familiar with and see them, balistocardiogram effects, et cetera. But there are published and unpublished ways of trying to resolve them, so I would say this is in the realm of solvable problems, and solved problems in many systems. Seiichi Yamamoto
Thank you very much. Participant 3 (male, Japanese)
We had a lot of trouble with this RF interference, two times we used rather thick shielding materials, I think it was something like close to 50µm. So I think the thickness of the shielding boxes is actually published in JNM [The Journal of Nuclear Medicine]. The author is Dr. Pichler. If you read his paper carefully, you will really find that he uses very thin thickness of shielding material. Actually, that is one of the changes we made. Seiichi Yamamoto
Thank you. Let’s move on to another topic.
Jun Hatazawa During this symposium I really understood what the merit of the combination
of PET and MRI is after the very excellent lectures by Dr. Pichler, and Dr. Sorensen, and Dr. Kalemis. Before closing this symposium, I would like to ask for some comments from the invited speakers from foreign countries, and please give us some encouraging comments on the symposium. We will plan the next, the third one, next year again, hopefully. From Dr. Jae Sung Lee, you spoke first in this symposium as a foreign invited speaker, so could you give us some comments on PET-MRI or this symposium? Jae Sung Lee
Thank you again for inviting me to this great symposium. Although I gave the invited talk I think that I had more things to learn in this symposium during these two days. Thank you very much for that. Actually, I just have one comment on the direction of the PET-MR future development. I think that one of the most important roles of PET-MRI would be the reduction of the radiation dose, as it has been mentioned several times during the symposium. You know that to do such a role I think that to minimize the cost of the development of the PET scanner would be a very important effect, I think,

because to reduce the radiation dose, the actual FOV is one of the most important technical factors. But you know that current PET scanners only have a 15-20cm axial FOV. I think that most of the technical barriers to extend such an axial FOV would be the cost of the photosensor. So I think that one of the important technical things that we should pursue would be to reduce the cost of photo sensors to make the long axial FOV, TOF PET or something like that for the real whole-body PET-MRI. I think that would be the best way to reduce radiation, for further reduction of the radiation dose in the PET-MRI. So if we can achieve such a goal I think that although we reduce such developing cost we can have a chance to use the PET-MRI for the cancer screening devices because we need just a very small amount of radiation activity, so I think that would be one of the most important goals, that we have to achieve in this society. Jun Hatazawa
And would you please announce the Seoul meeting two years later to the audience? Jae Sung Lee
Okay, thank you for asking me about that. Two years later in 2013, there will be a very big technical meeting in Seoul, Korea, in the last week of October, we will host the IEEE [Institute of Electrical and Electronics Engineers] Nuclear Science Symposium and Medical Imaging Conference in Seoul, Korea. Actually, it is the biggest meeting of the IEEE NPS [Nuclear & Plasma Sciences] Society. We are expecting more than 2000 participants during the meeting. It is the biggest meeting to discuss about technologies in nuclear science and medical imaging, especially the medical imaging is much focused on radiation-based imaging. It will be a very good opportunity for you to learn about advanced technology in this field in a place very near from Japan. It takes just two hours from here, and there are very many delicious Korean foods! You are welcome to Korea in 2013. Jun Hatazawa
Thank you very much. Dr. Hong, please. Seong Jong Hong
Thank you very much for inviting me to this wonderful conference. Actually I envy your situation; I mean Prof. Hatazawa is leading the group. Unfortunately I don’t have that much of a close relationship with medical doctors – not yet. I think it consists

of Jae Sung, he is the leader of our group. Myself, I am a physicist; and we have another physicist who is working on MR. I realized that, as I heard from Dr. Hatazawa and Dr. Sorensen, what they proposed today for the issue of optical fiber for the PET-MRI, I think the systems might have some limitations for the quality of the MR images. But we cannot push for the unlimited so there must be some limitations, but those limitations also must depend on what kind of disease, what kind of symptoms you are looking for. For those kind of areas you need consultation with doctors, so I think I really appreciate that Prof. Hatazawa and Prof. Sorensen talked. That was really educative for me. Thank you very much. Jun Hatazawa
I would like to ask for some comments from Dr. Benjamin Tsui from Hopkins University, who coincidentally also attended this meeting. Thank you very much. Benjamin Tsui
It is a real pleasure for me, I really learned a lot. I guess I’m an outsider. I have kind of been watching this field from outside, I didn’t realize it is going so fast. Especially, I am really impressed how you get it into clinics so fast. So we are still struggling in SPECT-MR, I think because of the funding. America has become a poor country now, and we don’t get a lot of funding! But I hope that more of you are coming to SPECT-MR, there is still a lot of work to do, and I still feel with SPECT there is a lot of potential, despite what Simon Cherry said, I still think that we can do very good quantitative analysis with the technology, I think SPECT can get increased sensitivity and good quantification. I think we are a little bit limited in terms of the agent, but I think we still have a lot of agents that are readily available, I think that is something that I hope some of you in the audience will also come into the field and get that going. It was a lot of fun. Thank you. Jun Hatazawa
Now I would like to ask Dr. Pichler from the University of Tuebingen, to give us some encouraging comments. Bernd Pichler
First of all, thank you very much for the invitation, I enjoyed to be here and also I learned a lot from the different talks. What I find impressive on this meeting that it covers really the technology and the medical part. Usually the meetings when we look

at IEEE or SNM [Society of Nuclear Medicine], we have either the focus on the technology or on the medical application, and I guess in a wonderful way this combines both.
The other thing I would really like to try… – and also what Ben said – it is impressive how fast this progresses, and when we just recall what happened last year, just over the last twelve months, when we first met over here, it is somehow impressive that it goes into the clinic and also when we saw the scanner in Munich last week. I mean it is far away from what happened with PET-CT, that all the protocols have to be established, and it was nearly a five-year period that you can do attenuation correction, and that you have more or less the flexibility for the protocols. Those scanners are now ready to really take data and they don’t struggle with problems like how to set up the protocol, it gives you all the flexibility you like. So it is really highly advanced and I am looking forward to what will happen next year and if this goes on like this I think we have PET-MRI very soon established in the clinical environment. Thank you very much. Jun Hatazawa
So would you give us any comments? Dr. Antonis Kalemis from London? Antonis Kalemis
I would like to thank you again for having me here, and inviting me to give the presentation. I would only concur with what Prof. Pichler just said, and I think that I speak not just for Phillips but for all manufacturers, that only we can – particularly for a modality such as PET-MR, where it was quite different the way that it is introduced from PET-CT, because in PET-CT there are already indications for clinical use. In PET-MR we are looking at both the technological and clinical community for ideas for how to develop those systems as well as how those systems will be used and whether it is meaningful for us to invest a vast amount of money and expertise into this modality. So particularly, attending this conference, I would ask you to continue having such a conference. I think it is the only way that PET-MRI will be promoted also internally into the community. Again thank you very much for organizing such an event. Jun Hatazawa
Prof. Sorensen? May I have some comments? Gregory Sorensen
Sure, a couple of things. You know, one of the surrogates that American

universities use for quality of research is controversial but it is still used, and that is amount of NIH funding. So they think that if they have a lot of NIH funding then it must be important, because the peers are the ones that make this decision. And traditionally in radiology, the two biggest sources of research funding groups who have been the most successful have been the PET people and the MR people. CT not so successful, ultrasound not so successful, but these two have been very successful. So I think merging these two together will be very exciting and really bring us to the sweet spot of opportunity. So I think that’s really motivating and I think that suggests that we will be able to catapult forward.
I do think that the one of the challenges that PET has had that I as a bit of an outsider observed, is that for now a couple of decades, the innovation in PET has traditionally thought to be in the chemistry side, new PET tracers, and yet the translation of these into clinical practice has been very challenging. The amyloid probe from Avid will be the first really new important probe that will be widely used in, I don’t know, a decade, maybe more. And if MR-PET or PET-MR is really going to move beyond what just MR can do, I think we have to find ways to speed this up. We have to innovate faster, and show more value. And I think one of the reasons that this translation has been slow, is that many of the tracers have not really solved important problems. So I would encourage you to think about the most important problems and build systems, tools, hardware, software, wetware to focus on those things. And then I think our system will… the world will be grateful and will provide lots of money for future conferences which I am very grateful to be able to attend. Thank you very much.

Closing Remarks
Jun Hatazawa We have almost finished this part of the symposium, and finally I would like to
have closing remarks from Prof. Seiichi Yamamoto, the organizer of this symposium. Seiichi Yamamoto
Thank you very much for coming to this second international PET-MRI symposium. Thank you very much. This second meeting is really international; with almost half of the speakers coming from abroad. Thank you very much for coming to Japan in this cold winter season, thank you very much. Also the Japanese invited speakers and other speakers from Japan, it was a very nice talk. This time the questions and discussions were very hot compared with the first meeting. It was a very nice meeting I think. As Dr. Hatazawa mentioned, he is planning the third international meeting next year, I don’t know if it can be realized or not, but if it is realized, please come here again, and lets discuss about PET-MR, and instrumentation, and application. This time thank you very much again for coming to the symposium. Thank you very much.
END


![Multimodal analysis using [11C]PiB-PET/MRI for functional](https://img.dokumen.tips/doc/110x75/61ff326588a357094244a349/multimodal-analysis-using-11cpib-petmri-for-functional-.jpg)