Embed Size (px)
Citation preview

The 21 Century tech tsunami- batteries will be included
Prof Ray Wills
Managing DirectorFuture Smart Strategies
Adjunct ProfessorThe University of Western Australia
@ProfRayWills

How to be abetter surfer Where is all this
new tech taking us? What do markets tell
us about how quickly disruptive technologies will impact on everything?
How do we prepare ourselves, our businesses and our cities for mind-boggling rapid change?
What’s all this got to do with lithium and batteries?
Prediction is very difficult, especially about the future. (Niels Bohr)
@ProfRayWills

Roger’s diffusion curve
@ProfRayWills
Wake up and smell the roses
Buggy whips -> combustion engine -> EVs? (Electric) typewriter -> word processor -> PC PC -> desktop -> laptop -> tablet Landline -> mobile -> smartphone (BlackBerry) Record shops Vinyl -> CD -> (Apple Store) VHS/Beta -> DVD -> BlueRay -> Cloud Book Shops Boutique -> mega -> (Amazon) Retail shop-> Boutique-> chain/mega -> Internet Energy -> chopping wood -> coal -> wind -> solar
@ProfRayWills

Technology adoption rates – US Solar panels are VCRs, not dishwashers Batteries will be, too
(Will there ever be any more dishwashers??)
NY Times @ProfRayWills

A Brief Moment in Time

Predicting anything is difficult
@ProfRayWills

Predicting anything is difficult
@ProfRayWills
And don’t forget the old tech exit

Technology adoption rates - vehicles
Zoepf 2011

Technology adoption rates - vehicles
Zoepf 2011
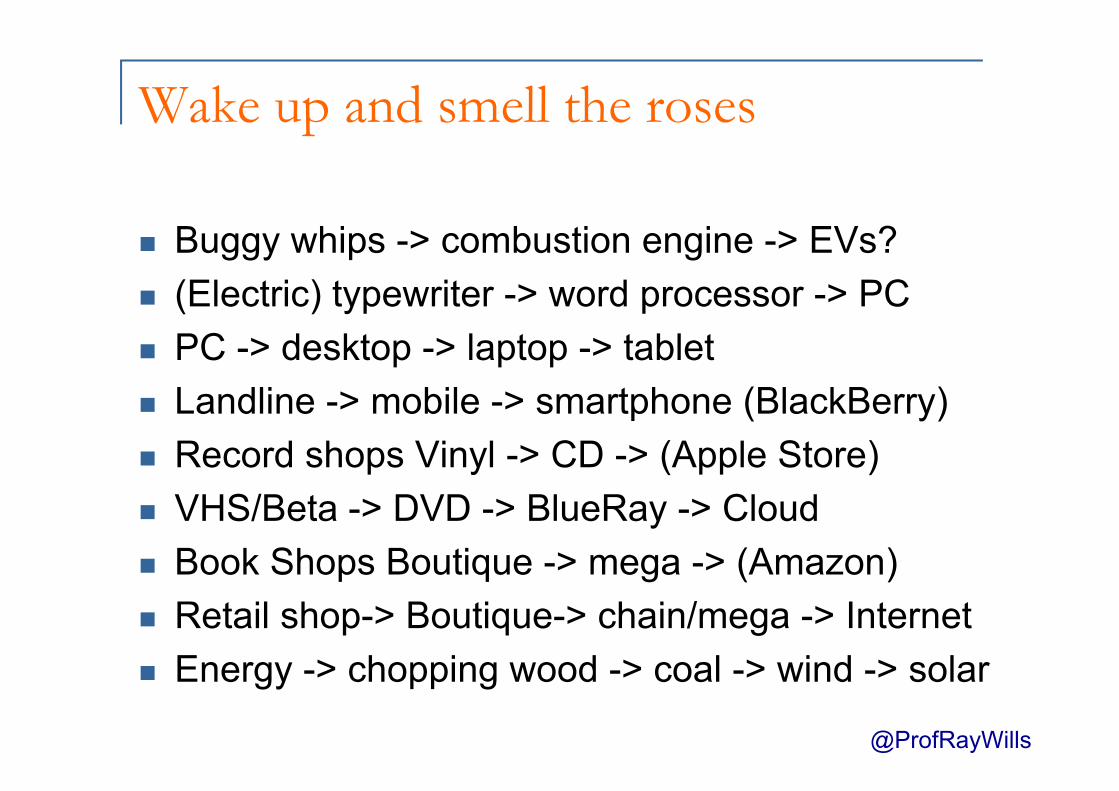
The Big Bang Theory
@ProfRayWills

Declining PV price
@ProfRayWills

Global renewables 2015 +>
@ProfRayWills

Global renewables growth and forecast
@ProfRayWills

Batteries already a common commodity

Storage will be simply a common commodity

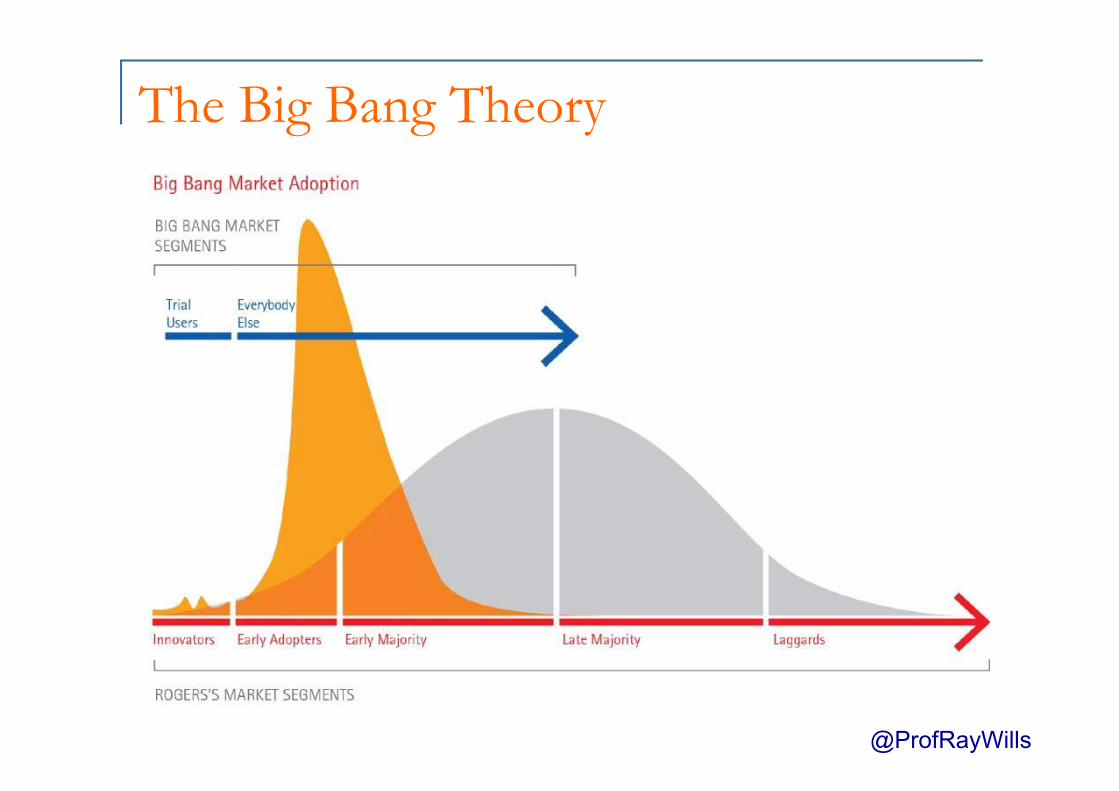
Potential EV growth (already faster)
@ProfRayWills

Commercialtransport

Storage will be simply a common commodity
@ProfRayWills

Storage will be simply a common commodity
@ProfRayWills

Storage will be simply a common commodity
@ProfRayWills

Storage will be simply a common commodity
@ProfRayWills

@ProfRayWills

Neometals AGM, Perth.27th November 2015Professor Dudley J. KingsnorthCurtin Graduate School of Business & IMCOA
“Australia: A Reliable and Diverse Source of Lithiumfor the Expanding Battery Market ”

DisclaimerDisclaimer(“Forward Looking Statements”)(“Forward Looking Statements”)
The statements in this presentation represent the considered views of the Industrial Minerals Company of AustraliaPty Ltd (IMCOA) and the Curtin Graduate School of Business (CGSB) at Curtin University, Western Australia. Itincludes certain statements that may be deemed "forward-looking statements." All statements in this presentation,other than statements of historical facts, that address future market developments, government actions and events,are forward-looking statements. Although IMCOA and CGSB believe the outcomes expressed in such forward-lookingstatements are based on reasonable assumptions, such statements are not guarantees of future performance andactual results or developments may differ materially from those in forward-looking statements. Factors that couldcause actual results to differ materially from those in forward-looking statements include new rare earth applications,the development of economic rare earth substitutes and general economic, market or business conditions.While, IMCOA and CGSB have made every reasonable effort to ensure the veracity of the information presented theycannot expressly guarantee the accuracy and reliability of the estimates, forecasts and conclusions contained herein.Accordingly, the statements in the presentation should be used for general guidance only.
DisclosureDisclosureProfessor Dudley J. Kingsnorth, through the Industrial Minerals Company of Australia Pty Ltd (“IMCOA”) and CurtinUniversity provides rare earths and lithium market and project development advice to a number of consumers andproducers This advice is provided on a fee for service basis; with no success or promotional fees or obligations. Thereare Confidentiality Agreements in place with many of these companies, but this does not preclude comment on thepublic information available on these companies.Given the highly prospective opportunities offered by the forecast high growth in demand for lithium IMCOA does ownsecurities in a number of lithium companies. Professor Kingsnorth does not hold any executive or non-executivepositions in any company associated with the lithium sector.
Curtin University is a trademark of Curtin University of TechnologyCRICOS Provider Code 00301J
The statements in this presentation represent the considered views of the Industrial Minerals Company of AustraliaPty Ltd (IMCOA) and the Curtin Graduate School of Business (CGSB) at Curtin University, Western Australia. Itincludes certain statements that may be deemed "forward-looking statements." All statements in this presentation,other than statements of historical facts, that address future market developments, government actions and events,are forward-looking statements. Although IMCOA and CGSB believe the outcomes expressed in such forward-lookingstatements are based on reasonable assumptions, such statements are not guarantees of future performance andactual results or developments may differ materially from those in forward-looking statements. Factors that couldcause actual results to differ materially from those in forward-looking statements include new rare earth applications,the development of economic rare earth substitutes and general economic, market or business conditions.While, IMCOA and CGSB have made every reasonable effort to ensure the veracity of the information presented theycannot expressly guarantee the accuracy and reliability of the estimates, forecasts and conclusions contained herein.Accordingly, the statements in the presentation should be used for general guidance only.
DisclosureDisclosureProfessor Dudley J. Kingsnorth, through the Industrial Minerals Company of Australia Pty Ltd (“IMCOA”) and CurtinUniversity provides rare earths and lithium market and project development advice to a number of consumers andproducers This advice is provided on a fee for service basis; with no success or promotional fees or obligations. Thereare Confidentiality Agreements in place with many of these companies, but this does not preclude comment on thepublic information available on these companies.Given the highly prospective opportunities offered by the forecast high growth in demand for lithium IMCOA does ownsecurities in a number of lithium companies. Professor Kingsnorth does not hold any executive or non-executivepositions in any company associated with the lithium sector.
2
IMCOA

Lithium: What is it?Lithium: What is it?
Curtin University is a trademark of Curtin University of TechnologyCRICOS Provider Code 00301J
IMCOA3

LithiumLithium ––Li, LiLi, Li22O or LiO or Li22COCO33 ??
The lithium content of minerals and compounds is referred to in one of three unitsdepending on the source quoted and the end-use referred to:
lithium (Li) content lithium oxide (lithia, Li2O) content lithium carbonate (Li2CO3) content or lithium carbonate equivalent (LCE)
Lithium oxide content is widely-used in the glass and ceramics industry, while LCE iscommonly used for lithium compounds. The conversion factors are shown below.
Curtin University is a trademark of Curtin University of TechnologyCRICOS Provider Code 00301J
IMCOA4
The lithium content of minerals and compounds is referred to in one of three unitsdepending on the source quoted and the end-use referred to:
lithium (Li) content lithium oxide (lithia, Li2O) content lithium carbonate (Li2CO3) content or lithium carbonate equivalent (LCE)
Lithium oxide content is widely-used in the glass and ceramics industry, while LCE iscommonly used for lithium compounds. The conversion factors are shown below.
Conversion FactorsTo Convert from: to Li x to Li2O x to Li2CO3 xLithium Li (100% Li) 1.00 2.53 5.32
Lithium Oxide Li2O (Lithia) (46.4% Li) 0.46 1.00 2.47
Lithium Carbonate Li2CO3 (18.8% Li) 0.19 0.40 1.00
Spodumene LiAl (SiO3)2 0.04 0.08 0.16
The Lithium Market TodayThe Lithium Market Today
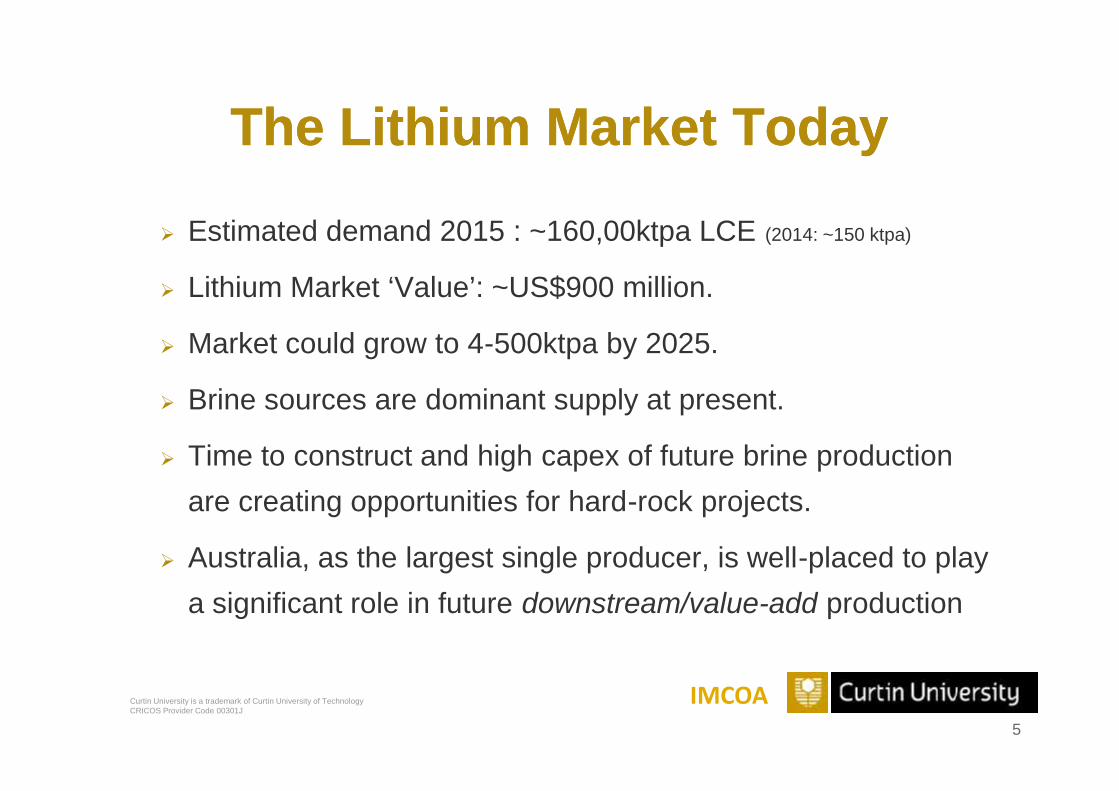
Estimated demand 2015 : ~160,00ktpa LCE (2014: ~150 ktpa)
Lithium Market ‘Value’: ~US$900 million.
Market could grow to 4-500ktpa by 2025.
Brine sources are dominant supply at present.
Time to construct and high capex of future brine productionare creating opportunities for hard-rock projects.
Australia, as the largest single producer, is well-placed to playa significant role in future downstream/value-add production
Curtin University is a trademark of Curtin University of TechnologyCRICOS Provider Code 00301J
Estimated demand 2015 : ~160,00ktpa LCE (2014: ~150 ktpa)
Lithium Market ‘Value’: ~US$900 million.
Market could grow to 4-500ktpa by 2025.
Brine sources are dominant supply at present.
Time to construct and high capex of future brine productionare creating opportunities for hard-rock projects.
Australia, as the largest single producer, is well-placed to playa significant role in future downstream/value-add production
IMCOA5
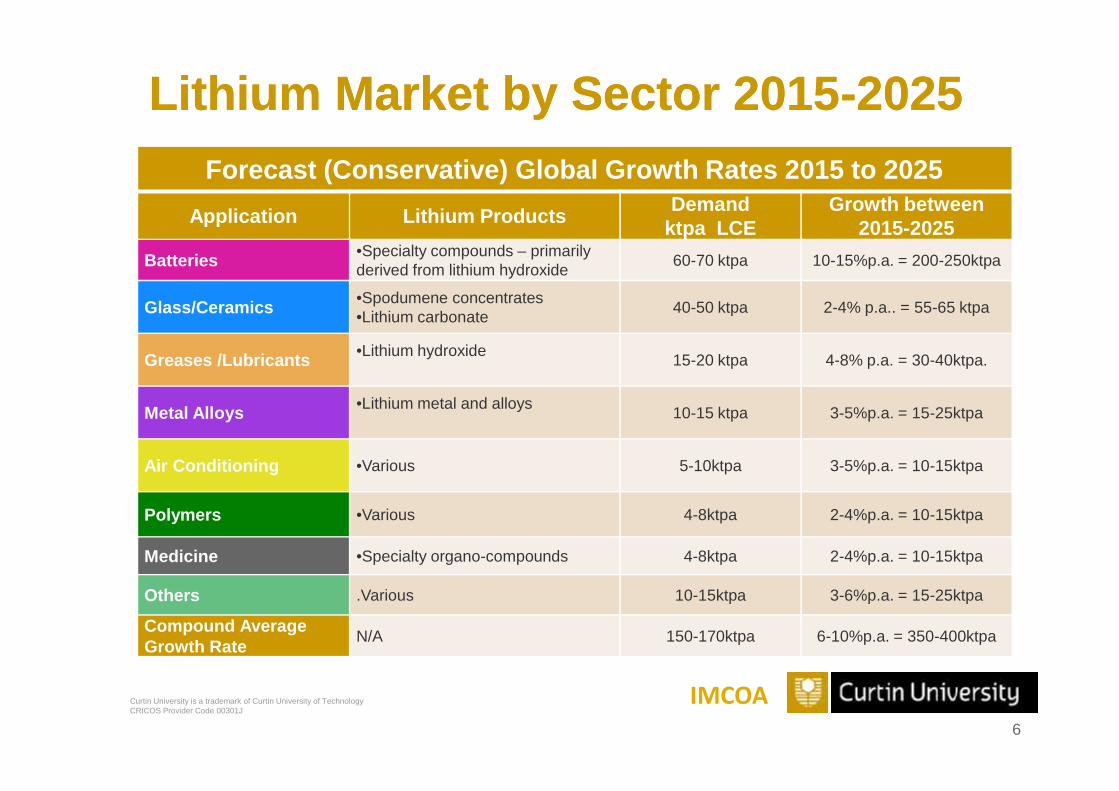
Lithium Market by Sector 2015Lithium Market by Sector 2015--20252025Forecast (Conservative) Global Growth Rates 2015 to 2025
Application Lithium Products Demandktpa LCE
Growth between2015-2025
Batteries •Specialty compounds – primarilyderived from lithium hydroxide 60-70 ktpa 10-15%p.a. = 200-250ktpa
Glass/Ceramics •Spodumene concentrates•Lithium carbonate 40-50 ktpa 2-4% p.a.. = 55-65 ktpa
Greases /Lubricants •Lithium hydroxide 15-20 ktpa 4-8% p.a. = 30-40ktpa.
•Lithium metal and alloys
Curtin University is a trademark of Curtin University of TechnologyCRICOS Provider Code 00301J
Metal Alloys •Lithium metal and alloys 10-15 ktpa 3-5%p.a. = 15-25ktpa
Air Conditioning •Various 5-10ktpa 3-5%p.a. = 10-15ktpa
Polymers •Various 4-8ktpa 2-4%p.a. = 10-15ktpa
Medicine •Specialty organo-compounds 4-8ktpa 2-4%p.a. = 10-15ktpa
Others .Various 10-15ktpa 3-6%p.a. = 15-25ktpa
Compound AverageGrowth Rate N/A 150-170ktpa 6-10%p.a. = 350-400ktpa
IMCOA6

The Ideal BatteryThe Ideal Battery ––Why Lithium?Why Lithium?
1.High Charge Density
2.Light
3.Recharges Rapidly
4.Long lifespan
5.Discharge rate
6.Ability to hold charge for long period of time
Curtin University is a trademark of Curtin University of TechnologyCRICOS Provider Code 00301J
1.High Charge Density
2.Light
3.Recharges Rapidly
4.Long lifespan
5.Discharge rate
6.Ability to hold charge for long period of time
IMCOA7

Lithium: Dominant ReLithium: Dominant Re--chargeable Batterychargeable Battery
Curtin University is a trademark of Curtin University of TechnologyCRICOS Provider Code 00301J
IMCOA8

Batteries will be the Major ApplicationBatteries will be the Major Applicationfor Lithium for the Next Decadefor Lithium for the Next Decade
Curtin University is a trademark of Curtin University of TechnologyCRICOS Provider Code 00301J
IMCOA9

Potential ImpactPotential Impactof Indicativeof Indicative
Battery FactoryBattery FactoryExpansionsExpansions ––
CreatingCreatingOpportunitiesOpportunities
for Newfor NewSuppliersSuppliers
Curtin University is a trademark of Curtin University of TechnologyCRICOS Provider Code 00301J
Potential ImpactPotential Impactof Indicativeof Indicative
Battery FactoryBattery FactoryExpansionsExpansions ––
CreatingCreatingOpportunitiesOpportunities
for Newfor NewSuppliersSuppliers
IMCOA10

Lithium CarbonateLithium Carbonate(Li(Li22COCO33))
Long considered the building block of the lithiumindustry as for many years it has been the basicchemical from which lithium compounds aremanufactured, including battery chemicals. Why? Low cost Readily available Relatively easy to store
Curtin University is a trademark of Curtin University of TechnologyCRICOS Provider Code 00301J
Long considered the building block of the lithiumindustry as for many years it has been the basicchemical from which lithium compounds aremanufactured, including battery chemicals. Why? Low cost Readily available Relatively easy to store
IMCOA11

Lithium hydroxideLithium hydroxide(LiOH)(LiOH)
Excellent physical properties for moving and storingelectrons.
Has gained popularity as battery chemists improveperformance.
Estimated demand in 2015:35kt.
Estimated demand in 2025:80-160kt.
Curtin University is a trademark of Curtin University of TechnologyCRICOS Provider Code 00301J
Excellent physical properties for moving and storingelectrons.
Has gained popularity as battery chemists improveperformance.
Estimated demand in 2015:35kt.
Estimated demand in 2025:80-160kt.
IMCOA12

Growing Support forGrowing Support for LiOHLiOH
Tesla Gigafactory committed to using LiOH.
US government contributed US$30m towards small LiOHproduction plant in USA.
Canadian government has contributed CAD$13Mtowards LiOH pilot plant in Canada.
Albemarle committed to expanding lithium productioncapacity via Australian spodumene – in Asia (WA to beassessed as a site)
Curtin University is a trademark of Curtin University of TechnologyCRICOS Provider Code 00301J
Tesla Gigafactory committed to using LiOH.
US government contributed US$30m towards small LiOHproduction plant in USA.
Canadian government has contributed CAD$13Mtowards LiOH pilot plant in Canada.
Albemarle committed to expanding lithium productioncapacity via Australian spodumene – in Asia (WA to beassessed as a site)
IMCOA13

Hard rock lithium prices are risingHard rock lithium prices are rising
Curtin University is a trademark of Curtin University of TechnologyCRICOS Provider Code 00301J
IMCOA14

Potential Impact of Battery DemandPotential Impact of Battery Demand(In Lithium Carbonate Equivalent (LCE),(In Lithium Carbonate Equivalent (LCE), tpatpa ((±±30%)30%)
(Notes: 1. Assume Battery Growth in Demand is 15-20%p.a. to 2025 2. Assume 7.75 tonnes of spodumeneconcentrate @ 6% Li2O is required to produce 1.00 tonnes of lithium carbonate). 3. Figures have been rounded)
Demand&
Capacity
2015 2020 2025
Brine HardRock Brine Hard Rock Brine Hard Rock
Demand 150,000tpa LCE 275,000tpa LCE 450,000tpa LCE
Curtin University is a trademark of Curtin University of TechnologyCRICOS Provider Code 00301J
Demand 150,000tpa LCE 275,000tpa LCE 450,000tpa LCE
Capacity(Required) 120,000tpa
95,000tpa(725 ,000tpaSpod Cons)
150,000tpa175,000tpa(1,350 ,000tpaSpod Cons)
200,000tpa300,000tpa(2,500 ,000tpaSpod Cons)
Supply 85,000tpa65,000tpa(525,000tpaSpod Cons)
125,000tpa150,000tpa(1,150,000tpaSpod Cons)
175,000tpa275,000tpa(2,000 ,000tpaSpod Cons)
AdditionalCapacity
(in 5/10 years)n/a n/a 35,000tpa
80,000tpa(625,000tpaSpod Cons)
80,000tpa205,000tpa(1,525,000tpaSpod Cons)
15
IMCOA

Australian Hard Rock Lithium ProjectsAustralian Hard Rock Lithium Projects
Company Location ResourceMt @ Li2O%
Equiv.Tonnes Li2CO3
Operational Study Output6% Li2OSpod. Con.
Equiv.Tonnes Li2CO3
Talison Greenbushes 120Mt @ 2.4% Li2O7,100kt LCE Yes N/A 500ktpa cons
75 ktpa LCE
Neometals Kalgoorlie 23Mt @ 1.4% Li2O800kt LCE Q3 2016 Complete 200ktpa cons
30ktpa LCE
Curtin University is a trademark of Curtin University of TechnologyCRICOS Provider Code 00301J
Neometals Kalgoorlie 23Mt @ 1.4% Li2O800kt LCE Q3 2016 Complete 200ktpa cons
30ktpa LCE
General Mining Ravensthorpe 16Mt @ 1.1% Li2O400kt LCE Q2 2016 In progress 80ktpa cons
12ktpa LCE
Pilbara Minerals Port Hedland 41Mt @ 1.4% Li2O1,400kt LCE 2017 In progress TBA
Altura Mining Port Hedland 26Mt @ 1.2% Li2O800kt LCE TBA In progress TBA
16
IMCOA

Australia: The OpportunityAustralia: The Opportunity
Battery demand could exceed supply.
Adjacent to major Asian battery manufacturers.
Maintain our #1 global lithium supplier status.
Potentially more sustainable to add value inAustralia right through to batteries - whenspodumene concentrates only 6% Li2O
Curtin University is a trademark of Curtin University of TechnologyCRICOS Provider Code 00301J
Battery demand could exceed supply.
Adjacent to major Asian battery manufacturers.
Maintain our #1 global lithium supplier status.
Potentially more sustainable to add value inAustralia right through to batteries - whenspodumene concentrates only 6% Li2O
IMCOA17

[email protected] [email protected]
“Australia: A Reliable and Diverse Source of Lithiumfor the Expanding Battery Market ”

1
ASX Code: NMT27 November 2015
Investor Presentation

2
+ =
2
Disclaimer
Summary information: This document has been prepared by Neometals Ltd (“Neometals” or “the Company”) to provide summary information about the Company and its associated entities and their activities current as at the date of this document. The information contained in this document is of general background and does not purport to be complete. It should be read in conjunction with Neometals’ other periodic and continuous disclosure announcements lodged with the Australian Securities Exchange, which are available at www.asx.com.au.
Forward-looking information: This document includes certain statements, opinions, projections, forecasts and other forward-looking information which, while considered reasonable by Neometals, are inherently subject to significant uncertainties and contingencies. Many known and unknown factors could cause actual events or results to differ materially from estimated or anticipated events or results included in this document. Recipients of this document are cautioned that forward-looking statements are not guarantees of future performance – they must make their own independent investigations, consideration and evaluation of the opportunity to invest in the Company. By accepting this document, recipients agree that if they proceed further with their investigations, consideration or evaluation of the opportunity to invest in the Company, they will make and rely solely upon their own investigations and enquiries and will not in any way rely upon this document.
Any statements, opinions, projections, forecasts and other forward-looking information contained in this document do not constitute any commitments, representations or warranties by Neometals and its associated entities, directors, agents and employees, including any undertaking to update any such information. Except as required by law, and only to the extent so required, directors, agents and employees of Neometals shall in no way be liable to any person or body for any loss, claim, demand, damages, costs or expenses of whatsoever nature arising in any way out of, or in connection with, the information contained in this document.
Financial data: All figures in this document are in Australian dollars (AUD) unless stated otherwise.
Not financial product advice: This document is for information purposes only and is not financial product or investment advice, nor a recommendation to acquire securities in Neometals. It has been prepared without taking into account the objectives, financial situation or needs of individuals. Before making any investment decision, prospective investors should consider the appropriateness of the information having regard to their own objectives, financial situation and needs and seek legal and taxation advice appropriate to their jurisdiction.
Investment risk: An investment in securities in Neometals is subject to investment and other known and unknown risks, some of which are beyond the control of Neometals. The Company does not guarantee any particular rate of return or the performance of Neometals. Investors should have regard to the risk factors outlined in this document.
Competent Persons Statement:The information in this document that relates to “Barrambie Scoping Study Results”, “Mt Marion test work results”, “Barrambie Mineral Resource Estimates”, “Mt Marion Mineral Resource Estimates” and“Barrambie Pre Feasibility Study Results” is extracted from ASX Releases set out below. The Company confirms that it is not aware of any new information or data that materially affects the informationincluded in the ASX Releases set out below, and in the case of estimates of mineral resources, that all material assumptions and technical parameters underpinning the estimates in those ASX Releasescontinue to apply and have not materially changed.
The Company confirms that all the material assumptions underpinning the production target and the forecast financial information derived from the production targets in the Barrambie Pre-feasibility Studyand Mt Marion Pre-feasiblity Study continue to apply and have not materially changed.
2
13/11/2013 Barrambie - Scoping Study Results6/12/2013 Barrambie - Amended JORC 2012 Mineral Resource Estimate25/08/2015 Barrambie Pre Feasibility Study Results21/09/2015 Mt Marion Lithium Project - New Mineral Resource Estimate

3
Our Strategy
To generate multiple, long term cashflow streams that we can share with our shareholders

4
+ =
4
Last close ( 12 Dec 2014 ) $ 0.036
Shares on issue M 499.4
Cash (30 Sept 2014) $m 11.7
Incl Restricted Term Deposit $m 6.2
Market capitalisation $m 19
ASX Code: NMT OTC: NMTUY
Corporate Details
Price (AU cents)
Last close (26 Nov 2015) A$0.135
Shares on issue 559 M
Cash (30 September 2015) A$34 M
Incl Restricted Term Deposit A$5.1 M
Market capitalisation A$75 M
ASX Code: NMT OTC: RDRUY
0
5
10
15
20
25
5
+ =
5
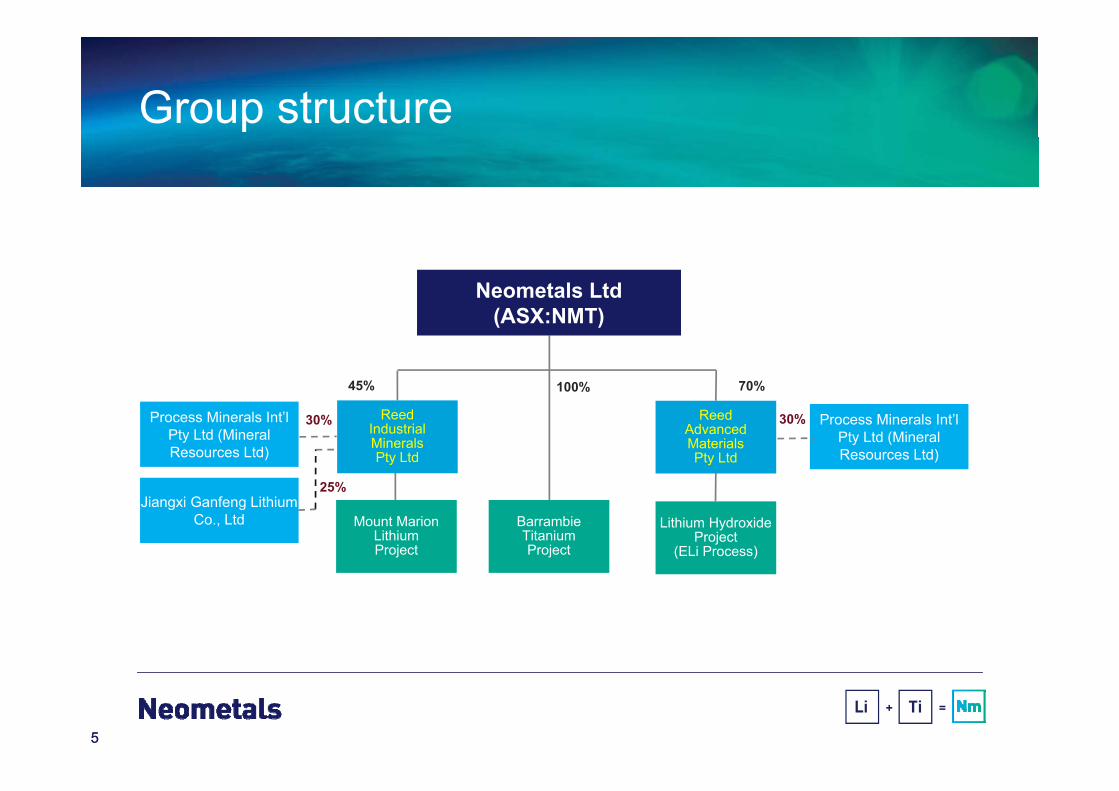
Group structure
Neometals Ltd(ASX:NMT)
ReedIndustrialMineralsPty Ltd
Mount MarionLithium Project
45%
ReedAdvancedMaterialsPty Ltd
Lithium Hydroxide Project
(ELi Process)
Process Minerals Int’l Pty Ltd (Mineral Resources Ltd)
30%
Jiangxi Ganfeng Lithium Co., Ltd
Process Minerals Int’l Pty Ltd (Mineral Resources Ltd)
25%
30%
70%
Barrambie TitaniumProject
100%

6
+ =
6
Board and management structure
• Disciplined, cohesive and engaged board/management group
• Move to best practice CG structure• Steven Cole becomes Independent Chairman• David Reed remains Non-executive Director• Recruit up to 2 additional independent NED’s• Lean CEO/CFO/COO management team• Appointment of Senior Lithium industry
executive Michael Tamlin as COO

7
+ =
+ =
7

8
+ =
8
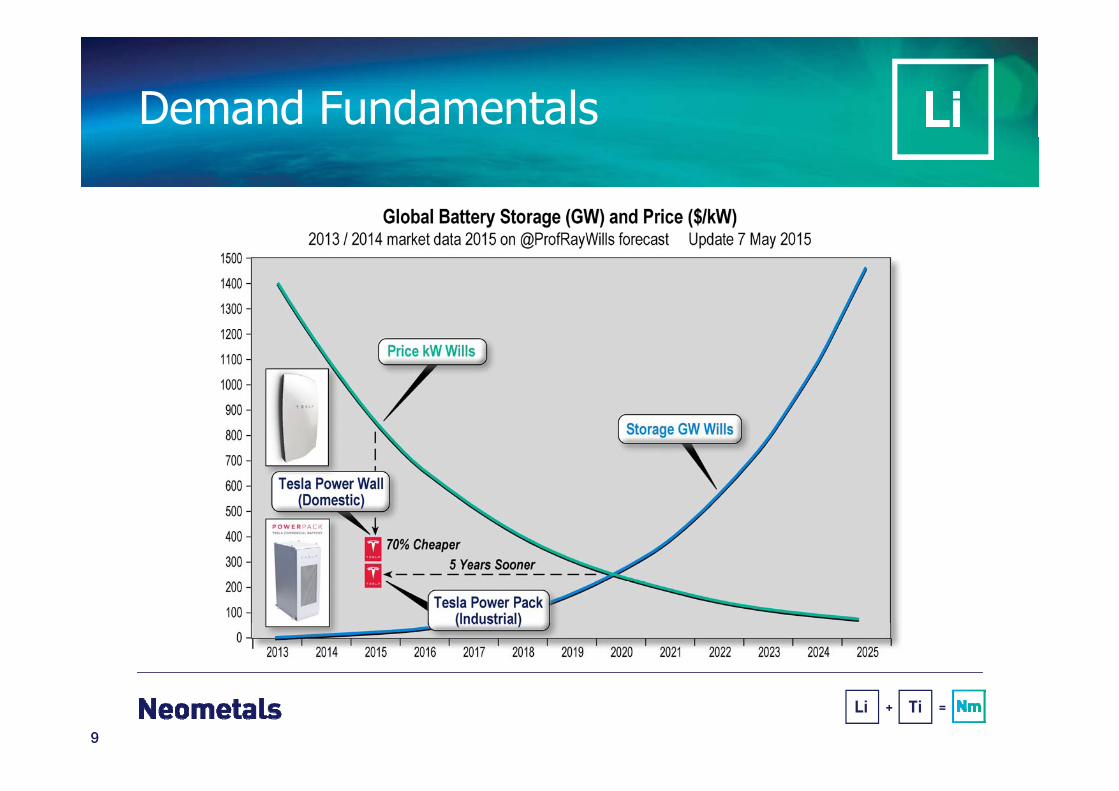
Demand Fundamentals
9
+ =
9
Demand Fundamentals

10
+ =
10
Supply Fundamentals
Brine based exports Q2 2015 SQM 29% ALB 29% FMC 35%
SignumBOX (Exports)

Strong demand – constrained supply

12
+ =
12
Supply Fundamentals

13
+ =
Mt Marion Lithium Project45% Neometals Ltd25% Ganfeng Lithium30% and Operator
Mineral Resources Ltd (ASX:MIN)
14
+ =
14
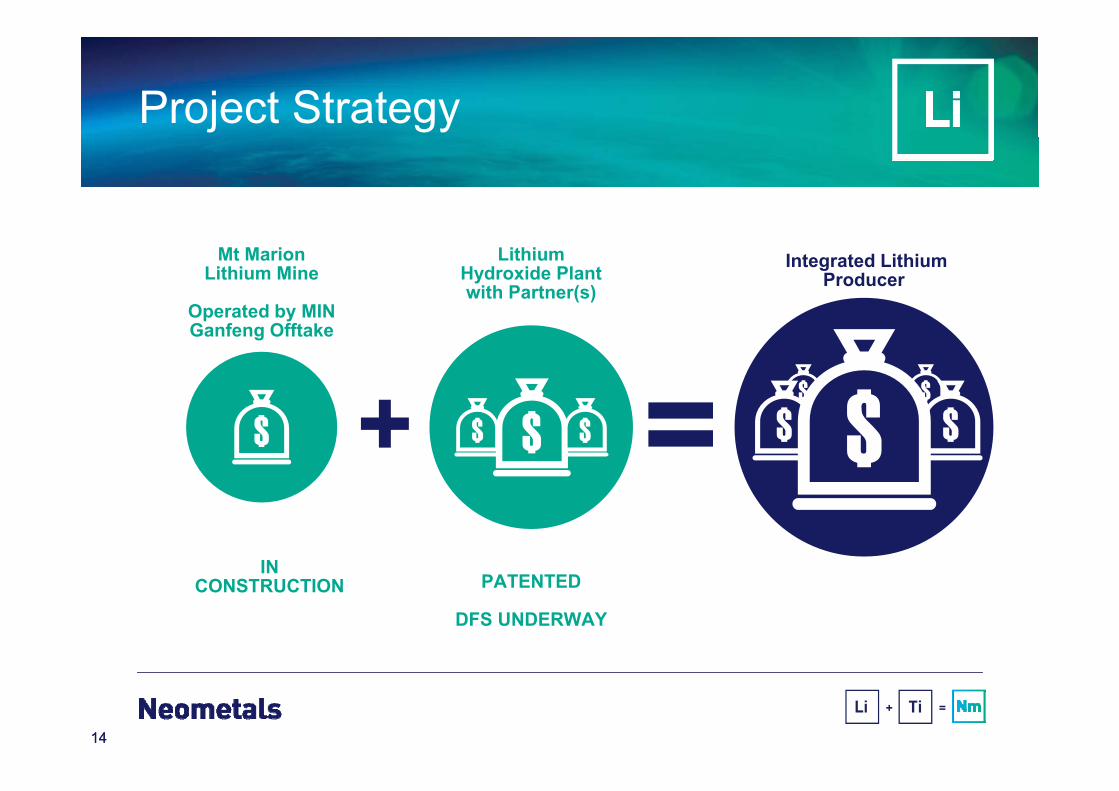
Project Strategy
Mt Marion Lithium Mine
Operated by MINGanfeng Offtake
Lithium Hydroxide Plantwith Partner(s)
Integrated LithiumProducer
=IN
CONSTRUCTION PATENTED
DFS UNDERWAY
+
15
+ =
15
Strong Operating Partner
Australia’s largest contract minerals processor Operate mine-to-port on BOO basis No upfront capital cost to NMT Certainty of construction and production timing Minimum production levels Fixed rate mining and processing costs

16
+ =
16
Strong Offtake Partner
China’s 2nd largest, most profitable lithium producer Life-of-Mine, Take-or-pay Offtake Agreement At Market Price with floor price protection US$20M Letter of Credit (100% payment on shipping) Ability for MIN/Neometals to take equity share of
production after 3 years.

17
+ =
17
Potential Option Exercise Outcomes
NMT 45% if no exercise
MIN & GFL exercise
GFL 18.1%
MIN 13.1%
GFL exercise only
GFL 24%No MIN
Selldown
GFL 24%Prorata MIN
selldown
Neometals
13.8% equity+US$46.8M
21% equity+US$36M
30.6% equity +US$21.6M

18
+ =
18
Flythrough

19
+ =
19
Site layout

20
+ =
20
Lithium Concentrate Prices

21
+ =
21
Near-term milestones
First Shipment
Q4 CY16
CommenceProcessing
July 2016
CommenceMining
Q1 CY16
CommenceConstruction
Nov 2015
NewReserve
Q2 CY16
New Resource
Q2 CY16
Drill Results
Q1 CY16
CommenceDrilling
Nov 2015

Downstream processingLithium Hydroxide (LiOH)
70% Neometals Ltd30% Mineral Resources Ltd

23
+ =
23
Downstream Strategy Animation

24
+ =
24
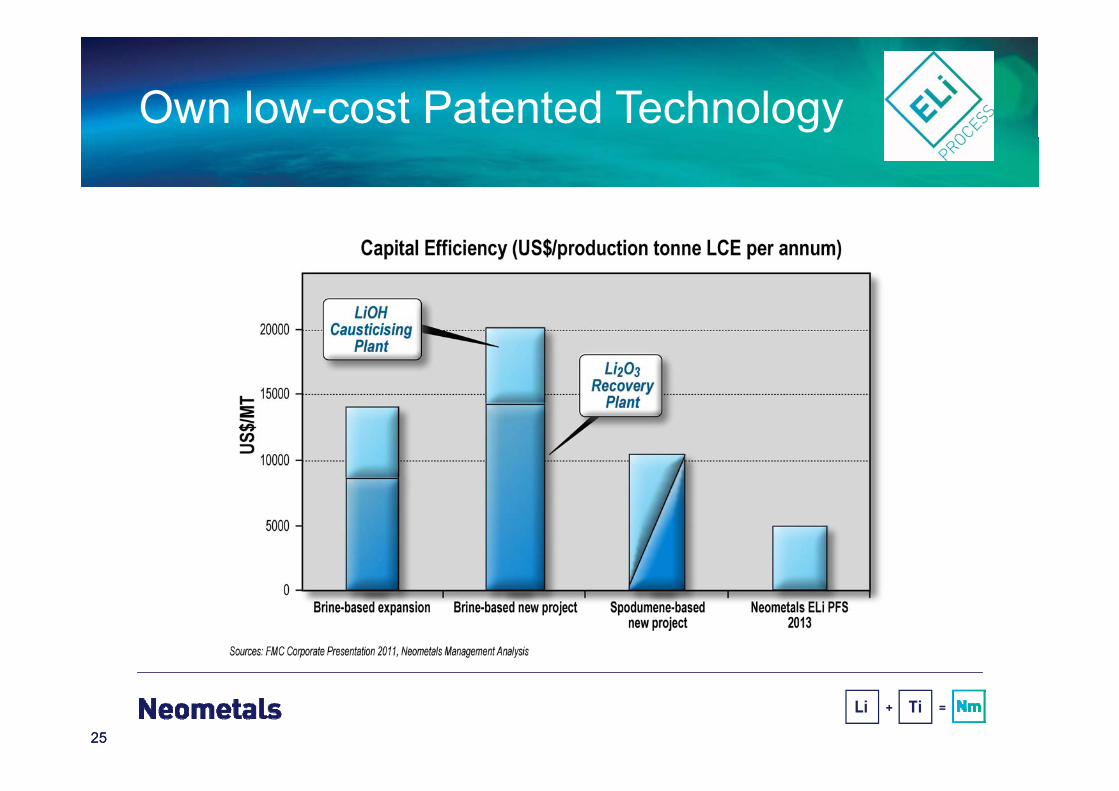
Own low-cost Patented Technology
25
+ =
25
Own low-cost Patented Technology

26
+ =
26
Pre-feasibility Study - Financial Metrics (*)
Life of Plant (LOP) 20 yearsPre-production Capital cost * US$ 83 million
Average Annual Pre-tax Net Cashflow US$ 63 million
Pre-tax Internal Rate of Return 94%
Pre-tax NPV (12% real discount rate) US$ 321 million
Payback of capital costs 2 years
Average Annual Production 10,000t LiOH8,810t Li2CO3
Average Cost per tonne of LiOH US$ 3,878/t
Average Cost per tonne of Li2CO3 US$ 4,538/t
[1
(*) Capital costs valid at September 2012. Estimated to accuracy of ±35% Assumptions: Spodumene feedstock US$350/t CIF (6% Li2O); LiOH/Li2CO3 selling price US$6,900/t CIF, MYR = US$0.32

27
+ =
27
Commercialisation Plan
FEED (FEL4)& FinalInvestmentDecision*
2017
Pilot PlantHydromet &Electrolysis*
2016/17
CompleteDefinitiveFeasibilityStudy
JuneQ 16
(*) Subject to RAM Board Approval

28
+ =
Barrambie Titanium Project100% Neometals

29
+ =
29
Titanium Fundamentals
Sources: Company Reports

30
+ =
30
High Quality Resource
21
347Mt @ 22% TiO2Barrambie*
+150Mt @34% TiO2
Lac Tio18%Tellnes
Sources: Company Reports
* Mineral Resource Estimate (JORC2012) on page 29

31
+ =
31
Project Strategy
Mine, Concentrate and TruckTitanium
Concentrate
Produce Titanium Pigment with
Industry Partner
Integrated Titanium Producer
+ =

32
+ =
32 Sources: SQM (Brine Flowsheet) and Neometals internal analysis including 2012 Pre-feasibility Study. All prices are FOB Basis.
Licenced low-cost Technology
Competitors
Input PriceUS$1,000/t
X1.2t
CostUS$2,100 -
2,300/t
CostUS$1,214/tUS$572/t
Rutile Chlorination& Purification
FinalProductFinePigment
ROMOre
Chlorination& Purification
FinalProductFinePigment
Mini-pilot scale testing in Canada – 2014/15 High purity +99% TiO2 PFS Completed by Sedgman – August 2015

33
+ =
33
Licenced low-cost Technology

34
+ =
34
Pre-feasibility Study - Financial Metrics (*)
Life of Mine (LOM) 19.6 yearsPre-production Capital cost (excluding EPCM and Contingency)
A$ 549 million
Average Annual Pre-tax Net Cashflow A$ 123 millionPre-tax Internal Rate of Return 21% Pre-tax NPV (12% real discount rate) A$ 355 millionPayback of capital costs 3.9 years
Average Annual Production 98,000t TiO22,000t V2O5
234,000t Fe2O3
Cash Operating Cost per tonne of paid TiO2 net of co-product credit US$ 572/t
[1
(*) Estimated to accuracy of ±25% Assumptions: US$1,838/t TiO2; US$14,873/t V2O5, US$520/t Fe2O3 Pigment, A$/US$0.75, Royalties (State/Technology) 10% Gross

35
+ =
35
Commercialisation Plan
FinalInvestment Decision *
DefinitiveFeasibilityStudy *
2017
Pilot ScaleBeneficiation& HydrometTest work *
2016
CompletedPre-feasibilityStudy
Aug 2015
Attract JV Partner
(*) Subject to Board Approval

36
+ =
Investment Proposition
36

37
+ =
37
Lithium : Cash and cashflow
0102
03
US$19.5M plus Production commencing mid-2016
Potential for US$46.8M from option exercise plus 13.8% share of production cashflows
Potential to expand production and/or value-add through conversion to LiOH
+ +

38
+ =
38
Titanium : A growth story for 2016
01 0203
Demonstrated Technical Feasibility
Demonstrated Economic Viability
Obtain Strong Partnersto Commercialise
+ +

39
+ =
Thank youwww.neometals.com.au

40
+ =
40
Mineral Resource Estimatefor the Mt Marion Lithium deposit, as at September 2015, for a block cut‐off grade of 0% Li2O
NOTE: Figures may not sum due to rounding. Significant figures do not imply an added level of precision.
Classification Deposit Tonnes (Mt) Li2O % Fe2O3 %Indicated Area 1 4.43 1.46 1.32
Area 2 1.30 1.47 1.60
Area 2W 3.39 1.48 1.24
Area 4 0.94 1.25 1.36
Indicated Total 10.05 1.45 1.33
Inferred Area 1 2.16 1.34 1.59
Area 2 1.01 1.44 1.72
Area 2W 4.52 1.40 1.13
Area 4 1.33 1.34 1.33
Area 5 0.96 1.33 2.44
Area 6 3.21 1.24 1.69
Inferred Total 13.19 1.34 1.50
Grand Total 23.24 1.39 1.43

41
+ =
41
Mineral Resource Estimatefor the Barrambie Ti‐V deposit, as at September 2015, for a block cut‐off grade of 15% TiO2
NOTE: Figures may not sum due to rounding. Significant figures do not imply an added level of precision.
Classification Zone Oxidation MTonnes Density(t/m3)
TiO2(%)
V2O5(%)
Fe2O3(%)
Al2O3(%)
SiO2(%)
Indicated
Eastern Oxide 18.7 2.82 23.29 0.59 42.93 10.70 16.36
Transition 8.7 3.52 23.11 0.61 50.80 7.34 12.99
Fresh 2.4 3.85 21.77 0.56 52.90 5.99 12.84
Sub-total 29.8 3.10 23.11 0.60 46.02 9.35 15.10
Central Oxide 3.5 2.95 16.84 0.92 49.82 11.06 14.91
Transition 1.3 3.50 17.39 0.89 54.76 8.49 12.15
Fresh 0.1 4.04 15.59 0.88 59.93 7.22 10.96
Sub-total 4.9 3.12 16.95 0.91 51.40 10.28 14.08
Total 34.7 3.11 22.25 0.64 46.77 9.48 14.95
Inferred
Eastern Oxide 2.6 2.71 20.88 0.48 40.00 12.20 19.42
Transition 3.3 3.29 23.04 0.59 47.51 8.62 14.45
Fresh 5.5 3.71 22.82 0.57 47.50 8.39 14.57
Sub-total 11.4 3.36 22.44 0.55 45.78 9.33 15.65
Central Oxide 0.1 3.07 16.64 0.98 53.63 9.96 13.33
Transition 0.4 3.47 18.36 0.86 54.15 8.79 12.43
Fresh 0.7 3.86 17.30 0.91 53.48 9.44 13.17
Sub-total 1.2 3.64 17.55 0.90 53.71 9.30 12.96
Total 12.5 3.38 21.99 0.58 46.51 9.32 15.40
Grand Total 47.2 3.18 22.18 0.63 46.70 9.44 15.07