Embed Size (px)
Citation preview

The 2020 TIAA Institute-GFLEC Personal Finance IndexMany Do Not Know What They Do and Do Not Know
Paul J. Yakoboski, TIAA Institute
Annamaria Lusardi, The George Washington University School of Business and Global Financial Literacy Excellence Center (GFLEC)
Andrea Hasler, The George Washington University School of Business and Global Financial Literacy Excellence Center (GFLEC)

2 April 2020 | The 2020 TIAA Institute-GFLEC Personal Finance Index
Executive SummaryThe 2020 TIAA Institute-GFLEC Personal Finance Index (P-Fin Index) is part of a long-term project that annually assesses financial literacy among U.S. adults. The P-Fin Index is unique in its capacity to produce a robust measure of overall personal finance knowledge plus a nuanced analysis of financial literacy across eight functional areas in which individuals routinely operate. Several items are new in the 2020 P-Fin Index:
W Respondents were asked the functional areas where they consider their financial literacy to be strongest and weakest.
W Respondents were asked how much time they spend thinking about and dealing with issues and problems related to their personal finances, including time spent doing so on the job.
W A sufficient number of Gen Z and Gen Y respondents were quota-sampled in order to examine financial literacy across generations in addition to age groups.
In addition, new indicators of financial wellness were included to examine their relationship with financial literacy. Key findings for 2020 include:
W While many Americans lack personal finance knowledge that enables sound financial decision making— U.S. adults correctly answered only 52% of the P-Fin Index questions, on average—the percentage of index questions answered correctly has increased 1 percentage point each year since the inaugural survey. The resulting 3-percentage point increase between 2017 and 2020 is statistically significant. This finding hints at a slow increase in financial literacy levels over time.
W As in previous years, comprehending risk is where functional knowledge is lowest. Similarly, financial literacy continues to be highest in the area of borrowing and debt management. From 2017 to 2020, seven of eight functional areas have seen increases, some marginal and others more noteworthy, in the percentage of questions answered correctly; correct answers increased 7 percentage points for earning, 6 percentage points for savings and 3 percentage points for go-to information sources.
W Many individuals do not know what they do know. While borrowing is the functional area of greatest financial knowledge among U.S. adults, only a small proportion rate themselves most knowledgeable on this topic; consuming and earning are where most adults rate their knowledge as being highest. At the same time, many individuals do not know what they do not know. While comprehending risk is the area of lowest financial knowledge among U.S. adults, investing is where most people think they know the least, indicating yet again a mismatch in what people think they know and what they actually know.
W A primary motivation for employer-sponsored financial wellness programs is to decrease employee stress and also work time lost to employees dealing with personal finance issues. The P-Fin Index shows a strong link between financial literacy and time spent on money management problems. Workers with low financial literacy spend six hours of work time per week, on average, dealing with financial issues compared with one hour per week among workers with high financial literacy. Among all adults, those with low financial literacy spend an average of 12 hours per week dealing with personal finance issues; those with high financial literacy spend 3 hours per week.
W Financial literacy is notably lower among Gen Z compared with Gen X, Gen Y and baby boomers; Gen Z correctly answered 41% of the index questions on average. Financial literacy in each functional area is lowest among Gen Z, with the gap being statistically significant for six of the eight functional areas. The Gen Z gap is greatest in the area of insuring.
W Comprehending risk is a particular weakness common among the four generations. In addition, differences in risk literacy across generations are much smaller compared with other functional areas.

Many Do Not Know What They Do and Do Not Know | April 2020 1
Introduction
Financial literacy is knowledge and understanding that enable sound financial decision making and effective management of personal finances. Thus, an individual’s financial wellness depends, at least in part, on his or her financial literacy.
What is the state of financial literacy among U.S. adults? Are there areas where knowledge is particularly strong, as well as areas where it is particularly weak? How does financial literacy vary across different segments of the population? In addition, importantly, how does financial literacy correlate with personal finance behavior and outcomes, and ultimately with financial well-being?
The TIAA Institute-GFLEC Personal Finance Index (P-Fin Index), a long-term project begun in 2017 to annually assess financial literacy among the U.S. adult population, answers these questions and more.1 It relates to common financial situations that individuals encounter and can be viewed as a gauge of “working knowledge.” The index is unique in its capacity to produce a robust measure of overall personal finance knowledge and a nuanced analysis of knowledge across eight areas of personal finance in which individuals inherently function. The index is based on responses to 28 questions,2 with three or four questions for each functional area3:
1. Earning—determinants of wages and take-home pay.
2. Consuming—budgets and managing spending.
3. Saving—factors that maximize accumulations.
4. Investing—investment types, risk and return.
5. Borrowing/managing debt—relationship between loan features and repayments.
6. Insuring—types of coverage and how insurance works.
7. Comprehending risk—understanding uncertain financial outcomes.
8. Go-to information sources—recognizing appropriate sources and advice.
Any opinions expressed herein are those of the authors, and do not necessarily represent the views of TIAA, the TIAA Institute or any other organization with which the authors are affiliated.
1 See Lusardi, Oggero and Yakoboski (2017) and Yakoboski, Lusardi and Hasler (2018, 2019).
2 Each question is multiple choice with four response options: the correct answer, two incorrect answers and a “don’t know” option.
3 These areas correspond to the National Standards for Financial Literacy outlined by the Council for Economic Education. See http://councilforeconed.org/resource/national-standards-for-financial-literacy/.

2 April 2020 | The 2020 TIAA Institute-GFLEC Personal Finance Index
The P-Fin Index survey also collects information about household finances and financial behaviors. This enables us to examine the relationship of financial literacy with measures of financial wellness.
The 2020 survey was completed online in January by a sample of 1,008 U.S. adults, ages 18 and older.4 The sample was weighted to be nationally representative. Table A1 in Appendix A provides the weighted distribution of respondents across various demographics.
Several items are new with the 2020 P-Fin Index:
W Respondents were asked the functional areas where they consider their financial literacy to be strongest and weakest.
W Respondents were asked how much time they spend thinking about and dealing with issues and problems related to their personal finances, including time spent doing so while at work.
W Gen Z was quota-sampled, enabling cross-generational examination of financial literacy among baby boomers, Gen X, Gen Y (millennials) and Gen Z.5
W Several new indicators of financial wellness were included.
This report:
W Examines financial literacy and functional knowledge among the U.S. adult population and across various demographic subgroups, including generations.
W Compares financial literacy across four years, since the start of the data collection.
W Analyzes the link between financial literacy and various indicators of financial wellness, including time spent dealing with personal finance issues and problems.
In addition, this year’s survey oversampled women, enabling analysis of the female population in a follow-up report.
4 The sample was drawn from Ipsos’ KnowledgePanel, a large-scale probability-based online panel.
5 Quota sampling targeted 200 completed surveys from both Gen Z and Gen Y respondents. The 1,008 respondents consisted of 196 Gen Z (born 1997-2002), 204 Gen Y (1981-1996), 210 Gen X (1965-1980), 326 baby boomers (1946-1964) and 72 members of the Silent Generation (1929-1945). Due to small sample size, the Silent Generation is not included in the generational analysis; its members are included in all other tabulations in this report.
Many Do Not Know What They Do and Do Not Know | April 2020 3
Overall financial literacy
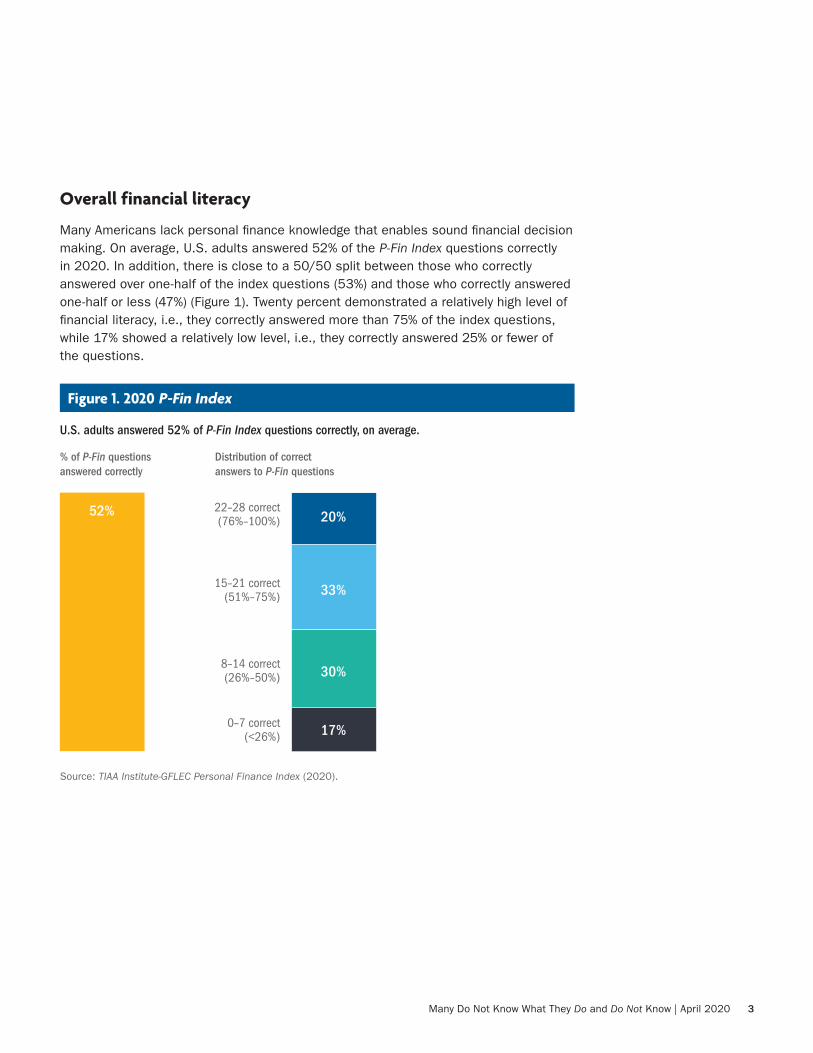
Many Americans lack personal finance knowledge that enables sound financial decision making. On average, U.S. adults answered 52% of the P-Fin Index questions correctly in 2020. In addition, there is close to a 50/50 split between those who correctly answered over one-half of the index questions (53%) and those who correctly answered one-half or less (47%) (Figure 1). Twenty percent demonstrated a relatively high level of financial literacy, i.e., they correctly answered more than 75% of the index questions, while 17% showed a relatively low level, i.e., they correctly answered 25% or fewer of the questions.
Figure 1. 2020 P-Fin Index
% of P-Fin questions answered correctly
Distribution of correct answers to P-Fin questions
U.S. adults answered 52% of P-Fin Index questions correctly, on average.
Source: TIAA Institute-GFLEC Personal Finance Index (2020).
52% 20%
17%
30%
33%
0–7 correct(<26%)
8–14 correct(26%–50%)
15–21 correct(51%–75%)
22–28 correct(76%–100%)

4 April 2020 | The 2020 TIAA Institute-GFLEC Personal Finance Index
The percentage of P-Fin Index questions answered correctly has increased 1 percentage point each year since the initial survey in 2017, rising from 49% to 52% (Figure 2).6 At the same time, the percentage of adults correctly answering more than one-half of the index questions increased from 48% in 2017 to 53% in 2020 and the percentage correctly answering more than 75% of the index questions rose from 16% to 20% (Figure 3). These changes from 2017 to 2020 are statistically significant, hinting at a slow increase in financial literacy levels.7
Figure 2. 2017-2020 P-Fin Indices
% of P-Fin questions answered correctly
Is financial literacy improving?
Source: TIAA Institute-GFLEC Personal Finance Index (2017-2020).
6 Data for the 2017 index were collected in September 2016. Data collection for the 2018-2020 indices occurred with survey fielding in January of the respective year; future waves will follow this timing.
7 Other surveys, such as the National Financial Capability Study, indicate that financial literacy has decreased over time. Note, however, that the P-Fin Index uses a different and much larger set of questions and concepts to measure financial literacy.
2020201920182017
50% 52%51%49%

Many Do Not Know What They Do and Do Not Know | April 2020 5
Functional knowledgeTurning to the eight functional areas that comprise the P-Fin Index, comprehending risk is where financial literacy tends to be lowest among U.S. adults. Comprehending risk involves, for example, understanding that the expected outcome in a given scenario depends on the range of possible outcomes, the financial implication associated with each outcome and the likelihood of each outcome occurring. On average, 37% of these questions were answered correctly (Figure 4).8
Figure 3. 2017-2020 P-Fin Indices
Distribution of correct answers to P-Fin questions
Is financial literacy improving?
Source: TIAA Institute-GFLEC Personal Finance Index (2017- 2020).
8 This finding is consistent with other research identifying risk-related concepts as the most difficult for individuals to grasp. See Coppola, et al. (2017) and Lusardi (2015).
0–7 correct(<26%)
2017 2018 2019 2020
8–14 correct(26%–50%)
15–21 correct(51%–75%)
22–28 correct(76%–100%)
16%
32% 35% 35% 33%
30%27%28%32%
20% 21% 20% 17%
16% 18% 20%

6 April 2020 | The 2020 TIAA Institute-GFLEC Personal Finance Index
Understanding risk and its implications is integral to sound financial decision making since the outcomes associated with a given decision are often unknown when it is made. Risk and uncertainty are inherent across the realms of personal finances, not just investments. Individuals must be comfortable functioning in an environment of uncertainty. Responses to the following question demonstrate the difficulty many individuals have with comprehending risk.
Investment A will deliver a return of either 10% or 6%, with each outcome equally likely. Investment B will deliver a return of either 12% or 4%, with each outcome equally likely. You can expect to earn more by investing in which?
W Investment A (chosen by 21% of respondents)
W Investment B (chosen by 11% of respondents)
W It does not matter – expected return is the same with each (correct answer; chosen by 31% of respondents)
W Don’t know (chosen by 35% of respondents)
W No response (1% of respondents)
Figure 4. Functional knowledge
Borrowing is where financial literacy is highest; comprehending risk is where it is lowest.
Source: TIAA Institute-GFLEC Personal Finance Index (2020).
% of P-Fin questions answered correctly
Earning
Consuming
Investing
Go-to infosources
Comprehendingrisk
Insuring
Borrowing
Saving
48%
50%
47%
37%
56%
56%
64%
59%
Many Do Not Know What They Do and Do Not Know | April 2020 7
Insuring, investing and go-to information sources are other functional areas where financial literacy is below average, i.e., below the 52% average of correctly answered questions in the entire P-Fin Index survey.
Financial literacy is highest in the area of borrowing and debt management. On average, 64% of the borrowing questions were answered correctly (Figure 4). Debt tends to be a feature of personal finance common across the lifecycle for many individuals; knowledge and understanding may emerge from confronting accumulated debt, often from the early stages of adulthood.
Saving, earning and consuming are other areas where personal finance knowledge is above average, i.e., above the 52% average of correctly answered questions in the entire survey.
Changes over timeRelative rankings of functional knowledge based on the percentage of correctly answered questions remains almost unchanged between the 2017 and 2020 P-Fin Indices (Figure 5). Borrowing is where knowledge is highest in each year of the index. Seven functional areas have seen an increased percentage of correctly answered questions, some marginal and others more noteworthy—correct answers increased 7 percentage points for earning and 6 percentage points for savings. The 3-percentage point increase for go-to information sources is also statistically significant.9 The one area with a decrease (2 percentage points) in the percentage of correctly answered questions is where financial literacy has been lowest in all four years—comprehending risk. This decrease was not statistically significant.
9 Increases in the percentage of correctly answered questions for other functional areas were not statistically significant at the 5% level. The increase for insuring was statistically significant at the 10% level, however.

8 April 2020 | The 2020 TIAA Institute-GFLEC Personal Finance Index
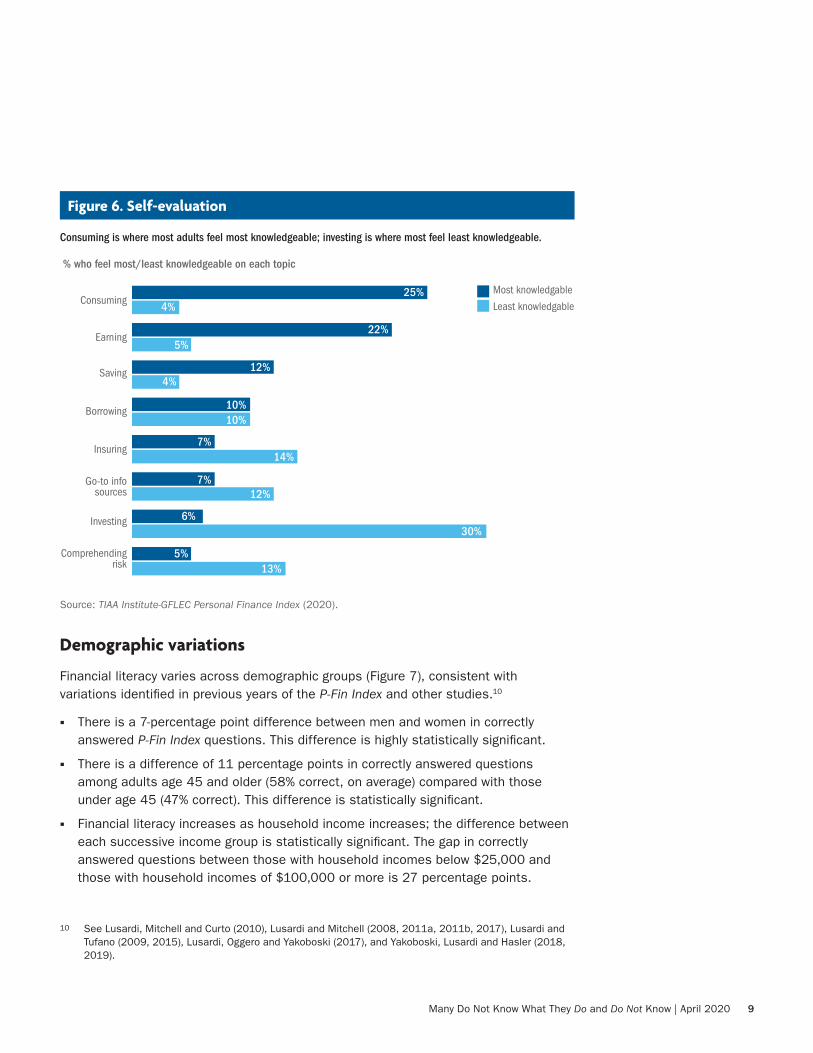
Self-perceptionsMany individuals do not know what they do know in terms of financial literacy. Consuming and earning are the areas where the largest share of adults rate their financial knowledge as being highest (25% and 22%, respectively) (Figure 6). While these are areas of relative strength in terms of financial literacy (Figure 4), clearly many individuals do not recognize the level of knowledge they possess regarding borrowing. While borrowing is the area of greatest functional knowledge among U.S. adults, only 10% rate themselves most knowledgeable in this area, the same percentage that rate themselves least knowledgeable. Perhaps challenges individuals face in managing debt are viewed as signaling a lack of knowledge.
At the same time, many do not know what they do not know! Investing is by far the area where the largest share (30%) think they know the least; however, about one-half of the P-Fin Index questions on investment were answered correctly. On the other hand, only 13% think comprehending risk is the area where they know the least, when it is actually the area where people show the lowest functional knowledge. It appears that individuals tend to not recognize their more prevalent weakness.
Figure 5. P-Fin Index: 2020 vs. 2017
Some increase in almost all functional knowledge areas.
Source: TIAA Institute-GFLEC Personal Finance Index (2017, 2020).
% of P-Fin questions answered correctly
2020
2017
Earning
Consuming
Investing
Go-to infosources
Comprehendingrisk
Insuring
Borrowing
Saving
46%
47%50%
47%
48%
44%
37%39%
49%
53%56%
56%
53%
64%61%
59%
Many Do Not Know What They Do and Do Not Know | April 2020 9
Demographic variations
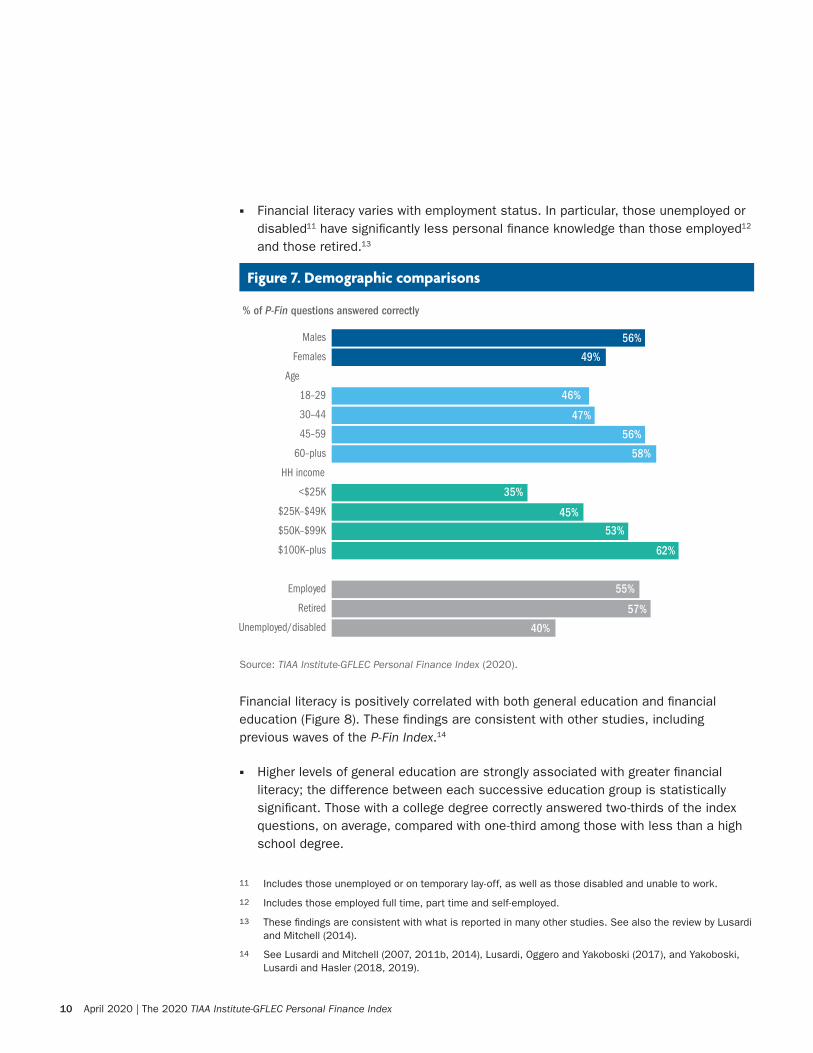
Financial literacy varies across demographic groups (Figure 7), consistent with variations identified in previous years of the P-Fin Index and other studies.10
W There is a 7-percentage point difference between men and women in correctly answered P-Fin Index questions. This difference is highly statistically significant.
W There is a difference of 11 percentage points in correctly answered questions among adults age 45 and older (58% correct, on average) compared with those under age 45 (47% correct). This difference is statistically significant.
W Financial literacy increases as household income increases; the difference between each successive income group is statistically significant. The gap in correctly answered questions between those with household incomes below $25,000 and those with household incomes of $100,000 or more is 27 percentage points.
Figure 6. Self-evaluation
Consuming is where most adults feel most knowledgeable; investing is where most feel least knowledgeable.
Source: TIAA Institute-GFLEC Personal Finance Index (2020).
% who feel most/least knowledgeable on each topic
10 See Lusardi, Mitchell and Curto (2010), Lusardi and Mitchell (2008, 2011a, 2011b, 2017), Lusardi and Tufano (2009, 2015), Lusardi, Oggero and Yakoboski (2017), and Yakoboski, Lusardi and Hasler (2018, 2019).
2020
2017Most knowledgable
Least knowledgable
Earning
Consuming
Investing
Go-to infosources
Comprehendingrisk
Insuring
Borrowing
Saving
6%
7%
14%
12%
30%
5%13%
4%
7%
10%10%
12%
5%
25%4%
22%
10 April 2020 | The 2020 TIAA Institute-GFLEC Personal Finance Index
W Financial literacy varies with employment status. In particular, those unemployed or disabled11 have significantly less personal finance knowledge than those employed12 and those retired.13
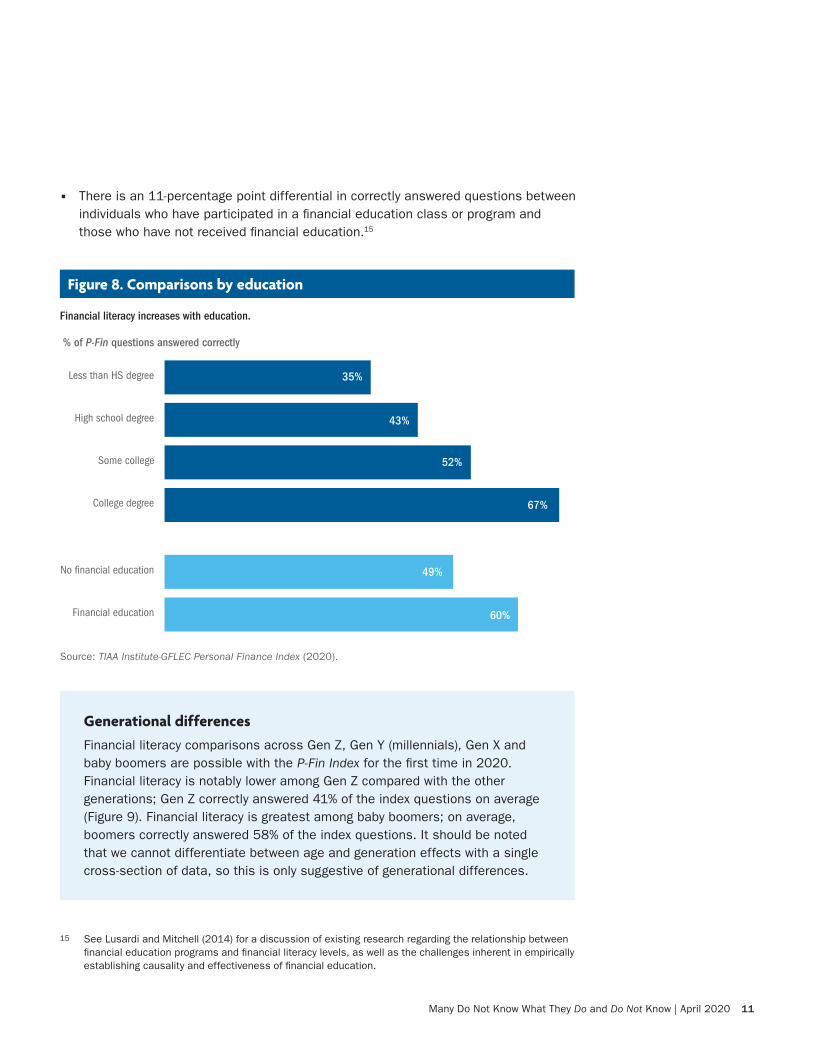
Financial literacy is positively correlated with both general education and financial education (Figure 8). These findings are consistent with other studies, including previous waves of the P-Fin Index.14
W Higher levels of general education are strongly associated with greater financial literacy; the difference between each successive education group is statistically significant. Those with a college degree correctly answered two-thirds of the index questions, on average, compared with one-third among those with less than a high school degree.
11 Includes those unemployed or on temporary lay-off, as well as those disabled and unable to work.
12 Includes those employed full time, part time and self-employed.
13 These findings are consistent with what is reported in many other studies. See also the review by Lusardi and Mitchell (2014).
Figure 7. Demographic comparisons
Source: TIAA Institute-GFLEC Personal Finance Index (2020).
% of P-Fin questions answered correctly
14 See Lusardi and Mitchell (2007, 2011b, 2014), Lusardi, Oggero and Yakoboski (2017), and Yakoboski, Lusardi and Hasler (2018, 2019).
Unemployed/disabled
Retired
Employed
$100K–plus
$50K–$99K
$25K–$49K
<$25K
HH income
60–plus
45–59
30–44
18–29
Age
Females
Males
62%
45%
53%
55%
57%
40%
56%
35%
58%
47%
46%
56%
49%
Many Do Not Know What They Do and Do Not Know | April 2020 11
W There is an 11-percentage point differential in correctly answered questions between individuals who have participated in a financial education class or program and those who have not received financial education.15
Figure 8. Comparisons by education
Financial literacy increases with education.
Source: TIAA Institute-GFLEC Personal Finance Index (2020).
% of P-Fin questions answered correctly
Generational differencesFinancial literacy comparisons across Gen Z, Gen Y (millennials), Gen X and baby boomers are possible with the P-Fin Index for the first time in 2020. Financial literacy is notably lower among Gen Z compared with the other generations; Gen Z correctly answered 41% of the index questions on average (Figure 9). Financial literacy is greatest among baby boomers; on average, boomers correctly answered 58% of the index questions. It should be noted that we cannot differentiate between age and generation effects with a single cross-section of data, so this is only suggestive of generational differences.
15 See Lusardi and Mitchell (2014) for a discussion of existing research regarding the relationship between financial education programs and financial literacy levels, as well as the challenges inherent in empirically establishing causality and effectiveness of financial education.
Financial education
College degree
Some college
High school degree
Less than HS degree
67%
49%
60%
43%
52%
35%

12 April 2020 | The 2020 TIAA Institute-GFLEC Personal Finance Index
Several findings stand out when functional knowledge is examined across generations (Table 1).
W Borrowing is consistently the area of greatest financial literacy across the four generations. Among Gen Z, knowledge of saving and consuming almost equal that of borrowing.
W Comprehending risk is a particular weakness common among generations. In addition, differences in risk literacy across generations are much smaller compared with other functional areas. This could indicate that risk remains difficult to grasp even as individuals are exposed to more and different financial decisions. Insuring is an area of weakness equivalent to comprehending risk among both Gen Z and Gen Y.
W Financial literacy in each functional area is lowest among Gen Z. The gap between Gen Z and the generation with the next lowest financial literacy level in each area ranges from 4 percentage points (consuming) to 12 percentage points (insuring). This gap is statistically significant in each functional area except consuming and comprehending risk.16
16 The 5-percentage point difference for comprehending risk between Gen Z and Gen X is significant at the 10% level.
Figure 9. Generational comparisons
Financial literacy is highest among boomers; lowest among Gen Z.
% of P-Fin questions answered correctly
Source: TIAA Institute-GFLEC Personal Finance Index (2020).
Boomers
Gen X
Gen Y
Gen Z
50%
51%
58%
41%

Many Do Not Know What They Do and Do Not Know | April 2020 13
W Financial literacy in each functional area is greatest among boomers, except for comprehending risk, where knowledge is essentially equal among Gen Y, Gen X and boomers. The boomer gap is particularly noteworthy with regards to insuring, where the difference in the percentage of correctly answered questions is 16 percentage points compared to the next closest generation (Gen X).
W Any differences in functional knowledge between Gen Y and Gen X are small.
Surprisingly, there is little generational difference in where individuals perceive their financial literacy to be greatest. Earning and consuming are topics most often cited across the generations. The one difference is that saving was also cited frequently among Gen Z, but not among the other generations. People may assume they are most knowledgeable in the topics they deal with regularly.
Investing is most often cited as the area where respondents among each generation feel the least knowledgeable. In addition, Gen Z is the only generation where more than 20% cited insuring as their topic of lowest knowledge. The share citing comprehending risk as the area with lowest perceived understanding varied little across generations, ranging from 8% of Gen Z to 16% of Gen X. Again, these are a confluence of generational and age effects, and reiterate that many do not know what they do or do not know.
Table 1. Generational comparisons
Gen Z financial literacy lags in each functional area.
% of P-Fin questions answered correctly
Gen Z Gen Y Gen X Boomers
Borrowing 51% 62% 62% 71%
Saving 49% 57% 58% 64%
Earning 44% 54% 57% 60%
Consuming 49% 53% 57% 60%
Go-to info sources 40% 49% 48% 55%
Investing 35% 44% 46% 54%
Insuring 28% 40% 43% 59%
Comprehending risk 32% 39% 37% 39%
Source: TIAA Institute-GFLEC Personal Finance Index (2020).

14 April 2020 | The 2020 TIAA Institute-GFLEC Personal Finance Index
2017-2020 changesFigure 10 shows the percentage point change between 2017 and 2020 in P-Fin Index questions answered correctly across demographic groups. It is important to note that sample sizes decrease as the sample of all adults is divided into subgroups, resulting in increased variance in the estimates. Keeping that in mind, financial literacy levels have increased significantly among men, those age 18-29, and among those employed.17
Figure 11 shows the percentage change between 2017 and 2020 in P-Fin Index questions answered correctly by general education level and receipt of financial education. Both those who have a college degree and those who have received financial education display a significant increase in financial literacy. This bodes well for new initiatives in school and the workplace.
17 Only these changes are statistically significant at the 5% level.
Figure 10. P-Fin Index: 2020 vs. 2017
Source: TIAA Institute-GFLEC Personal Finance Index (2017, 2020).
% point change in P-Fin questions answered correctly, 2017 to 2020
Unemployed/disabled
Retired
Employed
$100K–plus
$50K–$99K
$25K–$49K
<$25K
HH income
60–plus
45–59
30–44
18–29
Age
Females
Males
+2
+3
+4
+2
+1
+2
+1
0
+1
+5
+6
+5
+1

Many Do Not Know What They Do and Do Not Know | April 2020 15
Financial wellness and the P-Fin Index
Achieving financial security, or financial well-being, is a goal shared across individuals.18 An increased employer focus on employee financial well-being has manifested itself in workplace financial wellness programs. These programs are more holistic than predecessor programs, which typically focused on a single aspect of personal finances, e.g., saving for retirement or investing in retirement accounts.
The P-Fin Index is well suited to examine the relationship between financial literacy and financial well-being. To that end, the survey contains questions indicative of financial wellness—either outcomes linked to financial well-being or behaviors that should
18 Financial wellness can be defined as a state of being wherein a person has control over day-to-day, month-to-month finances; has the capacity to absorb a financial shock; is on track to meet his or her financial goals; and has the financial freedom to make choices that allow enjoying life. See Consumer Financial Protection Bureau (2015).
Figure 11. P-Fin Index: 2020 vs. 2017
Source: TIAA Institute-GFLEC Personal Finance Index (2017, 2020).
% point change in P-Fin questions answered correctly, 2017 to 2020
Financial education
College degree
Some college
High school degree
Less than HS degree
+2
+2
+5
+1
+5
+5
16 April 2020 | The 2020 TIAA Institute-GFLEC Personal Finance Index
promote it. These questions cover money management with a particular focus on debt, the capacity to cope with financial shocks, and planning and saving for retirement.
W In a typical month, how easy or difficult is it for you to make ends meet?
W Do you make your loan payments in full and on time each month? This includes credit card balances, as well as a home mortgage, auto loans, personal loans, student loans, etc.
W Do you agree or disagree with the following statement? Debt and debt payments prevent me from adequately addressing other financial priorities.
W How confident are you that you could come up with $2,000 if an unexpected need arose within the next month?
W Do you save for retirement on a regular basis?
W Have you ever tried to figure out how much you need to save for retirement?
There is a strong link between financial literacy and these financial well-being indicators, demonstrating the importance of including financial literacy in financial wellness programs. As the percentage of P-Fin Index questions answered correctly increases, individuals are:
W More likely to find it easy to make ends meet in a typical month (Figure 12).
W More likely to make loan payments in full and on time each month (Figure 13).
W Less likely to be debt constrained (Figure 14).
W Less likely to be financially fragile (Figure 15).
W More likely to save and plan for retirement (Figure 16).

Many Do Not Know What They Do and Do Not Know | April 2020 17
Figure 12. Financial literacy financial wellness
Figure 13. Financial literacy financial wellness
Making ends meet is easier for those with greater financial literacy.
Those with greater financial literacy are more likely to make loan payments in full and on time each month.
Source: TIAA Institute-GFLEC Personal Finance Index (2020).
Source: TIAA Institute-GFLEC Personal Finance Index (2020).
% who find it easy to make ends meet In a typical month
% of individuals with a loan who always make their payments in full and on time each month (including credit card balances)
76%–100%51%–75%26%–50%<26%
14%
20%
39%40%
29%33%
34% 56%47%
59%
74%
85%
Very easy
Somewhateasy
% of P-Fin questions answered correctly
% of P-Fin questions answered correctly
76%–100%51%–75%26%–50%<26%
53%
63%
78%
38%

18 April 2020 | The 2020 TIAA Institute-GFLEC Personal Finance Index
Figure 14. Financial literacy financial wellness
Figure 15. Financial literacy financial wellness
Those with greater financial literacy are less likely to be debt constrained.
Those with greater financial literacy are less likely to be financially fragile.
Source: TIAA Institute-GFLEC Personal Finance Index (2020).
Source: TIAA Institute-GFLEC Personal Finance Index (2020).
% for whom debt and debt payments do not prevent adequately addressing other financial priorities
% who could certainly come up with $2,000 if an unexpected need arose within the next month
76%–100%51%–75%26%–50%<26%
41%
55%
68%
30%
% of P-Fin questions answered correctly
% of P-Fin questions answered correctly
76%–100%51%–75%26%–50%<26%
38%
55%
77%
21%

Many Do Not Know What They Do and Do Not Know | April 2020 19
Time spent thinking about and dealing with issues and problems related to personal finances is another useful indicator regarding an individual’s financial situation. Improving employee productivity by decreasing the amount of work time lost to personal finance issues is a primary motivation for employer-sponsored financial wellness programs. Here again, there is a strong link between financial literacy and this indicator (Figure 17). Adults with high levels of financial literacy (i.e., they correctly answer over 75% of the P-Fin Index questions) spend 3 hours per week, on average, thinking about and dealing with personal finance issues and problems.19 By comparison, those with low financial literacy (i.e., they correctly answer 25% or less of the index questions) spend a much greater amount of time doing so, an average of 12 hours per week. An even more pronounced dynamic exists in the workplace—workers with high financial literacy spend one hour of work time per week, on average, dealing with financial issues; workers with low financial literacy spend an average of six hours of work time per week on personal finance issues.20
Figure 16. Financial literacy financial wellness
Those with greater financial literacy are more likely to save and plan for retirement.
Source: TIAA Institute-GFLEC Personal Finance Index (2020).
% of non-retirees who save for retirement on a regular basis
% of non-retirees who have tried to determine how much they need to save for retirement
19 Respondents were asked: How much time do you typically spend thinking about and dealing with issues and problems related to your personal finances? Please report approximate hours per week.
20 Employed respondents were subsequently asked: How many of these hours occur at work? Please report approximate hours per week.
% of P-Fin questions answered correctly
76%–100%<26%
83%
33%
76%–100%<26%
20%
60%

20 April 2020 | The 2020 TIAA Institute-GFLEC Personal Finance Index
Financial literacy and advice Receiving professional financial advice should also improve an individual’s financial wellness. Access to financial advice may occur at work through a financial wellness program or a retirement savings plan or, alternatively, an individual may seek out an advisor outside the context of work.
We find that individuals with greater financial literacy are more likely to receive financial guidance from a professional advisor or advisory service (Figure 18).21 This positive correlation between financial literacy and the use of financial advice indicates a complementary relationship, as opposed to one serving as a substitute for the other.22 This makes sense in that financial decisions are ultimately up to the individual, and greater financial literacy positions an individual to be proactive in any advice session.
Figure 17. Financial literacy financial wellness
Those with greater financial literacy spend less time on financial issues and problems.
Source: TIAA Institute-GFLEC Personal Finance Index (2020).
Average hours per week spent thinking about and dealing with issues and problems related to personal finances
21 An analogous result was found in the 2019 P-Fin Index.
22 This is consistent with previous research that identified a complementary relationship. See Collins (2012).
% of P-Fin questions answered correctly
76%–100%51%–75%26%–50%<26%
9
43
12
6
4
2
4
1
All adults
Workers while on the job

Many Do Not Know What They Do and Do Not Know | April 2020 21
Figure 18. Financial literacy and advice
Those with greater financial literacy are more likely to seek financial advice.
Source: TIAA Institute-GFLEC Personal Finance Index (2020).
% who received financial guidance from a professional advisor or advisory service within the past two years
Discussion
The first four years of the P-Fin Index hint at a slow increase over time in financial literacy among U.S. adults. The percentage of index questions answered correctly has increased 1 percentage point each year from 2017 to 2020, rising from 49% to 52%. The percentage of adults correctly answering more than one-half of the index questions increased from 48% to 53% over this period, and the percentage correctly answering more than 75% rose from 16% to 20%. Each of these differences in financial literacy between 2017 and 2020 is statistically significant.
In addition, financial literacy in seven of the eight functional areas comprising the P-Fin Index increased from 2017 to 2020, with three of them showing statistically significant changes in the percentage of questions answered correctly: earning, saving and go-to information sources.
Nonetheless, many Americans lack personal finance knowledge that enables sound financial decision making and effective management of personal finances, as they could correctly answer only about one-half of the P-Fin Index questions, on average. In addition, many individuals do not know what they do know. Likewise, many do not know what they do not know.
76%–100%51%–75%26%–50%<26%
13%
22%
33%
12%
% of P-Fin questions answered correctly

22 April 2020 | The 2020 TIAA Institute-GFLEC Personal Finance Index
Comprehending risk is the area of lowest knowledge among U.S. adults, but they disproportionately pick investing as the area where they think they know the least. Analogously, while borrowing is the area of greatest financial literacy, many do not indicate borrowing but, rather, consuming and earning as the areas where their knowledge is highest.
Low financial literacy is associated with low financial wellness. The P-Fin Index survey contains several questions, some new, indicative of financial wellness. In each case, financial literacy is strongly associated with the financial wellness indicator.
Of particular note is first-time data regarding how much time U.S. adults spend thinking about and dealing with issues and problems related to their personal finances, including time spent doing so while on the job. Those with high levels of financial literacy spend three hours per week, on average, thinking about and dealing with personal finance issues. By comparison, those with low financial literacy spend an average of 12 hours per week on personal finance issues.
An even more pronounced dynamic exists in the workplace—workers with high financial literacy spend one hour of work time per week, on average, dealing with financial issues; workers with low financial literacy spend six hours of work time per week on personal finance issues. Improving employee productivity by decreasing the amount of work time lost to personal finance issues is a primary motivation for employer-sponsored financial wellness programs, and addressing low financial literacy should be a key element of such programs.
The importance of financial literacy for financial wellness highlights the importance of increased focus on efforts to improve financial knowledge and understanding among all Americans, not only in the workplace, but in school as well.

Many Do Not Know What They Do and Do Not Know | April 2020 23
Appendix A
Table A1. Distribution of respondent demographics in the 2020 P-Fin Index (weighted sample)Age
18 to 29 21%
30 to 44 25
45 to 59 25
60 and older 29
Generation
Gen Z 10%
Gen Y (millennials) 28
Gen X 25
Baby boomers 31
Silent Generation 6
Gender
Male 48%
Female 52
Ethnicity
White 63%
African-American 12
Hispanic 16
Other 9
Education
Less than HS degree 11%
High school degree 28
Some college 28
College degree 33
Household income
Less than $25,000 14%
$25,000 to $49,999 18
$50,000 to $99,999 31
$100,000 and more 37
Employment status
Employed 56%
Unemployed or disabled 18
Retired 26
Source: TIAA Institute-GFLEC Personal Finance Index (2020).

24 April 2020 | The 2020 TIAA Institute-GFLEC Personal Finance Index
References
Collins, J. Michael. 2012. “Financial Advice: A Substitute for Financial Literacy?” Financial Services Review 21(4): 307–322.
Consumer Financial Protection Bureau. 2015. Financial Well-being: The Goal of Financial Education.
Coppola, Michela, Greg Langley, Mylene Sabatini, and Richard Wolf. 2017. “When Will the Penny Drop? Money, Financial Literacy and Risk in the Digital Age.” Allianz International Pension Papers.
Lusardi, Annamaria. 2011. “Americans’ Financial Capability.” National Bureau of Economic Research Working Paper 17103.
Lusardi, Annamaria. 2015. “Risk Literacy.” Italian Economic Journal 1 (1): 5-23.
Lusardi, Annamaria, and Olivia S. Mitchell. 2007. “Baby Boomer Retirement Security: The Roles of Planning, Financial Literacy, and Housing Wealth.” Journal of Monetary Economics 54 (1): 205–24.
Lusardi, Annamaria, and Olivia S. Mitchell. 2008. “Planning and Financial Literacy: How Do Women Fare?” American Economic Review 98(2): 413–417.
Lusardi, Annamaria, and Olivia S. Mitchell. 2011a. “Financial Literacy and Planning: Implications for Retirement Well-Being.” In Financial Literacy: Implications for Retirement Security and the Financial Marketplace, edited by Olivia S. Mitchell and Annamaria Lusardi, 17–39. Oxford and New York: Oxford University Press.
Lusardi, Annamaria, and Olivia S. Mitchell. 2011b. “Financial Literacy around the World: An Overview.” Journal of Pension Economics and Finance 10 (4): 497–508.
Lusardi, Annamaria, and Olivia S. Mitchell. 2014. “The Economic Importance of Financial Literacy: Theory and Evidence,” Journal of Economic Literature 52 (1): 5-44.
Lusardi, Annamaria, and Olivia S. Mitchell. 2017. “How Ordinary Consumers Make Complex Economic Decisions: Financial Literacy and Retirement Readiness.” Quarterly Journal of Finance 7 (3): 1-31.
Lusardi, Annamaria, Olivia S. Mitchell, and Vilsa Curto. 2010. “Financial Literacy among the Young.” Journal of Consumer Affairs 44 (2): 358–80.
Lusardi, Annamaria, Noemi Oggero, and Paul Yakoboski. 2017. The TIAA Institute-GFLEC Personal Finance Index: A New Measure of Financial Literacy.
Lusardi, Annamaria, and Peter Tufano. 2009. “Teach Workers about the Perils of Debt.” Harvard Business Review November: 22–24.

Many Do Not Know What They Do and Do Not Know | April 2020 25
Lusardi, Annamaria, and Peter Tufano. 2015. “Debt Literacy, Financial Experiences, and Overindebtedness.” Journal of Pension Economics and Finance 14(4): 329–365.
Yakoboski, Paul, Annamaria Lusardi, and Andrea Hasler. 2019. Financial Literacy in the United States and Its Link to Financial Wellness: The 2020 TIAA Institute-GFLEC Personal Finance Index.
Yakoboski, Paul, Annamaria Lusardi, and Andrea Hasler. 2018. The 2018 TIAA Institute-GFLEC Personal Finance Index: The State of Financial Literacy Among U.S. Adults.

26 April 2020 | The 2020 TIAA Institute-GFLEC Personal Finance Index
About the authors
Paul Yakoboski is a senior economist with the TIAA Institute, where his research focus is lifetime financial security, including issues related to financial literacy and financial wellness, retirement saving and investing, and asset management during retirement. In addition, he researches workforce issues in the higher education and nonprofit sectors. He manages the Institute’s survey research program and is director of the Institute’s Fellows Program. Prior to joining the TIAA Institute, Yakoboski held positions with the American Council of Life Insurers, the Employee Benefit Research Institute and the U.S. Government Accountability Office. Yakoboski earned his Ph.D. and M.A. in economics from the University of Rochester and his B.S. in economics from Virginia Tech.
Annamaria Lusardi is Denit Trust Chair of Economics and Accountancy at the George Washington University School of Business, and the founder and academic director of GFLEC. She has published extensively and in many leading economics journals and is the recipient of several prestigious awards. Lusardi also directs the Financial Education Committee in Italy, in charge of implementing a national strategy for financial literacy. In addition, she chairs the OECD’s International Network for Financial Education Research Committee. She previously taught at Dartmouth College, Princeton University, the University of Chicago Harris School of Public Policy and Booth School of Business, and Columbia Business School. She also was a visiting scholar at Harvard Business School. She earned her B.A. from Bocconi University in Milan and Ph.D. from Princeton University. Lusardi is a TIAA Institute Fellow.
Andrea Hasler is an Assistant Research Professor in Financial Literacy at GFLEC. She leads the team of researchers working on financial literacy and capability, and develops analyses for educational and policy initiatives. Hasler has recently worked on projects focused on financial literacy levels of the young, women, entrepreneurs, investors and minorities in the United States and around the world. She holds a Ph.D. in finance as well as an M.Sc. and B.A. in business and economics from the University of Basel. During her doctorate, she spent two years at the New York University Stern School of Business conducting research on household saving and financial decision making. She also has been a lecturer at the University of Basel for six years. Her professional experience includes the development of an online advanced studies course in financial market theory and work as an analyst conducting global equity market research.
Paul Yakoboski
Annamaria Lusardi
Andrea Hasler

(4/20)
TIAA Institute is a division of Teachers Insurance and Annuity Association of America (TIAA), New York, NY.
©2020 Teachers Insurance and Annuity Association of America-College Retirement Equities Fund, 730 Third Avenue, New York, NY 10017