Embed Size (px)
Citation preview

fire
Article
The 2017 North Bay and Southern California FiresA Case Study
Nicholas J Nauslar 12 ID John T Abatzoglou 3 ID and Patrick T Marsh 2
1 Cooperative Institute for Mesoscale Meteorological Studies University of OklahomaNorman OK 73072 USA
2 NOAANWSNCEP Storm Prediction Center Norman OK 73072 USA patrickmarshnoaagov3 Department of Geography University of Idaho Moscow ID 83844 USA jabatzoglouuidahoedu Correspondence nicknauslarnoaagov
Received 15 April 2018 Accepted 5 June 2018 Published 9 June 2018
Abstract Two extreme wind-driven wildfire events impacted California in late 2017 leading to46 fatalities and thousands of structures lost This study characterizes the meteorological andclimatological factors that drove and enabled these wildfire events and quantifies their rarity overthe observational record Both events featured key fire-weather metrics that were unprecedentedin the observational record that followed a sequence of climatic conditions that enhanced fine fuelabundance and fuel availability The North Bay fires of October 2017 occurred coincident withstrong downslope winds with a majority of burned area occurring within the first 12 h of ignitionBy contrast the southern California fires of December 2017 occurred during the longest Santa Anawind event on record resulting in the largest wildfire in Californiarsquos modern history Both fire eventsoccurred following an exceptionally wet winter that was preceded by a severe four-year droughtFuels were further preconditioned by the warmest summer and autumn on record in northern andsouthern California respectively Finally delayed onset of autumn precipitation allowed for criticallylow dead fuel moistures leading up to the wind events Fire weather conditions were well forecastseveral days prior to the fire However the rarity of fire-weather conditions that occurred nearpopulated regions along with other societal factors such as limited evacuation protocols and limitedwildfire preparedness in communities outside of the traditional wildland urban interface were keycontributors to the widespread wildfire impacts
Keywords fire weather fire climate large wildfires downslope windstorm wildland urban interfacedrought foehn winds Santa Ana winds Diablo winds
1 Introduction
Californiarsquos fire history is littered with fast-moving destructive wildfires adjacent to populatedareas [12] Many wind-driven fires that occur in the coastal ranges of California burn across steepterrain with fuels shaped by a Mediterranean climate during periods of strong foehn winds in earlyautumn when fuels remain dry prior to the onset of cool-season precipitation [34] The coincidence ofland development in areas prone to wind driven extreme fire weather (ie Diablo winds [5] Santa Anawinds [6]) results in fire-related hazards for a large number of people [7] Approximately one-third ofCalifornians reside in the wildlandndashurban interface (WUI) with overall population living in the WUIexpected to increase in the coming decades [8ndash10]
Large wildfires are not new to Californiarsquos landscape [1112] but costs have escalated recently [13]due to the expanding WUI the legacy of fire exclusion associated with suppression activities and morefavorable climatic conditions for large fires Previous research has shown that fire exclusion increases fuelloading and the potential for larger fires in forests that have historically had smaller and more frequent
Fire 2018 1 18 doi103390fire1010018 wwwmdpicomjournalfire
Fire 2018 1 18 2 of 17
fire [2] However the impacts of fire exclusion in shrublands such as chaparral ecosystems in Californiaare more mixed and generally weaker [111] Much of the western US has seen a noted increase in fireactivity (eg burned area extent number of large fires) over the past several decades [14] in part dueto changes in climatic conditions that favor and facilitate fire in flammability-limited forests [15] Bycontrast trends in fire activity have been more subdued in Mediterranean California ecoregions andacross broader southern California [141617] The reasons behind these diverging trends may be tied to adecrease in reported fire ignitions [17] which are nearly all human-caused [18] as well as anthropogenicactivities including land-use fire policies and diligent fire suppression [19] Nonetheless interannualclimate variability does exhibit significant relationships to burned area extent in these regions [3172021]Mediterranean ecosystems are intermediate productivity biomes where fire is often not purely fuel-limitedor flammability-limited during the fire season [22] Additionally such ecosystems in California arelargely co-located with sizeable human populations and anthropogenic land use [19] yielding less directcorrelations to climate variability than in other areas with a low anthropogenic footprint where wildfire ismore directly limited by climate (eg fuel-limited or climate-limited) [23]
In 2017 US federal wildland fire suppression costs exceeded $29 billion US dollars making it thecostliest fire season on record [24] More than 4 million hectares (ha) burned in 2017 which is the secondmost area burned since 1984 and only 40000 ha below that in 2015 [24] For context we note that USburned area statistics include Alaska which often contributes substantially to annual total burned areaWhile over 2 million ha burned in Alaska in 2015 just over 260000 ha burned in Alaska in 2017 thushighlighting the elevated level of fire activity in the contiguous US The US wildfire season started across thesouthern Plains in early March but reached its peak in August and September The national preparednesslevel which is a categorical measure of national fire activity and the number of fire suppression resourcescommitted and available remained at its highest level for 39 consecutive days in 2017 (72 total days) whenlarge conflagrations were found from northern California into the Pacific Northwest and eastward intoMontana coincident with one of the warmest and driest summers in the observational record for much ofthe region [2526] The 2017 fire season culminated with the wind-driven North Bay fires in October andsouthern California fires in December (Figure 1) both extreme wildfire events [27] The North Bay fireswere reminiscent of the 1964 Hanley Fire in Napa and Sonoma counties and October 1991 Oakland Hillsfire due to the rapid spread of wind-driven fires in densely populated areas around the San Francisco BayArea The North Bay fires were the deadliest and most destructive wildfires in Californiarsquos history with 44fatalities and nearly 9000 structures lost (Table 1) The southern California fires included the Thomas firewhich was the largest fire in Californiarsquos modern history (Table 2)
Fire 2018 1 x FOR PEER REVIEW 2 of 17
and more frequent fire [2] However the impacts of fire exclusion in shrublands such as chaparral
ecosystems in California are more mixed and generally weaker [111] Much of the western US has
seen a noted increase in fire activity (eg burned area extent number of large fires) over the past
several decades [14] in part due to changes in climatic conditions that favor and facilitate fire in
flammability-limited forests [15] By contrast trends in fire activity have been more subdued in
Mediterranean California ecoregions and across broader southern California [141617] The reasons
behind these diverging trends may be tied to a decrease in reported fire ignitions [17] which are
nearly all human-caused [18] as well as anthropogenic activities including land-use fire policies and
diligent fire suppression [19] Nonetheless interannual climate variability does exhibit significant
relationships to burned area extent in these regions [3172021] Mediterranean ecosystems are
intermediate productivity biomes where fire is often not purely fuel-limited or flammability-limited
during the fire season [22] Additionally such ecosystems in California are largely co-located with
sizeable human populations and anthropogenic land use [19] yielding less direct correlations to
climate variability than in other areas with a low anthropogenic footprint where wildfire is more
directly limited by climate (eg fuel-limited or climate-limited) [23]
In 2017 US federal wildland fire suppression costs exceeded $29 billion US dollars making it
the costliest fire season on record [24] More than 4 million hectares (ha) burned in 2017 which is the
second most area burned since 1984 and only 40000 ha below that in 2015 [24] For context we note
that US burned area statistics include Alaska which often contributes substantially to annual total
burned area While over 2 million ha burned in Alaska in 2015 just over 260000 ha burned in Alaska
in 2017 thus highlighting the elevated level of fire activity in the contiguous US The US wildfire
season started across the southern Plains in early March but reached its peak in August and
September The national preparedness level which is a categorical measure of national fire activity
and the number of fire suppression resources committed and available remained at its highest level
for 39 consecutive days in 2017 (72 total days) when large conflagrations were found from northern
California into the Pacific Northwest and eastward into Montana coincident with one of the warmest
and driest summers in the observational record for much of the region [2526] The 2017 fire season
culminated with the wind-driven North Bay fires in October and southern California fires in
December (Figure 1) both extreme wildfire events [27] The North Bay fires were reminiscent of the
1964 Hanley Fire in Napa and Sonoma counties and October 1991 Oakland Hills fire due to the rapid
spread of wind-driven fires in densely populated areas around the San Francisco Bay Area The North
Bay fires were the deadliest and most destructive wildfires in Californiarsquos history with 44 fatalities
and nearly 9000 structures lost (Table 1) The southern California fires included the Thomas fire
which was the largest fire in Californiarsquos modern history (Table 2)
Figure 1 (a) Map of North Bay fires with select Remote Automated Weather Stations (RAWS)
Forested areas shaded in green and Wildland Urban Interface (WUI) hatched in grey [28] (b) Map of
southern California fires with select RAWS Black lines are the vertical cross-section transects for
Figures 2c and 4c
Figure 1 (a) Map of North Bay fires with select Remote Automated Weather Stations (RAWS) Forestedareas shaded in green and Wildland Urban Interface (WUI) hatched in grey [28] (b) Map of southernCalifornia fires with select RAWS Black lines are the vertical cross-section transects for Figures 2cand 4c
Fire 2018 1 18 3 of 17
Table 1 List of wildfires including wildfire complexes their final size the number of structures theydestroyed and damaged and their ignition time during the northern California wildfire event inOctober 2017 Start times are listed in coordinated universal time (UTC) which is 8 hours ahead ofPacific Standard Time
Names of Wildfires and Complexes Area Burned (ha) StructuresDestroyedDamaged Start Date and Time (UTC)
Tubbs 14895 5636317 9 October 2017 0445
Nuns 22877 1355172 9 October 2017 0500
Atlas 20892 120783 9 October 2017 0452
Pocket 7024 62 9 October 2017 1030
Redwood Valley (MendocinoLake Complex) 14780 54644 9 October 2017 0636
Sulphur (Mendocino Lake Complex) 893 1628 9 October 2017 0659
Cascade (Wind Complex) 4042 26410 9 October 2017 0603
LaPorte (Wind Complex) 2489 742 9 October 2017 0757
Cherokee 3406 61 9 October 2017 0445
Table 2 List of wildfires their final size the number of structures they destroyed and damaged andtheir ignition time during the southern California wildfire event in December 2017
Wildfire Names Area Burned (ha) Structures DestroyedDamaged Start Date and Time (UTC)
Thomas 114078 1063280 5 December 2017 0228Creek 6321 12381 5 December 2017 1144Rye 2448 63 5 December 2017 1931Lilac 1659 15764 7 December 2017 1915
In this paper we provide a description of these two extreme fire events with a particular focus onthe roles of weather and climate in enabling and driving these fires Through a case-study approach weexamined synoptic to meso-scale weather factors coincident to the events as well as climatic conditionsantecedent to the events that resulted in exceptional surface fire weather conditions that led to rapidfire growth We also assessed the rarity of key fire weather indicators during these events relative tothe observational record Finally we discuss how well each of the events were forecasted from localand national perspectives
2 Datasets
A set of representative long-term (gt20 years) surface-based weather observations from RemoteAutomated Weather Stations (RAWS) proximal to both the North Bay and Southern Californiafires were selected RAWS are strategically sited to sample fire weather and fire danger for landmanagement agencies [29] Weather stations with longer periods of record (eg airports) were notutilized in this study due to their locations in valleys usually well away from the stronger downslopewinds Furthermore observations from regional airports rarely showed strong winds from thenortheast quadrant that are characteristic of foehn winds in these regions RAWS data were qualitycontrolled by removing missing (eg minus99 or minus9999) physically impossible observations (eg negativerelative humidity) and reviewing the topbottom 1st percentiles of all observations at each RAWSAdditionally photos of RAWS sites were examined for any potential micrositing issues (WRCC RAWS)RAWS hourly observations were used to calculate the Fosberg Fire Weather Index (FFWI) FFWI isan instantaneous index that combines the influence of wind speed temperature and humidity butdoes not account for the effect of antecedent conditions in preconditioning fuels Percentiles of hourlyRAWS observations were calculated using the entire period of record for each station
The Santa Rosa and Hawkeye RAWS were chosen based on their proximity to the Tubbs Nunsand Pocket Fires (Figure 1a) their location on the western slopes of the Northern Coastal Ranges(eg lee slopes for northeasterly downslope winds) and their long period of record (26 and 24 years
Fire 2018 1 18 4 of 17
respectively) The Atlas Peak RAWS was originally considered due to its proximity to the Atlas Fireand location on crestwestern slopes of the Northern Coastal Ranges However Atlas Peak RAWS issheltered by tall trees especially to its north and east which under samples strong winds from thosedirections and only had a six-year observational record and was not included in subsequent analysisThe Pike County RAWS was chosen based on its proximity to the Wind Complex its ridgetop locationand its 25-year observational record Bangor RAWS was considered but its observed winds wereanomalously weaker than surrounding RAWS during the event possibly due to its location near thebase of small topographic feature and a stand of trees located just to its north [30]
The Montecito and Rose Valley RAWS were chosen based on their proximity to the Thomas Fire(Figure 1b) and their relatively long period of record (21 and 23 years respectively) The Saugus RAWSwas situated between the Rye and Creek Fires (Figure 1b) and had a 22-year period of record TheFremont Canyon RAWS was selected to demonstrate ridgetop conditions near the southern Californiacoast during the Santa Ana wind event and had a 26-year period of record
High resolution (2-km) atmospheric model analyses and forecasts from the Weather Research andForecasting (WRF) model run by California and Nevada Smoke and Air Committee (CANSAC) atthe Desert Research Institute was obtained for the North Bay and Southern California events Modelanalyses were used to examine both synoptic and meso-scale atmospheric features For each event wecreated a cross-section atmospheric profile to visualize finer-scale features of the downslope windstormincluding the hydraulic jump and increased surface winds along and near lee slopes
A chronology of the occurrence of Santa Ana winds was updated from [6] through the end of2017 (Supplemental Data 1) While many methods have been used to diagnose the occurrence ofsuch winds including those using station-based observations and mesoscale reanalysis we chose touse this approach as it uses synoptic-scale drivers (eg sea level pressure gradients and upper-levelthermal support through cold air advection) that have been linked to widespread strong offshorewinds in southwestern California and was readily updated through 2017 to provide a consistent wayof examining such data over the past 70 years
Climate data from two primarily sources were used (1) monthly temperature and precipitationdata from the Parameterized Regression on Independent Slopes Model [31] with data from 1895ndash2017and (2) the gridMET daily surface meteorological dataset [32] with data from 1979ndash2017 The latterdataset was used to calculate 100-h dead fuel moisture using the US National Fire Danger RatingSystem Both datasets provide gridded data at a 124th degree resolution
Fire data including ignition time area burned daily progression info and structures destroyedor damaged for the North Bay and Southern California events was obtained from CAL FIRE [33]Historical California fire information was also obtained from CAL FIRE [3435]
The National Weather Service (NWS) issues Red Flag Warnings to alert land management agenciesto the potential for widespread new ignitions or control problems with existing fires when thecombination of fuels and weather conditions support extreme fire danger andor fire behavior in thenext 48 h [36] Fire Weather Watches are issued 18ndash96 h in advance indicating the potential for RedFlag conditions Local NWS weather forecast offices are responsible for issuing Red Flag Warnings andFire Weather Watches while the NWS Storm Prediction Center (SPC) issues national daily fire weatheroutlooks for elevated critical and extremely critical fire weather conditions Critical (extremely) fireweather conditions in California are defined as sustained winds of at least 89 msminus1 (134 msminus1) RHbelow 15 (5) temperatures above 156 C (211 C) for three consecutive hours with dry (very dry)fuels Red Flag Warning criteria generally agree with SPC critical fire weather criteria across the USbut there are differences in the specific criteria used by each NWS forecast office
3 Overview of Fire Impacts and Progression
The North Bay and southern California fires would have been notable in isolation given their sizeand rapid rate of spread near densely populated areas However both events occurred in the samestate at the end of a very active US fire season and pushed the bounds of conventional fire wisdom
Fire 2018 1 18 5 of 17
with the extreme rates of spread size and timing of the fires [27] The North Bay fires burned nearly100000 ha with the majority of these devastating consequences occurring within 12 h of ignition on8ndash9 October 2017 (Table 1) including four of the top 20 deadliest and most destructive wildfires in thestatersquos history Suppression costs exceeded $400 million $10 billion in insurance claims were filed andoverall economic impacts including evacuation and displacement of local residents are estimated toexceed $85 billion [3738] More than 200000 people were evacuated during the multi-week fire eventin southern California during December 2017 The total costs of the southern California wildfires arestill being calculated with current suppression expenditures for the Thomas Fire totaling $382 million(federal $207 million state $175 million) [37] and an estimated $25 billion in insurance claims Thecauses for all of the North Bay and southern California fires remain under investigation Howeverlightning was not the cause as no cloud-to-ground lightning occurred in vicinity of the wildfires in thepreceding 14 days according to Vaisalarsquos National Lighting Detection Network
31 North Bay Fires
The North Bay Fires were an outbreak of wildfires that occurred across the Northern CoastRanges and foothills of the northern Sierra Nevada in northern California (Figure 1a) These areas arecharacterized by a Mediterranean climate fine and flashy fuels such as shrubs and annual grasseswith some trees and steep terrain [24] Most of the wildfires including all of the large fires ignitedduring a six-hour period (0445ndash1030 UTC 9 October) and spread rapidly overnight to the southwestcoincident with the easterly wind event known as Diablo winds near the San Francisco Bay Area andNortheast Foehn winds along the western slopes of the Sierra Nevada (Figure 1 Table 1) The rapidspread of these wildfires combined with nighttime ignition and proximity and progression towardpopulated areas created an exceptional wildfire hazard The majority of the fatalities damages andburned area occurred during the overnight and morning hours of 8ndash9 October
The Tubbs Fire was not the largest wildfire during this event but was the most destructive as itmoved downslope into the city of Santa Rosa California and surrounding communities (Figure 1aTable 1) Embers lofted by strong winds ahead of the flaming front ignited spot fires includingembers that directly landed on or inside homes within suburban communities further complicatingsuppression and evacuation efforts [39] By the time the Tubbs fire was contained it was the mostdestructive (5636 structures) and second deadliest (22 deaths) wildfire in Californiarsquos history [33]The Nuns Fire burned in eastern Sonoma County affecting the Sonoma Glen Ellen and Kernwoodcommunities while burning 22877 ha and destroying 1355 structures (Figure 1a Table 1) The AtlasFire burned 20892 ha and destroyed 783 structures east and north of Napa (Figure 1a Table 1) Furtherto the north the Mendocino-Lake Complex burned more than 15000 ha and destroyed more than 700structures while on the western slopes of the Sierra Nevada the Wind Complex and Cherokee Firesburned nearly 10000 ha and destroyed nearly 350 structures (Figure 1a Table 1)
32 Southern California Fires
An extended period of Santa Ana Winds in December 2017 drove several large wildfires westwardand southward across the slopes of the Transverse Ranges of southern California (Figure 1b) Similarto the North Bay Fires the combination of strong downslope winds fine and flashy fuels steepterrain and the proximity of the wildfires to densely populated areas created a dangerous situationThe Thomas Fire burned 114078 ha in southwestern California and at the time of this writing wasthe largest wildfire in the statersquos modern history (Table 2) The Thomas Fire started at 0228 UTC 5December 2017 in Ventura County southeast of Ojai and burned more than 40000 ha within 48 h ofignition spreading generally to the west (Figure 1b) The Thomas Fire grew more than 25000 ha on twoseparate days (4ndash5 December and 9ndash10 December) and 4000 ha on eight separate days including twodays (13ndash14 December and 15ndash16 December) that were more than a week after its ignition The Thomasfire destroyed 1063 structures and directly resulted in two fatalities and was not fully contained until 12January 2018 Other recent Santa Ana Wind driven fire events such as those that occurred in October
Fire 2018 1 18 6 of 17
2003 and 2007 directly caused more deaths and destruction However the flooding and post-firedebris flow triggered by a landfalling atmospheric river [40] over the Thomas Fire burn scar thatoccurred in Montecito and Santa Barbara claimed at least another 21 lives and destroyed more than100 homes [41]
A handful of other large wildfires occurred during the prolonged offshore wind event acrosssouthern California in December The Creek and Rye Fires began the morning of 5 December innorthwestern Los Angeles County and burned 6321 and 2448 ha respectively (Figure 1b Table 2)The Lilac Fire began at 1915 UTC 7 December in northern San Diego County burning 1659 ha anddestroying 157 structures Outside of the Thomas Fire wildfires burned more than 10500 ha destroyedmore than 300 structures and damaged more than 160 structures across southern California
4 Meteorological Conditions
41 North Bay Fire Weather
The synoptic conditions leading to the North Bay fires featured a rapidly southeastwardmoving mid-tropospheric shortwave trough that moved through the inland Pacific Northwest andIntermountain West during 8ndash9 October 2017 (Figure 2a) Behind this positively tilted shortwavemid-tropospheric trough heights raised aloft over the West Coast and strong northeasterly flowdeveloped across the Sierra Nevada and Northern Coastal Ranges of California (Figure 2ab) Anunusually warm and dry air mass prevailed across most of northern California in the days beforethe event including Napa County which experienced temperatures 3ndash4 C above and RH 15ndash20below climatological averages per gridMET data [32] Strong cross-mountain northeasterly flow wasapparent between the surface and 800 hPa (~2000 m) and multiple inversions and critical layersexisted below 2000 m which created a conducive environment for downslope windstorms (Figure 2bcand Figure 3) [4243] The downslope windstorm caused further atmospheric drying as evident bythe daily low record for precipitable water (583 mm lowest since 1948) observed in the OaklandCalifornia 1200 UTC 9 October atmospheric sounding (Figure 3) and widespread RH values below20 (Figure 2b)
Northeasterly surface winds accelerated during the afternoon to early morning on 8ndash9 Octoberacross much of the region coincident with a decline in RH (Figure 2b) Consistent with downslopewindstorms the strongest winds and downward motion (Figure 2c positive values color-shadedred) were observed near ridge tops and lee slopes with a standing wave feature resolved in potentialtemperature fields from high-resolution mesoscale modeling forecasts (Figure 2bc) Across northernCalifornia widespread wind gusts of 15ndash20 msminus1 with RH below 15 were observed from theafternoon of 8 October to morning of 9 October The Santa Rosa RAWS at 1100 UTC 9 October reporteda temperature of 328 C RH of 7 E-NE wind gust of 273 msminus1 Fosberg Fire Weather Index (FFWI)of 78 and 10-h dead fuel moisture (FM10) of 128 (Table 3) Similar observations of low humidityand FM10 accompanying high winds and FFWI were found at other stations (Table 3) These valuesof wind gusts RH FM10 or FFWI were typically in the bottom or top 1st percentiles for stationhourly observations for the 20+ year observational record (Table 3) When these four near surfacemeteorological variables were considered jointly during the North Bay Fires we found at least fourconsecutive hours (all occurring between 0400ndash1200 UTC 9 October) during which Santa Rosa andHawkeye RAWS had gt99th percentile wind speedgusts and FFWI as well as lt2nd percentile RH Theduration of such extremes jointly observed across these variables was unprecedented in each stationrsquosperiod of record As remarkable was that these conditions occurred at night The strong winds andadiabatic compression associated with the downslope flow and mixing inhibited radiative cooling andnocturnal RH recovery Such conditions were also seen at Pike County Lookout RAWS but were notunprecedented as seen during two prior occasions in the observational record
Fire 2018 1 18 7 of 17
Fire 2018 1 x FOR PEER REVIEW 7 of 17
unprecedented in each stationrsquos period of record As remarkable was that these conditions occurred
at night The strong winds and adiabatic compression associated with the downslope flow and
mixing inhibited radiative cooling and nocturnal RH recovery Such conditions were also seen at Pike
County Lookout RAWS but were not unprecedented as seen during two prior occasions in the
observational record
Figure 2 California and Nevada Smoke and Air Committee (CANSAC [44]) 2-km Weather Research
and Forecasting Model (WRF) output valid at 0900 UTC 9 October 2017 (a) 500 hPa heights (dm)
contoured winds (barbs MPH) temperature (color filled) and yellow stars representing three cities
on Figures 1a and 2b (San Francisco Santa Rosa Sacramento) (b) surface relative humidity (color
filled ) winds (barbs MPH) cross-section transect (same as Figure 1a) and yellow stars
representing three cities on Figures 1a and 2a (San Francisco Santa Rosa Sacramento) (c) vertical
cross section with potential temperature (contoured K) omega (color filled μbars sminus1 positive values
(red) represent downward motion) terrain (dark grey) model terrain (light grey) yellow star
denoting Santa Rosa CA and latitude and longitude in decimal degrees in parentheses of starting
and ending points of the cross-section transect
Figure 2 California and Nevada Smoke and Air Committee (CANSAC [44]) 2-km Weather Researchand Forecasting Model (WRF) output valid at 0900 UTC 9 October 2017 (a) 500 hPa heights (dm)contoured winds (barbs MPH) temperature (color filled) and yellow stars representing three citieson Figures 1a and 2b (San Francisco Santa Rosa Sacramento) (b) surface relative humidity (colorfilled ) winds (barbs MPH) cross-section transect (same as Figure 1a) and yellow stars representingthree cities on Figures 1a and 2a (San Francisco Santa Rosa Sacramento) (c) vertical cross section withpotential temperature (contoured K) omega (color filled microbars sminus1 positive values (red) representdownward motion) terrain (dark grey) model terrain (light grey) yellow star denoting Santa RosaCA and latitude and longitude in decimal degrees in parentheses of starting and ending points of thecross-section transect
Fire 2018 1 18 8 of 17Fire 2018 1 x FOR PEER REVIEW 8 of 17
Figure 3 Oakland California atmospheric soundings at 0000 UTC (a) and 1200 UTC (b) 9 October
2017 Precipitable water (PWAT) of 583 mm at 1200 UTC was a daily low record for the site
Table 3 Select nearby RAWS hourly observations (Figure 1a) during the peak of critical fire weather
conditions during the North Bay fires Fosberg Fire Weather Index (FFWI) surface relative humidity
surface wind gust surface wind speed and 10-h fuel moisture values percentiles and any records
shown
Santa Rosa RAWS Hawkeye RAWS Pike County Lookout RAWS
FFWIPercentile 7899th 128(MAX) 7799th
Surface Relative HumidityPercentile 71st 122nd 172nd
Surface Wind GustPercentile 273 msminus199th 353 msminus199th 219 msminus199th
Surface WindPercentile 116 msminus199th 215 msminus199th 139 msminus199th
10-h Fuel MoisturePercentile 1285th 385th 549th
Observation Time (UTC) 1100 9 October 0700 9 October 1200 9 October
Period of Record (MonthYear) 011992ndash102017 011994ndash102017 011992ndash102017
Fire weather conditions were well forecasted by the NWS up to a week prior to the event The
NWS San FranciscoMonterey Bay forecast office first mentioned the possibility of offshore flow with
low RH for the weekend (8ndash9 October 2017) in its fire weather forecast on 2 October 2017 and Storm
Prediction Center (SPC) first mentioned the possibility of critical fire weather conditions due to
offshore flow and low RH for northern California on 3 October 2017 The NWS San
FranciscoMonterey Bay issued a Fire Weather Watch on 5 October valid Sunday morning through
Monday morning (8ndash9 October) with forecast wind gusts up to 25 msminus1 and stated this was the
strongest offshore wind event of the fall to date The watch was later upgraded to a Red Flag Warning
on 6 October valid from 1800 UTC 8 October to 1200 UTC 10 October for much of the San Francisco
Bay Area highlighting low RH (5ndash15) strong winds (sustained 67ndash134 msminus1 gusts to 25 msminus1) and
that any wildfire ignition would spread rapidly Coincidentally the SPC forecast elevated to critical
fire weather conditions for the same areas
42 Southern California Fire Weather
This prolonged offshore wind event began as Rossby wave breaking over the interior western
US resulted in a mid-tropospheric temperature and height minima that moved south and became
cut-off from the larger flow over Arizona while surface high pressure built in over the Great Basin
(Figure 4ab) This feature helped produce northeast flow aloft and at the surface over southern
California (Figure 4ab) In addition the northeast flow aloft led to cold air advection and subsidence
across southwestern California that can impart downward momentum and strengthen surface
b)a)
Figure 3 Oakland California atmospheric soundings at 0000 UTC (a) and 1200 UTC (b) 9 October2017 Precipitable water (PWAT) of 583 mm at 1200 UTC was a daily low record for the site
Table 3 Select nearby RAWS hourly observations (Figure 1a) during the peak of critical fireweather conditions during the North Bay fires Fosberg Fire Weather Index (FFWI) surface relativehumidity surface wind gust surface wind speed and 10-h fuel moisture values percentiles and anyrecords shown
Santa Rosa RAWS Hawkeye RAWS Pike County Lookout RAWS
FFWIPercentile 7899th 128(MAX) 7799th
Surface Relative HumidityPercentile 71st 122nd 172nd
Surface Wind GustPercentile 273 msminus199th 353 msminus199th 219 msminus199th
Surface WindPercentile 116 msminus199th 215 msminus199th 139 msminus199th
10-h Fuel MoisturePercentile 1285th 385th 549th
Observation Time (UTC) 1100 9 October 0700 9 October 1200 9 October
Period of Record (MonthYear) 011992ndash102017 011994ndash102017 011992ndash102017
Fire weather conditions were well forecasted by the NWS up to a week prior to the event TheNWS San FranciscoMonterey Bay forecast office first mentioned the possibility of offshore flow withlow RH for the weekend (8ndash9 October 2017) in its fire weather forecast on 2 October 2017 and StormPrediction Center (SPC) first mentioned the possibility of critical fire weather conditions due to offshoreflow and low RH for northern California on 3 October 2017 The NWS San FranciscoMonterey Bayissued a Fire Weather Watch on 5 October valid Sunday morning through Monday morning (8ndash9October) with forecast wind gusts up to 25 msminus1 and stated this was the strongest offshore wind eventof the fall to date The watch was later upgraded to a Red Flag Warning on 6 October valid from 1800UTC 8 October to 1200 UTC 10 October for much of the San Francisco Bay Area highlighting lowRH (5ndash15) strong winds (sustained 67ndash134 msminus1 gusts to 25 msminus1) and that any wildfire ignitionwould spread rapidly Coincidentally the SPC forecast elevated to critical fire weather conditions forthe same areas
42 Southern California Fire Weather
This prolonged offshore wind event began as Rossby wave breaking over the interior westernUS resulted in a mid-tropospheric temperature and height minima that moved south and becamecut-off from the larger flow over Arizona while surface high pressure built in over the Great Basin(Figure 4ab) This feature helped produce northeast flow aloft and at the surface over southern
Fire 2018 1 18 9 of 17
California (Figure 4ab) In addition the northeast flow aloft led to cold air advection and subsidenceacross southwestern California that can impart downward momentum and strengthen surfacedownslope winds A positively tilted mid-tropospheric ridge slowly moved onshore centered overthe US Pacific coast with this general pattern persisting until 22 December keeping offshore flowacross southern California (eg Figure 4a) Both Santa Ana and Sundowner winds can develop underthis synoptic configuration [64546]
Fire 2018 1 x FOR PEER REVIEW 9 of 17
downslope winds A positively tilted mid-tropospheric ridge slowly moved onshore centered over
the US Pacific coast with this general pattern persisting until 22 December keeping offshore flow
across southern California (eg Figure 4a) Both Santa Ana and Sundowner winds can develop under
this synoptic configuration [64546]
Figure 4 California and Nevada Smoke and Air Committee (CANSAC [44]) 2-km Weather Research
and Forecasting Model (WRF) output valid at 2100 UTC 5 December 2017 (a) 500 hPa heights (dm)
contoured winds (barbs MPH) temperature (color filled) and yellow stars representing three cities
on Figures 1b and 4b (Santa Barbara Ojai Los Angeles) (b) surface relative humidity (color filled )
winds (barbs MPH) cross-section transect and yellow stars representing three cities on Figures 1b
and 4a (Santa Barbara Ojai Los Angeles) (c) vertical cross section with potential temperature
(contoured K) omega (color filled μbars sminus1 positive values (red) represent downward motion)
terrain (dark grey) model terrain (light grey) yellow star denoting Ojai CA and latitude and
longitude in decimal degrees in parentheses of starting and ending points of the cross-section transect
Widespread strong east-northeast surface winds and RH below 15 developed by 0000 UTC 5
December and expanded in coverage and intensity by 2100 UTC 5 December (Figure 4b) The depth
Figure 4 California and Nevada Smoke and Air Committee (CANSAC [44]) 2-km Weather Researchand Forecasting Model (WRF) output valid at 2100 UTC 5 December 2017 (a) 500 hPa heights (dm)contoured winds (barbs MPH) temperature (color filled) and yellow stars representing three cities onFigures 1b and 4b (Santa Barbara Ojai Los Angeles) (b) surface relative humidity (color filled )winds (barbs MPH) cross-section transect and yellow stars representing three cities on Figures 1b and4a (Santa Barbara Ojai Los Angeles) (c) vertical cross section with potential temperature (contouredK) omega (color filled microbars sminus1 positive values (red) represent downward motion) terrain (darkgrey) model terrain (light grey) yellow star denoting Ojai CA and latitude and longitude in decimaldegrees in parentheses of starting and ending points of the cross-section transect
Fire 2018 1 18 10 of 17
Widespread strong east-northeast surface winds and RH below 15 developed by 0000 UTC 5December and expanded in coverage and intensity by 2100 UTC 5 December (Figure 4b) The depthand magnitude of the dry air was apparent from local atmospheric soundings including the 1200 UTC7 December San Diego California atmospheric sounding setting a daily record for lowest precipitablewater at that location (254 mm since 1948) By 2100 UTC 5 December the northerly-easterly windsincreased and RH dropped as strong downward motion developed on the lee slopes across southernCalifornia characteristic of a downslope windstorm (Figure 4bc)
Extreme fire weather conditions were observed across southern California during this SantaAna wind event The Saugus RAWS from 1700ndash2100 UTC 5 December observed gt99th percentilevalues for FFWI wind gust maximum and wind speed with RH in the 4th percentile At FremontCanyon RAWS gt99th percentile values for FFWI wind gust maximum and wind speed with RH inthe 2nd percentile was observed from 1600ndash1800 UTC 7 December Up the coast the Montecito RAWSrecorded its lowest RH ever (10 although we note that RH estimates are prone to errors at very lowlevels of ambient humidity [47]) at 0900 UTC 12 December with 67 msminus1 northerly winds and gt99thpercentile values for FFWI wind gust maximum and wind speed from 1100ndash1200 UTC 16 DecemberShortly after these observations the Montecito RAWS was burned over by the Thomas Fire Thelongevity of key surface fire weather extremes was particularly notable with a majority of the hoursfrom 0800 UTC 3 December to 0800 UTC 19 December having RH below the 5th percentile indicativeof the lack of overnight RH recovery throughout the duration of the event (Table 4) Per the criteriaestablished by [6] which used reanalysis data Santa Ana wind conditions occurred for 12 consecutivedays 4ndash15 December the longest duration event (ie consecutive days) in the observational recordbased on this chronology dating back to 1948 The previous longest Santa Ana wind event in thisdataset was nine consecutive days (5ndash13 February 2006)
Table 4 Percentage of total hours between 0800 UTC 3 December and 0800 UTC 19 December2017 above the 95th (99th) percentile for Fosberg Fire Weather Index (FFWI) surface wind gust andsurface wind speed and below the 5th (1st) for surface relative humidity and 10-h fuel moisture forselect RAWS
Saugus RAWS Fremont CanyonRAWS
Rose ValleyRAWS Montecito RAWS
FFWI 222 (55) 571 (130 83 (30) 34 (0)Surface Relative Humidity 668 (252) 670 (125) 396 (122) 804 (621)Surface Wind Gust 127 (0) 382 (0) 105 (06) 09 (06)Surface Wind Speed 152 (25) 463 (97) 42 (11) 12 (0)10-h Fuel Moisture 0 (0) 554 (222) 460 (127) NAPeriod of Record (MonthYear) 011995ndash122017 011992ndash122017 011994ndash122017 011997ndash122017
The offshore wind event was well forecast by the NWS up to a week prior to the onset of offshorewinds On 28 November the NWS OxnardLos Angeles forecast office mentioned the possibility ofoffshore winds for the following week and on 30 November SPC forecasted probabilities of criticalfire weather conditions across southern California for the following week By the afternoon of 1December a Fire Weather Watch was issued for Santa Barbara Ventura and Los Angeles countiesfor a moderate-to-strong prolonged offshore wind event and was subsequently upgraded to a RedFlag Warning by the next afternoon (2 December) Through the event at least one Red Flag Warningwas valid per day in southern California from 2ndash21 December and SPC forecasted critical fire weatherconditions consistently through the event including the peak (4ndash9 December)
5 Climatic Basis
The sequence of moisture availability in the years to months preceding these ignitions primedthese landscapes for the extreme fire weather and conflagrations that ensued California hydroclimateis highly variable due to its location along the southernmost extent of the North Pacific jet stream andpropensity to receive much of its annual precipitation in a few heavy events [48] Prior to water year
Fire 2018 1 18 11 of 17
2017 (October 2016ndashSeptember 2017) California endured the drought of observational record fromwater years 2012ndash2016 and one of the most extreme multi-annual droughts in 1200 years [49] dueto chronic below normal precipitation and exceptionally high rates of potential evapotranspirationassociated with the warmest years in the observational record [50] This chronic drought resulted inlarge scale loss of tree canopy water [51] and tree mortality across the Sierra Nevada By contrast the2017 water year delivered well above normal to record precipitation across much of the state withparts of the central to northern Sierra Nevada and scattered locations near the San Francisco BayArea receiving the most OctoberndashApril precipitation since 1895 (Figure 5a) Southern California alsogenerally had OctoberndashApril precipitation in the top tercile of historical conditions However much ofthis precipitation occurred in fall and winter as the region had a dry spring (MarchndashMay)
The above-normal moisture across California during the winter of 2016ndash2017 resulted inan anomalously productive landscape by spring 2017 Increased moisture content and biomassproductivity in semi-arid regions often help promote fire in fuel-limited fire regimes through theaccumulation of fine fuels that facilitate fire spread [52] Previous climatendashfire relationships haveshown a weak positive correlation between early winter precipitation and burned area during thesubsequent fire season in non-forested areas of southern California [20] and cumulative precipitationin several recent winters [3]
Little precipitation fell across California from May 2017 through the remainder of the calendar yearDry summers are typical in Californiarsquos Mediterranean climate but the arrival of autumn precipitationwas substantially delayed across the region SeptemberndashDecember precipitation was exceptionallylow across the state and the lowest in over 120 years across portions of south coastal California(Figure 5b) Complementary to below normal precipitation the region experienced exceptionallywarm temperatures with much of northern and central California having their warmest May-Septembersince 1895 (Figure 5c) while much of south coastal California had its warmest October-December since1895 (Figure 5d) Precipitation from MarchndashDecember 2017 across portions of southwestern Californiawas the lowest since 1895 The delayed arrival of wetting precipitation (gt25 mm) was particularlynotable across southern California near the Thomas Fire The second longest dry spell on record(246 days) was observed at a long-term (gt60 years lt1 of missing data) National Weather ServiceCooperative Observer Network station near the Thomas Fire in Ojai with precipitation occurring inearly January 2018 associated with the post-fire debris flow
Relationships between interannual variability in temperature and burned area in non-forestedcoastal Mediterranean ecosystems in California are generally weak [17] as they not typicallyflammability-limited (but see [21]) yet do show a slight positive correlation with late summer to earlyfall temperature [20] The nominal precipitation that occurs during summer in southern California isuncorrelated with historical burned area [20] although precipitation during the month of fire activityis negatively correlated with the sizes of Santa Ana driven fires [3]
The delayed arrival of autumn precipitation and continued warm temperatures leading up to thefire events allowed for dead fuel moistures to remain at levels more commonly found in mid-to-latesummer Climate variables like temperature and precipitation often help inform the ways in whichclimate variability enables fire However metrics calculated from climate and weather variables thatare directly designed to represent biophysical processes such as vegetation desiccation (eg fuelmoistures) and plant water use (eg actual evapotranspiration) often are superior correlates of burnedarea [2053] We provide two snapshots of 100-h dead fuel moisture percentiles coincident with theNorth Bay fires on 9 October 2017 and the southern California fires on 8 December 2017 In both casesa large swath of exceptionally low 100-h dead fuel moisture was co-located with the region of peakfire activity On 9 October much of the Bay Area and southern Sacramento valley experienced fuelmoistures below the historical 1 values (pooled over all calendar days of the year) (Figure 6a) Acompanion time series of 100-h dead fuel moisture near the Atlas fire shows that conditions below the3rd percentile for much of the early half of October (Figure 6c) Similarly much of coastal southernCalifornia experienced 100-h dead fuel moisture in the bottom 1ndash3 in early December 2017 (Figure 6b)
Fire 2018 1 18 12 of 17
with exceptionally low fuel moistures during the period of peak fire activity including reaching itslowest value in the observational record (1979ndash2017) (Figure 6d)Fire 2018 1 x FOR PEER REVIEW 12 of 17
Figure 5 Classified ranking of (a) October 2016-April 2017 cumulative precipitation (b) September-
December 2017 cumulative precipitation (c) May-September 2017 mean temperature and (d)
October-December 2017 for the period 1895ndash2017
Figure 5 Classified ranking of (a) October 2016-April 2017 cumulative precipitation (b) September-December2017 cumulative precipitation (c) May-September 2017 mean temperature and (d) October-December 2017 forthe period 1895ndash2017
Fire 2018 1 x FOR PEER REVIEW 12 of 17
Figure 5 Classified ranking of (a) October 2016-April 2017 cumulative precipitation (b) September-
December 2017 cumulative precipitation (c) May-September 2017 mean temperature and (d)
October-December 2017 for the period 1895ndash2017
Figure 6 Cont
Fire 2018 1 18 13 of 17Fire 2018 1 x FOR PEER REVIEW 13 of 17
Figure 6 Maps of 100-h dead fuel moisture percentiles for (a) 9 October 2017 and (b) 8 December 2017
Percentiles are calculated relative to data pooled over the calendar year from 1979ndash2015 Time series of 100-h
fuel moisture near the (c) Atlas fire (384degN 12224degW) and (d) Thomas fire (3443degN 1191degW) prior to and
throughout the duration of the fire The blue line shows 1981ndash2010 daily average fuel moisture levels and the
dashed horizontal line shows 3rd percentile conditions using data pooled over the calendar year that delineates
extreme fire danger
6 Summary and Conclusions
The North Bay and southern California fires were wind-driven conflagrations that affected
densely populated areas on the heels of an extended hot and dry period that followed an anomalous
wet winter The sequencing of climatological and meteorological conditions for these fire events
mirrors other notable fires of record in California [254] and other portions of the world [55] This
highlights the important roles that both climate variability and meteorological factors have on
extreme fires in terms of preconditioning fuel abundance flammability and driving fire spread Rare
conditions were seen across a spectrum of timescales coinciding with these two fire events From a
meteorological perspective we found that stations near the North Bay fires experienced their most
acute fire weather conditions (as viewed through FFWI and combinations of wind speed RH FM10
and FFWI) in over two decades of observations (Table 3) Southern California experienced its longest
duration Santa Ana wind event in at least 70 years and daily records for atmospheric dryness which
led to chronic periods of fire danger (Figures 5 and 6 Table 4) Common to both events was the
occurrence of strong winds that have been shown to be a key determinant in large human-caused
wildfires [56] The most severe multi-annual drought (2012ndash2016) in California in the observational
record preceded well above normal to record setting precipitation in the wet season prior to the fires
with some areas recording their wettest OctoberndashApril in 120 years During both fires 100-h dead
fuel moistures were below the 3rd percentile including the lowest values in the observational record
(1979ndash2017) with the Thomas Fire (Figures 5 and 6) Such conditions were facilitated by exceptionally
warm temperatures in the months preceding the fires and the driest MarchndashDecember since 1895 in
southern California We do not attempt to quantify the relative roles of these climatic extremes on the
extent or rate of spread of these extreme wildfire events Additional analyses may help elucidate the
complementary role that fuel conditions played in these wind-driven conflagrations
The nexus of climate weather fuels and terrain drive large wildfire occurrence [57ndash59] and
these factors all contributed to the North Bay and southern California fire events Foehn winds have
been extensively studied with regard to fire weather (eg [160]) and are a recognized critical fire
weather pattern [5] that are often referred to in NWS fire weather forecasts However the question
remains as to whether the risk posed by extreme foehn wind-driven fires is well quantified given
recent high-impact foehn wind-driven fire events in California Chile and Gatlinburg We
Figure 6 Maps of 100-h dead fuel moisture percentiles for (a) 9 October 2017 and (b) 8 December 2017Percentiles are calculated relative to data pooled over the calendar year from 1979ndash2015 Time series of100-h fuel moisture near the (c) Atlas fire (384N 12224W) and (d) Thomas fire (3443N 1191W)prior to and throughout the duration of the fire The blue line shows 1981ndash2010 daily average fuelmoisture levels and the dashed horizontal line shows 3rd percentile conditions using data pooled overthe calendar year that delineates extreme fire danger
6 Summary and Conclusions
The North Bay and southern California fires were wind-driven conflagrations that affected denselypopulated areas on the heels of an extended hot and dry period that followed an anomalous wetwinter The sequencing of climatological and meteorological conditions for these fire events mirrorsother notable fires of record in California [254] and other portions of the world [55] This highlightsthe important roles that both climate variability and meteorological factors have on extreme fires interms of preconditioning fuel abundance flammability and driving fire spread Rare conditions wereseen across a spectrum of timescales coinciding with these two fire events From a meteorologicalperspective we found that stations near the North Bay fires experienced their most acute fire weatherconditions (as viewed through FFWI and combinations of wind speed RH FM10 and FFWI) in overtwo decades of observations (Table 3) Southern California experienced its longest duration SantaAna wind event in at least 70 years and daily records for atmospheric dryness which led to chronicperiods of fire danger (Figures 5 and 6 Table 4) Common to both events was the occurrence of strongwinds that have been shown to be a key determinant in large human-caused wildfires [56] The mostsevere multi-annual drought (2012ndash2016) in California in the observational record preceded well abovenormal to record setting precipitation in the wet season prior to the fires with some areas recordingtheir wettest OctoberndashApril in 120 years During both fires 100-h dead fuel moistures were below the3rd percentile including the lowest values in the observational record (1979ndash2017) with the ThomasFire (Figures 5 and 6) Such conditions were facilitated by exceptionally warm temperatures in themonths preceding the fires and the driest MarchndashDecember since 1895 in southern California We donot attempt to quantify the relative roles of these climatic extremes on the extent or rate of spread ofthese extreme wildfire events Additional analyses may help elucidate the complementary role thatfuel conditions played in these wind-driven conflagrations
The nexus of climate weather fuels and terrain drive large wildfire occurrence [57ndash59] andthese factors all contributed to the North Bay and southern California fire events Foehn windshave been extensively studied with regard to fire weather (eg [160]) and are a recognized criticalfire weather pattern [5] that are often referred to in NWS fire weather forecasts However thequestion remains as to whether the risk posed by extreme foehn wind-driven fires is well quantified
Fire 2018 1 18 14 of 17
given recent high-impact foehn wind-driven fire events in California Chile and Gatlinburg Wedemonstrate that novel conditions in the observational record occurred during both fire eventsHowever emergency management and city planners must prepare (eg Firewise USA) and considerplanning for extreme fire events beyond those observed or modeled using 90th or 99th percentileobserved meteorological conditions
Beyond limitations posed by the observational record changes in the fire environment have andare continuing to occur that may further affect fire risk For example the continued expansion of WUIinto geographic areas where fuels terrain and foehn wind events occur may very well incur additionalrisk for fire impacts Changes in climate have and will continue to alter certain properties of the fireenvironment including increasing fuel aridity [1561] and fewer days with precipitation [62] therebyincreasing the frequency of certain ingredients for such fires It is not currently well resolved howclimate change will affect the occurrence or intensity of foehn wind events [6364] These fires likemany others than occur with foehn winds in California were anthropogenically ignited Efforts andpolicies to reduce powerline-caused ignitions coincident with forecasted wind events may be exploredsuch as re-routing or cutting off power in areas of prone to high winds and burying powerlines inregions particularly prone to downslope windstorms Further research into the environmental andsocietal factors of foehn wind-driven fire disasters in the WUI including events that have occurred insimilar locations (eg Tubbs and Hanley Fires) would help provide better insight on why these eventscontinue to transpire
NWS forecasts for these events were accurate and provided lead time to the public and emergencypersonnel but the hazards still materialized leading to 46 deaths and thousands of homes destroyedwith costs exceeding $10 billion Red Flag Warnings were initially intended for fire and emergencymanagement personnel and that is still the official NWS directive [36] However over time Red FlagWarnings have been used more to alert the public about dangerous fire weather conditions Effortsare underway in the NWS to better understand the messaging of Red Flag Warnings to the publicand evaluate the Red Flag Warning program The NWS should continue improving its fire weatherprogram and decision support services to better communicate the risks and impacts associated withits forecasts
Other preparative or reactionary measures could have helped reduce some of the impacts thesefires had on losses including reverse evacuation calls [65] improved public communication [6566] andbetter zoning and building codes to withstand spotting embers [67] Most of the deaths and structuresdestroyed from these two events occurred in the North Bay demonstrating the devastating effects oflarge fast-moving wildfires moving into urban areas Given the recent catastrophic wildfires globally(eg Fort McMurray Portugal Gatlinburg Chile) co-existing with wildfires and mitigating theireffects are of paramount importance [68] Improving weather and fuels forecasts and the messagingand communication of those forecasts would help mitigate some of the effects of wildfires in theWUI However while technological solutions are helpful fire-related disasters are an amalgamation ofsocietal political and economic problems that require a collective set of solutions
Supplementary Materials The following are available online at httpwwwmdpicom2571-62551118s1Chronology of Santa Ana Wind dates from Abatzoglou et al 2013
Author Contributions NJN and JTA designed research NJN JTA and PTM synthesized analyzed dataandor developed figures and NJN and JTA wrote the paper
Acknowledgments The authors would like to thank Benjamin J Hatchett for his help on revising the figuresJTA was partially supported by the National Science Foundation under award DMS-1520873
Conflicts of Interest The authors declare no conflicts of interest
References
1 Keeley JE Fotheringham CJ Moritz MA Lessons from the october 2003 Wildfires in Southern CaliforniaJ For 2004 102 26ndash31 [CrossRef]
Fire 2018 1 18 15 of 17
2 Keeley JE Safford H Fotheringham CJ Franklin J Moritz M The 2007 southern California wildfiresLessons in complexity J For 2009 107 287ndash296
3 Jin Y Randerson JT Capps S Hall A Faivre N Goulden ML Contrasting controls on wildland firesin Southern California during periods with and without Santa Ana events J Geophys Res Biogeosci 2014119 432ndash450 [CrossRef]
4 Moritz MA Moody TJ Krawchuk MA Hughes M Hall A Spatial variation in extreme winds predictslarge wildfire locations in chaparral ecosystems Geophys Res Lett 2010 37 L04801 [CrossRef]
5 Werth PA Potter BE Clements CB Finney M Goodrick SL Alexander ME Cruz MGForthofer JA McAllister SS Synthesis of Knowledge of Extreme Fire Behavior Volume I for Fire ManagersUnited States Department of Agriculture Portland OR USA 2011 Volume PNW-GTR-85
6 Abatzoglou JT Barbero R Nauslar NJ Diagnosing Santa Ana winds in Southern California withsynoptic-scale analysis Weather Forecast 2013 28 704ndash710 [CrossRef]
7 Syphard AD Radeloff VC Keuler NS Taylor RS Hawbaker TJ Stewart SI Clayton MK Predictingspatial patterns of fire on a southern California landscape Int J Wildl Fire 2008 17 602ndash613 [CrossRef]
8 Radeloff VC Hammer RB Stewart SI Fried JS Holcomb SS McKeefry JF The wildlandndashurbaninterface in the United States Ecol Appl 2005 15 799ndash805 [CrossRef]
9 Radeloff VC Helmers DP Kramer HA Mockrin MH Alexandre PM Bar-Massada A Butsic VHawbaker TJ Martinuzzi S Syphard AD et al Rapid growth of the US wildland-urban interface raiseswildfire risk Proc Natl Acad Sci USA 2018 [CrossRef] [PubMed]
10 Hammer RB Stewart SI Radeloff VC Demographic trends the wildlandndashurban interface and wildfiremanagement Soc Nat Resour 2009 22 777ndash782 [CrossRef]
11 Keeley JE Fotheringham CJ Historic fire regime in southern California shrublands Conserv Biol 200115 1536ndash1548 [CrossRef]
12 Moritz MA Spatiotemporal analysis of controls of shrubland fire regimes Age dependency and fire hazardEcology 2003 84 351ndash361 [CrossRef]
13 United States Department of Agriculture Forest Service The Rising Cost of Wildfire Operations Effects onthe Forest Servicersquos Non-Fire Work 2015 Available online httpswwwfsfedussitesdefaultfiles2015-Fire-Budget-Reportpdf (accessed on 25 May 2018)
14 Dennison P Brewer S Arnold J Moritz M Large wildfire trends in the western United States 1984ndash2011Geophys Res Lett 2014 41 2928ndash2933 [CrossRef]
15 Abatzoglou JT Williams AP Impact of anthropogenic climate change on wildfire across western USforests Proc Natl Acad Sci USA 2016 113 11770ndash11775 [CrossRef] [PubMed]
16 Syphard AD Keeley JE Abatzoglou JT Trends and drivers of fire activity vary across California aridlandecosystems J Arid Environ 2017 144 110ndash122 [CrossRef]
17 Keeley JE Syphard AD Different historical firendashclimate patterns in California Int J Wildl Fire 2017 26253ndash268 [CrossRef]
18 Balch JK Bradley BA Abatzoglou JT Nagy RC Fusco EJ Mahood AL Human-started wildfiresexpand the fire niche across the United States Proc Natl Acad Sci USA 2017 114 2946ndash2951 [CrossRef][PubMed]
19 Syphard AD Keeley JE Pfaff AH Ferschweiler K Human presence diminishes the importance ofclimate in driving fire activity across the United States Proc Natl Acad Sci USA 2017 114 13750ndash13755[CrossRef] [PubMed]
20 Abatzoglou JT Kolden CA Relationships between climate and macroscale area burned in the westernUnited States Int J Wildl Fire 2013 22 1003ndash1020 [CrossRef]
21 Williams AP Gentine P Moritz MA Roberts D Abatzoglou JT Effect of reduced summer cloudshading on evaporative demand and wildfire in coastal southern California Geophys Res Lett 2018[CrossRef]
22 Pausas JG Ribeiro E The global firendashproductivity relationship Glob Ecol Biogeogr 2013 22 728ndash736[CrossRef]
23 McKenzie D Littell JS Climate change and the eco-hydrology of fire Will area burned increase in awarming western US Ecol Appl 2017 27 26ndash36 [CrossRef] [PubMed]
24 National Interagecy Fire Center Total Wildland Fires and Acres (1960ndash2017) National Interagecy Fire CenterBoise ID USA 2017
Fire 2018 1 18 16 of 17
25 Abatzoglou JT McEvoy DJ Redmond KT The West Wide Drought Tracker Drought Monitoring at FineSpatial Scales Bull Am Meteorol Soc 2017 98 1815ndash1820 [CrossRef]
26 Balch JK Schoennagel T Williams AP Abatzoglou JT Cattau M Mietkiewicz N St Denis LSwitching on the big burn of 2017 Fire 2018 1 [CrossRef]
27 Tedim F Leone V Amraoui M Bouillon C Coughlan RM Delogu MG Fernandes MP Ferreira CMcCaffrey S McGee KT et al Defining Extreme Wildfire Events Difficulties Challenges and ImpactsFire 2018 1 [CrossRef]
28 Homer C Dewitz J Yang L Jin S Danielson P Xian G Coulston J Herold N Wickham JMegown K Completion of the 2011 National Land Cover Database for the conterminous UnitedStatesndashRepresenting a decade of land cover change information Photogramm Eng Remote Sens 201581 345ndash354 [CrossRef]
29 National Interagecy Fire Center Remote Automated Weather Stations Available online httpsrawsnifcgov (accessed on 28 May 2018)
30 Western Regional Climate Center Bangor RAWS Available online httpswrccdrieducgi-binrawMAINplcaCBGR (accessed on 28 May 2018)
31 Daly C Halbleib M Smith JI Gibson WP Doggett MK Taylor GH Curtis J Pasteris PPPhysiographically sensitive mapping of climatological temperature and precipitation across theconterminous United States Int J Climatol 2008 28 2031ndash2064 [CrossRef]
32 Abatzoglou JT Development of gridded surface meteorological data for ecological applications andmodelling Int J Climatol 2013 33 121ndash131 [CrossRef]
33 CAL FIRE Incident Information Available online httpcdfdatafirecagovincidents (accessed on 24February 2018)
34 CAL FIRE Top 20 Deadliest California Wildfires Available online httpcalfirecagovcommunicationsdownloadsfact_sheetsTop20_Deadliestpdf (accessed on 24 February 2018)
35 CAL FIRE Top 20 Most Destructive California Wildfires Available online httpwwwfirecagovcommunicationsdownloadsfact_sheetsTop20_Destructionpdf (accessed on 24 February 2018)
36 National Weather Service National Weather Service Instruction 10-401 Fire Weather Services ProductSpecification Available online httpwwwnwsnoaagovdirectivessympd01004001currpdf (accessedon 28 May 2018)
37 National Interagecy Coordination Center Incident Management Situation Report Archives National InteragencyCoordination Center Boise ID USA 2018 Available online httpswwwpredictiveservicesnifcgovintelligencearchivehtm (accessed on 24 May 2018)
38 Kasler D Wine country wildfires costs now top $9 billion costliest in Californiarsquos history The Sacramento Bee 201739 Watkins D Griggs T Lee JC Park Haeyoun SA Wallace T Ward T How Californiarsquos Most Destructive
Wildfire Spread Hour by Hour Available online httpswwwnytimescominteractive20171021uscalifornia-fire-damage-maphtml (accessed on 21 February 2018)
40 Oakley NS Lancaster JT Kaplan ML Ralph FM Synoptic conditions associated with cool seasonpost-fire debris flows in the Transverse Ranges of southern California Nat Hazards 2017 88 327ndash354[CrossRef]
41 Livingston M Grad S Californiarsquos Largest on Record Finally 100 Contained Available onlinehttpwwwlatimescomlocallanowla-me-thomas-fire-contained-20180112-storyhtml (accessed on 21February 2018)
42 Clark TL Farley RD Severe downslope windstorm calculations in two and three spatial dimensionsusing anelastic interactive grid nesting A possible mechanism for gustiness J Atmos Sci 1984 41 329ndash350[CrossRef]
43 Smith RB On severe downslope winds J Atmos Sci 1985 42 2597ndash2603 [CrossRef]44 CANSAC CANSAC Model Output Available online httpscansacdriedu (accessed on 10 February 2018)45 Hatchett BJ Smith CM Nauslar NJ Kaplan ML Brief Communication Synoptic-scale differences
between Sundowner and Santa Ana wind regimes in the Santa Ynez Mountains California Nat HazardsEarth Syst Sci 2018 18 419 [CrossRef]
46 Blier W The sundowner winds of Santa Barbara California Weather Forecast 1998 13 702ndash716 [CrossRef]47 Horel JD Dong X An evaluation of the distribution of Remote Automated Weather Stations (RAWS)
J Appl Meteorol Climatol 2010 49 1563ndash1578 [CrossRef]
Fire 2018 1 18 17 of 17
48 Dettinger MD Ralph FM Das T Neiman PJ Cayan DR Atmospheric rivers floods and the waterresources of California Water 2011 3 445ndash478 [CrossRef]
49 Griffin D Anchukaitis KJ How unusual is the 2012ndash2014 California drought Geophys Res Lett 2014 419017ndash9023 [CrossRef]
50 Williams AP Seager R Abatzoglou JT Cook BI Smerdon JE Cook ER Contribution ofanthropogenic warming to California drought during 2012ndash2014 Geophys Res Lett 2015 42 6819ndash6828[CrossRef]
51 Asner GP Brodrick PG Anderson CB Vaughn N Knapp DE Martin RE Progressive forest canopywater loss during the 2012ndash2015 California drought Proc Natl Acad Sci USA 2016 113 E249ndashE255[CrossRef] [PubMed]
52 Littell JS McKenzie D Peterson DL Westerling AL Climate and wildfire area burned in western USecoprovinces 1916ndash2003 Ecol Appl 2009 19 1003ndash1021 [CrossRef] [PubMed]
53 Littell JS Peterson DL Riley KL Liu Y Luce CH A review of the relationships between drought andforest fire in the United States Glob Chang Biol 2016 22 2352ndash2369 [CrossRef] [PubMed]
54 Westerling AL Cayan DRD Brown TTJ Hall BL Riddle LG Climate Santa Ana winds and autumnwildfires in southern California Eos Trans Am Geophys Union 2004 85 289ndash296 [CrossRef]
55 Cruz MG Sullivan AL Gould JS Sims NC Bannister AJ Hollis JJ Hurley RJ Anatomy of acatastrophic wildfire The Black Saturday Kilmore East fire in Victoria Australia For Ecol Manag 2012 284269ndash285 [CrossRef]
56 Abatzoglou JT Balch JK Bradley BA Kolden CA Human-related ignitions concurrent with highwinds promote large wildfires across the USA Int J Wildl Fire 2018 [CrossRef]
57 Bessie WC Johnson EA The relative importance of fuels and weather on fire behavior in subalpine forestsEcology 1995 76 747ndash762 [CrossRef]
58 Bowman DMJS Williamson GJ Abatzoglou JT Kolden CA Cochrane MA Smith AMS Humanexposure and sensitivity to globally extreme wildfire events Nat Ecol Evol 2017 1 58 [CrossRef] [PubMed]
59 Parisien M-A Moritz MA Environmental controls on the distribution of wildfire at multiple spatial scalesEcol Monogr 2009 79 127ndash154 [CrossRef]
60 Sharples JJ Mills GA McRae RHD Weber RO Foehn-like winds and elevated fire danger conditionsin southeastern Australia J Appl Meteorol Climatol 2010 49 1067ndash1095 [CrossRef]
61 Westerling A Bryant B Preisler H Climate change and growth scenarios for California wildfireClim Chang 2011 [CrossRef]
62 Polade SD Pierce DW Cayan DR Gershunov A Dettinger MD The key role of dry days in changingregional climate and precipitation regimes Sci Rep 2014 4 4364 [CrossRef] [PubMed]
63 Hughes M Hall A Kim J Human-induced changes in wind temperature and relative humidity duringSanta Ana events Clim Chang 2011 109 119ndash132 [CrossRef]
64 Miller NL Schlegel NJ Climate change projected fire weather sensitivity California Santa Ana windoccurrence Geophys Res Lett 2006 33 [CrossRef]
65 Velez A-LK Diaz JM Wall TU Public information seeking place-based risk messaging and wildfirepreparedness in southern California Int J Wildl Fire 2017 26 469ndash477 [CrossRef]
66 Stephens SL Adams MA Handmer J Kearns FR Leicester B Leonard J Moritz MAUrbanndashwildland fires How California and other regions of the US can learn from Australia Environ Res Lett2009 4 14010 [CrossRef]
67 Quarles SL Valachovic Y Nakamura GM Nader GA de Lasaux MJ Home Survival in Wildfire-ProneAreas Building Materials and Design Considerations ANR Publication 8393 ANR Publication 8393 Universityof California Agriculture and Natural Resources Richmond CA USA 2010 Available online httpsescholarshiporgucitem4vt8w5qk (accessed on 24 February 2018)
68 Smith AMS Kolden CA Paveglio TB Cochrane MA Bowman DMJS Moritz MA Kliskey ADAlessa L Hudak AT Hoffman CM et al The Science of Firescapes Achieving Fire-ResilientCommunities Bioscience 2016 66 130ndash146 [CrossRef] [PubMed]
copy 2018 by the authors Licensee MDPI Basel Switzerland This article is an open accessarticle distributed under the terms and conditions of the Creative Commons Attribution(CC BY) license (httpcreativecommonsorglicensesby40)
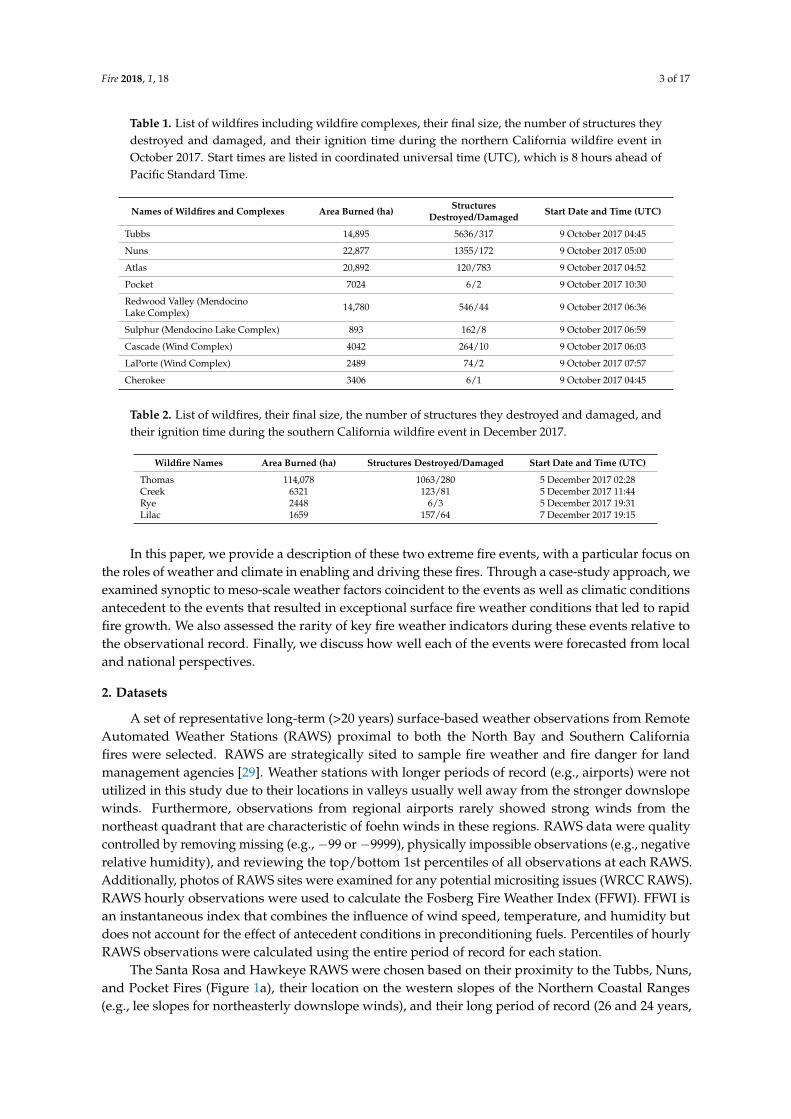