Embed Size (px)
Citation preview

The 2016 NAMM Global Report
This copy belongs to Chris Parks

A MESSAGE FROM THE CHAIR AND PRESIDENT/CEOThis year’s member survey results show us that information and statistics, as well as education and training, continue to be top reasons for belonging to the association. NAMM is committed to providing you with the latest industry information, so you can make the best decisions for your business.
Any doubts about the global nature of the music and sound products business have long since been erased, and with more than 120 countries now attending The NAMM Show, a global perspective of our industry is an ever-increasing need.
This year’s Global Report captures a snapshot of 24 countries, our largest narrative to date. This comprehensive report will help you discern industry trends and spot new opportunities that could very well prove to be critical as you shape the vision for your company and make important decisions in the coming year.
On behalf of the NAMM Board of Directors and staff, we appreciate your continued support and membership. NAMM remains dedicated to your growth, and we sincerely hope you will find the 2016 NAMM Global Report useful to your business.
Sincerely,
Mark Goff, Chair Joe Lamond, President/CEO
2This copy belongs to Chris Parks

CONTENTSMessage from the Chair and President/CEO 2Understanding the U.S. Data 4U.S. Snapshot 5U.S. Industry Revenue at a Glance 7Music Industry Analysis 9
U.S. RETAIL SALESFretted Products and Effects Market 10Piano and Organ Market 14School Music Market 18Pro Audio Market 20Percussion Market 23DJ Market 26Recording and Computer Music Market 28Electronic Music Market 32Print Music Market 34Portable Keyboard Market 35Karaoke Market 36General Accessory Market 37
U.S. INDUSTRY SUMMARY & IMPORTS AND EXPORTSIndustry Summary 38Import and Export Data 46
INTERNATIONAL DATAUnderstanding the International Data 54Argentina 55Australia 62Austria 73Brazil 80Canada 88China 100Czech Republic 111Finland 118France 124Germany 131Hungary 142India 151Italy 160Japan 174Mexico 188Netherlands 196Norway 203Russia 209South Korea 216Spain 222Sweden 232Switzerland 239United Kingdom 245
NAMM EXECUTIVE COMMITTEE 253& BOARD OF DIRECTORS
ACKNOWLEDGEMENTS 254
MANAGING EDITORS Causby Challacombe
Erin Block
INTERNATIONAL AFFAIRSBetty Heywood
SR. RESEARCH ANALYSTErin Block
LAYOUT/DESIGNMatt StenbergMegan Nelson
COPY EDITORSDeborah BradaLaurie Gibson
This copy belongs to Chris Parks

METHODOLOGYThe NAMM Global Report is a collection of information gathered from many sources, agencies and associations around the world. NAMM does not verify any of the information and cannot and does not guarantee the accuracy of the data.
The statistics NAMM receives are summaries; NAMM personnel do not see or manipulate any individual company information. Sources for each piece of data are listed at the beginning of each section and can be summarized as follows:
U.S. domestic sales information and commentary is provided by The Music Trades magazine, and import and export numbers are collected by the U.S. Census Bureau.
Sales information and commentaries in the International section are provided by associations in each country. International economic, demographic and trade data are gathered from the CIA World Factbook, and the International music industry numbers are provided by The Music Trades magazine.
UNDERSTANDING THE U.S. DATAThe unit sales and retail values in this report were compiled by the staff of The Music Trades magazine, which provides the following overview of the methodology used.
How do you get sales data in an industry where most business is done by privately held companies, and there are few, if any, reporting sources? The answer is, you spend a lot of time digging. The data in these pages comes from a variety of sources— U.S. Department of Commerce, industry associations, corporate financial records, and various government agencies in Europe and Asia. The result is a snapshot of the volume of product that moves through the specialized channel of approximately 5,000 MI retailers in the United States.
Data in these pages reflects wholesale shipments to retailers. Retail value is arrived at by applying an average retail markup to the value of wholesale shipments. The markup is based on the results of a national survey of several hundred retailers.
Please note that data on the following pages does not include any figures on the used instrument market, which is extremely substantial but difficult to measure with any accuracy.
4This copy belongs to Chris Parks

Demographics
65+14.9%
0–1419.0%
15–64 66.1%
Economy
GDP-Industry20.8%
GDP-Agriculture1.6%
GDP-Service77.6%
Population in millions 321.4
Median Age 37.8Population Growth 0.78%
02468
101214161820
'15'14'13'12'11'10'09'08'07'06'05'04
United States GDP (PPP)(U.S. $ in trillions)
0123456789
10
'15'14'13'12'11'10'09'08'07'06'05'04
Unemployment Rate(Percent)
-1
0
1
2
3
4
'15'14'13'12'11'10'09'08'07'06'05'04
In�ation (Annual Percent Rate)
UNITED STATES SNAPSHOT
Demographics
Economy
Data Source: Demographics, Economy and Trade from CIA World Factbook, Music Industry from The Music Trades. GDP (PPP): Gross Domestic Product based on purchasing-power-parity (PPP) valuation of country GDP in U.S. dollars.
Age Male Female
0–14 31.17 29.85
15–64 106.04 106.48
65 & Over 21.13 26.70
GDP (PPP) $17.97 trillion
GDP Per Capita $56,300
GDP-Real Growth Rate 2.60%
Unemployment Rate 5.20%
Inflation 0.20%
United States SnapshotMusic USA
5This copy belongs to Chris Parks

0
4
8
12
16
20
JapanChinaMexicoCanada
Export Partners (2015)
Ann
ual P
erce
ntag
e
0
4
8
12
16
20
GermanyJapanMexicoCanadaChina
Import Partners (2015)
Ann
ual P
erce
ntag
e
Music Sales Per Capita(U.S. $)
0
5
10
15
20
25
30
'15'14'13'12'11'10'09'08'07'06
0
10
20
30
40
50
60
'15'14'13'12'11'10'09'08'07'06
Share of Global Music Market(Percent)
United States Music Market(U.S. $ in billions)
0
1
2
3
4
5
6
7
8
9
'15'14'13'12'11'10'09'08'07'06
Trade
Total Export $1.6 trillion Export as % of GDP 8.90%
Total Import $2.4 trillion Import as % of GDP 13.08%
Music Market $7.1 billion
Sales Per Capita $22.06
Global Share 42.00%
Music Industry
6This copy belongs to Chris Parks

U.S. INDUSTRY REVENUE AT A GLANCE
Product Sales Totals(Retail 2014–2015)
0 300 600 900 1200 1500
Rhythm Machines
Home Organs
Karaoke Products
Institutional Organs
Electronic Player Pianos
Other Electronic Products
Stringed Instruments
Keyboard Synthesizers
E�ects
DJ Gear
Portable Keyboards
Instrument Ampli�ers
Multi-Track Recorders
Cables
Digital Pianos
Acoustic Pianos
Computer Music Products
Percussion
Printed Music
Microphones
General Accessories
Wind Instruments
Pro Audio
Fretted Products
$141.07
$124.08
$104.34
$107.90
$103.47
$72.01$66.90
$123.99
$104.91
$16.50$15.12
$29.70$28.20
$9.30
$8.96
$13.30$13.34
$186.62
$145.22
$186.00
$155.50
$174.95
$162.00
$135.56$130.36
$165.00
$163.96
$178.80
$167.00
$304.40
$283.85
$165.01
$338.00$359.90
$376.71$381.33
$505.46$513.15
$549.00$532.00
$567.23$542.48
$551.36$535.28
$837.44$817.89
$1,475.25$1,449.93
2014 2015
(in millions of dollars)
7
Music USA
This copy belongs to Chris Parks

U.S. INDUSTRY REVENUE AT A GLANCE
-20% -15% -10% -5% 0% 5% 10% 15% 20%
Portable Keyboards
Instrument Ampli�ers
Acoustic Pianos
Multi-Track Recorders
Computer Music Products
Printed Music
Cables
Home Organs
Percussion
Other Electronic Products
Fretted Products
Pro Audio
DJ Gear
General Accessories
Microphones
Rhythm Machines
E�ects
Wind Instruments
Institutional Organs
Electronic Player Pianos
Digital Pianos
Karaoke Products
Stringed Instruments
Keyboard Synthesizers
2015 Industry Sales Gains and Declines
18.92%
14.91%
9.13%
7.65%
8.36%
5.32%
4.56%
3.99%
3.81%
3.20%
3.00%
2.95%
2.39%
1.75%
1.39%
1.23%
-0.30%
-1.20%
-1.50%
-6.09%
-6.28%
-6.75%
-12.90%
-16.68%
8This copy belongs to Chris Parks

INTRODUCTION2015 Music Industry Analysis
2015 Music Industry CensusTepid Industry Revenue Gains Mirror the U.S. Economy
Consumer caution, a growing used market and price deflation weighed on U.S. industry growth in 2015. The uptick in sales was due in large part to a strong school music market and vibrant demand for audio gear.
The retail value of the U.S. music products industry was effectively flat, edging up a negligible 0.8% in 2015. The sales gain lagged the growth rate of the U.S. economy, officially pegged at 2.1%. However, if there’s any truth to the dire economic pronouncements from presidential candidates of both parties, it’s surprising the industry advanced at all. The disparate collection of products that make up what we call the music products industry benefitted from modest improvements in employment levels and consumer confidence, as well as plummeting prices of petroleum products—estimated to save every U.S. household $1,100. However, these positives were offset by decreasing retail selling prices in many product categories. Tracking trends in the consumer electronics industry, the average selling prices of technology-based music products ranging from keyboards to recording systems have gone south. At the same time, improved production techniques and excess global manufacturing capacity have held pricing on traditional products—guitars, wind instruments, percussion—to well below the inflation rate. This pricing trend has benefitted consumers by delivering unprecedented product value. For those whose livelihood depends on making and selling music and audio gear, however, it has been an ongoing challenge.
Other than across-the-board pricing pressures and a shared distribution network, there’s little else the product categories tracked in this report have in common. A company manufacturing drum kits and one writing computer programs for a DJ are about as unrelated as enterprises offering athletic shoes and home appliances. That’s why it’s more useful to refer to this collection of market segments as the “music products industries,” with special emphasis on the plural. The “industries” could be compared to a bank of elevators. Aggregate revenues, like the bank of elevators, are fairly static. However, as with the elevator cars, individual product segments are constantly moving up and down. The wide variations in growth rates
underscore just how unrelated the different product segments are. On that score, 2015 was pretty much like every other year—some product segments did well, others didn’t.
There’s a different story behind the performance of every category in this report. Electronic music products posted a robust 9.9% gain, driven in large part by a renewed enthusiasm for analog synthesizers. Ironically, these are the same products that were abruptly discarded in the early 1980s as “hopelessly obsolete.” Despite regularly appearing stories about “drastic budget cutbacks,” school music also had a good year in 2015, with dollar value advancing 6.3%. Pro audio revenues advanced 2.3%, reflecting the ongoing need to upgrade and replace sound systems. And general accessories, a catch-all category that includes straps, cases, stands, tuners and numerous other small goods, continued its nearly unbroken upward trend, advancing 3.0%. The retail value of recording gear declined 6.1%, reflecting the fact that improved technology has made the key software and hardware components less expensive. Portable keyboards experienced an even more precipitous decline, with retail value off 16.7%. The remaining product categories tracked in this report were essentially flat.
The music products industry may not be growing, but like other industries, including craft beer and entertainment, it is becoming increasingly fragmented. Within each product category, there are more product variations and more price points with each passing year. Perhaps it’s because manufacturers see additional models as a way to gain market share or incremental sales growth. Maybe it’s driven by consumer demand. Whatever the case, the industry’s $7.09 billion in revenue is divided up among a larger number of individual products.
Historically, new technology has been the biggest driver of industry growth. The electric guitar in the 1950s, the first synthesizers in the 1960s, digital technology in the 1980s, and more recently, software technology, all spurred sales by expanding musicians’ creative horizons. Unfortunately, innovations like these don’t arrive on a predictable schedule, nor can they be conjured at will. The industry’s current slow growth is a reflection of the absence of major product innovation. In the absence of a groundbreaking
Music USA
9This copy belongs to Chris Parks

product that brings new capabilities, we suspect that industry growth will continue to be limited.
Fretted Products and EffectsIncludes acoustic guitars, electric guitars, basses, ukuleles, amplifiers, strings and guitar-related effects.
Despite breathtaking advances in digital technology, traditional fretted instruments retain a deep-seated appeal. Fretted instruments and related products remain the industry’s largest category, generating $1.77 billion in retail revenues, or approximately 25% of total industry revenues. During 2015, revenues for fretted instruments alone advanced 0.8%. The modest uptick masked widely disparate results among different product groups.
Sales of acoustic guitars declined 3.2% in units, but advanced 2.6% in dollar value, while electric guitars posted an 11.2% drop in unit volume and a 1.7% decline in retail value. For most of the 25 years we have been compiling sales data, on a unit basis, the guitar market split evenly between acoustics and electrics.
Starting a decade ago, acoustic guitar sales began outstripping electrics. The trend continued in 2015, with acoustics representing 59% of total guitar units. Searching for an explanation for this trend, retailers and manufacturers point to an influx of women into the market (who prefer acoustics); the dearth of electric guitar-driven rock ’n roll in popular music; and the decrease in live music venues (acoustics are better suited for playing at home). Regardless of the explanation, the trend seems destined to continue.
While the sales lines of acoustics and electrics are diverging, both product categories saw an increase in average selling price. The increase is not the result of rising instrument prices, but rather a shift in product preference. Sales of entry-level guitars are trending down, while sales of high-end “trophy” instruments are on the rise. The trend is something of a mixed blessing. Higher-priced instruments produce higher margins throughout the distribution chain. But the decline in entry-level products causes some to worry that the industry is not attracting a new generation of players. Of additional concern: first-time buyers are generally impervious to economic conditions. By contrast, purchasers of high-end guitars, generally buyers who are adding to their collection, tend to pull back when the economy slows.
0
1
2
3
4
5
6
7
8
'15'14'13'12'11'10'09'08'07'06'05'04
Industry Total
Reta
il Va
lue
in $
bill
ions
2014–15 0.79% 10-Year 5.71%
10This copy belongs to Chris Parks

0
100
200
300
400
500
600
700
'15'14'13'12'11'10'09'08'07'06
Electric Guitars
Reta
il Va
lue
in $
mill
ions
Uni
ts x
1,0
00,0
00
Retail Value Units
0.0
0.4
0.8
1.2
1.6
2.0
'15'13'12'11'10'09'08'07'06'05
Electric Guitars category includes electric basses.
2015 Summary10-Year Trend
Retail Unit Average Price
-11.62% -33.04% 32.00%-1.67% -11.24% 10.78%
0
100
200
300
400
500
600
700
'15'14'13'12'11'10'09'08'07'06
Acoustic Guitars
0.0
0.4
0.8
1.2
1.6
2.0
'15'14'13'12'11'10'09'08'07'06
Reta
il Va
lue
in $
mill
ions
Uni
ts x
1,0
00,0
00
Retail Value Units
Acoustic Guitars category includes banjos, mandolins andother acoustic fretted instruments, excluding ukuleles.
2015 Summary10-Year Trend
Retail Unit Average Price
26.91% -2.70% 30.43%2.60% -3.25% 6.05%
Retail Value Market Share
FrettedInstrument
Strings 10.8%
Instrument Ampli�ers
9.1%
Acoustic Guitars39.3%
ElectricGuitars28.1%
Ukuleles5.1% E�ects
7.6%
The star performer in the fretted instrument market was the ukulele, which posted an 18.5% increase in unit volume and a 21.8% increase in retail value. There have been three or four “ukulele booms” since the instrument first made it to U.S. shores following the 1915 Pan Pacific Exhibition in San Francisco, each lasting only a few years. The durability of the current “boom” is unprecedented, and suggests that the uke has transcended fad status.
Electric guitar sales drive a host of other product categories, notably amplifiers and effects. The downward trend in electrics adversely affected amplifier sales. However, amps are also challenged by new technology. At the high-end, some performers are bypassing a discrete amp for a digital amp simulator that allows them to play directly through a p.a. system. Entry-level buyers are also using simulators to record. The decline in average selling prices also reflects the shift away from stacks to smaller combo units. Sluggish electric guitar sales are also reflected in flat guitar string sales, as electric guitarists go through strings more frequently than their acoustic-playing counterparts.
Sales of effects pedals remain the other bright spot in the fretted instrument market. Guitarists have shown a nearly insatiable demand for pedals and other effects that shape their tone. Retail dollar value of effects pedals advanced 10.4% in 2015.
Music USA
11This copy belongs to Chris Parks

0
50
100
150
200
250
300
350
400
'15'14'13'12'11'10'09'08'07'06
Instrument Ampli�ers
Reta
il Va
lue
in $
mill
ions
Retail Value Units
0.0
0.2
0.4
0.6
0.8
1.0
1.2
'15'14'13'12'11'10'09'08'07'06
Uni
ts x
1,0
00,0
00
2015 Summary10-Year Trend
Retail Unit Average Price
-55.04% -34.07% -31.82%-12.90% -7.10% -6.24%
Instrument Ampli�ers category includes tube, digital andsolid-state ampli�ers; ampli�er heads; speaker enclosures;and other self-contained ampli�ers for guitars, basses andother musical instruments.
0
20
40
60
80
100
'15'14'13'12'11'10'09
Ukuleles
Reta
il Va
lue
in $
mill
ions
Retail Value Units
0.0
0.2
0.4
0.6
0.8
1.0
1.2
1.4
'15'14'13'12'11'10'09
Uni
ts x
1,0
00,0
00
2015 Summary7-Year Trend
Retail Unit Average Price
172.05% 138.92% 13.86%21.76% 18.51% 2.74%
Fretted Products and Effects, continued
0.0
0.2
0.4
0.6
0.8
1.0
1.2
'15'14'13'12'11'10'09'08'07'06
Total Guitars
Reta
il Va
lue
in $
bill
ions
Retail Value Units
0.0
0.5
1.0
1.5
2.0
2.5
3.0
3.5
'15'14'13'12'11'10'09'08'07'06
Uni
ts x
1,0
00,0
00
2015 Summary10-Year Trend
Retail Unit Average Price
7.40% -17.93% 30.85%0.77% -6.69% 8.00%
0
40
80
120
160
200
'15'14'13'12'11'10'09'08'07'06
Fretted Instrument Strings
Reta
il Va
lue
in $
mill
ions
Retail Value
2015 Summary10-Year Trend
Retail
14.20%0.05%
12This copy belongs to Chris Parks

0.0
0.2
0.4
0.6
0.8
1.0
1.2
1.4
1.6
1.8
'15'14'13'12'11'10'09'08'07'06
Total Fretted Instruments
Reta
il Va
lue
in $
bill
ions
Retail Value
2015 Summary10-Year Trend
Retail
-0.15%0.08%
0
10
20
30
40
50
60
70
80
90
'15'14'13'12'11'10'09'08'07'06
E�ects Pedals
0.0
0.2
0.4
0.6
0.8
1.0
1.2
1.4
'06'05'04'03'02'01'00'99'98'97
Reta
il Va
lue
in $
mill
ions
Uni
ts x
1,0
00,0
00
Retail Value Units
0.0
0.2
0.4
0.6
0.8
1.0
1.2
1.4
'15'14'13'12'11'10'09'08'07'06
2015 Summary10-Year Trend
Retail Unit Average Price
56.36% 12.93% 38.46%10.38% 5.78% 4.35%
E�ects Pedals category includes �oor pedal units, tabletop units and other products that incorporate complex processing power.
0
10
20
30
40
50
60
70
80
'15'14'13'12'11'10'09'08'07'06
Multi-E�ects Floor Processors
0
50
100
150
200
250
300
350
'04'03'02'01'00'99'98'97
Reta
il Va
lue
in $
mill
ions
Uni
ts x
1,0
00
Retail Value Units
0
50
100
150
200
250
300
350
'15'14'13'12'11'10'09'08'07'06
2015 Summary10-Year Trend
Retail Unit Average Price
-26.86% -44.82% 32.56%-5.42% -7.41% 2.15%
Music USA
13This copy belongs to Chris Parks

The Piano and Organ MarketIncludes acoustic grand pianos, acoustic vertical pianos, electronic player pianos, digital pianos, and organs.
The data on the piano market offers both good and bad news. An 8.4% surge in the retail value of digital pianos for the home is a positive indicator of continued interest in keyboard music. However, the 6.7% decline in the retail value of traditional acoustic pianos underscores the industry’s challenges. It’s easy to understand the upward sales trend for digital pianos. They represent a tremendous value—average unit prices have actually declined over the past decade, they don’t require service, and thanks to MIDI and USB ports, they offer a host of entertainment and educational capabilities.
The downturn in acoustics is due in part to economic trends. There has always been a strong correlation between the stock market and grand piano sales—bull markets inspire the confidence that prompts consumers to spring for an expensive piano. Thus, the 10% decline in the Dow over the past 12 months unquestionably hurt sales. The industry also faces competition from an enormous pool of high-quality used instruments.
After two decades of decline, home organ sales stabilized in 2015. Unit volume dipped slightly, but was offset by a rise in average selling price. The challenges for the market remain, however. Although the organ industry’s prime demographic—those over 60—is expanding, aging baby boomers raised on rock and roll are less interested in the product. The number of retailers actively engaged in promoting home organs also continues to decline.
Higher average selling prices gave the institutional organ market a modest lift in 2015. However, declining attendance at mainline Protestant churches, a critical market, poses a long-term challenge, compounded by the use of more contemporary instrumentation in worship services.
0
20
40
60
80
100
120
140
160
'15'14'13'12'11'10'09'08'07'06
Total E�ects
0.0
0.2
0.4
0.6
0.8
1.0
1.2
1.4
1.6
'06'05'04'03'02'01'00'99'98'97
Reta
il Va
lue
in $
mill
ions
Uni
ts x
1,0
00,0
00
Retail Value Units
0.0
0.2
0.4
0.6
0.8
1.0
1.2
1.4
1.6
'15'14'13'12'11'10'09'08'07'06
2015 Summary10-Year Trend
Retail Unit Average Price
10.22% -0.43% 10.70%3.99% 3.88% 0.10%
0.0
0.2
0.4
0.6
0.8
1.0
1.2
1.4
1.6
1.8
'15'14'13'12'11'10'09'08'07'06
Total Fretted Products & E�ects
Reta
il Va
lue
in $
bill
ions
Retail Value
2015 Summary10-Year Trend
Retail
0.57%0.37%
Fretted Products and Effects, continued
14This copy belongs to Chris Parks

0
100
200
300
400
500
'15'14'13'12'11'10'09'08'07'06
Total Acoustic Pianos
0
10
20
30
40
50
60
70
'04'03'02'01'00'99'98'97'96
Reta
il Va
lue
in $
mill
ions
Uni
ts x
1,0
00
Retail Value Units
0
10
20
30
40
50
60
70
'15'14'13'12'11'10'09'08'07'06
2015 Summary10-Year Trend
Retail Unit Average Price
-36.82% -55.04% 40.52%-6.75% -9.95% 3.55%
Pianos
0
50
100
150
200
250
300
350
'15'14'13'12'11'10'09'08'07'06
Grand Pianos
0
5
10
15
20
25
30
'05'04'03'02'01'00'99'98'97'96
Reta
il Va
lue
in $
mill
ions
Uni
ts x
1,0
00
Retail Value Units
0
5
10
15
20
25
30
'15'14'13'12'11'10'09'08'07'06
2015 Summary10-Year Trend
Retail Unit Average Price
-42.33% -61.93% 51.50%-4.97% -9.01% 4.44%
Retail Value Market Share
ElectronicPlayer Pianos
13.5%
Digital Pianos33.4%
Grand Pianos34.5%
Vertical Pianos18.6%
0
20
40
60
80
100
120
140
'15'14'13'12'11'10'09'08'07'06
Vertical Pianos
0
5
10
15
20
25
30
35
40
45
'04'03'02'01'00'99'98'97'96
Reta
il Va
lue
in $
mill
ions
Uni
ts x
1,0
00
Retail Value Units
0
5
10
15
20
25
30
35
40
45
'15'14'13'12'11'10'09'08'07'06
2015 Summary10-Year Trend
Retail Unit Average Price
-23.15% -50.38% 54.88%-9.89% -10.43% 0.60%
Music USA
15This copy belongs to Chris Parks

0
100
200
300
400
500
600
700
800
'15'14'13'12'11'10'09'08'07'06
Total Pianos
0
50
100
150
200
250
'06'05'04'03'02'01'00'99'98'97
Reta
il Va
lue
in $
mill
ions
Uni
ts x
1,0
00
Retail Value Units
0
50
100
150
200
250
'15'14'13'12'11'10'09'08'07'06
Total Pianos category includes grand pianos, vertical pianos, electronic player pianos and digital pianos.
2015 Summary10-Year Trend
Retail Unit Average Price
-26.32% -13.27% -15.05%-0.31% 1.53% -1.81%
0
20
40
60
80
100
120
140
'15'14'13'12'11'10'09'08'07'06
Electronic Player Pianos
0
2
4
6
8
10
12
'04'03'02'01'00'99'98'97'96
Reta
il Va
lue
in $
mill
ions
Uni
ts x
1,0
00
Retail Value Units
0
2
4
6
8
10
12
'15'14'13'12'11'10'09'08'07'06
2015 Summary10-Year Trend
Retail Unit Average Price
-45.72% -62.83% 46.03%7.64% -3.13% 11.12%
0
20
40
60
80
100
120
140
160
180
'15'14'13'12'11'10'09'08'07'06
Digital Pianos
0
30
60
90
120
150
'04'03'02'01'00'99'98'97'96
Reta
il Va
lue
in $
mill
ions
Uni
ts x
1,0
00
Retail Value Units
0
30
60
90
120
150
'15'14'13'12'11'10'09'08'07'06
2015 Summary10-Year Trend
Retail Unit Average Price
24.38% 13.07% 10.00%8.35% 4.50% 3.69%
The Piano and Organ Market, continued
16This copy belongs to Chris Parks

0
10
20
30
40
50
60
70
'15'14'13'12'11'10'09'08'07'06
Home Organs
0
1
2
3
4
5
6
7
8
'04'03'02'01'00'99'98'97'96
Reta
il Va
lue
in $
mill
ions
Uni
ts x
1,0
00
Retail Value Units
0
1
2
3
4
5
6
7
8
'15'14'13'12'11'10'09'08'07'06
2015 Summary10-Year Trend
Retail Unit Average Price
-80.44% -79.25% -5.75%-0.30% -0.69% 0.39%
0
10
20
30
40
50
60
70
'15'14'13'12'11'10'09'08'07'06
Institutional Organs
0.0
0.5
1.0
1.5
2.0
2.5
3.0
'04'03'02'01'00'99'98'97'96
Reta
il Va
lue
in $
mill
ions
Uni
ts x
1,0
00
Retail Value Units
0.0
0.5
1.0
1.5
2.0
2.5
3.0
'15'14'13'12'11'10'09'08'07'06
2015 Summary10-Year Trend
Retail Unit Average Price
-52.96% -68.64% 50.00%5.32% -4.26% 10.00%
Retail Value Market Share
InstitutionalOrgans69.1%
HomeOrgans30.9%
0
20
40
60
80
100
120
140
'15'14'13'12'11'10'09'08'07'06
Total Organs
0
2
4
6
8
10
'06'05'04'03'02'01'00'99'98'97
Reta
il Va
lue
in $
mill
ions
Uni
ts x
1,0
00
Retail Value Units
0
2
4
6
8
10
'15'14'13'12'11'10'09'08'07'06
2015 Summary10-Year Trend
Retail Unit Average Price
-67.21% -76.15% 37.45%3.51% -2.09% 5.73%
Organs
Music USA
17This copy belongs to Chris Parks

Retail Value Market Share
WoodwindInstruments
43.5%
Stringed Instruments
17.9%
Brass Instruments
38.6%
The School Music MarketIncludes woodwind instruments, brass instruments and stringed instruments.
There is an enormous gap between the perception and the reality of the school music market, which includes a range of wind and stringed instruments destined for use in public school music programs. Due to endless repetition by the media, there is a widespread belief that school music programs are rapidly heading toward extinction due to a combination of budget pressures and shifting curriculum priorities. The term “music program” has become linked to
“cutback.” The reality, as evidenced by the 6.3% increase in the retail value of instrument shipments, is very different. For over 60 years, instrument shipments have closely tracked total school enrollment levels, indicating that, dire rhetoric aside, school music programs are still prevalent nationwide. The 10.5% gain in brasswinds was due to improved finances at both the state and local levels—larger horns like tubas and euphoniums are typically purchased by schools. Also, brasswind sales have benefitted from strong participation in drum and bugle corps.
0
50
100
150
200
250
300
'15'14'13'12'11'10'09'08'07'06
Brass Instruments
0
50
100
150
200
250
300
'04'03'02'01'00'99'98'97'96'95
Reta
il Va
lue
in $
mill
ions
Uni
ts x
1,0
00
0
50
100
150
200
250
300
'15'14'13'12'11'10'09'08'07'06
Retail Value Units
2015 Summary10-Year Trend
Retail Unit Average Price
27.08% 19.03% 6.76%10.46% 9.13% 1.22%
18This copy belongs to Chris Parks

0
25
50
75
100
125
'15'14'13'12'11'10'09'08'07'06
Stringed Instruments
Reta
il Va
lue
in $
mill
ions
Uni
ts x
1,0
00
Retail Value Units
0
50
100
150
200
250
300
350
400
450
'15'14'13'12'11'10'09'08'07'06
2015 Summary10-Year Trend
Retail Unit Average Price
9.72% -7.61% 18.76%14.91% 13.86% 0.92%
0
100
200
300
400
500
600
700
'15'14'13'12'11'10'09'08'07'06
Total School Music
0
200
400
600
800
1000
1200
'04'03'02'01'00
Reta
il Va
lue
in $
mill
ions
Uni
ts x
1,0
00
Retail Value Units
0
200
400
600
800
1000
1200
'15'14'13'12'11'10'09'08'07'06
2015 Summary10-Year Trend
Retail Unit Average Price
15.47% -1.56% 17.31%6.28% 7.10% -0.76%
0
50
100
150
200
250
300
350
'15'14'13'12'11'10'09'08'07'06
Woodwind Instruments
0
50
100
150
200
250
300
350
400
450
'04'03'02'01'00'99'98'97'96'95
Reta
il Va
lue
in $
mill
ions
Uni
ts x
1,0
00
Retail Value Units
0
50
100
150
200
250
300
350
400
450
'15'14'13'12'11'10'09'08'07'06
2015 Summary10-Year Trend
Retail Unit Average Price
8.99% -7.21% 17.47%-0.17% -0.85% 0.69%
0
100
200
300
400
500
600
'15'14'13'12'11'10'09'08'07'06
Total Wind Instruments
0
100
200
300
400
500
600
700
'04'03'02'01'00
Reta
il Va
lue
in $
mill
ions
Uni
ts x
1,0
00
Retail Value Units
0100
200
300
400
500
600
700
'15'14'13'12'11'10'09'08'07'06
2015 Summary10-Year Trend
Retail Unit Average Price
16.81% 2.64% 13.81%4.56% 3.26% 1.26%
Total Wind Instruments category includes brass and woodwind instruments.
Music USA
19This copy belongs to Chris Parks

0
50
100
150
200
250
'15'14'13'12'11'10'09'08'07'06
Power Ampli�ers
0
100
200
300
400
500
600
'04'03'02'01'00'99'98'97'96
Reta
il Va
lue
in $
mill
ions
Uni
ts x
1,0
00
Retail Value Units
0
100
200
300
400
500
600
'15'14'13'12'11'10'09'08'07'06
2015 Summary10-Year Trend
Retail Unit Average Price
-42.17% -40.00% -3.61%-3.63% -4.83% 1.27%
Retail Value Market Share
Mixers14.5%
Speaker Enclosures
31.3%
Cables10.7%
Cabled Microphones
26.1%
Wireless Microphones
9.3%
Power Ampli�ers
8.1%
The Pro Audio MarketIncludes speaker enclosures, power amplifiers, mixers, cables and microphones.
The 2015 retail value of pro audio products advanced a modest 2.3% to $1.55 billion, compared with $1.52 billion in 2014. Demand for high-quality portable sound systems and installations in houses of worship, schools, corporate facilities and clubs remains strong. However, the category’s top-line growth doesn’t fully reflect the strength of the demand, due to product configuration changes.
The industry long ago realized that buyers of the small-to-mid-sized sound systems that are a staple of M.I. retailers have limited audio expertise and place a premium on ease of setup and use. To address these customers, manufacturers have increasingly turned to self-contained systems, specifically powered loudspeakers that incorporate a small digital mixer and onboard digital effects. These products have been a hit with buyers, as reflected in the 4.5% sales gain in loudspeakers. It’s also worth noting that loudspeakers are one of the few product categories tracked in this report that have surpassed pre-recession sales levels. However, growth in self-contained loudspeakers has adversely impacted the sale of discrete power amplifiers and small mixers. The power amp market declined 3.6% in retail value in 2015 to $126.0 million, continuing a decade-long downward trend. Audio mixers fared somewhat better. Units declined 7.7%, but retail dollar value edged up 1.5% to $225.4 million.
The cable market has also been adversely impacted by changing technologies, with readily affordable digital mixers and an increasing number of users wiring their systems with lightweight Ethernet or Firewire cables instead of the traditional heavy copper.
Microphones advanced 3.2% to a retail value of $549 million. With products ranging in price from $50 to $5,000 for a high-quality, large-diaphragm condenser mic, the microphone category includes both “disposable accessories” and big-ticket items. This diverse product
mix helps explain both its resilience and its persistent growth. The high-end mics used for recording are more economically sensitive, but more affordable live-sound mics that get lost, broken or worn out are necessities.
20This copy belongs to Chris Parks

0
100
200
300
400
500
'15'14'13'12'11'10'09'08'07'06
Speaker Enclosures
Reta
il Va
lue
in $
mill
ions
Retail Value
2015 Summary10-Year Trend
Retail4.52%
16.46%
0
20
40
60
80
100
120
140
160
180
'15'14'13'12'11'10'09'08'07'06
Cables
Reta
il Va
lue
in $
mill
ions
Retail Value
2015 Summary10-Year Trend
Retail-1.20%9.01%
0
50
100
150
200
250
'15'14'13'12'11'10'09'08'07'06
Mixers
0
100
200
300
400
500
600
'04'03'02'01'00'99'98'97'96
Reta
il Va
lue
in $
mill
ions
Uni
ts x
1,0
00
Retail Value Units
0
100
200
300
400500
600
'15'14'13'12'11'10'09'08'07'06
2015 Summary10-Year Trend
Retail Unit Average Price
-2.09% -18.74% 20.49%1.48% -7.75% 10.00%
Data represents an estimate of pro audio products sold by approximately 5,000 retailers in the U.S. Excluded from the data are sound products for the cinema, tour sound, broadcast, and large �xed-installation markets.
0
50
100
150
200
250
300
350
400
450
'15'14'13'12'11'10'09'08'07'06
Cabled Microphones
Reta
il Va
lue
in $
mill
ions
Retail Value
2015 Summary10-Year Trend
Retail2.53%
21.34%
Music USA
21This copy belongs to Chris Parks

0
20
40
60
80
100
120
140
160
'15'14'13'12'11'10'09'08'07'06
Wireless Microphones
Reta
il Va
lue
in $
mill
ions
Retail Value
Data represents estimates of only those microphones sold by the approximately 5,000 MI retailers in the United States, and excludes products aimed at broadcast markets.
2015 Summary10-Year Trend
Retail5.11%
15.32%
0.0
0.2
0.4
0.6
0.8
1.0
1.2
1.4
1.6
'15'14'13'12'11'10'09'08'07'06
Total Pro Audio
Reta
il Va
lue
in $
bill
ions
Retail Value
2015 Summary10-Year Trend
Retail2.28%5.15%
All data represents an estimate of pro audio products sold by the approximately 5,000 MI retailers in the United States. Excluded from data are sound products for the cinema, tour sound, broadcast and large �xed-installation markets. Data includes non-powered mixers, power ampli�ers, powered mixers, speaker enclosures, cable, cable microphones and wireless microphones.
0
100
200
300
400
500
600
'15'14'13'12'11'10'09'08'07'06
Total Microphones
Reta
il Va
lue
in $
mill
ions
Retail Value
2015 Summary10-Year Trend
Retail3.20%
19.70%
Pro Audio Products, continued
22This copy belongs to Chris Parks

0
20
40
60
80
100
120
140
160
180
'15'14'13'12'11'10'09'08'07'06
Drum Kits
0
50
100
150
200
250
300
'04'03'02'01'00'99'98'97'96
Reta
il Va
lue
in $
mill
ions
Uni
ts x
1,0
00
0
50
100
150
200
250
300
'15'14'13'12'11'10'09'08'07'06
Retail Value Units
2015 Summary10-Year Trend
Retail Unit Average Price
-43.59% -49.48% 11.65%5.44% -1.44% 6.98%
Retail Value Market Share
Educational Percussion
14.9%
Sticks & Mallets
12.0%
Individual Drums & Hardware
14.6%
Drum Heads9.3%
Cymbals14.4%
Hand Percussion
10.0%
Drum Kits24.8%
The Percussion MarketIncludes drum kits, educational percussion, individual drums and hardware, sticks and mallets, cymbals, heads, and hand percussion.
Sales of percussion products stabilized in 2015, edging up a modest 1.2% to an estimated retail value of $381.3 million. Percussion sales have been trending downward for the better part of a decade due to changing technologies. The increased use of drum tracks in popular music in place of real drummers has adversely affected the sale of drum kits, as well as all related products: sticks, heads, cymbals and hardware. In addition, the sale of electronic kits has eroded the unit volume of traditional drum kits. Beginners have opted for electronic kits because of their controllable volume (a big hit with parents) and facilitation of playing along with MP3 files. More advanced players choose them because they’re easier to record.
As of 2015, these trends seem to have run their course. Although drum kit units dipped a modest 1.4% to 137,000, average selling prices advanced, resulting in a 5.4% increase in retail value to $94.5 million. Sales of hardware, including pedals and stands, and individual drums also advanced, edging up 2% to a retail value of $55.8 million.
Educational percussion—marching drums, timpani and mallet instruments—were the best-performing segment in the category, increasing 5.5% to $56.9 million. The gains were driven in large part by improved state and local finances, as the vast majority of these products are purchased by schools.
The shift to electronic percussion continues to be felt in the accessory categories. Sales of sticks and heads each decreased around 2%. Players break fewer sticks on electronic drums, and there is no need to replace heads.
Music USA
23This copy belongs to Chris Parks

0
10
20
30
40
50
60
70
'15'14'13'12'11'10'09'08'07'06
Educational Percussion
Reta
il Va
lue
in $
mill
ions
Retail Value
Educational Percussion category includes timpani, marching percussion, mallet instruments, snare drum kits and orchestral percussion instruments.
2015 Summary10-Year Trend
Retail5.54%
-2.70%
0
10
20
30
40
50
60
70
80
90
'15'14'13'12'11'10'09'08'07'06
Cymbals
Reta
il Va
lue
in $
mill
ions
Retail Value
2015 Summary10-Year Trend
Retail-5.60%
-32.58%
0
10
20
30
40
50
60
70
80
'15'14'13'12'11'10'09'08'07'06
Individual Drums and Hardware
Reta
il Va
lue
in $
mill
ions
Retail Value
Individual Drums and Hardware category includes individual snare drums, tom-toms and bass drums for drum kits, along with pedals, stands, and related percussion hardware products.
2015 Summary10-Year Trend
Retail2.05%
-27.08%
0
10
20
30
40
50
60
'15'14'13'12'11'10'09'08'07'06
Sticks and Mallets
Reta
il Va
lue
in $
mill
ions
Retail Value
2015 Summary10-Year Trend
Retail-2.32%-6.16%
Percussion Products, continued
24This copy belongs to Chris Parks

0
10
20
30
40
50
'15'14'13'12'11'10'09'08'07'06
Drum Heads
Reta
il Va
lue
in $
mill
ions
Retail Value
2015 Summary10-Year Trend
Retail-1.99%
-19.32%
0
100
200
300
400
500
600
'15'14'13'12'11'10'09'08'07'06
Total Percussion
Reta
il Va
lue
in $
mill
ions
Retail Value
2015 Summary10-Year Trend
Retail1.23%
-26.56%
0
5
10
15
20
25
30
35
40
45
'15'14'13'12'11'10'09'08'07'06
Hand Percussion
Reta
il Va
lue
in $
mill
ions
Retail Value
2015 Summary10-Year Trend
Retail1.87%
-10.78%
Music USA
25This copy belongs to Chris Parks
0
5
10
15
20
25
30
35
'15'14'13'12'11'10'09'08'07'06
CD Players
0
10
20
30
40
50
60
70
'04'03'02'01'00'99'98'97
Reta
il Va
lue
in $
mill
ions
Uni
ts x
1,0
00
Retail Value Units
0
10
20
30
40
50
60
70
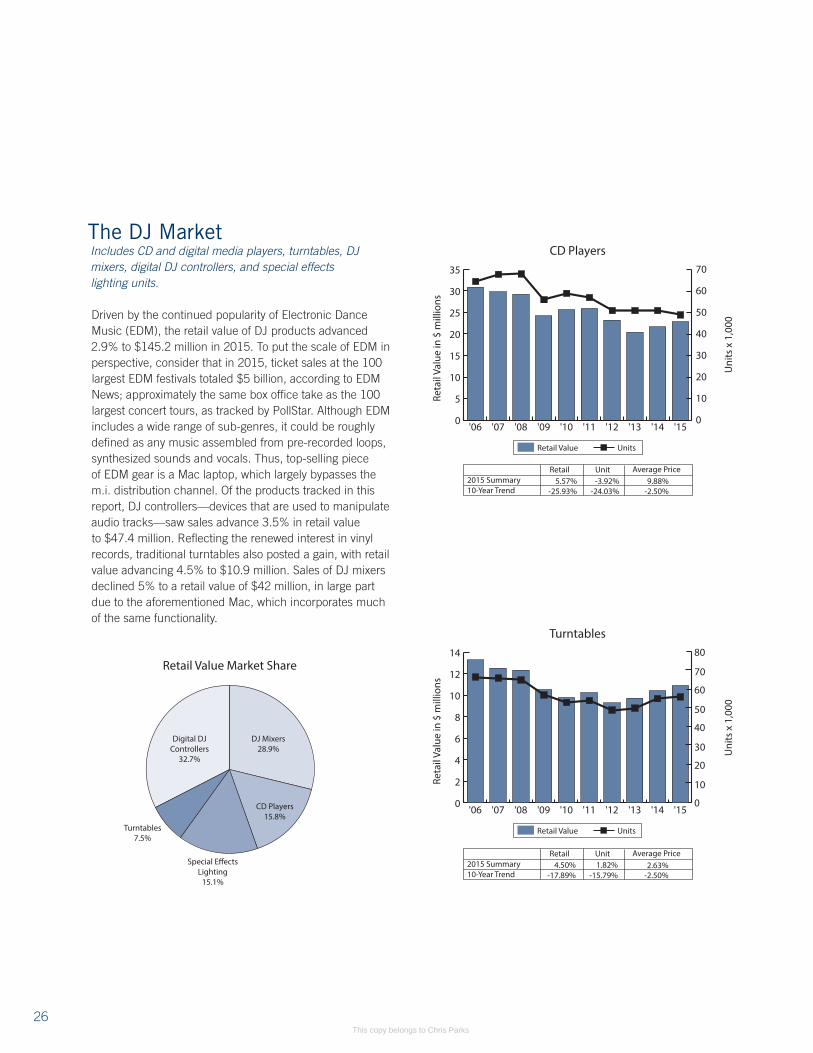
'15'14'13'12'11'10'09'08'07'062015 Summary10-Year Trend
Retail Unit Average Price
-25.93% -24.03% -2.50%5.57% -3.92% 9.88%
CD Players15.8%
DJ Mixers28.9%
Turntables7.5%
Special E�ectsLighting
15.1%
Retail Value Market Share
Digital DJControllers
32.7%
0
2
4
6
8
10
12
14
'15'14'13'12'11'10'09'08'07'06
Turntables
0
10
20
30
40
50
60
70
80
'04'03'02'01'00'99'98'97
Reta
il Va
lue
in $
mill
ions
Uni
ts x
1,0
00
Retail Value Units
0
10
20
30
40
50
60
70
80
'15'14'13'12'11'10'09'08'07'06
2015 Summary10-Year Trend
Retail Unit Average Price
-17.89% -15.79% -2.50%4.50% 1.82% 2.63%
The DJ MarketIncludes CD and digital media players, turntables, DJ mixers, digital DJ controllers, and special effects lighting units.
Driven by the continued popularity of Electronic Dance Music (EDM), the retail value of DJ products advanced 2.9% to $145.2 million in 2015. To put the scale of EDM in perspective, consider that in 2015, ticket sales at the 100 largest EDM festivals totaled $5 billion, according to EDM News; approximately the same box office take as the 100 largest concert tours, as tracked by PollStar. Although EDM includes a wide range of sub-genres, it could be roughly defined as any music assembled from pre-recorded loops, synthesized sounds and vocals. Thus, top-selling piece of EDM gear is a Mac laptop, which largely bypasses the m.i. distribution channel. Of the products tracked in this report, DJ controllers—devices that are used to manipulate audio tracks—saw sales advance 3.5% in retail value to $47.4 million. Reflecting the renewed interest in vinyl records, traditional turntables also posted a gain, with retail value advancing 4.5% to $10.9 million. Sales of DJ mixers declined 5% to a retail value of $42 million, in large part due to the aforementioned Mac, which incorporates much of the same functionality.
26This copy belongs to Chris Parks

0
5
10
15
20
25
30
35
40
'15'14'13'12'11'10'09'08'07'06
Special E�ects Lighting Units
Reta
il Va
lue
in $
mill
ions
Retail Value
2015 Summary10-Year Trend
Retail16.40%
-39.39%
0
10
20
30
40
50
'15'14'13'12'11'10
Digital DJ Controllers
010
20
30
40
5060
70
80
90
'04'03'02'01'00'99'98'97
Reta
il Va
lue
in $
mill
ions
Uni
ts x
1,0
00
Retail Value Units
0
10
20
30
40
50
60
70
80
90
'15'14'13'12'11'10
2015 Summary6-Year Trend
Retail Unit Average Price
203.16% 278.26% -19.85%3.48% 10.13% -6.03%
0
20
40
60
80
100
120
140
160
'15'14'13'12'11'10'09'08'07'06
Total DJ Sales
Reta
il Va
lue
in $
mill
ions
Retail Value
2015 Summary10-Year Trend
Retail2.94%
16.55%
A new category, Digital DJ Controllers, was added in 2010 andis included in Total DJ Sales.
0
10
20
30
40
50
'15'14'13'12'11'10'09'08'07'06
DJ Mixers
0
50
100
150
200
250
300
'04'03'02'01'00'99'98'97
Reta
il Va
lue
in $
mill
ions
Uni
ts x
1,0
00
Retail Value Units
0
50
100
150
200
250
300
'15'14'13'12'11'10'09'08'07'06
2015 Summary10-Year Trend
Retail Unit Average Price
-4.76% -18.37% 16.67%-5.02% -0.50% -4.55%
Music USA
27This copy belongs to Chris Parks

The Recording and Computer Music Market(Multi-Track, Software and Computer Music)
Includes hard disk multi-track recorders, hand-held digital recorders, rack-mounted processors, sound cards and related hardware, recording and sequencing software and plug-in software and loops.
Based on the volume of music tracks being shared online, there is probably more music being recorded today by an order of magnitude than at any other time in history. This interest in capturing music, unfortunately, has not translated into sales growth for recording products. The broad-based category, which includes software, hardware and dedicated recorders, saw a 6.1% decline last year to a retail value of $501.9 million. The downward trend is due entirely to the collapsing prices of digital technology: the same advances in processing power, memory and software that have crushed prices on consumer electronics products have had a similar impact on recording gear. More people may be recording, but they can do it for a lot less with each passing year.
The price of Digital Audio Workstations (DAWs), the software that is central to all studios, has been trending downward ever since Apple began offering its Logic Pro direct to consumers for just $199. (Logic Pro was used to produce Adele’s latest album, 25.) Prices for comparable products were previously three times higher. While cutting prices, software makers have been simultaneously adding features. Most DAWs now come standard with a range of virtual synthesizers, percussion sounds and effects. This bundling has had an adverse impact on ancillary hardware. Sales of discrete “plug-in” software that provides effects, instrument sounds and other features trended down for the year, as did hardware products like compressors and mic preamps.
Retail Value Market Share
Hard DiskMulti-TrackRecorders
7.6%
Rack-MountedProcessors
55.5%
Hand-HeldDigital Recorders
36.9%
Anecdotal evidence suggests that unit sales of audio interfaces, the critical hardware link that passes audio information to the computer, held up well during the year. However, average selling prices declined, resulting in a 5.8% dip in retail value to $180 million.
For a modest sum, an aspiring musician can assemble a recording studio with more power—unlimited tracks, vast numbers of effects, total editing capabilities—than the best professional recording studios of a few decades ago. (Talent, unfortunately, isn’t included.) However, the improved price/performance ratio hasn’t significantly expanded the universe of individuals interested in multi-track recording.
Multi-Track
28This copy belongs to Chris Parks

0
5
10
15
20
25
30
35
40
45
'15'14'13'12'11'10'09'08'07'06
Hard Disk Multi-Track Recorders
0
10
20
30
40
50
60
70
'04'03'02'01'00'99'98'97'96
Reta
il Va
lue
in $
mill
ions
Uni
ts x
1,0
00
0
10
20
30
40
50
60
70
'15'14'13'12'11'10'09'08'07'06
Uni
ts x
1,0
00
Retail Value Units
2015 Summary10-Year Trend
Retail Unit Average Price
-69.31% -34.78% -52.94%1.05% 2.63% -1.54%
0
10
20
30
40
50
60
70
80
90
'15'14'13'12'11'10'09'08'07
Hand-Held Digital Recorders
0
50
100
150
200
250
300
350
'04'03'02'01'00'99'98'97'96
Reta
il Va
lue
in $
mill
ions
Uni
ts x
1,0
00
0
50
100
150
200
250
300
350
'15'14'13'12'11'10'09'08'07
Uni
ts x
1,0
00
Retail Value Units
2015 Summary9-Year Trend
Retail Unit Average Price
2.16% 55.68% -34.38%-5.20% -0.69% -4.55%
0
25
50
75
100
125
150
175
200
225
'15'14'13'12'11'10'09'08'07'06
Total Multi-Track Sales
Reta
il Va
lue
in $
mill
ions
Retail Value
2015 Summary10-Year Trend
Retail-6.28%20.37%
A new category, Hand-Held Digital Recorders, was added in 2007and is included in Total Multi-Track.
0
20
40
60
80
100
120
'15'14'13'12'11'10'09'08'07'06
Rack-Mounted Processors
Retail Value
2015 Summary10-Year Trend
Retail
-4.76%-7.89%
Rack-Mounted Processors category includes compressors, limiters, pre-amps, EQs and multi-e�ects.
Reta
il Va
lue
in $
mill
ions
Music USA
29This copy belongs to Chris Parks

0
50
100
150
200
250
'15'14'13'12'11'10'09'08'07'06
Total Software
Reta
il Va
lue
in $
mill
ions
Retail Value
2015 Summary10-Year Trend
Retail-6.45%
-32.37%
0
25
50
75
100
125
150
175
200
225
'15'14'13'12'11'10'09'08'07'06
Recording & Sequencing Software
Reta
il Va
lue
in $
mill
ions
Retail Value
2015 Summary10-Year Trend
Retail-7.41%
-34.13%
Recording and Computer Music Market, continued
0
40
80
120
160
200
'15'14'13'12'11'10'09'08'07'06
Computer Music Hardware
Reta
il Va
lue
in $
mill
ions
Retail Value
2015 Summary10-Year Trend
Retail-5.76%-3.59%
Computer Music Hardware category includes interfaces, digital audio work surfaces (DAWS) and other USB-enabled hardware.
Retail Value Market Share
Plug-In Software& Loops
8.3%
Sound Cards &Related Hardware
53.2%
Recording/Sequencing
38.5%
Recording and Computer Music Market
30This copy belongs to Chris Parks

0
5
10
15
20
25
30
'15'14'13'12'11'10'09'08'07'06
Plug-In Software & Loops
Reta
il Va
lue
in $
mill
ions
Retail Value
2015 Summary10-Year Trend
Retail-1.75%42.03%
Plug-In Software & Loops category includes signal processing e�ects, tune correction software and mastering programs.
0
50
100
150
200
250
300
350
400
450
'15'14'13'12'11'10'09'08'07'06
Total Computer Music Market
Reta
il Va
lue
in $
mill
ions
Retail Value
2015 Summary10-Year Trend
Retail-6.09%
-19.59%
Music USA
31This copy belongs to Chris Parks
0
20
40
60
80
100
120
140
'15'14'13'12'11'10'09'08'07'06
Keyboard Synthesizers
0
20
40
60
80
100
'04'03'02'01'00'99'98'97'96
Reta
il Va
lue
in $
mill
ions
0
20
40
60
80
100
'15'14'13'12'11'10'09'08'07'06
Uni
ts x
1,0
00
Retail Value Units
2015 Summary10-Year Trend
Retail Unit Average Price
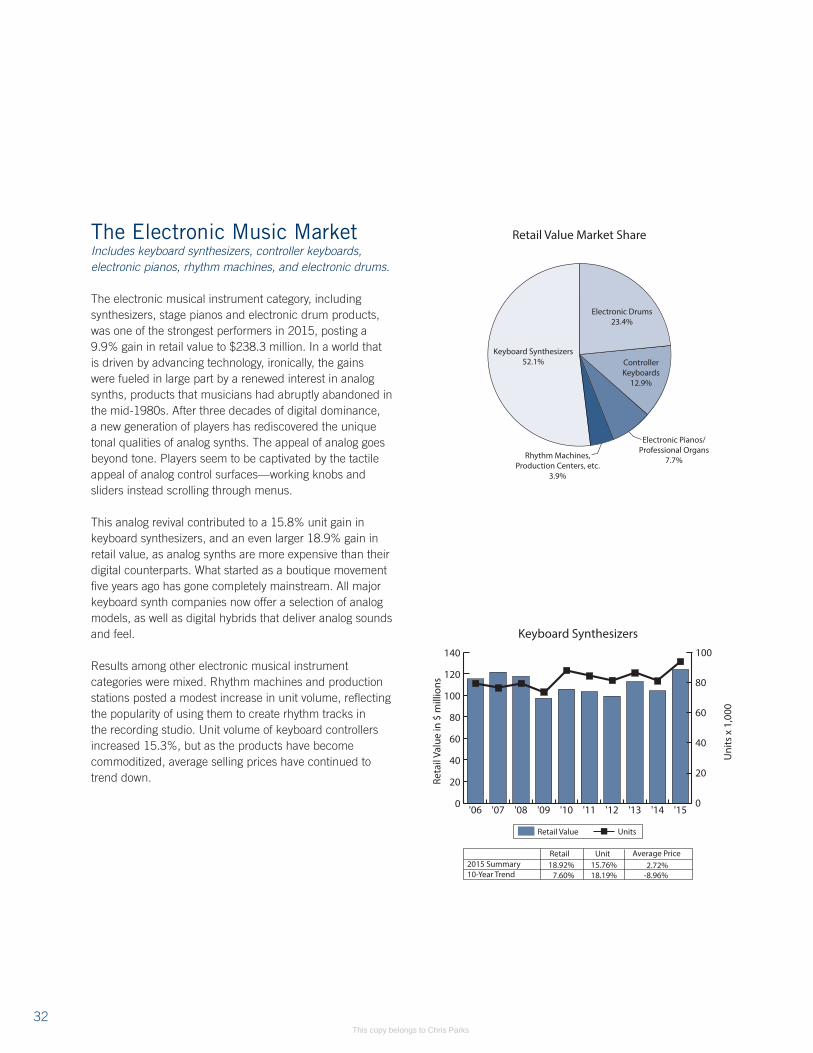
7.60% 18.19% -8.96%18.92% 15.76% 2.72%
Keyboard Synthesizers52.1%
Electronic Drums23.4%
Electronic Pianos/Professional Organs
7.7%
ControllerKeyboards
12.9%
Rhythm Machines,Production Centers, etc.
3.9%
Retail Value Market ShareThe Electronic Music MarketIncludes keyboard synthesizers, controller keyboards, electronic pianos, rhythm machines, and electronic drums.
The electronic musical instrument category, including synthesizers, stage pianos and electronic drum products, was one of the strongest performers in 2015, posting a 9.9% gain in retail value to $238.3 million. In a world that is driven by advancing technology, ironically, the gains were fueled in large part by a renewed interest in analog synths, products that musicians had abruptly abandoned in the mid-1980s. After three decades of digital dominance, a new generation of players has rediscovered the unique tonal qualities of analog synths. The appeal of analog goes beyond tone. Players seem to be captivated by the tactile appeal of analog control surfaces—working knobs and sliders instead scrolling through menus.
This analog revival contributed to a 15.8% unit gain in keyboard synthesizers, and an even larger 18.9% gain in retail value, as analog synths are more expensive than their digital counterparts. What started as a boutique movement five years ago has gone completely mainstream. All major keyboard synth companies now offer a selection of analog models, as well as digital hybrids that deliver analog sounds and feel.
Results among other electronic musical instrument categories were mixed. Rhythm machines and production stations posted a modest increase in unit volume, reflecting the popularity of using them to create rhythm tracks in the recording studio. Unit volume of keyboard controllers increased 15.3%, but as the products have become commoditized, average selling prices have continued to trend down.
32This copy belongs to Chris Parks

0
2
4
6
8
10
12
14
'15'14'13'12'11'10'09'08'07'06
Rhythm Machines / Production Centers
0
5
10
15
20
25
30
35
'04'03'02'01'00'99'98'97
Reta
il Va
lue
in $
mill
ions
Uni
ts x
1,0
00
Retail Value Units
0
5
10
15
20
25
30
35
'15'14'13'12'11'10'09'08'07'06
2015 Summary10-Year Trend
Retail Unit Average Price
-22.95% -7.11% -17.05%3.81% 7.27% -3.23%
In 2010, the Sound Modules and Drum Machines categorieswere merged to form this new category, Rhythm Machines/Production Centers.
0
5
10
15
20
25
30
35
40
'15'14'13'12'11'10'09'08'07'06
Controller Keyboards
0
50
100
150
200
250
300
'04'03'02'01'00'99'98'97'96
Reta
il Va
lue
in $
mill
ions
Uni
ts x
1,0
00
Retail Value Units
0
50
100
150
200
250
300
'15'14'13'12'11'10'09'08'07'06
2015 Summary10-Year Trend
Retail Unit Average Price
147.18% 159.46% -4.73%-5.56% 15.32% -18.10%
Starting from 2010, Controller Keyboards category includesboth under 44 note and 44-88 note. Previously, this category only included 44-48 note.
0
10
20
30
40
50
'15'14'13'12'11'10'09'08'07'06
Electronic Pianos / Professional Organs
0
5
10
15
20
25
30
'04'03'02'01'00'99'98'97'96
Reta
il Va
lue
in $
mill
ions
Uni
ts x
1,0
00
Retail Value Units
0
5
10
15
20
25
30
'15'14'13'12'11'10'09'08'07'06
2015 Summary10-Year Trend
Retail Unit Average Price
-58.49% -63.77% 14.58%0.27% -1.03% 1.32%
0
10
20
30
40
50
60
'15'14'13'12'11'10'09'08'07'06
Electronic Drums
Reta
il Va
lue
in $
mill
ions
Retail Value
2015 Summary10-Year Trend
Retail6.10%7.31%
Music USA
33This copy belongs to Chris Parks

The Print Music MarketIncludes method books, instructional materials, popular folios, and related print music products.
Sales of all printed music dipped 1.5% in retail value to $505.5 million in 2015. Popular folios and method books continue to face competition from digital alternatives, of both the legally copyrighted and the bootlegged variety. Readily available online guitar tab and vocal sheets have unquestionably taken a toll on sales of traditional print. Compounding this digital competition, large segments of current popular music don’t readily lend themselves to print. These decreases were offset somewhat by continued strong sales in band, orchestral and choral products. It’s hard to overestimate the resilience of school music programs and the impact of their demand for method books.
0
100
200
300
400
500
600
'15'14'13'12'11'10'09'08'07'06
Printed Music
Reta
il Va
lue
in $
mill
ions
Retail Value
2015 Summary10-Year Trend
Retail-1.50%
-13.11%
0
50
100
150
200
250
'15'14'13'12'11'10'09'08'07'06
Total Electronic Music Sales
Reta
il Va
lue
in $
mill
ions
Retail Value
2015 Summary10-Year Trend
Retail9.93%0.87%
Electronic Music Market, continued
34This copy belongs to Chris Parks

Retail Value Market Share
KeyboardsOver $199
68.1%Keyboards
Under $19931.9%
The Portable Keyboard Market
Sales of portable keyboards, retailing for both over and under $200, posted sharp declines in 2015. The category slumped 18.1% to 824,160 units, while retail dollar value declined 16.7% to $155.5 million. The product category appears to be a victim of advancing technology in the form of apps. For most of the past three decades, portables provided the most affordable access to a keyboard experience. That’s no longer the case. While portables with surprisingly good tonal quality and features can be had for less than $100, there are now scores of keyboard apps for smartphones and tablets that are available for free, or for a nominal charge. Unquestionably, these even lower-cost keyboard alternatives have continued to erode the sale of portables.
Another factor contributing to the decline is a de-emphasis on the product category by mass merchants. Whereas in previous years, portables received prominent placement in the fourth quarter on the floors of Walmart, Target and Best Buy, they have now been relegated to the back of the store.
0
20
40
60
80
100
'15'14'13'12'11'10'09'08'07'06
Keyboards Under $199
0.0
0.2
0.4
0.6
0.8
1.0
1.2
'06'05'04'03'02'01'00'99'98
Reta
il Va
lue
in $
mill
ions
Retail Value Units
Uni
ts x
1,0
00,0
00
0.0
0.2
0.4
0.6
0.8
1.0
1.2
'15'14'13'12'11'10'09'08'07'062015 Summary10-Year Trend
Retail Unit Average Price
-49.29% -47.66% -3.13%-17.71% -18.60% 1.09%
0
20
40
60
80
100
120
140
'15'14'13'12'11'10'09'08'07'06
Keyboards Over $199
Reta
il Va
lue
in $
mill
ions
Retail Value Units
0
50
100
150
200
250
300
350
400
450
'15'14'13'12'11'10'09'08'07'06
Uni
ts x
1,0
00
2015 Summary10-Year Trend
Retail Unit Average Price
-12.46% -26.17% 18.57%-16.18% -17.11% 1.11%
Music USA
35This copy belongs to Chris Parks

The Karaoke Market
As the karaoke market has increasingly been taken over by mass merchants and consumer electronics retailers, specialized M.I. retailers have either abandoned the category or opted to stock more expensive products. This shift accounts for a 19.6% drop in unit volume and a 9.1% increase in estimated retail value. Sales of low-end hardware have also been impacted by the availability of numerous karaoke apps that work with phones or tablets.
0
10
20
30
40
50
60
70
'15'14'13'12'11'10'09'08'07'06
Karaoke Machines
0
100
200
300
400
500
'06'05'04'03'02'01'00'99'98'97
Reta
il Va
lue
in $
mill
ions
Retail Value Units
0
100
200
300
400
500
'15'14'13'12'11'10'09'08'07'06
Uni
ts x
1,0
00
2015 Summary10-Year Trend
Retail Unit Average Price
-72.91% -79.32% 31.03%9.13% -19.59% 35.71%
0
25
50
75
100
125
150
175
200
225
'15'14'13'12'11'10'09'08'07'06
Total Portable Keyboards
0.0
0.2
0.4
0.6
0.8
1.0
1.2
1.4
1.6
'04'03'02'01'00'99'98
Reta
il Va
lue
in $
mill
ions
Retail Value Units
Uni
ts x
1,0
00,0
00
0.0
0.2
0.4
0.6
0.8
1.0
1.2
1.4
1.6
'15'14'13'12'11'10'09'08'07'06 2015 Summary10-Year Trend
Retail Unit Average Price
-28.93% -41.66% 21.84%-16.68% -18.08% 1.71%
Portable Keyboards, continued
36This copy belongs to Chris Parks

0
100
200
300
400
500
600
'15'14'13'12'11'10'09'08'07'06
General Accessories
Reta
il Va
lue
in $
mill
ions
Retail Value
General Accessories category includes a wide variety of accessory products, including instrument care products, metronomes, tuners, polishes, reeds, stands, cases, bags, straps, lighting equipment, pickups and specialty instruments like recorders, accordions and harmonicas.
2015 Summary10-Year Trend
Retail3.00%
28.87%
The General Accessory Market
Accessories represent a grab-bag product category that includes cases, stands, straps, tuners and a host of other problem-solving products. Collectively, this diverse product assortment is the industry’s most consistent performer, posting gains regardless of the direction of the economy or prevailing musical trends. Sales for the category advanced 3.0% in 2015 to $551.4 million, continuing a nearly unbroken record of sales gains. Of the product categories tracked in this report, accessories is one of the few where 2015 revenues exceeded pre-recessionary levels.
Product innovation, retail focus and consumer behavior are largely responsible for this resilience. Accessory manufacturers have been remarkably adept at consistently offering new products to address market needs. This responsiveness is reflected in a wide range of clamps and brackets for attaching tablets to a music stand, as well as instrument-humidifying devices that can be controlled remotely by a smartphone. The collectible fretted instrument market has also given rise to a plethora of premium cases, cables, straps and polishes.
Retailers, both large and small, have placed increasing emphasis on these small goods because they generate in-store or online traffic and yield attractive margins. The buying public, for their part, seem to have a nearly insatiable demand for the latest accessory that enhances the performance of their instrument.
Music USA
37This copy belongs to Chris Parks

MUSIC AND SOUND U.S. INDUSTRY SUMMARYThe purpose of the following data is to provide a review of the 10-year trend of music products activities in the U.S. music industry. The data comes from information gathered by The Music Trades magazine over the past decade.
IMPORTS AND EXPORTSThe import and export statistics are provided by the U.S. Census Bureau and offer a snapshot of U.S. music products import and export activities. This section also provides an overview of the countries where U.S. music products were exported, and the countries the United States imported music products from in 2015.
38This copy belongs to Chris Parks

U.S. INDUSTRY SUMMARY (in millions of dollars)
*Multi-Track Recorders includes a new category, Portable Digital Recorders, as of 2007.
Segment 2006 2007 2008 2009 2010 2011 2012 2013 2014 2015
Acoustic Guitars $548 $515 $473 $391 $419 $483 $532 $603 $678 $696
Acoustic Pianos $449 $424 $364 $201 $287 $291 $282 $293 $304 $284
Cables $151 $157 $159 $145 $157 $159 $162 $163 $167 $165
Computer Music Products $420 $432 $428 $351 $385 $365 $353 $360 $360 $338
Digital Pianos $144 $123 $121 $100 $130 $147 $159 $163 $165 $179
DJ Gear $125 $113 $105 $86 $104 $114 $120 $139 $141 $145
Effects $123 $136 $137 $127 $141 $143 $138 $129 $130 $136
Electric Guitars $563 $602 $566 $429 $420 $452 $468 $467 $506 $497
Electronic Player Pianos $133 $121 $81 $42 $56 $65 $60 $68 $67 $72
Fretted Instrument Strings $168 $173 $178 $170 $180 $190 $192 $183 $192 $192
General Accessories $428 $436 $446 $408 $436 $461 $485 $511 $535 $551
Home Organs $68 $59 $48 $28 $23 $19 $18 $14 $13 $13
Institutional Organs $63 $59 $54 $39 $38 $32 $30 $29 $28 $30
Instrument Amplifiers $360 $377 $340 $253 $230 $218 $192 $189 $186 $162
Karaoke Products $61 $29 $21 $18 $19 $16 $13 $13 $15 $17
Keyboard Synthesizers $115 $122 $118 $97 $106 $104 $99 $113 $104 $124
Microphones $459 $475 $466 $389 $432 $447 $474 $501 $532 $549
Multi-Track Recorders* $136 $194 $194 $173 $181 $201 $197 $186 $175 $164
Other Electronic Products $109 $114 $110 $92 $112 $110 $109 $107 $103 $105
Percussion $519 $497 $456 $402 $418 $423 $397 $382 $377 $381
Portable Keyboards $219 $186 $176 $150 $216 $169 $184 $176 $187 $156
Printed Music $582 $590 $598 $540 $545 $553 $547 $518 $513 $505
Pro Audio $865 $904 $819 $654 $717 $752 $756 $795 $818 $837
Rhythm Machines $12 $11 $10 $9 $8 $9 $8 $7 $9 $9
Stringed Instruments $113 $121 $98 $81 $84 $107 $113 $109 $108 $124
Ukuleles $33 $42 $63 $77 $70 $74 $90
Wind Instruments $486 $516 $512 $454 $447 $464 $507 $522 $542 $567
Industry Total $7,428 $7,489 $7,078 $5,860 $6,332 $6,555 $6,673 $6,808 $7,033 $7,089
U.S. Industry Summary
39This copy belongs to Chris Parks

U.S. INDUSTRY SUMMARY – UNITS SOLD (in thousands)
Segment 2006 2007 2008 2009 2010 2011 2012 2013 2014 2015
Acoustic Guitars 1,490 1,348 1,318 1,109 1,200 1,312 1,327 1,363 1,499 1,450
Acoustic Pianos 67 54 48 30 40 37 33 32 33 30
Digital Pianos 125 121 123 102 118 120 128 130 135 141
DJ Mixers 245 220 210 185 190 168 185 200 201 200
Drum Kits 271 222 200 168 180 174 158 141 139 137
Effects 1,902 1,960 2,009 1,777 1,800 1,769 1,705 1,259 1,314 1,365
Electric Guitars 1,501 1,520 1,452 1,163 1,176 1,201 1,163 1,110 1,132 1,005
Electronic Player Pianos 10 9 6 3 4 4 4 4 4 4
Home Organs 7 6 5 3 3 2 2 2 1 1
Institutional Organs 3 3 2 2 2 1 1 1 1 1
Instrument Amplifiers 1,092 1,112 1,096 873 901 890 844 788 775 720
Karaoke Machines 420 200 145 118 110 105 88 95 108 87
Keyboard Synthesizers 80 77 80 74 88 85 82 87 81 94
Multi-Track Recorders* 122 296 275 285 310 336 348 333 328 327
Portable Keyboards 1,413 1,210 1,120 1,072 1,344 1,109 1,078 913 1,006 824
Rhythm Machines 33 29 26 23 24 24 21 22 29 31
Stringed Instruments 409 421 351 291 297 370 378 343 332 378
Ukuleles 501 581 895 1,087 966 1,010 1,197
Wind Instruments 589 613 629 569 564 578 591 568 585 604
*Multi-Track Recorders includes a new category, Portable Digital Recorders, as of 2007.
40This copy belongs to Chris Parks

U.S. Industry Summary
0
10
20
30
40
50
60
'15'14'13'12'11'10'09'08'07'060
10
20
30
40
50
60
04030201009998979695'94
GD
P Pe
r Cap
ita (i
n th
ousa
nds
of $
)
0
10
20
30
40
50
60
'15'14'13'12'11'10'09'08'07'06
Music Sales Per CapitaGDP Per Capita
GDP Per Capita and Music Sales Per Capita
Mus
ic S
ales
Per
Cap
ita (i
n D
olla
rs)
0
1
2
3
4
5
6
7
8
'15'14'13'12'11'10'09'08'07'06'05'04
Industry Total
Reta
il Va
lue
in $
bill
ions
2014–15 0.79% 10-Year 5.71%
0
10
20
30
40
50
60
'15'14'13'12'11'10'09'08'07'06
GDP Per Capita(in thousands of Dollars)
2014-15 2.91% 10-Year 28.54%
Source: CIA Factbook
0
5
10
15
20
25
30
'15'14'13'12'11'10'09'08'07'06
Music Sales Per Capita(in Dollars)
2014–15 0.01% 10-Year 12.29%
Source: The Music Trades
41This copy belongs to Chris Parks

0
100
200
300
400
500
'15'14'13'12'11'10'09'08'07'06
Acoustic Pianos
Reta
il Va
lue
in $
mill
ions
0
20
40
60
80
100
120
140
160
180
'15'14'13'12'11'10'09'08'07'06
Cables
Reta
il Va
lue
in $
mill
ions
0
50
100
150
200
250
300
350
400
450
'15'14'13'12'11'10'09'08'07'06
Computer Music Products
Reta
il Va
lue
in $
mill
ions
0
20
40
60
80
100
120
140
160
180
'15'14'13'12'11'10'09'08'07'06
Digital Pianos
Reta
il Va
lue
in $
mill
ions
0
20
40
60
80
100
120
140
160
'15'14'13'12'11'10'09'08'07'06
DJ Products
Reta
il Va
lue
in $
mill
ions
A new category, Digital DJ Controllers, was added in 2010 and is included in Total DJ Products.
0
20
40
60
80
100
120
140
160
180
'15'14'13'12'11'10'09'08'07'06
Drum Kits
Reta
il Va
lue
in $
mill
ions
42This copy belongs to Chris Parks
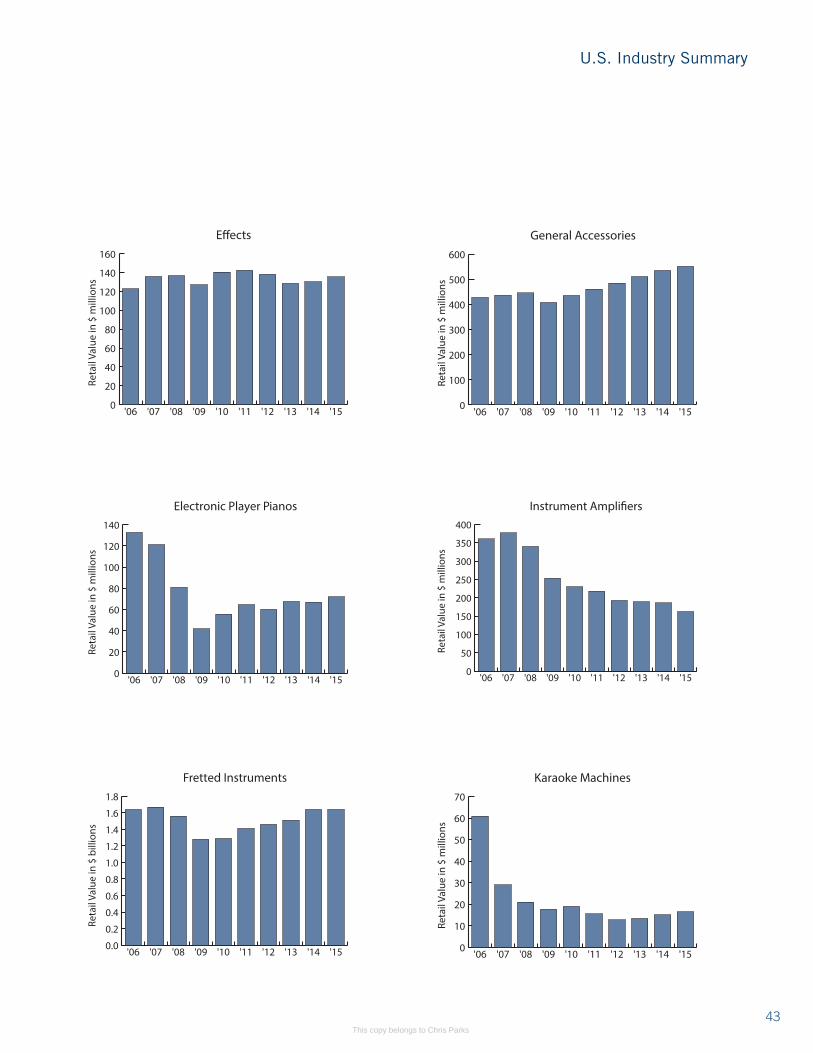
0
20
40
60
80
100
120
140
'15'14'13'12'11'10'09'08'07'06
Electronic Player Pianos
Reta
il Va
lue
in $
mill
ions
0
20
40
60
80
100
120
140
160
'15'14'13'12'11'10'09'08'07'06
E�ects
Reta
il Va
lue
in $
mill
ions
0.0
0.2
0.4
0.6
0.8
1.0
1.2
1.4
1.6
1.8
'15'14'13'12'11'10'09'08'07'06
Fretted Instruments
Reta
il Va
lue
in $
bill
ions
0
100
200
300
400
500
600
'15'14'13'12'11'10'09'08'07'06
General Accessories
Reta
il Va
lue
in $
mill
ions
0
10
20
30
40
50
60
70
'15'14'13'12'11'10'09'08'07'06
Karaoke Machines
Reta
il Va
lue
in $
mill
ions
0
50
100
150
200
250
300
350
400
'15'14'13'12'11'10'09'08'07'06
Instrument Ampli�ers
Reta
il Va
lue
in $
mill
ions
U.S. Industry Summary
43This copy belongs to Chris Parks

0
20
40
60
80
100
120
140
'15'14'13'12'11'10'09'08'07'06
Organs
Reta
il Va
lue
in $
mill
ions
0
100
200
300
400
500
600
'15'14'13'12'11'10'09'08'07'06
Microphones
Reta
il Va
lue
in $
mill
ions
A new category, Portable Digital Recorders, was added to Multi-Track Recorders in 2007 by The Music Trades.
0
25
50
75
100
125
150
175
200
225
'15'14'13'12'11'10'09'08'07'06
Multi-Track Products
Reta
il Va
lue
in $
mill
ions
0
20
40
60
80
100
120
'15'14'13'12'11'10'09'08'07'06
Other Electronic Products
Reta
il Va
lue
in $
mill
ions
0
100
200
300
400
500
600
'15'14'13'12'11'10'09'08'07'06
Percussion
Reta
il Va
lue
in $
mill
ions
0
20
40
60
80
100
120
140
'15'14'13'12'11'10'09'08'07'06
Keyboard Synthesizers
Reta
il Va
lue
in $
mill
ions
44This copy belongs to Chris Parks

0
50
100
150
200
250
'15'14'13'12'11'10'09'08'07'06
Portable Keyboards
Reta
il Va
lue
in $
mill
ions
0
2
4
6
8
10
12
14
'15'14'13'12'11'10'09'08'07'06
Rhythm Machines / Production Centers
Reta
il Va
lue
in $
mill
ions
0.0
0.2
0.4
0.6
0.8
1.0
1.2
1.4
1.6
'15'14'13'12'11'10'09'08'07'06
Pro Audio
Reta
il Va
lue
in $
bill
ions
0
25
50
75
100
125
'15'14'13'12'11'10'09'08'07'06
Stringed Instruments
Reta
il Va
lue
in $
mill
ions
0
100
200
300
400
500
600
'15'14'13'12'11'10'09'08'07'06
Wind Instruments
Reta
il Va
lue
in $
mill
ions
0
100
200
300
400
500
600
'15'14'13'12'11'10'09'08'07'06
Printed Music
Reta
il Va
lue
in $
mill
ions
U.S. Industry Summary
45This copy belongs to Chris Parks

U.S. IMPORTS OF MUSIC AND SOUND PRODUCTS2015 DataDescription Commodity Code Quantity Value
Single Loudspeakers, Mounted In Their Enclosures 8518210000 48,926,833 545,697,875
Multiple Loudspeakers, Mounted In the Same Enclosure 8518220000 28,237,073 1,475,106,401
Headphones, Earphones, Microphone/Speaker, Nesoi* 8518302000 343,009,884 1,404,203,455
Audio Frequency Electric Amplifiers, Nesoi* 8518402000 12,060,794 738,751,451
Upright Pianos 9201100011 15,644 38,007,572
Grand Pianos 9201200011 10,274 70,801,182
Harpsichords and Other Keyboard Stringed Instruments, Nesoi* 9201900000 428 981,588
Stringed Musical Instruments Played with a Bow 9202100000 453,667 42,237,991
Guitars Under $100, Excluding the Value of the Case 9202902000 1,480,656 58,197,040
Guitars, Nesoi* 9202904000 317,803 64,737,827
Stringed Musical Instruments, Nesoi* 9202906000 1,197,824 36,720,570
Brasswind Instruments Valued Not Over $10 Each 9205100040 15,219 73,334
Brasswind Instruments Valued Over $10 Each 9205100080 224,282 68,924,684
Keyboard Pipe Organs 9205901200 110 3,874,945
Keyboard Instruments, Nesoi* 9205901400 7,206 383,300
Piano Accordions 9205901500 7,149 3,757,286
Accordions, Nesoi* 9205901800 31,370 5,044,626
Mouth Organs 9205901900 215,634 7,533,197
Bagpipes 9205902000 1,784 495,582
Clarinets 9205904020 106,263 24,695,289
Saxophones 9205904040 94,153 41,352,612
Flutes and Piccolos (Except Bamboo) 9205904060 114,857 20,014,502
Woodwind Instruments, Nesoi* 9205904080 3,113,449 11,326,148
Wind Instruments, Nesoi* 9205906000 212,183 2,788,877
Drums 9206002000 1,042,589 59,930,547
Cymbals 9206004000 298,443 18,960,967
Sets of Tuned Bells, as Chimes, Peals or Carillions 9206006000 901,907 7,958,711
Percussion Musical Instruments, Nesoi* 9206008000 3,307,421 29,033,943
Musical Synthesizers (Under $100 Each) 9207100005 115,016 3,957,236
Musical Synthesizers ($100 or Over Each) 9207100010 88,766 35,753,756
Keyboard Instrument (More Than 1 Keyboard Under $200) 9207100045 1,254 105,882
*Nesoi: Not Elsewhere Specified Or Indicated. Source: The U.S. Census Bureau, 2015
46This copy belongs to Chris Parks

U.S. IMPORTS OF MUSIC AND SOUND PRODUCTS2015 Data
2015 2014 Difference % Change
Import Values $5,416,130,479 $5,521,662,741 –$105,532,262 –1.9%
Export Values $1,677,471,883 $1,828,146,164 –$150,674,281 –8.2%
U.S. Imports and Exports
*Nesoi: Not Elsewhere Specified Or Indicated. Source: The U.S. Census Bureau, 2015
Description Commodity Code Quantity Value
Keyboard Instrument (More Than 1 Keyboard $200 or Over) 9207100055 2,026 5,173,254
Keyboard Instrument (More Than 1 Keyboard Hand-Held) 9207100060 94,182 893,627
Keyboard Instrument Except Accordions (1 Keyboard Under $100) 9207100065 533,196 26,581,537
Keyboard Instrument Except Accordions (1 Keyboard $100 or Over) 9207100075 290,960 98,431,871
Fretted Stringed Instruments 9207900040 1,483,977 186,790,483
Musical Instruments, Electrically Amplified, Nesoi* 9207900080 214,229 37,618,477
Music Boxes 9208100000 4,359,039 29,960,058
Other Musical Instruments 9208900040 280,577 876,608
Mouth-Blown Sound Signalling Instruments, Nesoi* 9208900080 30,002,499 11,587,382
Musical Instrument Strings 9209300000 10,201,975 24,818,594
Tuning Pins for Pianos 9209914000 3,809 269,559
Parts and Accessories for Pianos, Nesoi* 9209918000 – 6,506,033
Mutes, Stands and Music Holders of Stringed Instruments 9209922000 – 3,819,524
Tuning Pins for Stringed Instruments 9209924000 1,533 1,446,088
Parts of Bows, Chin Rest and Parts for Instruments Played with Bow 9209926000 – 11,746,012
Parts and Accessories for Stringed Instruments, Nesoi* 9209928000 – 17,179,478
Collapsible Keyboard Instrument Stands 9209944000 – 6,415,160
Other Parts and Accessories for Keyboard Instruments 9209948000 – 43,037,223
Metronomes, Tuning Forks and Pitch Pipes 9209990500 – 2,939,554
Mutes, Pedals, Dampers, and Spurs for Drums Pedals 9209991000 – 29,383,872
Parts and Accessories for Pipe Organs 9209991600 – 3,354,445
Parts and Accessories for Harmoniums and Similar Keyboard Instruments
9209991800 – 127,851
Parts and Accessories for Bagpipes 9209992000 – 797,561
Parts and Accessories for Woodwind Instruments 9209994040 – 21,909,807
Parts and Accessories for Other Wind Instruments 9209994080 – 5,166,495
Mechanisms for Music Boxes 9209996100 – 413,074
Parts and Accessories for Musical Instruments, Nesoi* 9209998000 – 17,478,476
47This copy belongs to Chris Parks
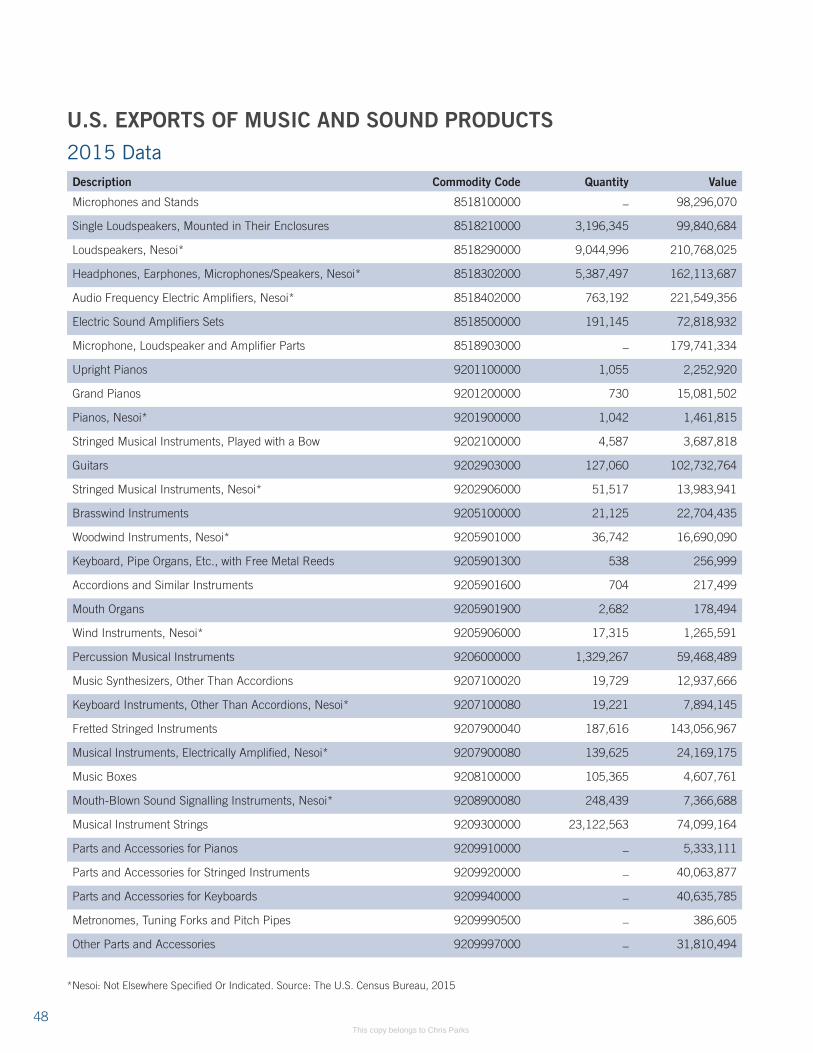
U.S. EXPORTS OF MUSIC AND SOUND PRODUCTS2015 DataDescription Commodity Code Quantity Value
Microphones and Stands 8518100000 – 98,296,070
Single Loudspeakers, Mounted in Their Enclosures 8518210000 3,196,345 99,840,684
Loudspeakers, Nesoi* 8518290000 9,044,996 210,768,025
Headphones, Earphones, Microphones/Speakers, Nesoi* 8518302000 5,387,497 162,113,687
Audio Frequency Electric Amplifiers, Nesoi* 8518402000 763,192 221,549,356
Electric Sound Amplifiers Sets 8518500000 191,145 72,818,932
Microphone, Loudspeaker and Amplifier Parts 8518903000 – 179,741,334
Upright Pianos 9201100000 1,055 2,252,920
Grand Pianos 9201200000 730 15,081,502
Pianos, Nesoi* 9201900000 1,042 1,461,815
Stringed Musical Instruments, Played with a Bow 9202100000 4,587 3,687,818
Guitars 9202903000 127,060 102,732,764
Stringed Musical Instruments, Nesoi* 9202906000 51,517 13,983,941
Brasswind Instruments 9205100000 21,125 22,704,435
Woodwind Instruments, Nesoi* 9205901000 36,742 16,690,090
Keyboard, Pipe Organs, Etc., with Free Metal Reeds 9205901300 538 256,999
Accordions and Similar Instruments 9205901600 704 217,499
Mouth Organs 9205901900 2,682 178,494
Wind Instruments, Nesoi* 9205906000 17,315 1,265,591
Percussion Musical Instruments 9206000000 1,329,267 59,468,489
Music Synthesizers, Other Than Accordions 9207100020 19,729 12,937,666
Keyboard Instruments, Other Than Accordions, Nesoi* 9207100080 19,221 7,894,145
Fretted Stringed Instruments 9207900040 187,616 143,056,967
Musical Instruments, Electrically Amplified, Nesoi* 9207900080 139,625 24,169,175
Music Boxes 9208100000 105,365 4,607,761
Mouth-Blown Sound Signalling Instruments, Nesoi* 9208900080 248,439 7,366,688
Musical Instrument Strings 9209300000 23,122,563 74,099,164
Parts and Accessories for Pianos 9209910000 – 5,333,111
Parts and Accessories for Stringed Instruments 9209920000 – 40,063,877
Parts and Accessories for Keyboards 9209940000 – 40,635,785
Metronomes, Tuning Forks and Pitch Pipes 9209990500 – 386,605
Other Parts and Accessories 9209997000 – 31,810,494
*Nesoi: Not Elsewhere Specified Or Indicated. Source: The U.S. Census Bureau, 2015
48This copy belongs to Chris Parks

0
100
200
300
400
500
600
'15'14'13'12'11'10'09'08'07'06
Number of Import Units(in millions)
5-Year Change
‘14 – ’15 Change
13.4%
4.6%
0
100
200
300
400
500
600
'15'14'13'12'11'10'09'08'07'06
Number of Export Units(in millions)
5-Year Change
‘14 – ’15 Change
5.2%
6.1%
0
1
2
3
4
5
6
'15'14'13'12'11'10'09'08'07'06
Value of U.S. Exports(in billions of Dollars)
5-Year Change
‘14 – ’15 Change
10.4%
8.2%
0
1
2
3
4
5
6
'15'14'13'12'11'10'09'08'07'06
Value of U.S. Imports(in billions of Dollars)
5-Year Change
‘14 – ’15 Change
31.9%
1.9%
U.S. IMPORTS AND EXPORTS OF MUSIC AND SOUND PRODUCTS
U.S. Imports and Exports
49This copy belongs to Chris Parks

Top 15 U.S. Music Product Export Destinations (in millions of Dollars)
$0 $50 $100 $150 $200 $250 $300 $350 $400
Brazil
Belgium
Italy
France
Singapore
China
Australia
S. Korea
Hong Kong
U.K.
Netherlands
Germany
Mexico
Japan
Canada
Export Value
The United States exported music products to a total of 184 countries in 2015.
Canada22%
Japan13%
Mexico12%
Netherlands5%
Others43%
Germany6%
Top 15 Sources of Music Product Imports to the United States
(in millions of Dollars)
$0 $500 $1000 $1500 $2000 $2500 $3000 $3500
Hong Kong
Italy
Vietnam
U.K.
France
S. Korea
Canada
Thailand
Germany
Taiwan
Malaysia
Japan
Indonesia
Mexico
China
Import Value
The United States imported music products from a total of 109 countries in 2015.
Mexico17%
Japan3%
Malaysia2%
Indonesia3%
Others16%China
59%
50This copy belongs to Chris Parks

0.0
0.5
1.0
1.5
2.0
2.5
3.0
3.5
4.0
4.5
'15'14'13'12'11'10'09'08'07'06
Upright Piano Exports
Reta
il Va
lue
in $
mill
ions
Uni
ts x
1,0
00
Export Value Units
0.0
0.4
0.8
1.2
1.6
2.0
'15'14'13'12'11'10'09'08'07'06
0
5
10
15
20
25
30
35
40
45
'15'14'13'12'11'10'09'08'07'06
Upright Piano Imports
Reta
il Va
lue
in $
mill
ions
Uni
ts x
1,0
00
Import Value Units
0
5
10
15
20
25
30
'15'14'13'12'11'10'09'08'07'06
0
20
40
60
80
100
120
'15'14'13'12'11'10'09'08'07'06
Guitar Exports
Reta
il Va
lue
in $
mill
ions
Uni
ts x
1,0
00
Export Value Units
0
25
50
75
100
125
150
175
'15'14'13'12'11'10'09'08'07'06
2.0
0
20
40
60
80
100
120
140
'15'14'13'12'11'10'09'08'07'06
Guitar Imports
Reta
il Va
lue
in $
mill
ions
Uni
ts x
1,0
00,0
00
Import Value Units
0.0
0.5
1.0
1.5
2.0
2.5
3.0
'15'14'13'12'11'10'09'08'07'06
2.0
0
3
6
9
12
15
18
'15'14'13'12'11'10'09'08'07'06
Grand Piano Exports
Reta
il Va
lue
in $
mill
ions
Uni
ts x
1,0
00
Export Value Units
0.0
0.2
0.4
0.6
0.8
1.0
1.2
1.4
'15'14'13'12'11'10'09'08'07'06
0
10
20
30
40
50
60
70
80
90
'15'14'13'12'11'10'09'08'07'06
Grand Piano Imports
Reta
il Va
lue
in $
mill
ions
Uni
ts x
1,0
00
Import Value Units
0
4
8
12
16
20
'15'14'13'12'11'10'09'08'07'06
2.0
U.S. Imports and Exports
51This copy belongs to Chris Parks

0
5
10
15
20
25
30
'15'14'13'12'11'10'09'08'07'06
Brasswind Exports
Reta
il Va
lue
in $
mill
ions
Uni
ts x
1,0
00
Export Value Units
0
5
10
15
20
25
'15'14'13'12'11'10'09'08'07'06
2.0
0
10
20
30
40
50
60
70
'15'14'13'12'11'10'09'08'07'06
Brasswind Imports
Reta
il Va
lue
in $
mill
ions
Uni
ts x
1,0
00
Import Value Units
0
50
100
150
200
250
300
'15'14'13'12'11'10'09'08'07'06
2.0
0
4
8
12
16
20
'15'14'13'12'11'10'09'08'07'06
Woodwind Exports
Reta
il Va
lue
in $
mill
ions
Uni
ts x
1,0
00
Export Value Units
0
10
20
30
40
50
'15'14'13'12'11'10'09'08'07'06
2.0
0
20
40
60
80
100
120
'15'14'13'12'11'10'09'08'07'06
Woodwind Imports
Reta
il Va
lue
in $
mill
ions
Uni
ts x
1,0
00,0
00
Import Value Units
0.0
0.5
1.0
1.5
2.0
2.5
3.0
3.5
4.0
'15'14'13'12'11'10'09'08'07'06
2.0
0
10
20
30
40
50
60
70
'15'14'13'12'11'10'09'08'07'06
Drum & Percussion Exports
Reta
il Va
lue
in $
mill
ions
Uni
ts x
1,0
00,0
00
Export Value Units
0.0
0.2
0.4
0.6
0.8
1.0
1.2
1.4
'15'14'13'12'11'10'09'08'07'06
0
20
40
60
80
100
'15'14'13'12'11'10'09'08'07'06
Drum & Percussion Imports
Reta
il Va
lue
in $
mill
ions
Uni
ts x
1,0
00,0
00
Import Value Units
0.0
0.4
0.8
1.2
1.6
2.0
'15'14'13'12'11'10'09'08'07'06
52This copy belongs to Chris Parks

International Data
INTERNATIONAL DATA
ARGENTINA 55
AUSTRALIA 62
AUSTRIA 73
BRAZIL 80
CANADA 88
CHINA 100
CZECH REPUBLIC 111
FINLAND 118
FRANCE 124
GERMANY 131
HUNGARY 142
INDIA 151
ITALY 160
JAPAN 174
MEXICO 188
NETHERLANDS 196
NORWAY 203
RUSSIA 209
SOUTH KOREA 216
SPAIN 222
SWEDEN 232
SWITZERLAND 239
UNITED KINGDOM 245
53This copy belongs to Chris Parks

UNDERSTANDING THE INTERNATIONAL DATA
To present a global overview of the music products industry, we are pleased to feature 23 countries in the International section this year: Argentina, Australia, Austria, Brazil, Canada, China, Czech Republic, Finland, France, Germany, Hungary, India, Italy, Japan, Mexico, Netherlands, Norway, Russia, South Korea, Spain, Sweden, Switzerland, and the United Kingdom. The demographic, economic and trade data shown in each country/region’s “Snapshot” section are gathered from the CIA World Factbook, unless otherwise noted. The music industry data are provided by The Music Trades, also unless otherwise noted, and reflects a 10-year historical trend, with the year 2014 being the most recent published by The Music Trades.
Top Global Market Sales Share
0 5
10 15
20 25 30 35 40 45
Belgium
Netherlands
Mexico
Brazil
S. Korea
Australia
Italy
U.K.
Canada
France
Germany
China
Japan
U.S. 42.0%
8.9%
6.0%
4.5%
4.4%
8.2%
3.3%
2.3%
2.2%
1.8%
1.7%
1.1%
0.9%
1.2%
0
4
8
12
16
20
'14'13'12'11'10'09'08'07'06'05
Global Music Products Sales
Valu
e in
$ b
illio
ns
54This copy belongs to Chris Parks

International Data
AR
GE
NTIN
A
ARGENTINA
In 2015, Argentina entered its 12th year under the presidential administrations of Nestor (2003–2008) and Cristina (2008–2011) Kirschner. The husband/wife political team had each taken four-year turns as president, and Nestor was expected to run again in 2008, but he passed away unexpectedly in late 2010. Cristina ran for reelection in 2011 and won the race with 54% on a populist ticket.
Over the next few years, Argentina’s economy continued to endure numerous challenges that left the country in a precarious position. The Argentinean peso had become artificially inflated, causing a drastic drop in exported goods, and, as a result, the country seemed to lose its competitive advantage. And while there was a large demand for musical instruments, amps, PA systems, lighting, etc., imports into the country were extremely limited, thus preventing Argentina’s MI industry from realizing its real potential.
In 2015, Argentinians elected Mauricio Macri to be their new president. Surrounded by a “dream team” of advisors, Macri set out to tackle some of the nation’s most complicated problems, including Argentina’s over-inflated currency. As a result, the peso was devalued by 40 percent, and the economy slowly started to roll. Unfortunately, this shift also caused prices to rise more than expected, resulting in decreased sales of many goods. Other obstacles included an historic fight over unpaid government debts, as well as the challenge of fighting internal distortions. Despite these issues, those backing President Macri remained hopeful that the country would recover.
Due to the past 12 years of living with an artificially high currency—a time when more than 1,000% inflation destroyed the value of our peso—2016 is expected to be a difficult year for the Argentinean economy. We must now pay the new, far-higher prices for public services (gas, electricity, clean water, transportation, communications, etc.) and endure the expected recession. However, we believe that, after a period of sacrifice, a brilliant future lies ahead for our country.
Commentary by Alfredo Campanelli, Founder of Import Music Argentina
DOING BUSINESS IN ARGENTINA
Market Overview• The United States exported US$10.8 billion in goods to Argentina in 2014 and
purchased US$4.4 billion. In services, the United States exported US$7.1 billion and Argentina sold US$1.9 billion. The United States supplies raw materials, intermediate goods and capital goods to feed Argentina’s industrial sector while Argentina exports food, wine and agricultural products as well as intermediate goods.
• About 90% of U.S. exports to Argentina are used in local industry and agriculture such as computers, industrial and agricultural chemicals, agricultural and transportation equipment, machine tools, parts for oil field rigs, and refined fuel oil. Argentine exports include goods such as wine, fruit juices, crude oil and intermediate goods like seamless pipe, tubes and other iron-based products.
Argentina
55This copy belongs to Chris Parks

• More than 500 U.S.-based companies operate in Argentina, employing 360,000 Argentines directly and supporting millions more indirectly. The stock of U.S. investment in Argentina reached US$15.2 billion in 2013 and is concentrated in energy, manufacturing, information technology and finance.
• U.S. firms operating in Argentina impact the Argentine economy and society positively and are widely respected for their corporate governance, the quality of the work environment they provide to their Argentine employees, their transparency and their work in corporate social responsibility.
Top Five reasons for Doing Business in Argentina• Argentina is a resource-rich country with huge potential.
• Its population is highly literate and well-educated. There are strong cohorts of professionals in medicine, business, law, accounting, engineering, architecture, etc.
• The country is digitally capable, with high Internet and smartphone penetration.
• Income distribution is more equal than in most Latin American countries, with a broad and deep middle class that enables more consumer buying power.
• Argentina’s infrastructure requires major updating and renewal, providing significant opportunity for exporters of equipment and services for roads, ports, railroads, telecommunications, water and sanitation, and electric power, among others.
Market Challenges• Slowing economic growth, import and foreign-exchange restrictions, and sharply
lower prices for Argentina’s principal exports (soy products and corn) make the outlook for the Argentine economy uncertain in 2015, with growth estimates of slightly negative to 3%.
• Inflation estimated at 30% or higher in 2014 and 20%–24% in 2015 by private economists has raised costs and resulted in a more challenging business environment, especially as the real effective exchange rate has significantly appreciated since the January 2014 devaluation.
• Limits on profit, royalty and licensing remittances have discouraged new investment in Argentina. Lack of transparency and a public comment period for new regulations adds to business uncertainty, as do questions about government statistics.
• All importers must request approval from the Argentine Tax and Customs Authority (AFIP) prior to making each purchase for import and, separately, to purchase the foreign currency to pay for it. The GOA’s policy of tying approvals to changes in the trade balance and foreign exchange levels has added to uncertainty. The United States, EU and Japan won a WTO trade complaint against Argentina; the final resolution is pending.
argentina
argentina
56This copy belongs to Chris Parks

International DataArgentina
Argentina’s continuing dispute with investors who did not accept the 2005 and 2010 restructurings of its foreign obligations has led to Argentina being currently ineligible for coverage under U.S. programs (Exim Bank, OPIC and the Trade Development Agency) designed to assist American companies.
Market Opportunities• Argentina is an attractive market for American exporters, with a large (42 million) and
educated population, abundant natural resources such as in agriculture, mining, and unconventional hydrocarbons, and important infrastructure needs.
• As Argentina addresses its current economic challenges, opportunities will increase. This is an excellent time to begin exploring the market and establishing relationships.
Market-Entry Strategies • Marketing U.S. products and services in Argentina requires a high level of research,
preparation and involvement.
• Companies intending to export to Argentina need to ensure that their customers fulfill all import requirements before they ship any product and must be careful to follow all regulations precisely.
• U.S. companies exporting to Argentina typically market their products and services through Argentine agents, representatives and distributors.
• Close personal relationships are important.
• U.S. companies must consider Argentina’s unique economic, demographic and cultural characteristics, which distinguish it from other Latin American countries.
• It is increasingly difficult to establish a “typical customer” due to new consumption habits and to the dynamics of income distribution and demography.
• Promotion is an important marketing component. Companies are encouraged to visit or exhibit at local and regional trade shows, and to visit trade shows in the United States attended by Argentine buyers.
• U.S. firms should protect their intellectual property and engage qualified local professionals and lawyers in contract negotiations.
“Doing Business in Argentina” article is provided by the U.S. Commercial Service, the trade promotion arm of the U.S. Department of Commerce’s International Trade Administration. For more information on doing business in Argentina, you may visit their website at www.export.gov/Argentina.
The following charts are based on import and export data obtained from the website of the International Trade Centre (ITC)
argentina
57This copy belongs to Chris Parks

Demographics
65+11.6%
0–1424.8%
15–64 63.6%
Economy
GDP-Industry29.1%
GDP-Service60.4%
GDP-Agriculture10.5%
Population in millions 43.4
Median Age 31.4Population Growth 0.93%
0
200
400
600
800
1000
'15'14'13'12'11'10'09'08'07'06'05'04
Argentina GDP (PPP)(U.S. $ in billions)
0
2
4
6
8
10
12
14
16
'15'14'13'12'11'10'09'08'07'06'05'04
Unemployment Rate(Percent)
0
5
10
15
20
25
30
35
40
'15'14'13'12'11'10'09'08'07'06'05'04
In�ation (Annual Percent Rate)
ARGENTINA SNAPSHOT
Demographics
Economy
Age Male Female
0–14 5.50 5.24
15–64 13.83 13.84
65 & Over 2.09 2.93
GDP (PPP) $964.3 billion
GDP Per Capita $22,400
GDP-Real Growth Rate 0.40%
Unemployment Rate 7.60%
Inflation 27.60%
Data Source: Demographics, Economy and Trade from CIA World Factbook, Music Industry from The Music Trades. GDP (PPP): Gross Domestic Product based on purchasing-power-parity (PPP) valuation of country GDP in U.S. dollars.
58This copy belongs to Chris Parks

International DataArgentina Snapshot
0
5
10
15
20
25
ChileU.S.ChinaBrazil
Export Partners (2015)
Ann
ual P
erce
ntag
e
0
5
10
15
20
25
BoliviaGermanyU.S.ChinaBrazil
Import Partners (2015)
Ann
ual P
erce
ntag
e
Music Sales Per Capita(U.S. $)
0.0
0.5
1.0
1.5
2.0
2.5
'14'13'12'11'10'09'08'07'06'05
Argentina Music Market(U.S. $ in millions)
0
20
40
60
80
100
'14'13'12'11'10'09'08'07'06'05
Trade
Music Industry
Share of Global Music Market(Percent)
0.0
0.1
0.2
0.3
0.4
0.5
0.6
0.7
'14'13'12'11'10'09'08'07'06'05
Total Export $69.9 billion Export as % of GDP 7.25%
Total Import $60.6 billion Import as % of GDP 6.28%
Music Market $66.5 million
Sales Per Capita $1.53
Global Share 0.40%
59This copy belongs to Chris Parks

Argentina Imports and Exports
0.0
0.2
0.4
0.6
0.8
1.0
1.2
1.4
'15'14'13'12'11'10'09'08'07'06
Keyboard InstrumentsExports
Valu
e in
U.S
. $ m
illio
ns
Export Value
0
1
2
3
4
5
6
'15'14'13'12'11'10'09'08'07'06
Fretted & Stringed InstrumentsImports
Valu
e in
U.S
. $ m
illio
ns
Import Value
0
5
10
15
20
25
'15'14'13'12'11'10'09'08'07'06
Keyboard InstrumentsImports
Valu
e in
U.S
. $ m
illio
ns
Import Value
0
50
100
150
200
250
300
350
400
450
'15'14'13'12'11'10'09'08'07'06
Fretted & Stringed InstrumentsExports
Valu
e in
U.S
. $ th
ousa
nds
Export Value
0
200
400
600
800
1000
1200
1400
'15'14'13'12'11'10'09'08'07'06
Acoustic PianosImports
Valu
e in
U.S
. $ th
ousa
nds
Import Value
0
20
40
60
80
100
120
140
'15'14'13'12'11'10'09'08'07'06
Acoustic PianosExports
Valu
e in
U.S
. $ th
ousa
nds
Export Value
60This copy belongs to Chris Parks

International DataArgentina
0
20
40
60
80
100
120
'15'14'13'12'11'10'09'08'07'06
PercussionExports
Valu
e in
U.S
. $ th
ousa
nds
Export Value
0
1
2
3
4
5
6
7
8
'15'14'13'12'11'10'09'08'07'06
PercussionImports
Valu
e in
U.S
. $ m
illio
ns
Import Value
0
1
2
3
4
5
6
7
'15'14'13'12'11'10'09'08'07'06
AccessoriesImports
Valu
e in
U.S
. $ m
illio
ns
Import Value
0
20
40
60
80
100
120
'15'14'13'12'11'10'09'08'07'06
Wind InstrumentsExports
Valu
e in
U.S
. $ th
ousa
nds
Export Value
0.0
0.2
0.4
0.6
0.8
1.0
1.2
1.4
1.6
1.8
'15'14'13'12'11'10'09'08'07'06
AccessoriesExports
Valu
e in
U.S
. $ m
illio
ns
Export Value
0.0
0.5
1.0
1.5
2.0
2.5
3.0
3.5
4.0
4.5
'15'14'13'12'11'10'09'08'07'06
Wind InstrumentsImports
Valu
e in
U.S
. $ m
illio
ns
Import Value
Argentina Imports and Exports
61This copy belongs to Chris Parks

AU
STR
ALIA
AUSTRALIA
The year 2015 saw an uplift in the overall market with an 8% increase in value over 2014 and around 11% over two years ago. While it does not really reflect the full value of the currency devaluation during that time, it would be welcome news for most of the industry. Import value of AUS$256 million is the best since 2009 — after which time it headed south — import values getting down to the low AUS$200 million mark. The United States has largely bounced back year-on-year since the global financial crises (GFC) and aftermath, and this is reflected in our numbers over a similar period.
The Keyboard category posted quite a good result overall, and continued an upward path over the 2013–15 comparison period. Electronic Keyboards were on the rise again, with the Average Unit Value up almost across the board and digitals positing very strong gains year-on-year of more than 20%. Acoustics added nearly 10% in import value in 2015. Band and Orchestra surprised, especially the December quarter results. All the major lines in the category being brass, flutes, clarinets and saxophones are pretty strong with gains over around 15% in both volume and value.
Other wind pulls the volume down a bit but against the increase in high-value products, this is of little consequence. Percussion generally experienced a 12% bounce in the past year. Drum kits were up and other percussion was up too — a welcome change in this segment’s fortunes. Orchestral strings can be a bit up and down — 2015 was an up year.
There were also some quite high-value European imports during 2015, which also drives up the segment value. In the Guitar category, a big increase in the value of guitar strings of AUS$1.4 million over the previous year provided a real reflection of exchange rate movements. It may reflect some delivery overlaps when comparing the 2014 value reported, but still the result would seem to reflect the current health of the Guitar category.
Acoustics are powering on with another record year of 157,000 units imported, with a big value increase over the last two years. Electrics are still in decline year-on-year, but a surge in bass guitar numbers compensated. The overall volume was about par with 2014 but value was up by nearly 9% across the category. Electronic Instruments see a notable increase in Synths, while the “Other” segment (thought to be driven by e-drums) slowed its growth pattern of the previous two years, as did Turntables.
Audio numbers revealed that some big, high-value mixers came in, helping to push up value. Volume growth is mostly based around speakers with most other products thereabouts, but the segment showed modest gains of nearly 5% in value. The wireless mic replacement peak may be over; it will be interesting to see if volumes drop again next year back to 130,000 or so units and whether that will be a new benchmark on which to move forward.
It was a soft year for traditional products but they have been on a roll for the last decade. Given ukuleles’ fall into this category, it feels though a shipment was late such was the downturn, but this may readjust itself by the first quarter of 2016. Accessories were up by 12%. Like guitar strings, this might reflect the real cost increase over the year.
The electric guitar market continues to be soft along with acoustic percussion, perhaps revealing a worrying trend in the product markets that have driven the industry for so long.
australia
62This copy belongs to Chris Parks

International DataAustralia
australia
Live performance and a buzzing live scene drives our market, and there has been a notable shift in the way many people make music.
How the industry fared depends on who you talk to, but based on the numbers the fundamentals are improving — the increase in value especially sets up a platform for future growth following a difficult period since the GFC. The continuing decline in international online, would reflect the perceived “threat” to the industry diminishing somewhat, especially with the way the exchange rate finished the year. The trend, we would hope, would continue as the abolishment of the Low Value Threshold on GST affecting the attractiveness of buying off-shore.
The Music Trades reports that the retail value of the U.S. market was flat. “The disparate collection of products that make up what we call the music products industry benefited from modest improvements in employment levels and consumer confidence, as well as plummeting prices of petroleum products-estimated to save every U.S. household US$1,100. However, these positives were offset by decreasing retail selling prices in many product categories.” The sales value gain of just 0.8% over 2014 did not keep pace with official U.S. economy growth rates of 2.1%. The magazine recently reflected that a lack of product innovation was limiting the growth potential of the market. This can probably be traced back to the period following the GFC. Businesses struggled to survive, let alone have the money for major R&D, so new product development lags.
2015 Snapshot – Reserve Bank of Australia3% Economic growth, better than forecast1.7% Inflation6% Unemployment2% Interest rates1.4% Population increase to 23.8mYear closed with national savings declining to 7.6%CPI rose 1.7% for the 12 months ended December 2015.
Consumer confidence remained flat in the first half, although we saw some sporadic improvements in retail activity. (Christmas retail sales showed a healthy year-on-year rise as the year came to a close.) However, business confidence is down as reflected in business investment. Capital expenditure is now 20% lower than where it was 12 months ago, and this is the crucial missing element for our economy’s growth outlook, according to Macquarie Bank analysts. Over the past 12 months the Reserve Bank of Australia (RBA) has cut the official interest rate by a combined total of 0.5%, to 2% and by another 0.25% as we write this report.
The Australian dollar depreciated against the U.S. dollar by 20%, 3% against the euro, and 7% against the Japanese yen in the first half of 2015. As these are our trading partners, that’s certainly helping our exporters by making them more competitive and helping to rebalance the economy. However, a weaker dollar will make imports more expensive. That could hurt discretionary spending, which is key to driving growth.
63This copy belongs to Chris Parks

australia
The price of oil is 45% below where it was 12 months ago, with benefits to both industry and households. The GDP reading shows the economy would grow annually at 2.3%, with 1.3% still largely mining related, so consumer, business and government activity account for the balance of 1%. In the second half of 2015, one could say, “What a difference a change of political leadership makes!”
According to an ANZ-Roy Morgan consumer confidence survey, the headline index rose 1.2% to 116.6, extending the bounce in sentiment to a third consecutive week. In November 2015 the index sat at its highest level seen since January 2014.
Commentary by Rob Walker, Executive Officer of the Australian Music Association (AMA)
DOING BUSINESS IN AUSTRALIA
Market OverviewAustralia is the world’s 12th largest economy with a GDP of US$1.6 trillion, and its real GDP is projected to increase by 3.2% in 2016, after a 2.8% increase in 2015. Australia’s per-capita GDP of over US$67,463 is among the highest in the world; the economy recorded 23 years of uninterrupted annual growth to 2014. Growth in commodity exports to Asia buoyed Australia through the Global Financial Crisis but adversely affected the manufacturing and services sectors because of the strong Australian dollar. The 2015 downturn in the global commodity cycle has impacted Australia’s economy. Despite this decline in resource-related investment, Australia remains a vibrant and important market for U.S. goods and services.
• In terms of size, Australia continues to be among the top five export markets for U.S. mining and agricultural equipment and technology.
• The United States has one of its largest trade surpluses with Australia.
• In the Organisation for Economic Co-operation and Development (OECD), Australia ranks in the top five in terms of average household disposable income.
• There is a Free Trade Agreement between the United States and Australia that has effectively eliminated tariffs on most goods.
• International trade holds a proportionately larger share of the Australian economy. Australians are accustomed to sourcing from overseas.
Australia is generally welcoming to foreign investment, and the country’s investment climate is conducive to investment from the United States. In 2014, the United States. was
australia
64This copy belongs to Chris Parks

International Data
australia
Australia’s largest source of Foreign Direct Investment (FDI) stock, totaling US$159 billion of investment or approximately 24% of all FDI in Australia. Australia is the United States’ 15th largest export market and third largest trading partner. U.S. direct investment in Australia is led by mining, finance and insurance, and manufacturing sectors.
The Commonwealth Government declared when it came into office in September 2013 that Australia was “open for business.” The government pledged to reduce levels of bureaucracy to encourage investment. Since coming to office, the government has repealed a tax on carbon emissions and a tax on mining company profits, sought to reduce the number of regulatory measures and position Australia as an open and investment-friendly destination. The government has also embarked on wide-ranging reviews of national competition policy, labor market reform, taxation policy, and productivity. Since coming into force on January 1, 2005, the Australia-U.S. Free Trade Agreement (AUSFTA) has introduced reduced tariffs, increased quotas and investment thresholds, provided greater intellectual property protection, and fostered greater two-way investment. Since the agreement entered into force, Australian companies have gained access to the U.S. federal government procurement market and over 99% of U.S. exports of consumer and industrial goods now enter Australia duty-free. Since AUSFTA came into force in 2005, U.S. goods exports to Australia have risen from a nominal US$13.96 billion in 2004 to US$26.67 billion in 2014, an increase of 91% in dollar terms. In accordance with tariff eliminations agreed as part of the AUSFTA, a number of changes occurred on January 1, 2015, in line with the 10th anniversary of the agreement coming into force. Remaining U.S. tariffs on wine, and textiles and apparel were removed. There was an increase in the duty-free tariff rate quotas for Australian exports of beef, dairy, tobacco, cotton, peanuts and avocados, and the remaining Australian tariffs on textiles and apparel were also removed. Australia has a well-established legal and court system for the conduct or supervision of litigation and arbitration, as well as alternate dispute processes. The country is a world leader in the development and provision of non-court dispute resolution mechanisms, and is a signatory to all the major international dispute-resolution conventions. There are few disputes that involve foreign investors. Australia has an AAA international credit rating with a well-developed, deep and sophisticated financial market that is regulated in accordance with international norms. Australia’s four leading banks are highly ranked in terms of financial security and international rankings. Australia has a large services sector (over 70% of GDP), but is also a significant resources, energy and food exporter. The country’s abundant and diverse resources attract high levels of foreign investment and include extensive reserves of coal, iron ore, copper, gold, natural gas, uranium, and renewable energy sources. A series of major investments, such as the US$52 billion Gorgon LNG project led by Chevron, will significantly expand the resources sector. Currently there is a large investment pipeline, but slowing commodity prices and high project costs have led to a significant decline in the value of the investment pipeline.
Australia
65This copy belongs to Chris Parks

• We advise American firms examining the Australian market to pay attention to macro measures of opportunity, which give it more purchasing power relative to that in less- developed economies. Along with the Free Trade Agreement, the case for entering or expanding in the Australian market is stronger than the population of 23 million might suggest.
• Australia’s relative market appeal remains convincing, with few barriers to entry, a familiar legal and corporate framework, sophisticated consumer and industrial sectors, and a straightforward, English-speaking business culture. The Australia-U.S. Free Trade Agreement enhanced the long and successful trading relationship by eliminating tariffs on almost all U.S. manufactured and agricultural goods.
We believe 2015 will continue to show demand for American companies with innovative products and technologies in the Australian market. We invite you to contact us to help you analyze and execute your objectives for the Australian market.
Market Challenges• Australia’s distance from the rest of the world, large land area and relatively small
population has led to market dominance by a few large firms in certain sectors.
• Australia is integrated into the world economy and remains a commercial and financial center for the region. American companies will find that Australian and third-country competitors in Australia have some long-established brands with strong reputations and existing supplier relationships.
• Australia has ready access to Asian and other low-cost producers. American firms must therefore demonstrate sufficient added value to overcome the costs of getting the product to market, and to compete.
Market OpportunitiesIn terms of broad merchandise trade categories, the United States is a major exporter to Australia of transportation equipment, machinery, chemicals, electronic products, fabricated metal products, processed foods, electrical equipment, plastics and rubber products, primary metal products, and agricultural products and equipment. Specific product/service sectors that we have identified as representing strong prospects for U.S. exporters are pleasure craft; aircraft and parts; agricultural machinery; medical equipment; information technology services; tourism; and smart grid technology.
Market-Entry Strategies• Successful market entry strategies for Australia have three common elements:
understanding the market, selecting the optimal partner, and providing ongoing support to that partner in the market.
• A common language and familiar business framework may lead Americans to overlook Australia’s cultural and market differences. It is vital to first gain an understanding of the Australian context for a product or service, its competitors, standards, regulations, sales channels and applications.
australia
australia
66This copy belongs to Chris Parks

International Data
• Success in the Australian market often requires establishing a local sales presence. For many American exporters, this means appointing an agent or distributor. The bounds of that appointment are negotiated and may include only certain states of Australia, the entire country or New Zealand as well.
• The distance from many of their trading partners and the sheer size of the Australian continent—comparable to the continental U.S.—causes Australian firms to stress the importance of local support and service. American companies should visit Australia both to meet prospective partners and demonstrate ongoing support, as this is the common practice of their competitors.
Most of the criteria American firms use to select agents or distributors are applicable to Australia, with expectations adjusted to the scale of the market given the population of 23 million. Performing due diligence is just as important as in the United States, and we offer resources to assist in that work.
“Doing Business in Australia” article is provided by the U.S. Commercial Service, the trade promotion arm of the U.S. Department of Commerce’s International Trade Administration. For more information on doing business in Australia, you may visit their website at www.export.gov/Australia.
The following charts are based on import data as a proxy to the domestic markets collected by the Australian Bureau of Statistics (ABS) in association with the Australian Music Association (AMA)
australia
Australia
67This copy belongs to Chris Parks

Demographics
65+15.5%
0–1417.9%
15–64 66.6%
Economy
GDP-Industry28.9%
GDP-Agriculture3.7%
GDP-Service67.4%
AUSTRALIA SNAPSHOT
Population in millions 22.7
Median Age 38.4Population Growth 1.07%
0.0
0.2
0.4
0.6
0.8
1.0
1.2
1.4
1.6
'15'14'13'12'11'10'09'08'07'06'05'04
Australia GDP (PPP)(U.S. $ in trillions)
Import Value Units
0
5
10
15
20
25
0403020100999897960
1
2
3
4
5
6
7
8
9
'15'14'13'12'11'10'09'08'07'06'05'04
Unemployment Rate (Percent)
0
1
2
3
4
5
'15'14'13'12'11'10'09'08'07'06'05'04
In�ation (Annual Percent Rate)
Demographics
Economy
Data Source: Demographics, Economy and Trade from CIA World Factbook, Music Industry from The Music Trades. GDP (PPP): Gross Domestic Product based on purchasing-power-parity (PPP) valuation of country GDP in U.S. dollars.
Age Male Female
0–14 2.09 1.98
15–64 7.69 7.47
65 & Over 1.63 1.89
GDP (PPP) $1.49 trillion
GDP Per Capita $65,400
GDP-Real Growth Rate 2.40%
Unemployment Rate 6.20%
Inflation 1.90%
68This copy belongs to Chris Parks

International DataAustralia Snapshot
0
5
10
15
20
25
30
35
U.S.S. KoreaJapanChina
Export Partners (2015)
Ann
ual P
erce
ntag
e
0
5
10
15
20
25
S. KoreaGermany
SingaporeJapan
U.S.China
Import Partners (2015)
Ann
ual P
erce
ntag
e
Trade
Music Industry
Music Sales Per Capita(U.S. $)
0
4
8
12
16
20
'14'13'12'11'10'09'08'07'06'05
Share of Global Music Market(Percent)
0.0
0.5
1.0
1.5
2.0
2.5
'14'13'12'11'10'09'08'07'06'05
Australia Music Market(U.S. $ in millions)
0
50
100
150
200
250
300
350
400
'14'13'12'11'10'09'08'07'06'05
Total Export $184.4 billion Export as % of GDP 12.38%
Total Import $208.4 billion Import as % of GDP 14.00%
Music Market $372.0 million
Sales Per Capita $16.35
Global Share 2.20%
69This copy belongs to Chris Parks

0
5
10
15
20
25
30
35
40
45
'15'14'13'12'11'10'09'08'07'06
Acoustic & Acoustic-Electric Guitars
Uni
ts x
1,0
00
025
50
75
100
125
150
175
040302010099989796
0
25
50
75
100
125
150
175
'15'14'13'12'11'10'09'08'07'06
Valu
e in
Aus
tral
ian
$ m
illio
ns
Retail Value Units
0
2
4
6
8
10
12
14
'15'14'13'12'11'10'09'08'07'06
Bass Guitars
Valu
e in
Aus
tral
ian
$ m
illio
ns
Uni
ts x
1,0
00
Retail Value Units
0
50
100
150
200
250
300
040302010099989796
0
5
10
15
20
25
'15'14'13'12'11'10'09'08'07'06
0
10
20
30
40
50
60
70
'15'14'13'12'11'10'09'08'07'06
Electric Guitars
Uni
ts x
1,0
00
0
20
40
60
80
100
120
040302010099989796
0
20
40
60
80
100
120
'15'14'13'12'11'10'09'08'07'06
Valu
e in
Aus
tral
ian
$ m
illio
ns
Retail Value Units
0
20
40
60
80
100
120
'15'14'13'12'11'10'09'08'07'06
Total Guitars
Valu
e in
Aus
tral
ian
$ m
illio
ns
Uni
ts x
1,0
00
Retail Value Units
0
50
100
150
200
250
300
040302010099989796
0
50
100
150
200
250
300
'15'14'13'12'11'10'09'08'07'06
0
5
10
15
20
25
30
35
40
'15'14'13'12'11'10'09'08'07'06
Grand Pianos
0.0
0.3
0.6
0.9
1.2
1.5
05040302010099989796
Valu
e in
Aus
tral
ian
$ m
illio
ns
Uni
ts x
1,0
00Retail Value Units
0.0
0.3
0.6
0.9
1.2
'15'14'13'12'11'10'09'08'07'06
0
5
10
15
20
25
30
35
40
'15'14'13'12'11'10'09'08'07'06
Upright Pianos
0
1
2
3
4
5
6
7
040302010099989796
Valu
e in
Aus
tral
ian
$ m
illio
ns
Uni
ts x
1,0
00
Retail Value Units
0
1
2
3
4
5
6
7
8
'15'14'13'12'11'10'09'08'07'06
Australia Domestic Sales
70This copy belongs to Chris Parks

International DataAustralia
0
5
10
15
20
25
30
35
40
'15'14'13'12'11'10'09'08'07'06
Woodwind
Valu
e in
Aus
tral
ian
$ m
illio
ns
Uni
ts x
1,0
00
Retail Value Units
050
100
150
200
250
300
350
400
'15'14'13'12'11'10'09'08'07'06
0
2
4
6
8
10
12
'15'14'13'12'11'10'09'08'07'06
Orchestral Stringed Instruments
Valu
e in
Aus
tral
ian
$ m
illio
ns
Uni
ts x
1,0
00
Retail Value Units
0
5
10
15
20
25
30
35
040302010099989796
0
5
10
15
20
25
30
35
'15'14'13'12'11'10'09'08'07'06
0
3
6
9
12
15
'15'14'13'12'11'10'09'08'07'06
Brasswind
Valu
e in
Aus
tral
ian
$ m
illio
ns
Uni
ts x
1,0
00
Retail Value Units
0
2
4
6
8
10
12
040302010099989796
0
2
4
6
8
10
12
'15'14'13'12'11'10'09'08'07'06
0
5
10
15
20
25
30
'15'14'13'12'11'10'09'08'07'06
Digital Pianos
0
3 6
912
15
040302010099989796
Valu
e in
Aus
tral
ian
$ m
illio
ns
Uni
ts x
1,0
00
Retail Value Units
0
3
6
9
12
15
'15'14'13'12'11'10'09'08'07'06
0
5
10
15
20
25
30
35
40
45
'15'14'13'12'11'10'09'08'07'06
Percussion
Valu
e in
Aus
tral
ian
$ m
illio
ns
Uni
ts x
1,0
00
Retail Value Units
0
200
400
600
800
1000
'15'14'13'12'11'10'09'08'07'06
Percussion category includes drum kits, individual drums,cymbals, and educational and other percussion.
0
5
10
15
20
25
30
'15'14'13'12'11'10'09'08'07'06
Portable Keyboards
Valu
e in
Aus
tral
ian
$ m
illio
ns
Uni
ts x
1,0
00
Retail Value Units
0
20
40
60
80
100
040302010099989796
0
20
40
60
80
100
'15'14'13'12'11'10'09'08'07'06
Australia Domestic Sales
71This copy belongs to Chris Parks

Australia Domestic Sales
0
25
50
75
100
125
150
175
200
'15'14'13'12'11'10'09'08'07'06
Sound Reinforcement
Valu
e in
Aus
tral
ian
$ m
illio
ns
Uni
ts x
1,0
00
Retail Value Units
0
50
100
150
200
250
300
350
'15'14'13'12'11'10'09'08'07'06
Sound Reinforcement category includes speakers, self-contained ampli�ers, guitar and bass ampli�er sets (combo),signal processors, mixers, and multi-track systems.
0
5
10
15
20
25
30
35
'15'14'13'12'11'10'09'08'07'06
Printed Music
Valu
e in
Aus
tral
ian
$ m
illio
ns
Retail Value
Import Value Units0
10
20
30
40
50
60
'15'14'13'12'11'10'09'08'07'06
Microphones & Stands
Valu
e in
Aus
tral
ian
$ m
illio
ns
Uni
ts x
1,0
00
Retail Value Units
0
20
40
60
80
100
120
140
160
180
'15'14'13'12'11'10'09'08'07'06
0
2
4
6
8
10
12
'15'14'13'12'11'10'09'08'07'06
Computer Music Software
Valu
e in
Aus
tral
ian
$ m
illio
nsRetail Value
Import Value Units0
2
4
6
8
10
12
14
'15'14'13'12'11'10'09'08'07'06
DJ Products
Valu
e in
Aus
tral
ian
$ m
illio
ns
Uni
ts x
1,0
00Retail Value Units
0
5
10
15
20
25
040302010099989796
0
5
10
15
20
25
'15'14'13'12'11'10'09'08'07'06
0
5
10
15
20
25
30
'15'14'13'12'11'10'09'08'07'06
Digital Electronics
Valu
e in
Aus
tral
ian
$ m
illio
ns
Uni
ts x
1,0
00
Retail Value Units
0
5
10
15
20
25
30
'15'14'13'12'11'10'09'08'07'06
Digital Electronics category includes synthesizers, modules and other electronics.
72This copy belongs to Chris Parks

International DataAustria
AUSTRIA
• The Austrian market has declined slightly, down 100 million euros without VAT.
• Now as before, the market is dominated by keys (35%) and brass (24%), followed by fretted instruments (16%).
• Keys, brass and acoustic guitars are very stable. Brass is selling very well in the high-end price range.
• Activities of large- and medium-sized dealers were satisfactory on the whole, but small dealers are coming under increasing pressure and can survive only in the niche business — store closings have already begun and will continue in the coming years (20% – 30% are expected).
• Internet shops exist in Austria on a modest level; the online business is dominated by German companies.
• Fortunately, music education is generously supported in most regions of Austria by the government, states and cities. There are currently 2,200 brass bands and 390 music schools educating 220,000 students.
• In summary, it can be said that 2015 brought no major changes and we do not expect big changes this year.
Commentary by Otmar Hammerschmidt, Chairman of the Austrian Musical Instruments Retailer’s Association
DOING BUSINESS IN AUSTRIA
Market OverviewSome important facts about Austria and its market:
• Population of 8.5 million — a dynamic European Union Member State.
• Austria is an attractive location for regional headquarters for U.S. firms looking to expand in the region.
• Historical and economic ties to neighboring countries in Eastern Europe and the Balkans.
• Approximately 330 U.S. firms have subsidiaries, affiliates, franchisees and licensees in Austria; 100 of these companies have regional responsibilities for Central and Eastern Europe, including countries in the Balkan Peninsula.
AU
STR
IA
73This copy belongs to Chris Parks

austria
• Overall imports to Austria amounted to US$172.5 billion (at the 2014 annual average exchange rate of US$1.00 = EUR 0.75) in 2014 (source: Statistik Austria).
• U.S. exports to Austria amounted to US$5.95 billion, representing an increase of 3.3% from 2013 (source: Statistik Austria).
• Principal U.S. exports to Austria are machinery, medical devices, pharmaceuticals and chemicals, aircraft and aircraft components, coal, and computer equipment and parts.
• Principal Austrian exports to the United States include specialized industrial machinery, pharmaceuticals, glassware, electric power machinery and some food products.
• Economic conditions in Austria continue to remain favorable.
• In line with its EU neighbors, Austria’s economy generally is on a slower growth path than before the 2008–2009 financial/economic crisis.
• Within the next three years, U.S. exporters will still find opportunities to gain market position within most Austrian industry sectors.
Note: There are differences between Austrian and U.S. import-export statistics. Statisticians call it the “Rotterdam Effect”: the discrepancy in trade statistics that appear when goods are transshipped to other countries before they reach their final destination. The difference appears because the U.S. export statistics often only measure shipments to the first foreign port of entry, while the Austrian statistics are calculated on a cost, insurance and freight (CIF) basis.
Market Challenges• When establishing a business in Austria, U.S. companies may still encounter some
bureaucratic barriers.
• Most business activities in Austria are regulated and require that a separate application be made for a business license and registration in the commercial register.
Market OpportunitiesTo overlook Austria would be to overlook one of the world’s most prosperous nations (on a per capita basis).
Doing business in and with Austria presents certain advantages. Listed below are the top five reasons why U.S. companies should consider exporting to this country:
• First, Austria is located at an international crossroads within Central Europe, which offers a logistical advantage over other countries in the region. Austria is a member
austria
74This copy belongs to Chris Parks

International DataAustria
austria
of the Schengen Agreement and offers U.S. companies access to growing markets in Eastern and Southeastern Europe.
• A second advantage for Austria is its well-diversified and relatively resilient economy. Austria represents a good opportunity for export, joint ventures and investment. In response to pressure from the newest EU members, which offer investors lower corporate tax rates, Austria’s tax rate was decreased in 2005 from 34% to 25%.
• A third plus for Austria is its membership in the EU and the euro currency zone.
• A fourth advantage Austria offers is that the United States is its fourth largest trading partner and its leading trading partner outside Europe.
• Lastly, U.S. companies entering the market for the first time will benefit from the strong trading relationship already established between the two countries.
Major Projects: Austrian electricity providers plan to invest approximately US$10.6 billion in power generation, distribution and efficiency upgrades between now and 2020.
The Transatlantic Trade and Investments Partnership (TTIP) is an ambitious and comprehensive trade and investment agreement that will promote transatlantic international competitiveness, jobs and growth. TTIP aims to address non-tariff barriers that impede trade in goods and services and seeks to promote greater compatibility, transparency and cooperation in the regulatory and standards arenas. According to non-U.S. government estimates, transatlantic zero-tariffs could boost U.S. and EU exports each by 17%. A 25% reduction in non-tariff barriers could increase the combined EU and U.S. GDP by US$106 billion.
Market-Entry Strategies• Select one distributor or agent for the entire Austrian market.
• In case of a limited number of customers and end-users in Austria, a distributor might be appointed in Germany to cover all of German-speaking Europe.
“Doing Business in Austria” article is provided by the U.S. Commercial Service, the trade promotion arm of the U.S. Department of Commerce’s International Trade Administration. For more information on doing business in Austria, you may visit their website at www.export.gov/Austria.
The following charts are based on import and export data obtained from the website of the International Trade Centre (ITC)
75This copy belongs to Chris Parks

AUSTRIA SNAPSHOT
Population in millions 8.7
Median Age 43.6Population Growth 0.55%
Demographics
Economy
Age Male Female
0–14 0.62 0.59
15–64 2.91 2.90
65 & Over 0.71 0.93
GDP (PPP) $403.8 billion
GDP Per Capita $47,500
GDP-Real Growth Rate 0.80%
Unemployment Rate 5.80%
Inflation 0.90%
Data Source: Demographics, Economy and Trade from CIA World Factbook, Music Industry from The Music Trades. GDP (PPP): Gross Domestic Product based on purchasing-power-parity (PPP) valuation of country GDP in U.S. dollars.
Demographics
65+14.1%
0–1418.9%15–64
67.0%
Economy
GDP-Service70.7%
GDP-Agriculture1.4%
GDP-Industry27.9%
0
50
100
150
200
250
300
350
400
450
'15'14'13'12'11'10'09'08'07'06'05'04
Austria GDP(U.S. $ in billions)
0
1
2
3
4
5
6
'15'14'13'12'11'10'09'08'07'06'05'04
Unemployment Rate(Percent)
0.0
0.5
1.0
1.5
2.0
2.5
3.0
3.5
4.0
'15'14'13'12'11'10'09'08'07'06'05'04
In�ation (Annual Percent Rate)
76This copy belongs to Chris Parks

International DataAustria Snapshot
Trade
Music Industry
Total Export $141.4 billion Export as % of GDP 35.02%
Total Import $139.8 billion Import as % of GDP 34.62%
Music Market $88.0 million
Sales Per Capita $10.16
Global Share 0.50%
0
5
10
15
20
25
30
35
FranceSwitzerlandItalyU.S.Germany
Export Partners (2015)
Ann
ual P
erce
ntag
e
0
5
10
15
20
25
30
35
40
CzechRepublic
SwitzerlandChinaItalyGermany
Import Partners (2015)
Ann
ual P
erce
ntag
e
0
2
4
6
8
10
12
14
16
'14'13'12'11'10'09'08'07'06'05
Music Sales Per Capita(U.S. $)
0
25
50
75
100
125
'14'13'12'11'10'09'08'07'06'05
Austria Music Market(U.S. $ in millions)
0.0
0.1
0.2
0.3
0.4
0.5
0.6
0.7
0.8
'14'13'12'11'10'09'08'07'06'05
Share of Global Music Market(Percent)
77This copy belongs to Chris Parks

Austria Imports and Exports
0
2
4
6
8
10
'15'14'13'12'11'10'09'08'07'06
Fretted & Stringed InstrumentsExports
Valu
e in
U.S
. $ m
illio
ns
Export Value
0
3
6
9
12
15
18
'15'14'13'12'11'10'09'08'07'06
Acoustic PianosExports
Valu
e in
U.S
. $ m
illio
ns Export Value
0.0
0.5
1.0
1.5
2.0
2.5
'15'14'13'12'11'10'09'08'07'06
Keyboard InstrumentsExports
Valu
e in
U.S
. $ m
illio
ns
Export Value
0
2
4
6
8
10
12
'15'14'13'12'11'10'09'08'07'06
Acoustic PianosImports
Valu
e in
U.S
. $ m
illio
ns
Import Value
0
2
4
6
8
10
'15'14'13'12'11'10'09'08'07'06
Fretted & Stringed InstrumentsImports
Valu
e in
U.S
. $ m
illio
ns
Import Value
0
3
6
9
12
15
18
'15'14'13'12'11'10'09'08'07'06
Keyboard InstrumentsImports
Valu
e in
U.S
. $ m
illio
ns
Import Value
78This copy belongs to Chris Parks

International DataAustria
Austria Imports and Exports
0
100
200
300
400
500
'15'14'13'12'11'10'09'08'07'06
PercussionExports
Valu
e in
U.S
. $ th
ousa
nds
Export Value
0
3
6
9
12
15
'15'14'13'12'11'10'09'08'07'06
Wind InstrumentsExports
Valu
e in
U.S
. $ m
illio
ns Export Value
0
1
2
3
4
5
6
'15'14'13'12'11'10'09'08'07'06
AccessoriesExports
Valu
e in
U.S
. $ m
illio
ns
Export Value
0
5
10
15
20
25
'15'14'13'12'11'10'09'08'07'06
Wind InstrumentsImports
Valu
e in
U.S
. $ m
illio
ns
Import Value
0
1
2
3
4
5
6
7
8
9
'15'14'13'12'11'10'09'08'07'06
PercussionImports
Valu
e in
U.S
. $ m
illio
ns
Import Value
0
5
10
15
20
25
30
'15'14'13'12'11'10'09'08'07'06
AccessoriesImports
Valu
e in
U.S
. $ m
illio
ns
Import Value
79This copy belongs to Chris Parks

BRAZIL
South America has been undergoing huge political and economic changes over the last 10 years. From the good to the bad, Brazil is a part of that.
While I write these comments, the Brazilian president, Ms. Dilma Rousseff, is suffering an impeachment process. The vice president, Mr. Michel Temer, has the support of the biggest investors (national and international); the business interests in the country will be pleased to have a new perspective (or not).
Paraphrasing the investor, philosopher and author of the book Black Swan, Nassim Nicholas Taleb, the highly improbable event has three main characteristics: it is unpredictable; it carries a massive impact; and, after the fact, we concoct an explanation that makes it appear less random, and more predictable, than it was. Yes, we live in the land of Black Swan events.
The worldwide guitar market has fallen around 40% since the 2008 crises. Looking at the Brazilian import numbers, we are now 40% less since 2011. Market specialists believe that in two years, Brazil will recover at least 20% of this loss.
Retail Takes Cue from the New GenerationThe number of online shops in Brazil increased around 15% from 2015 to 2016. New entrepreneurs are bringing a new mentality, courtesy of the Millennium generation: fast, connected and, despite all crises, able to manage their business.
Any country that has the major part of its income provided by commodities has the same unstable economic waves.
Therefore, a highly focused business such as guitars, amplifiers, violin shops and others are dodging the crises and finding ways to build their business.
Buying and selling in the middle of so many changes, social, economic and political instability is a hard job.
Considering new facts related to the political scandal (including corruption and money laundering), change drives the thoughts to understand that the country will take time to recover from the situation.
But it is now a part this country’s history. We are working to have a change in our country; the musical market is also writing a new story. The future will tell us.
God bless Brazil.
Commentary by Daniel Neves, President of Música & Mercado
BR
AZIL
brazil
80This copy belongs to Chris Parks

International DataBrazil
brazil
DOING BUSINESS IN BRAZIL
Market OverviewThe Federative Republic of Brazil is Latin America’s largest economy. With 3,290,000 square miles, bordering 10 other countries and with 4,650 miles of coastline, Brazil is the largest country in Latin America and fifth largest in the world. Brazil’s 2014 GDP of US$2.3 trillion ranks the country as the world’s seventh largest economy. However, annual growth during 2014 dropped to 0.1% due to reduced demand for Brazilian exports in Europe and Asia and modest consumer demand from Brazil’s large middle class.
During the past two decades, the country has prioritized macroeconomic policies that control inflation and promote economic growth. Recently, inflation has increased, reaching 8.47% in May 2015. Urban unemployment was at 6.4% in April 2015, increasing from 4.9% in mid-2014; and wages continue to increase. Brazil’s Central Bank has been steadily raising interest rates to combat inflation, from a historic low of 7.25% in October 2012 to 13.75%.
In 2014, the United States was the second largest exporter to Brazil, accounting for 15% of Brazil’s total imported goods; behind China and followed by Argentina, Germany and Nigeria. In 2014, Brazil imported over US$229 billion of total goods, including US$42.4 billion from the United States — a 3.7% decrease from 2013. Brazil ranked as the United States’ ninth largest export market for goods in 2014. Brazil is also a large market for U.S. services, accounting for an additional US$28 billion in exports in 2014. The United States maintains a trade surplus in services that has increased over the past decade, reaching US$17 billion in 2012, before dropping to US$11.9 billion in 2014. Brazil represents an excellent export partner for experienced U.S. exporters. Major reasons to export to Brazil include:
• The country’s population of 202 million is the fifth largest in the world, representing nearly 3% of global consumers.
• At the same time, Brazil has the highest per capita income of any of the BRICs, with more than half of its population defined as middle class, earning between US$11,500 and US$29,000 per year.
• Brazil is also a traditional leader among emerging markets and is now considered by many multinational companies as an essential market for truly global businesses.
• Brazil has a natural affinity for the United States and a high regard for our products, brands and technology. This affinity has been further reinforced through the Scientific Mobility Program, a government scholarship that has already funded 32,716 students to study for one year in the United States. One of the stated aims of the program is increasing science and technology cooperation between our countries.
• The Brazilian government is actively cultivating relationships with international and U.S. businesses and prioritizing macroeconomic stability. President Rousseff’s visit to Washington, DC, in June 2015 highlighted the shared commitment of the United States and Brazil to work together to grow trade and investment.
81This copy belongs to Chris Parks
brazil
Market ChallengesBrazil has a large and diversified economy that offers U.S. companies many opportunities to partner and to export their goods and services. Doing business in Brazil requires intimate knowledge of the local environment, including both the direct as well as the indirect costs of doing business in Brazil (referred to as “Custo Brasil”). Such costs are often related to distribution, government procedures, employee benefits, environmental laws and a complex tax structure. Logistics pose a particular challenge, given the lack of sufficient infrastructure to keep up with nearly a decade of economic expansion. In addition to tariffs, U.S. companies will find a complex customs and legal system.
The Government of Brazil (GOB) is the nation’s largest buyer of goods and services. Navigating the government procurement process can be challenging. U.S. exporters may find themselves at a competitive disadvantage if they do not have a significant in-country presence — whether via established partnerships with Brazilian entities or some type of company subsidiary — as well as the patience and financial resources to respond to legal challenges and bureaucratic issues.
The unfolding scandal connected to energy giant Petrobras poses another challenge to government and business, increasing uncertainty and creating a drag on growth. In response, senior government officials have pledged to support the ongoing legal and investigative processes, and Petrobras has taken concrete steps to improve internal compliance mechanisms and restore confidence. While the economic and public relations consequences have been severe, Brazil may yet seize a silver lining: a comprehensive commitment to fight corruption could ultimately improve the business climate, benefitting local and international companies alike.
Market OpportunitiesOn June 9, 2015, President Rousseff unveiled a new infrastructure concessions program, which is intended to draw US$64 billion in investment over the next five years and beyond to upgrade and operate highways, railways, ports and airports across 20 states in Brazil. The new concessions will have less access to state bank financing than previous projects, as bidders will be expected to use private financing as well. The first-ever Olympic Games in South America that will take place in Rio de Janeiro in the summer of 2016 are expected to generate numerous business opportunities for U.S. companies in several sectors. The main projects include logistics upgrades at seaports, airport modernization, mass transit build-out, and water sanitation. The Government of the State of Rio de Janeiro estimates that investments in the state between 2010 and 2016 will reach US$50 billion, in sectors including infrastructure, construction and transportation. Most of these investments will be done under Brazil’s Public-Private Partnerships (PPPs). Other promising areas for U.S. exports and investment include agricultural equipment, building and construction, aerospace and aviation, safety and security devices, IT, oil and gas, medical equipment, sporting goods, environmental technologies, retail and transportation.
brazil
82This copy belongs to Chris Parks

International DataBrazil
brazil
Market-Entry StrategiesSuccess in Brazil’s business culture relies heavily upon the development of strong personal relationships, the keystone of productive business partnerships. In most cases, U.S. firms need a local presence and thus should invest time in developing relationships through frequent visits to Brazil. The U.S. Commercial Service encourages U.S. companies visiting Brazil to meet one-on-one with potential partners, and offers a slate of services such as our Gold Key Service (GKS), through which companies can meet with pre-screened potential clients or partners in personal meetings. We also lead delegations of Brazilian buyers to connect with U.S. businesses at more than 30 International Buyer Program trade shows in the United States. It is essential to work through a qualified representative or distributor when developing new business in the Brazilian market. Some firms may need to establish an office or joint venture in Brazil. It is difficult for U.S. companies to get involved in public sector procurement at the federal or state levels without a Brazilian partner, or a physical presence in Brazil.
“Doing Business in Brazil” article is provided by the U.S. Commercial Service, the trade promotion arm of the U.S. Department of Commerce’s International Trade Administration. For more information on doing business in Brazil, you may visit their website at www.export.gov/Brazil.
The following charts are based on import data from the Brazilian Bureau of Business Development, Industries and Trade, and the Ministry of Trade
83This copy belongs to Chris Parks
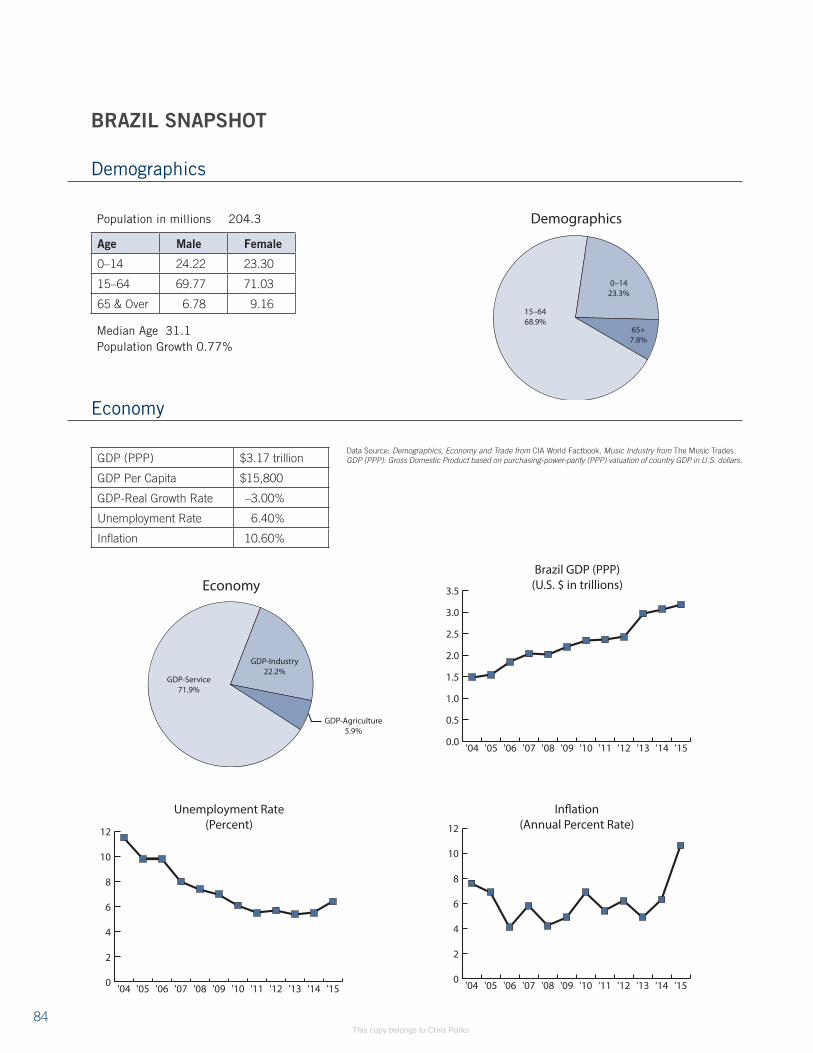
BRAZIL SNAPSHOT
Population in millions 204.3
Median Age 31.1Population Growth 0.77%
Demographics
Economy
Age Male Female
0–14 24.22 23.30
15–64 69.77 71.03
65 & Over 6.78 9.16
GDP (PPP) $3.17 trillion
GDP Per Capita $15,800
GDP-Real Growth Rate –3.00%
Unemployment Rate 6.40%
Inflation 10.60%
Data Source: Demographics, Economy and Trade from CIA World Factbook, Music Industry from The Music Trades. GDP (PPP): Gross Domestic Product based on purchasing-power-parity (PPP) valuation of country GDP in U.S. dollars.
Demographics
65+7.8%
0–1423.3%
15–6468.9%
Economy
GDP-Industry22.2%
GDP-Agriculture5.9%
GDP-Service71.9%
0.0
0.5
1.0
1.5
2.0
2.5
3.0
3.5
'15'14'13'12'11'10'09'08'07'06'05'04
Brazil GDP (PPP)(U.S. $ in trillions)
0
2
4
6
8
10
12
'15'14'13'12'11'10'09'08'07'06'05'04
Unemployment Rate (Percent)
0
2
4
6
8
10
12
'15'14'13'12'11'10'09'08'07'06'05'04
In�ation (Annual Percent Rate)
84This copy belongs to Chris Parks

International Data
Trade
Music Industry
Total Export $189.1 billion Export as % of GDP 5.97%
Total Import $174.2 billion Import as % of GDP 5.50%
Music Market $289.0 million
Sales Per Capita $1.41
Global Share 1.70%
0
4
8
12
16
20
NetherlandsArgentinaU.S.China
Export Partners (2015)
Ann
ual P
erce
ntag
e
0
4
8
12
16
20
NigeriaGermanyArgentinaU.S.China
Import Partners (2015)
Ann
ual P
erce
ntag
e
Music Sales Per Capita(U.S. $)
0.0
0.2
0.4
0.6
0.8
1.0
1.2
1.4
1.6
'14'13'12'11'10'09'08'07'06'05
Brazil Music Market(U.S. $ in millions)
0
50
100
150
200
250
300
'14'13'12'11'10'09'08'07'06'05
Share of Global Music Market(Percent)
0.0
0.4
0.8
1.2
1.6
2.0
'14'13'12'11'10'09'08'07'06'05
Brazil Snapshot
85This copy belongs to Chris Parks

Brazil Imports
0
1
2
3
4
5
6
7
'15'14'13'12'11'10'09'08'07'06
Synthesizers
Valu
e in
U.S
. $ m
illio
ns
Import Value
0
3
6
9
12
15
18
'15'14'13'12'11'10'09'08'07'06
Wind Instruments
Valu
e in
U.S
. $ m
illio
ns Import Value
0
1
2
3
4
5
'15'14'13'12'11'10'09'08'07'06
Instrument Strings
Valu
e in
U.S
. $ m
illio
ns
Import Value
Stringed Instruments
Valu
e in
U.S
. $ m
illio
ns
Import Value
0
10
20
30
40
50
'15'14'13'12'11'10'09'08'07'06
0
2
4
6
8
10
12
14
'15'14'13'12'11'10'09'08'07'06
Percussion
Valu
e in
U.S
. $ m
illio
ns
Import Value
0
5
10
15
20
25
'15'14'13'12'11'10'09'08'07'06
Electric Guitars and Basses
Valu
e in
U.S
. $ m
illio
ns
Import Value
86This copy belongs to Chris Parks

International Data
Imports (2015)
Value in U.S. $ millions
0 5 10 15 20 25 30
Percussion
Synthesizers
Instrument Strings
Electric Guitars & Basses
Wind Instruments
Stringed Instruments
0
20
40
60
80
100
120
140
160
180
'15'14'13'12'11'10'09'08'07'06
Total Imports
Reta
il Va
lue
in $
mill
ions
Brazil Imports
Brazil
87This copy belongs to Chris Parks

CANADA
Canada is a country in the northern half of North America. Its ten provinces and three territories extend from the Atlantic to the Pacific and northward into the Arctic Ocean, covering 9.98 million square kilometres (3.85 million square miles), making it the world’s second-largest country by total area and the fourth-largest country by land area. Canada’s border with the United States is the world’s longest land border.
HistoryBeginning in the 15th century, British and French colonies were established on the Atlantic coast, with the first establishment of a region called “Canada” occurring in 1537. As a consequence of various conflicts, the United Kingdom gained and lost territories within British North America until it was left, in the late 18th century, with what mostly geographically comprises Canada today. On July 1, 1867, the colonies of Canada, New Brunswick and Nova Scotia joined to form the autonomous federal Dominion of Canada. This began an amalgamation of provinces and territories to the self-governing Dominion to the present 10 provinces and three territories forming modern Canada. In 1931, Canada achieved near total independence from the United Kingdom with the Statute of Westminster 1931, and full sovereignty was attained when the Canada Act 1982 removed the last remaining ties of legal dependence on the British parliament.
CA
NA
DA
canada
88This copy belongs to Chris Parks

International DataCanada
EconomyCanada is the world’s 11th-largest economy as of 2015, with a nominal GDP of approximately US$1.79 trillion. It is a member of the Organisation for Economic Co-operation and Development (OECD) and the Group of Eight (G8), and is one of the world’s top 10 trading nations, with a highly globalized economy. Canada is a mixed economy, ranking above the United States and most western European nations on the Heritage Foundation’s index of economic freedom, and experiencing a relatively low level of income disparity. The country’s average household disposable income per capita is over US$23,900, higher than the OECD average.
In 2014, Canada’s exports totalled over C$528 billion, while its imported goods were worth over C$523 billion, of which approximately C$349 billion originated from the United States, C$49 billion from the European Union and C$35 billion from China. The country’s 2014 trade surplus totalled C$5.1 billion, compared with a C$46.9 billion surplus in 2008.
Since the early 20th century, the growth of Canada’s manufacturing, mining and service sectors has transformed the nation from a largely rural economy to an urbanized, industrial one. Like many other developed nations, the Canadian economy is dominated by the service industry, which employs about three-quarters of the country’s workforce.
The global financial crisis of 2008 caused a major recession, which led to a significant rise in unemployment in Canada. By October 2009, Canada’s national unemployment rate had reached 8.6%, with provincial unemployment rates varying from a low of 5.8% in Manitoba to a high of 17% in Newfoundland and Labrador. Between October 2008 and October 2010, the Canadian labour market lost 162,000 full-time jobs and a total of 224,000 permanent jobs. Canada’s federal debt was estimated to total C$566.7 billion for the fiscal year 2010–11, up from C$463.7 billion in 2008–09. In addition, Canada’s net foreign debt rose by C$41 billion to C$194 billion in the first quarter of 2010. However, Canada’s regulated banking sector (comparatively conservative among G8 nations), the federal government’s pre-crisis budgetary surpluses and its long-term policies of lowering the national debt resulted in a less severe recession compared to other G8 nations. As of 2015, the Canadian economy has largely stabilized and has seen a modest return to growth, although the country remains troubled by volatile oil prices, sensitivity to the Eurozone crisis and higher-than-normal unemployment rates.
PopulationThe 2011 Canadian census counted a total population of 33,476,688, an increase of around 5.9% over the 2006 figure. By December 2012, Statistics Canada reported a population of over 35 million, signifying the fastest growth rate of any G8 nation. Between 1990 and 2008, the population increased by 5.6 million, equivalent to 20.4% overall growth. The main drivers of population growth are immigration and, to a lesser extent, natural growth. Canada has one of the highest per-capita immigration rates in the world, driven mainly by economic policy and, to a lesser extent family reunification. The Canadian public (as well as the major political parties) supports the current level of immigration. In 2010, a record 280,636 people immigrated to Canada. The Canadian government anticipated between 280,000 and 305,000 new permanent residents in 2016, a similar number of immigrants as in recent years. New immigrants settle mostly in major urban areas like Toronto, Montreal
canada
89This copy belongs to Chris Parks

canada
and Vancouver. Canada also accepts large numbers of refugees, accounting for over 10% of annual global refugee resettlements.
EthnicityAccording to the 2006 census, the country’s largest self-reported ethnic origin is Canadian (accounting for 32% of the population), followed by English (21%), French (15.8%), Scottish (15.1%), Irish (13.9%), German (10.2%), Italian (4.6%), Chinese (4.3%), First Nations (4.0%), Ukrainian (3.9%) and Dutch (3.3%). There are 600 recognized First Nations governments or bands, encompassing a total of 1,172,790 people. Canada’s aboriginal population is growing at almost twice the national rate, and 4% of Canada’s population claimed aboriginal identity in 2006. Another 16.2% of the population belonged to a non-aboriginal visible minority. In 2006, the largest visible minority groups were South Asian (4.0%), Chinese (3.9%) and Black (2.5%). Between 2001 and 2006, the visible minority population rose by 27.2%. In 1961, less than 2% of Canada’s population (about 300,000 people) were members of visible minority groups. By 2007, almost one in five (19.8%) were foreign-born, with nearly 60% of new immigrants coming from Asia (including the Middle East). The leading sources of immigrants to Canada were China, the Philippines and India. According to Statistics Canada, visible minority groups could account for a third of the Canadian population by 2031.
Self-reported ethnic origins of Canadians (as per 2011 census data)• European (76.7%)• Asian (14.2%)• Aboriginal (4.3%)• Black (2.9%)• Latin American (1.2%)• Multiracial (0.5%)• Other (0.3%)
LanguagesA multitude of languages are used by Canadians, with English and French (the official languages) being the mother tongues of approximately 60% and 20% of Canadians, respectively. Nearly 6.8 million Canadians listed a non-official language as their mother tongue. Some of the most common non-official first languages include Chinese (mainly Cantonese; 1,072,555 first-language speakers), Punjabi (430,705), Spanish (410,670), German (409,200) and Italian (407,490).
Approximately 98% of Canadians can speak English and/or French.• English – 56.9%• English and French (Bilingual) – 16.1%• French – 21.3%
MusicThe Canadian music industry is the sixth largest in the world, producing internationally renowned composers, musicians and ensembles. Music broadcasting in the country is regulated by the Canadian Radio-television and Telecommunications Commission (CRTC).
canada
90This copy belongs to Chris Parks

International Data
The Canadian Academy of Recording Arts and Sciences presents Canada’s music industry awards, the Juno Awards, which were first awarded in 1970. The Canadian Music Hall of Fame, established in 1976, honours Canadian musicians for their lifetime achievements.
Well-known Canadian artists include Rush, Drake, Justin Bieber, Nelly Furtado, Sarah McLachlan, Gordon Lightfoot, Oscar Peterson, Joni Mitchell, Robbie Robertson, Celine Dion, Bryan Adams, Shania Twain, Diana Krall, Neil Young and many more.
Arts FundingCanada has a very high degree of arts funding, especially compared to the United States. Billions of dollars flow from the federal, provincial and municipal governments to artists, music associations, music conferences, venues, concerts, schools and festivals.
During the nine years that the Harper conservative government was in power, they made ongoing cuts to federal arts funding.
In October 2015, the Liberal Party under Justin Trudeau pulled off a landslide victory and took power as the new federal government in November 2015.
The new Liberal Government unveiled its first budget on March 22, and in it the federal government made good on a number of campaign promises related to arts funding. In total, the Liberal Government committed C$1.9 billion in new funding over five years to arts and culture programs and institutions.
In the 269-page budget, the government committed to investing an additional C$675 million in the CBC/Radio Canada over the next five years “to modernize and revitalize CBC/Radio Canada in the digital era.” This is divided into C$75 million this coming fiscal year and C$150 million in each of the next four years.
The Canada Council for the Arts also received a major infusion of funding, with government committing an additional C$40 million to the Council’s budget this year, which is below the C$90 million promised during the campaign for this year, but there are incremental increases each following year up to C$180 million in 2020–21. This equals C$550 million in total new funding for the Canada Council for the Arts.
The Canada Cultural Spaces Fund will receive C$168.2 million over two years to help regional arts groups and festivals with construction, renovations and repairs.
The National Arts Centre in Ottawa will also be getting an additional C$114.9 million to renovate the building’s performance spaces and an additional C$35 million will be spent promoting Canada’s cultural industries abroad.
Canadian corporations are also major sponsors of artists, venues, schools, conferences, tours and festivals.
Much of this funding has a major trickle-down effect on Canada’s musicians, facilities and music organizations.
canada
Canada
91This copy belongs to Chris Parks

canada
Musical Instrument SalesMusical instruments are available to consumers in Canada through musical instrument stores, music conservatories, department stores, electronics retailers, computer stores, gift stores and e-commerce websites. E-commerce sites are located primarily in Canada and the United States and are stand-alone operations or operated by bricks-and-mortar musical retailers. Most products sold in Canada are imported from the United States, China and Europe but there is a growing Canadian manufacturing base.
Statistics Canada tracks all products that come into Canada and are declared through Canada customs.
Year-over-year changes in imports:
Category 2011 2012 2013 2014 2015
Acoustic Fretted Instruments 9.9% 14.2% 0.9% 1.0% 19.6%
Bowed Instruments -0.3% 2.6% 5.1% -13.7% 24.7%
Brass Instruments -6.7% -1.0% -2.8% -13.0% 28.4%
Electric Instruments (Guitars/Drums)
14.4% -2.1% -7.3% -0.9% 6.0%
Electronic Keyboards -8.0% 5.1% 0.2% -3.4% 12.9%
PA/Recording -26.5% 10.3% 10.8% -0.5% 24.5%
Percussion Products 10.7% 0.2% -9.2% -14.4% 30.1%
Pianos 8.9% -7.3% -0.6% -5.2% 26.8%
Printed Music -4.6% 2.3% -2.2% 8.0% 12.3%
Strings and Accessories 8.8% 15.0% -5.8% -22.1% 23.6%
Woodwind / Harmonica / Accordion
-1.9% 9.9% 1.0% -7.2% 17.4%
TOTAL -20.1% 8.6% 7.3% -1.9% 23.1%
It should be noted that Canada supports an extensive and vibrant domestic music products manufacturing base as well, with world-leading names in percussion, fretted instruments, instrument amplifiers and PA gear being produced domestically for both the Canadian market and global markets. The quantity and value of these domestically produced products would not be included in the import statistics above.
Also not included are products that come into the country without being cleared through Canada Customs.
Current Industry StatusCanadian Music Trade magazine conducted surveys of Canadian dealers and suppliers in June 2016 to determine the Industry Status for 2015 and the Outlook for 2016.
canada
92This copy belongs to Chris Parks
International Data
Dealer Survey In 2015, did your revenue:Increase - 61%Decrease - 18%Stay the same - 21%
In 2016, do you expect your revenue to:Increase - 64%Decrease - 11%Stay the same - 25%
What is your biggest challenge for 2016?Finding and keeping great staff - 7%Getting your business more organized - 25%Taking on new profitable lines - 11%Online competition - 18%Cross-border shopping - 4%Chain store competition - 11%Other - 25% “Other” responses:
“The Alberta economy”“Currency exchange, higher costs for products”“Cross-border shopping”“Weak Canadian dollar”
Supplier Survey In 2015, did your revenue:Increase - 89%Decrease - 0%Stay the same - 11%
In 2016, do you expect your revenue to:Increase - 78%Decrease - 0%Stay the same - 22%
What is your biggest challenge for 2016?Finding and keeping great staff - 11%Getting your business more organized - 11%Taking on new profitable lines - 11%Online shopping - 11%Cross-border shopping - 0%Currency fluctuations - 22%Other - 3%
“Other” responses:“Attracting and retaining customers”“Manufacturing”
canada
Canada
93This copy belongs to Chris Parks

canada
Information sources:• Canadian Music Trade magazine• Canadian Musician magazine• Statistics Canada• Wikipedia
Commentary by Jim Norris, President of Norris-Whitney Communications, Inc.
DOING BUSINESS IN CANADA
Market OverviewCanada continues to maintain its ranking as the United States’ largest export market in the world, accounting for US$312 billion of U.S. goods. This figure represents a US$12 billion increase (4%) from 2013 and the highest total on record. Proximity, ease of doing business, a common business culture, rule of law and high receptivity for U.S.-made goods and services contribute to the already significant bilateral trade base. Anticipated future growth and expansion of the Canadian economy ensure that U.S.-made goods and services will be competitive in this market in the coming years. In 2013, Canada ranked third in the world in foreign direct investment (FDI) to the United States.
No two countries are as closely integrated as the United States and Canada. The relationship is truly mutually beneficial; the United States is Canada’s largest export market, accounting for US$348 billion (77%) of Canadian exports of goods in 2014. The United States is Canada’s largest FDI contributor. This unique trade and investment relationship is based on an increasingly integrated supply chain; on co-production of new, leading technologies; and on the positive flow of people, talent and ideas. In fact, the United States maintained its No. 1 ranking as Canadian’s favorite tourist destination, and vice versa, in 2014 with travel and tourism contributing billions to each country’s economy.
There is long-term optimism about the future of this relationship and the prospects for expanded trade and investment. North America represents 25% of the world’s GDP. This means businesses will continue to find viable markets for competitive products and services. In particular, new developments in shipbuilding, air defense, safety and security, IT, infrastructure, mining, and renewable energy will create business opportunities.
The Canadian and U.S. federal governments in 2011 launched two ambitious initiatives to streamline the movement of people and goods safely across the common border – Beyond the Border and the Regulatory Cooperation Council – and will continue to implement these programs to help U.S. and Canadian businesses reduce operational costs while effectively streamlining trading procedures.
Market ChallengesCanada remains among the most accessible markets in the world. Nevertheless, doing business in Canada is not the same as doing business in the United States. Canada Customs documentation, bilingual labeling, packaging requirements, International Traffic in
canada
94This copy belongs to Chris Parks

International Data
Arms Regulations (ITAR), and Canadian federal and provincial sales tax accounting can be surprisingly challenging. Canadian federal, provincial and municipal procurement procedures, while open in principle to U.S. bidders, vary from procedures in the United States. Bidders must be registered in Canada to bid, and bidders must fulfill all Canadian requirements to qualify to bid (mandatory requirements are non-negotiable). In some cases, security clearances are required for personnel prior to submitting a bid, and in a number of projects, there may be requirements for offsets (known as Industrial Technical Benefits or ITBs). Increasing competition in a number of sectors but in particular cosmetics, vitamins, electronics and home furnishings translates into a need for competitive pricing; aggressive, imaginative marketing; and deep discounts for agents and distributors. Other ways to differentiate from your competitors are to offer agents and distributors specialized training and flexible contract terms, or to offer end users after-sales support.
Market OpportunitiesThe following market trends are creating new business opportunities for U.S. firms in several key sectors. Mechanisms for facilitating trade at the border include pre-inspections and technological advances. Streamlined regulatory requirements will improve and expand just-in-time delivery of goods and services, and will strengthen and expand supply chains. This will provide enhanced opportunities in particular for U.S. firms seeking to enter the Canadian aerospace and automotive sector supply chains. Opportunities exist for expansion in Canadian travel and tourism to the United States, including medical tourism. Oil prices have a significant impact on the Canadian economy, especially in the Western province of Alberta. Nevertheless, there are opportunities in the energy and other natural resource sectors including renewable energy, mining, oil and gas, and environmental-related sectors.
Market-Entry StrategyFor many companies (particularly in the manufacturing and construction sectors), frequent visits to Canada and establishing a local presence will be crucial to long-term market success. For many U.S. companies, joining a U.S. delegation to a Canadian trade show can be the best first step.
“Doing Business in Canada” article is provided by the U.S. Commercial Service, the trade promotion arm of the U.S. Department of Commerce’s International Trade Administration. For more information on doing business in Canada, you may visit their website at www.export.gov/Canada.
The following charts are based on import data from Statistics Canada as collected by Steven Butterworth, Vice President of the Musical Instruments Division at Yamaha Canada Music Ltd.
canada
Canada
95This copy belongs to Chris Parks
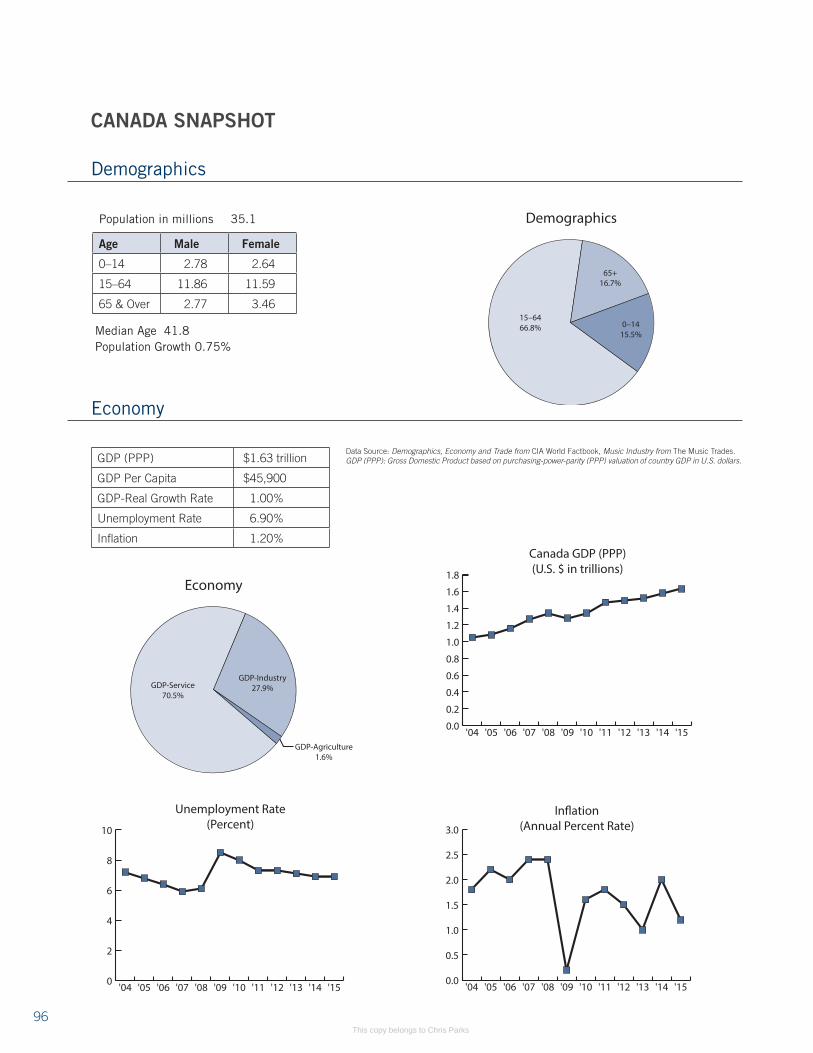
Demographics
65+16.7%
0–1415.5%
15–6466.8%
Economy
GDP-Service70.5%
GDP-Agriculture1.6%
GDP-Industry27.9%
Population in millions 35.1
Median Age 41.8Population Growth 0.75%
0.0
0.2
0.4
0.6
0.8
1.0
1.2
1.4
1.6
1.8
'15'14'13'12'11'10'09'08'07'06'05'04
Canada GDP (PPP)(U.S. $ in trillions)
0
2
4
6
8
10
'15'14'13'12'11'10'09'08'07'06'05'04
Unemployment Rate(Percent)
0.0
0.5
1.0
1.5
2.0
2.5
3.0
'15'14'13'12'11'10'09'08'07'06'05'04
In�ation (Annual Percent Rate)
CANADA SNAPSHOT
Data Source: Demographics, Economy and Trade from CIA World Factbook, Music Industry from The Music Trades. GDP (PPP): Gross Domestic Product based on purchasing-power-parity (PPP) valuation of country GDP in U.S. dollars.
Age Male Female
0–14 2.78 2.64
15–64 11.86 11.59
65 & Over 2.77 3.46
GDP (PPP) $1.63 trillion
GDP Per Capita $45,900
GDP-Real Growth Rate 1.00%
Unemployment Rate 6.90%
Inflation 1.20%
Demographics
Economy
96This copy belongs to Chris Parks

International DataCanada Snapshot
0
10
20
30
40
50
60
70
80
U.K.ChinaU.S.
Export Partners (2015)
Ann
ual P
erce
ntag
e
0
10
20
30
40
50
60
MexicoChinaU.S.
Import Partners (2015)
Ann
ual P
erce
ntag
e
Music Industry
Music Sales Per Capita(U.S. $)
0
5
10
15
20
25
30
'14'13'12'11'10'09'08'07'06'05
Share of Global Music Market(Percent)
0
1
2
3
4
5
'14'13'12'11'10'09'08'07'06'05
Canada Music Market(U.S. $ in millions)
0
100
200
300
400
500
600
700
800
900
'14'13'12'11'10'09'08'07'06'05
Trade
Total Export $428.3 billion Export as % of GDP 26.28%
Total Import $440.9 billion Import as % of GDP 27.05%
Music Market $738.0 million
Sales Per Capita $21.03
Global Share 4.40%
97This copy belongs to Chris Parks

0
5
10
15
20
25
30
35
'15'14'13'12'11'10'09'08'07'06
Acoustic Guitars
Valu
e in
Can
adia
n $
mill
ions
0
50
100
150
200
250
300
'15'14'13'12'11'10'09'08'07'06
Uni
ts x
1,0
00
Import Value Units
0
10
20
30
40
50
60
'15'14'13'12'11'10'09'08'07'06
Electric Guitars
Valu
e in
Can
adia
n $
mill
ions
Uni
ts x
1,0
00
Import Value Units
0
50
100
150
200
250
'15'14'13'12'11'10'09'08'07'06
0
5
10
15
20
25
'15'14'13'12'11'10'09'08'07'06
Grand Pianos
Valu
e in
Can
adia
n $
mill
ions
Uni
ts x
1,0
00
Import Value Units
0.0
0.5
1.0
1.5
2.0
2.5
3.0
'15'14'13'12'11'10'09'08'07'06
0
20
40
60
80
100
'15'14'13'12'11'10'09'08'07'06
Total Guitars
0
100
200
300
400
500
600
0403020100999897
Valu
e in
Can
adia
n $
mill
ions
Uni
ts x
1,0
00
Import Value Units
0
100
200
300
400
500
600
'15'14'13'12'11'10'09'08'07'06
0
2
4
6
8
10
12
14
16
'15'14'13'12'11'10'09'08'07'06
Upright Pianos
0
1
2
3
4
5
6
7
0403020100999897
Valu
e in
Can
adia
n $
mill
ions
Uni
ts x
1,0
00
Import Value Units
0
1
2
3
4
5
6
7
'15'14'13'12'11'10'09'08'07'06
0
5
10
15
20
25
30
35
40
'15'14'13'12'11'10'09'08'07'06
Total Pianos
0
2
4
6
8
10
0403020100999897
Valu
e in
Can
adia
n $
mill
ions
Uni
ts x
1,0
00
Import Value Units
0
2
4
6
8
10
'15'14'13'12'11'10'09'08'07'06
Canada Imports
98This copy belongs to Chris Parks

International DataCanada
0
3
6
9
12
15
'15'14'13'12'11'10'09'08'07'06
Woodwind
0
100
200
300
400
500
600
0403020100999897
Valu
e in
Can
adia
n $
mill
ions
Uni
ts x
1,0
00
Import Value Units
0
100
200
300
400
500
600
'15'14'13'12'11'10'09'08'07'06
0
1
2
3
4
5
6
7
'15'14'13'12'11'10'09'08'07'06
Stringed Instruments Played with a Bow
0
10
20
30
40
50
60
0403020100999897
Valu
e in
Can
adia
n $
mill
ions
Uni
ts x
1,0
00U
nits
x 1
,000
Import Value Units
0
10
20
30
40
50
60
'15'14'13'12'11'10'09'08'07'06
0
1
2
3
4
5
6
7
8
'15'14'13'12'11'10'09'08'07'06
Brasswind
0
4
8
12
16
20
0403020100999897
Valu
e in
Can
adia
n $
mill
ions
Uni
ts x
1,0
00
Import Value Units
0
4
8
12
16
20
'15'14'13'12'11'10'09'08'07'06
0
2
4
6
8
10
12
'15'14'13'12'11'10'09'08'07'06
Drum Kits
0
40
80
120
160
200
0403020100999897
Valu
e in
Can
adia
n $
mill
ions
Uni
ts x
1,0
00
Import Value Units
0
40
80
120
160
200
'15'14'13'12'11'10'09'08'07'06
0
2
4
6
8
10
12
'15'14'13'12'11'10'09'08'07'06
Portable Keyboards
Valu
e in
Can
adia
n $
mill
ions
Uni
ts x
1,0
00
Import Value Units
0
20
40
60
80
100
'15'14'13'12'11'10'09'08'07'06
0
5
10
15
20
25
30
35
'15'14'13'12'11'10'09'08'07'06
Total Electronic Keyboards
Valu
e in
Can
adia
n $
mill
ions
Uni
ts x
1,0
00
Import Value Units
0
20
40
60
80
100
120
140
160
'15'14'13'12'11'10'09'08'07'06
Canada Imports
99This copy belongs to Chris Parks

CH
INA
CHINA
With lackluster recovery in the international environment and fierce competition in the domestic market, much progress in the Chinese musical instrument industry was made in 2015 against this background. The revenues of musical instrument enterprises above designated size in 2015 reached 37 billion yuan, an increase of 13.64%. The value of export delivery amounted to 12.3 billion yuan, an increase of 10.65%. Total profits increased by 26.23%. The total export value was US$1.68 billion, a decrease of 1.28%. The import value of musical instruments is estimated at a value of US$338 million, an increase of 6.38%.
An industry association, China Musical Instrument Association (CMIA), went beyond the small circle of musical instrument production and sales, now attaching great importance to a wider focus on music education and music life. On March 20, 2015, new CMIA leadership was elected during the annual member meeting. In collaboration with the Music Education Committee, China Society of Education, a special focus for CMIA in 2015 was organizing a Music Education Working Committee for advancing the program of “Social Music Education Service Alliance.” In order to better serve the music industry, the association also stresses industry investigation, reflecting members’ appeals to government departments.
According to “China Music Industry Development Report,” the total value of the China music education market reached 64.38 billion yuan. There were 8,500 music training institutions across China; examinees participating in nationwide musical instrument certification exams approach a record number of 1.2 million. Chinese music education training maintains an upward trend and in general, there’s great potential for the domestic music market.
Considering the current market conditions, CMIA decided to initiate the previously mentioned “Social Music Education Service Alliance.” The CMIA Secretariat encouraged applications from member companies and was applauded for this. More than 50 member companies have joined the working committee of Social Music Education Service Alliance since then. On December 3, 2015, CMIA released “Investigation Report on Music Education Market,” the first program in partnership with Consumption Daily. Along with more than three dozen other programs, eight representatives shared ideas with industry peers. This effort was supported and appreciated by Wang Shicheng, President of CMIA and Wubin, President of the Committee of Music Education, China Society of Education.
After the meeting on Music Education Service Alliance, another 10 programs such as Anster Art Education, Zhoufei New Concept Piano, Music Note and Philharmonic Symphony Education Program applied to join, and two themed industry forums were organized.
During CMIA’s visit to the United States and Japan, Wang Shicheng exchanged ideas with NAMM, CAFIM, Yamaha and Kawai and received positive international support.
In 2015, CMIA strengthened the construction of the industry platform. Music China in Shanghai continued its success and set a record once again. Taking advantage of Music China 2015, CMIA promoted both industry technology cooperation and its vocational skills training system. CMIA Piano Tuners & Technicians Sub-committee organized training sessions as well as the Third International MIDI Technology Symposium along with the
china
100This copy belongs to Chris Parks

International DataChina
china
Online Music Application and Innovation Competition. CMIA also initiated with Intex the “Beijing International Music & Life Show.” All these events were a positive attempt to demonstrate the successful combination of modern technology with the music industry.
Commentary by Zeng Zemin, Executive Vice President China Musical Instrument Association (CMIA) and Chang Jie, Foreign Liaison Officer of CMIA
DOING BUSINESS IN CHINA
Market OverviewIn 2014, President Xi Jinping continued to push for the implementation of key economic, fiscal and rule of law reforms called for in the Third and Fourth Plenums of the 18th Party Congress. As the country’s economy slows, China’s leadership has publicly embraced the “new normal” GDP growth of 7%. Meanwhile, President Xi’s historic anti-corruption campaign has had a notable impact on the way that business is conducted in China. Central, provincial, municipal officials—including those at state-owned enterprises—have adopted a more cautious approach to business. While China became the world’s top destination for foreign direct investment (FDI) in 2014 (surpassing the United States as the world’s top destination for annual FDI flows for the first time since 2003), broad sectors of the economy still remain closed to foreign investors. China relies on an investment catalog to encourage foreign investment in some sectors of the economy, while restricting or prohibiting it in many other industries. There are other ways that business in China can be challenging for foreign companies. For example, the country rolled out several new policies in 2014 that appeared to be aimed at promoting domestic rather than foreign information technology (IT) products and services. Likewise, there were several high-profile investigations of foreign companies for alleged violations of China’s Anti-Monopoly Law. For these reasons and others, the mood has soured somewhat among the U.S. business community in China. AmCham China reports that half of their member companies feel that foreign businesses are less welcome in China than before, and almost 60% believe that foreign companies have been targeted in recent campaigns against monopolies, corruption and product safety. Nevertheless, significant market potential exists for foreign companies, particularly those operating in industries where there is opportunity for collaboration and mutual benefit, such as energy efficiency, clean technology, healthcare and e-commerce.
Market ChallengesThe depth and complexity of China’s proposed macroeconomic reforms bring with them significant challenges and pitfalls that will require skillful strategizing and implementation. The World Bank recently ranked China 90th (out of 189) in its 2015 Ease of Doing Business Report (an improvement of 3 points over the 2014 edition). However, China’s explosive economic growth during the last several decades is beginning to slow. In 2014, real GDP settled in at 7.4%, down from 7.7% in 2013 (down from 10.4% in as recently as 2010). This is the lowest that China’s GDP growth has been in 25 years. The government
101This copy belongs to Chris Parks
china
has set public expectations to a 7% growth target in 2015, which some economists consider achievable provided that the country can boost consumption. U.S. companies operating in China report concerns about increasing labor costs, shortages of qualified employees, a lack of transparency, inconsistent regulatory interpretation, weak protection and enforcement of intellectual property rights, competition with Chinese companies, Internet censorship, forced transfer of technology, and challenges in obtaining administrative licenses and approvals. Notably, perhaps due to President Xi’s anti-corruption campaign, U.S. companies are reporting concerns about corruption less frequently.
Market OpportunitiesDespite these and other longstanding concerns, China remains an extremely attractive market for many U.S. companies. In general, U.S. companies are reporting that it is still possible to make a profit in China, but profit is tougher to come by and margins are shrinking. AmCham China reports that nearly one-third of companies now derive more than half of their revenues in China from locally designed, developed or tailored products and services. Nearly half of respondents to a U.S.-China Business Council survey report double-digit revenue expansion — less than in prior years, but still impressive compared to other markets. Likewise, 70% of companies that responded to the USCBC survey are optimistic about domestic market growth. Furthermore, over the past year, the Chinese central government announced a series of reforms and pledges that could lead to limited improvements in the overall investment climate, both from a market access and a regulatory standpoint if they are implemented. At the end of 2014, China also announced the establishment of three new Free Trade Zones (FTZs) in Tianjin, Guangdong and Fujian. The FTZs are expected to expand an investment registration regime established in the Shanghai FTZ, which is simpler than the approval process required throughout most of China, and open some previously closed sectors to foreign investment. The United States and China continued to work toward narrowing differences and reaching agreement on the text of a high-standard Bilateral Investment Treaty (BIT) that would enhance fairness, openness and transparency in China.
Market-Entry StrategyAs always, companies should consider their own resources, previous export or business experience abroad, and long-term business strategy before entering the China market. For many companies, representation in China by a Chinese agent, distributor or partner that can provide local knowledge and contacts will be critical for success. Holders of intellectual property rights should understand how to protect their IP under Chinese law before entering the China market, and should conduct thorough due diligence on potential partners or buyers before entering into any transaction. All companies, IP rights holders and otherwise, should consult closely with lawyers who have extensive experience with the China market, including attorneys based in the United States and China.
“Doing Business in China” article is provided by the U.S. Commercial Service, the trade promotion arm of the U.S. Department of Commerce’s International Trade Administration. For more information on doing business in China, you may visit their website at www.export.gov/China.
The following charts are based on import and export data provided by the China Musical Instrument Association (CMIA)
102This copy belongs to Chris Parks

International Data
Demographics
65+10.0%
0–1417.1%
15–6472.9%
Economy
GDP-Industry42.7%
GDP-Service48.4%
GDP-Agriculture
8.9%
Population in billions 1.4
Median Age 36.8Population Growth 0.45%
0
4
8
12
16
20
'15'14'13'12'11'10'09'08'07'06'05'04
China GDP (PPP) (U.S. $ in trillions)
0
1
2
3
4
5
6
7
8
'15'14'13'12'11'10'09'08'07'06'05'04
Unemployment Rate (Percent)
-2
0
2
4
6
8
'15'14'13'12'11'10'09'08'07'06'05'04
In�ation (Annual Percent Rate)
CHINA SNAPSHOT
Demographics
Economy
Age Male Female
0–14 0.13 0.11
15–64 0.51 0.48
65 & Over 0.07 0.07
GDP (PPP) $19.51 trillion
GDP Per Capita $14,300
GDP-Real Growth Rate 6.80%
Unemployment Rate 4.20%
Inflation 1.50%
Data Source: Demographics, Economy and Trade from CIA World Factbook, Music Industry from The Music Trades. GDP (PPP): Gross Domestic Product based on purchasing-power-parity (PPP) valuation of country GDP in U.S. dollars.
China Snapshot
103This copy belongs to Chris Parks

0
2
4
6
8
10
12
14
16
18
S. KoreaJapanHong KongU.S.
Export Partners (2015)
Ann
ual P
erce
ntag
e
0
2
4
6
8
10
GermanyTaiwanU.S.JapanS. Korea
Import Partners (2015)
Ann
ual P
erce
ntag
e
0.0
0.2
0.4
0.6
0.8
1.0
1.2
'14'13'12'11'10'09'08'07'06'05
Music Sales Per Capita (U.S. $)
0
1
2
3
4
5
6
7
8
9
'14'13'12'11'10'09'08'07'06'05
Share of Global Music Market(Percent)
0.0
0.2
0.4
0.6
0.8
1.0
1.2
1.4
1.6
'14'13'12'11'10'09'08'07'06'05
China Music Market (U.S. $ in billions)
Music Industry
Trade
Total Export $2.3 trillion Export as % of GDP 11.64%
Total Import $1.6 trillion Import as % of GDP 8.20%
Music Market $1.4 billion
Sales Per Capita $1.01
Global Share 8.20%
104This copy belongs to Chris Parks

International Data
0
20
40
60
80
100
120
'15'14'13'12'11'10'09'08'07'06
Total PianosExports
Valu
e in
U.S
. $ m
illio
ns
Uni
ts x
1,0
00
Value Units
0
10
20
30
40
50
60
70
80
90
'15'14'13'12'11'10'09'08'07'06
0
20
40
60
80
100
120
140
160
180
'15'14'13'12'11'10'09'08'07'06
Total PianosImports
Valu
e in
U.S
. $ m
illio
ns
Uni
ts x
1,0
00
Value Units
0
25
50
75
100
125
150
'15'14'13'12'11'10'09'08'07'06
China Imports and Exports(The data received by NAMM was calculated in U.S. dollars.)
0
20
40
60
80
100
120
'15'14'13'12'11'10'09'08'07'06
Upright PianosImports
0
20
40
60
80
100
120
140
160
'09'08'07'06'05'04'03'02'01'00
Valu
e in
U.S
. $ m
illio
ns
Uni
ts x
1,0
00
Value Units
0
20
40
60
80
100
120
140
160
'15'14'13'12'11'10'09'08'07'06
0
10
20
30
40
50
60
70
'15'14'13'12'11'10'09'08'07'06
Upright PianosExports
0
10
20
30
40
50
60
70
0403020100999897
Valu
e in
U.S
. $ m
illio
ns
Uni
ts x
1,0
00U
nits
x 1
,000
Value Units
0
10
20
30
40
50
60
70
'15'14'13'12'11'10'09'08'07'060
10
20
30
40
50
'15'14'13'12'11'10'09'08'07'06
Grand PianosImports
Valu
e in
U.S
. $ m
illio
ns
Uni
ts x
1,0
00
Value Units
0
1
2
3
4
5
6
7
'15'14'13'12'11'10'09'08'07'06
0
5
10
15
20
25
30
35
40
45
'15'14'13'12'11'10'09'08'07'06
Grand PianosExports
0
5
10
15
20
25
0403020100999897
Valu
e in
U.S
. $ m
illio
ns
Uni
ts x
1,0
00U
nits
x 1
,000
Value Units
0
3
6
9
12
15
18
'15'14'13'12'11'10'09'08'07'06
China
105This copy belongs to Chris Parks

0
2
4
6
8
10
12
'15'14'13'12'11'10'09'08'07'06
GuitarsImports
Valu
e in
U.S
. $ m
illio
ns
Uni
ts x
1,0
00
Value Units
0
20
40
60
80
100
120
140
'15'14'13'12'11'10'09'08'07'06
0
50
100
150
200
250
300
350
400
'15'14'13'12'11'10'09'08'07'06
GuitarsExports
Valu
e in
U.S
. $ m
illio
ns
Uni
ts x
1,0
00,0
00
Value Units
0
2
4
6
8
10
12
14
'15'14'13'12'11'10'09'08'07'06
0
10
20
30
40
50
60
70
80
90
'15'14'13'12'11'10'09'08'07'06
Stringed Instruments with BowExports
0.0
0.2
0.4
0.6
0.8
1.0
1.2
1.4
1.6
0403020100999897
Valu
e in
U.S
. $ m
illio
ns
Uni
ts x
1,0
00,0
00
Value Units
0.0
0.2
0.4
0.6
0.8
1.0
1.2
1.4
1.6
'15'14'13'12'11'10'09'08'07'06
0.0
0.5
1.0
1.5
2.0
2.5
'15'14'13'12'11'10'09'08'07'06
Stringed Instruments with BowImports
Valu
e in
U.S
. $ m
illio
ns
Uni
ts x
1,0
00
Value Units
0
1
2
3
4
5
6
7
'15'14'13'12'11'10'09'08'07'06
China Imports and Exports
0
2
4
6
8
10
12
'15'14'13'12'11'10'09'08'07'06
Total Stringed InstrumentsImports
Valu
e in
U.S
. $ m
illio
ns
Uni
ts x
1,0
00
Value Units
0
20
40
60
80
100
120
140
'15'14'13'12'11'10'09'08'07'06
0
50
100
150
200
250
300
350
400
450
'15'14'13'12'11'10'09'08'07'06
Total Stringed InstrumentsExports
Valu
e in
U.S
. $ m
illio
ns
Uni
ts x
1,0
00,0
00
Value Units
0
2
4
6
8
10
12
14
16
'15'14'13'12'11'10'09'08'07'06
106This copy belongs to Chris Parks

International Data
0
25
50
75
100
125
150
'15'14'13'12'11'10'09'08'07'06
PercussionExports
Valu
e in
U.S
. $ m
illio
ns
Uni
ts x
1,0
00,0
00
Value Units
0
4
8
12
16
20
'15'14'13'12'11'10'09'08'07'06
0
3
6
9
12
15
'15'14'13'12'11'10'09'08'07'06
PercussionImports
Valu
e in
U.S
. $ m
illio
ns
Uni
ts x
1,0
00
Value Units
0100
200
300
400
500
600
700
800
900
'14'14'13'12'11'10'09'08'07'06
0
10
20
30
40
50
60
70
80
90
'15'14'13'12'11'10'09'08'07'06
BrasswindExports
0
100
200
300
400
500
600
700
0403020100999897
Valu
e in
U.S
. $ m
illio
ns
Uni
ts x
1,0
00
Value Units
01002003004005006007008009001000
'15'14'13'12'11'10'09'08'07'06
0.0
0.5
1.0
1.5
2.0
2.5
3.0
3.5
4.0
'15'14'13'12'11'10'09'08'07'06
BrasswindImports
0
2
4
6
8
10
12
14
0403020100999897
Valu
e in
U.S
. $ m
illio
ns
Uni
ts x
1,0
00
Value Units
0
2
4
6
8
10
12
14
'15'14'13'12'11'10'09'08'07'06
China Imports and Exports
0
5
10
15
20
25
'15'14'13'12'11'10'09'08'07'06
Electronic KeyboardsImports
Valu
e in
U.S
. $ m
illio
ns
Uni
ts x
1,0
00
Value Units
0
50
100
150
200
250
'15'14'13'12'11'10'09'08'07'06
0
50
100
150
200
250
300
350
400
'15'14'13'12'11'10'09'08'07'06
Electronic KeyboardsExports
Valu
e in
U.S
. $ m
illio
ns
Uni
ts x
1,0
00,0
00
Value Units
0
1
2
3
4
5
6
7
'15'14'13'12'11'10'09'08'07'06
China
107This copy belongs to Chris Parks

0
1
2
3
4
5
6
7
'15'14'13'12'11'10'09'08'07'06
Electronic InstrumentsImports
Valu
e in
U.S
. $ m
illio
ns
Uni
ts x
1,0
00
Value Units
0
25
50
75
100125
150
175
200
225
'15'14'13'12'11'10'09'08'07'06
0
50
100
150
200
250
300
350
'15'14'13'12'11'10'09'08'07'06
AccordionsImports
Valu
e in
U.S
. $ th
ousa
nds
Uni
ts
Value Units
0
200
400
600
800
1000
1200
1400
'15'14'13'12'11'10'09'08'07'06
0
1
2
3
4
5
6
7
8
'15'14'13'12'11'10'09'08'07'06
Instrument StringsImports
Valu
e in
U.S
. $ m
illio
ns
Uni
ts x
1,0
00
Value Units
0
50
100
150
200
250
300
350
'15'14'13'12'11'10'09'08'07'06
0
50
100
150
200
250
300
'15'14'13'12'11'10'09'08'07'06
Electronic InstrumentsExports
Valu
e in
U.S
. $ m
illio
ns
Uni
ts x
1,0
00,0
00
Value Units
0
2
4
6
8
10
'15'14'13'12'11'10'09'08'07'06
0
5
10
15
20
25
'15'14'13'12'11'10'09'08'07'06
AccordionsExports
Valu
e in
U.S
. $ m
illio
ns
Uni
ts x
1,0
00
Value Units
0
100
200
300
400
500
600
700
'15'14'13'12'11'10'09'08'07'06
0
1
2
3
4
5
6
7
8
9
'15'14'13'12'11'10'09'08'07'06
Instrument StringsExports
Valu
e in
U.S
. $ m
illio
ns
Uni
ts x
1,0
00
Value Units
0
100
200
300
400
500
'15'14'13'12'11'10'09'08'07'06
China Imports and Exports
108This copy belongs to Chris Parks

International Data
0
5
10
15
20
25
30
35
40
CanadaU.K.
GermanySouth Korea
U.S.
2015 Top Five Stringed Instrument with Bow Export Destinations
Valu
e in
U.S
. $ m
illio
ns
Uni
ts x
1,0
00
Value Units
0
100
200
300
400
500
CanadaU.K.GermanySouth KoreaU.S.
0
10
20
30
40
50
60
70
80
90
FranceHong KongJapanGermanyU.S.
2015 Top Five Electronic Keyboard Export Destinations
0.0
0.2
0.4
0.6
0.8
1.0
1.2
0100999897
Valu
e in
U.S
. $ m
illio
ns
Uni
ts x
1,0
00,0
00
Value Units
0.0
0.2
0.4
0.6
0.8
1.0
1.2
FranceHong KongJapanGermanyU.S.
Top Five Chinese Export Destinations
0
10
20
30
40
50
60
70
80
U.K.GermanyHollandJapanU.S.
2015 Top Five Electric Instrument Export Destinations
0.0
0.2
0.4
0.6
0.8
1.0
0100999897
Valu
e in
U.S
. $ m
illio
ns
Uni
ts X
1,0
00,0
00
Value Units
0.0
0.2
0.4
0.6
0.8
1.0
U.K.GermanyHollandJapanU.S.
0
2
4
6
8
10
12
U.K.Germany
AustraliaHong Kong
U.S.
2015 Top Five Grand Piano Export Destinations
0.0
0.5
1.0
1.5
2.0
2.5
3.0
3.5
0100999897
Valu
e in
U.S
. $ m
illio
ns
Uni
ts X
1,0
00
Value Units
0.0
0.5
1.0
1.5
2.0
2.5
3.0
3.5
U.K.GermanyAustraliaHong KongU.S.
0
20
40
60
80
100
MalaysiaU.K.BrazilGermanyU.S.
2015 Top Five Guitar Export Destinations
0.0
0.5
1.0
1.5
2.0
2.5
0100999897
Valu
e in
U.S
. $ m
illio
ns
Uni
ts x
1,0
00,0
00
Value Units
0.0
0.5
1.0
1.5
2.0
2.5
MalaysiaU.K.BrazilGermanyU.S.
0
1
2
3
4
5
6
7
IranSouth Korea
GermanyHong Kong
U.S.
2015 Top Five Upright Piano Export Destinations
Valu
e in
U.S
. $ m
illio
ns
Uni
ts x
1,0
00
Value Units
0.00.5
1.0
1.5
2.0
2.5
3.0
3.5
4.0
4.5
IranSouth KoreaGermanyHong KongU.S.
China
109This copy belongs to Chris Parks

Top Five Chinese Export Destinations
0
5
10
15
20
25
30
35
FranceMexicoU.K.GermanyU.S.
2015 Top Five BrasswindInstrument Export Destinations
Valu
e in
U.S
. $ m
illio
ns
Uni
ts x
1,0
00
Value Units
0
25
50
75
100
125
150
175
200
FranceMexicoU.K.GermanyU.S.
0
200
400
600
800
1000
U.S.MalaysiaJapanBelgiumIndonesia
2015 Top Five Instrument StringExport Destinations
Valu
e in
U.S
. $ th
ousa
nds
Uni
ts x
1,0
00Value Units
0
10
20
30
40
50
U.S.MalaysiaJapanBelgiumIndonesia
0
5
10
15
20
25
30
35
40
45
South KoreaJapan
NigeriaGermany
U.S.
2015 Top Five PercussionExport Destinations
Valu
e in
U.S
. $ m
illio
ns
Uni
ts x
1,0
00,0
00
Value Units
0.0
0.5
1.0
1.5
2.0
2.5
South KoreaJapanNigeriaGermanyU.S.
0.0
0.5
1.0
1.5
2.0
2.5
3.0
3.5
BrazilGermanyMexicoSouth KoreaU.S.
2015 Top Five AccordionExport Destinations
Valu
e in
U.S
. $ m
illio
ns
Uni
ts x
1,0
00
Value Units
0
20
40
60
80
100
BrazilGermanyMexicoSouth KoreaU.S.
110This copy belongs to Chris Parks

International DataCzech Republic
DOING BUSINESS IN THE CZECH REPUBLIC
Market OverviewThe economic health of this country is largely based on the growth in exports. About 80% of the nation’s GDP is linked to export orders, with 82% of Czech exports directed to EU28 countries and a third of total exports going to Germany. In this regard, 2014 represented a good year for the country, which posted a record trade surplus of US$11.8 billion, a 27% increase over 2013 (US$9.3 billion). This strong trade growth trend is expected to continue in 2015 due to the fall in oil prices, which will also keep inflation at low levels.
The United States has benefited significantly from this strong growth in foreign trade; bilateral trade more than doubled to over US$6.6 billion (US$7.6 billion based on Czech government data). U.S. exports to the Czech Republic increased by 137% in the past five years, while Czech exports to the U.S. increased by 124%. By comparison, U.S. exports to the EU have increased by only 25% since 2009, while U.S.-EU bilateral trade increased by just 38%. Exporters should be aware that U.S. exports to Poland increased by 59% during this period, making the regional Czech/Polish markets a growth opportunity that should not be overlooked.
Over the first two decades of Czech independence, foreign direct investment (FDI) has played a significant role in boosting the country’s productivity, and the United States has had an important role in this regard as the largest non-European investor in the country. In 2013, cumulative U.S. FDI was reported to be US$5 billion according to the Czech National Bank (US$6.2 billion according to the Department of Commerce, Bureau of Economic Analysis).
The World Economic Forum considers the Czech Republic to be a Tier 3, or “innovation-driven” economy, placing it on the same level as its neighbors to the west. Other than the Slovak Republic and Slovenia, it is the only country in Central and Eastern Europe to achieve this ranking. In terms of the WEF’s Global Competitiveness Index (GCI) sub-rankings, the Czech Republic was ranked average for Tier 3 economies. However, the country will need to find ways to transition to a knowledge-based economy in order to compete with its western neighbors. The WEF ranks the Czech Republic among the best of the newer EU member states in general and scientific infrastructure.
Market ChallengesThe 2014/2015 ranking of the World Economic Forum’s GCI placed the Czech Republic at 37th, an improvement from 46th place in the 2013/2014 report, and almost reaching its highest ranking of 36th in 2010. Inefficient government bureaucracy and corruption were still cited as the two most problematic factors in doing business here. The country was 98th in terms of diversion of public money (an improvement of 19 places); 106th in terms of favoritism toward certain companies in government decisions (an improvement of 17 places); and 138th in the level of public trust in politicians (an improvement of 8 places but still very low). In Central and Eastern Europe, Estonia continued to be considered more competitive. According to the European Commission Country Report “Czech Republic 2015,” the Czech economy grew in 2014 after two years of decline. The growth was attributed to domestic demand, with strong growth in investment and trade. Inflation has been low, and the Czech National Bank has maintained a floor under the exchange rate. The commission estimated
CZE
CH
RE
PU
BLIC
111This copy belongs to Chris Parks

that GDP growth was 2.3% in 2014 and expects the economy to continue to grow in 2015 and 2016. The Czech Statistical Office projects 2.5% growth in 2015. The Czech Central Bank predicted a turnaround in the economy with growth spurred by an increase in foreign demand and a relaxation of domestic monetary conditions. The Czech government faces challenges and hurdles, such as the slow pace of legislative reforms and industrial restructuring, planned healthcare and pension reforms, making the public procurement process more transparent, and a growing shortage of highly skilled technical workers.
Market OpportunitiesDemand in the Czech market goes beyond the few best-prospect sectors that this report is able to cover. Though the country no longer has access to EU accession funds, it still receives EU funding directed at such diverse areas as healthcare reform, environment, transportation, infrastructure projects outside of Prague, and education exchange programs. Although it has a small population of 10.5 million, the Czech Republic has the second-highest per capita GDP of any nation in Central and Eastern Europe and provides many opportunities for experienced exporters.
Market-Entry StrategiesThe Czech Republic is not the ideal destination for new-to-export companies, but as an EU member and a place where English is widely understood in the business community, it is an excellent choice for experienced exporters looking to broaden their global reach, especially those who are seeking new opportunities outside Western Europe. The Czech Republic is characterized by wide population dispersion. More than 10% of the population is centered in Prague, the only city with more than 1 million inhabitants, while the majority of Czechs live within 30 minutes of other major commercial/industrial hubs (Brno, Plzen, Olomouc, etc.). Urban consumers generally have greater purchasing power than their rural counterparts. Success in this market typically requires an in-country presence such as an agent, distributor or representative office. The country’s communications network is relatively well developed and email communication and website offerings are an increasingly effective means of reaching local buyers. Pricing remains the most critical factor in positioning a product or service for sale. Bank lending remains the source of company financing in this country. In 2014, the average exchange rate was 22 CZK/1 USD per U.S. Treasury data. Most exporters find that using the services of local distributors is an easy first step for entering the market. Local distributors typically take responsibility for handling customs clearance, dealing with established wholesalers/retailers, marketing the product directly to major corporations or the government, and handling after-sales service. Other issues to consider include:
• Taking a regional approach involving one or more Central or Eastern European countries. Poland and Slovakia tend to be the other nations that fit within a successful regional strategy, with Hungary a close third.
• Establish a local presence or select a local partner for effective marketing and sales distribution.
czech republic
czech republic
112This copy belongs to Chris Parks

International Data
• Perform detailed market research to identify specific sector opportunities.
• Use the experience of other, successful U.S. companies in the market. The local American Chamber of Commerce is a valuable resource.
U.S. businesses should be aware that, like all other members of the European Union, the Czech Republic is also governed by EU regulations.
“Doing Business in the Czech Republic” article is provided by the U.S. Commercial Service, the trade promotion arm of the U.S. Department of Commerce’s International Trade Administration. For more information on doing business in the Czech Republic, you may visit their website at www.export.gov/CzechRepublic.
The following charts are based on import and export data obtained from the Czech Statistical Office in conjunction with Zuzana Petrofova of PETROF, spol. s r.o.
czech republic
Czech Republic
113This copy belongs to Chris Parks

Demographics
65+18.0%
0–1415.0%
15–6467.0%
Economy
GDP-Industry28.2%
GDP-Agriculture2.6%
GDP-Service59.2%
Population in millions 10.6
Median Age 41.3Population Growth 0.16%
0
50
100
150
200
250
300
350
'15'14'13'12'11'10'09'08'07'06'05'04
Czech Republic GDP (PPP)(U.S. $ in billions)
0
2
4
6
8
10
12
'15'14'13'12'11'10'09'08'07'06'05'04
Unemployment Rate(Percent)
0
1
2
3
4
5
6
7
'15'14'13'12'11'10'09'08'07'06'05'04
In�ation (Annual Percent Rate)
CZECH REPUBLIC SNAPSHOT
Demographics
Economy
GDP (PPP) $331.4 billion
GDP Per Capita $31,500
GDP-Real Growth Rate 3.90%
Unemployment Rate 6.50%
Inflation 0.40%
Age Male Female
0–14 0.82 0.78
15–64 3.62 3.51
65 & Over 0.79 1.13
Data Source: Demographics, Economy and Trade from CIA World Factbook, Music Industry from The Music Trades. GDP (PPP): Gross Domestic Product based on purchasing-power-parity (PPP) valuation of country GDP in U.S. dollars.
114This copy belongs to Chris Parks
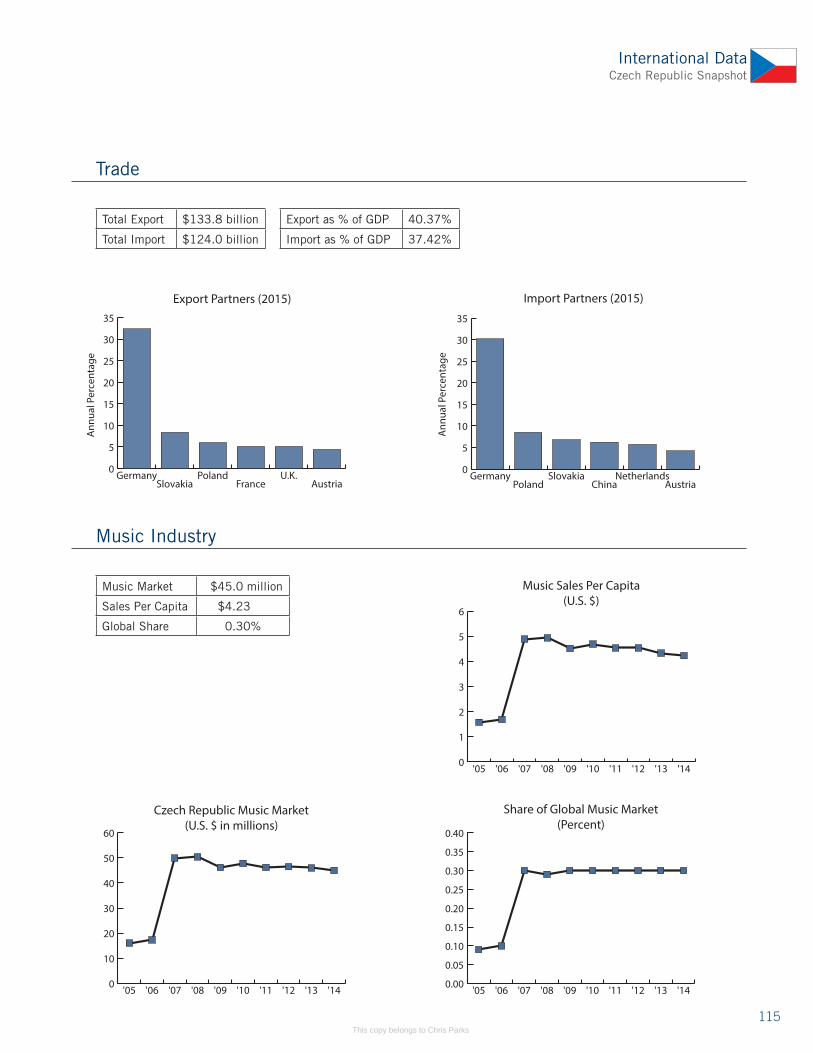
International Data
Trade
Music Industry
0
5
10
15
20
25
30
35
AustriaU.K.
FrancePoland
SlovakiaGermany
Export Partners (2015)
Ann
ual P
erce
ntag
e
0
5
10
15
20
25
30
35
AustriaNetherlands
ChinaSlovakia
PolandGermany
Import Partners (2015)
Ann
ual P
erce
ntag
e
Music Sales Per Capita(U.S. $)
0
1
2
3
4
5
6
'14'13'12'11'10'09'08'07'06'05
Share of Global Music Market(Percent)
0.00
0.05
0.10
0.15
0.20
0.25
0.30
0.35
0.40
'14'13'12'11'10'09'08'07'06'05
Czech Republic Music Market(U.S. $ in millions)
0
10
20
30
40
50
60
'14'13'12'11'10'09'08'07'06'05
Total Export $133.8 billion Export as % of GDP 40.37%
Total Import $124.0 billion Import as % of GDP 37.42%
Music Market $45.0 million
Sales Per Capita $4.23
Global Share 0.30%
Czech Republic Snapshot
115This copy belongs to Chris Parks

0.0
0.5
1.0
1.5
2.0
2.5
3.0
'15'14'13'12'11'10'09'08'07'06
Acoustic PianosImports
Valu
e in
U.S
. $ m
illio
ns
Import Value
0.0
0.5
1.0
1.5
2.0
2.5
3.0
3.5
4.0
4.5
'15'14'13'12'11'10'09'08'07'06
Fretted & Stringed InstrumentsImports
Valu
e in
U.S
. $ m
illio
ns
Import Value
0
2
4
6
8
10
12
'15'14'13'12'11'10'09'08'07'06
KeyboardsImports
Valu
e in
U.S
. $ m
illio
ns
Import Value
0
5
10
15
20
25
30
35
'15'14'13'12'11'10'09'08'07'06
Acoustic PianosExports
Valu
e in
U.S
. $ m
illio
ns Export Value
0
1
2
3
4
5
6
7
8
9
'15'14'13'12'11'10'09'08'07'06
Fretted & Stringed InstrumentsExports
Valu
e in
U.S
. $ m
illio
ns
Export Value
0.0
0.5
1.0
1.5
2.0
2.5
3.0
3.5
4.0
4.5
'15'14'13'12'11'10'09'08'07'06
KeyboardsExports
Valu
e in
U.S
. $ m
illio
ns
Export Value
Czech Republic Imports and Exports
116This copy belongs to Chris Parks

International Data
0.0
0.5
1.0
1.5
2.0
2.5
3.0
'15'14'13'12'11'10'09'08'07'06
Wind InstrumentsImports
Valu
e in
U.S
. $ m
illio
ns
Import Value
0.0
0.5
1.0
1.5
2.0
2.5
'15'14'13'12'11'10'09'08'07'06
PercussionImports
Valu
e in
U.S
. $ m
illio
ns
Import Value
0
2
4
6
8
10
12
14
'15'14'13'12'11'10'09'08'07'06
AccessoriesImports
Valu
e in
U.S
. $ m
illio
ns
Import Value
0
1
2
3
4
5
6
7
8
'15'14'13'12'11'10'09'08'07'06
Wind InstrumentsExports
Valu
e in
U.S
. $ m
illio
ns Export Value
0
100
200
300
400
500
600
700
800
'15'14'13'12'11'10'09'08'07'06
PercussionExports
Valu
e in
U.S
. $ th
ousa
nds
Export Value
0
2
4
6
8
10
12
'15'14'13'12'11'10'09'08'07'06
AccessoriesExports
Valu
e in
U.S
. $ m
illio
ns
Export Value
Czech Republic Imports and Exports
Czech Republic
117This copy belongs to Chris Parks

DOING BUSINESS IN FINLAND
Market OverviewFinland, an EU member since 1995, has redefined itself from a quiet agriculture-based economy to a trend-setting, global center for technology and design. The country is highly integrated into the global economy with international trade accounting for a third of GDP. Finland’s commercial clout far exceeds its modest population of 5.4 million. It routinely ranks at the very top of international surveys on education, quality of life, competitiveness and transparency.
Finland is at the epicenter of Europe’s “New North”: a unique intersection of geography, infrastructure, education, good governance and high-technology industry. Among EU countries, Finland is second only to Ireland in terms of high-tech and knowledge-based manufacturing intensity. Finland sits next to its Nordic neighbors Sweden and Norway and shares a 900-mile long border and a complicated history with Russia. Despite Russia’s occupation of the Crimea region of Ukraine and sanctions and counter-sanctions affecting bilateral trade, Finland maintains an important commercial relationship with its larger, more populous neighbor. Many Finnish companies have successful, longstanding business operations in Russia.
Currently, the U.S. represents the third largest market for Finnish exports and Finland’s sixth largest source of imports. Two-way trade between the U.S. and Finland was about US$7.15 billion in 2014, chiefly in the electronics, paper, medical equipment and telecommunications industries. Finnish imports of U.S. goods in 2014 were valued at US$2.15 billion. Finnish exports of goods to the U.S. totaled about US$5 billion.
The European Union makes up close to 60% of Finland’s total trade. The largest trade flows are with Germany (EU), Russia (non-EU) and Sweden (EU). Finland’s key export sectors are transportation, electronics, forestry, machinery and chemicals. Trade policy is managed by the European Union, which is currently negotiating the Transatlantic Trade and Investment Partnership (T-TIP) free trade agreement with the U.S. Trade-dependent Finland has traditionally been a firm advocate for free trade. It is the only Nordic country to use the euro.Helsinki, the second most northern capital in the world, is a pocket-sized green maritime metropolis with easy connections by rail, sea and air to Tallinn, St. Petersburg and Stockholm. In Helsinki and throughout Finland, nature reigns supreme. Finns are nature lovers, a characteristic that has made them, along with their Nordic neighbors, global leaders in sectors such as clean tech, high-performance building products and energy and resource efficiency.
Market ChallengesFinland’s import climate is open and receptive to U.S. products and investments. There are few barriers to trade. However, hampered by sluggish export markets in the EU and more recently Russia, Finland’s economy has experienced several back-to-back years of negative growth. The overall size of the Finnish domestic market is relatively small, and prolonged recession means that competition in some sectors is fierce. Finnish consumers have high expectations in terms of product innovation, design, quality and price.
Companies seeking to set up operations in Finland should note that while rule of law and transparency predominate, and skilled labor in key fields like engineering is abundant, regulations and red tape, taxes and inflexible labor laws pose challenges to business competitiveness.
FINLA
ND
finland
118This copy belongs to Chris Parks

International DataFinland
There is one specific trade barrier that contrasts with an otherwise transparent and predictable business environment: the Finnish government’s pharmaceutical reference pricing system.
Market OpportunitiesFinland has a vibrant start-up scene and offers opportunities for investment and collaboration in video gaming, ICT and e-health solutions.
Finland introduced its latest national long-term climate and energy strategy in 2013. Cleantech sector growth has been driven by smaller firms operating in the areas of new materials, smart grids, recycling, and measurement technologies. New cleantech and e-mobility areas to watch now include electric vehicle components and processes for EV manufacturing.
The development of renewable energy in Finland is expected to offer opportunities for U.S. companies with innovative renewable energy technologies, processes and equipment.
Finland has been involved in the development of low-energy and eco-efficient construction alternatives since the late 1980s. Driven by a continuous challenge to decrease the energy use of the building stock, the Finnish building industry is committing to energy-efficient and intelligent building products, services and technologies.
Finland has expertise in developing computer software products and is looking for U.S. partners.
Finnish healthcare remains interested in state-of-the-art medical equipment and e-health solutions.
U.S. chairmanship of the Arctic Council offers a unique opportunity to engage with Finnish companies on cold-climate technologies and solutions applicable to the circumpolar environment.
Market-Entry StrategyIn addition to being an EU member, Finland is particularly closely linked culturally and economically with the other “Nordics”: Denmark, Norway and Sweden. These economies are all advanced, high income and highly connected. While each country has its own unique market and characteristics, there are certain synergies that tie together these highly innovative marketplaces. With an aggregate GDP of US$1.69 trillion and a combined population of 26 million people, the Nordics represent a unique opportunity for U.S. companies with sophisticated, high-quality products, technologies and services. These open but competitive markets allow for a variety of market-entry strategies. Representatives and distributors are common methods employed for initial market entry. The U.S. Commercial Service team in the Nordics works regionally and collaboratively to offer cross- border, multi-market advice and solutions for U.S. companies looking to identify local business partners or other market-entry options in Finland, as well as throughout the Nordic-Baltic region and the rest of Europe.
“Doing Business in Finland” article is provided by the U.S. Commercial Service, the trade promotion arm of the U.S. Department of Commerce’s International Trade Administration. For more information on doing business in Finland, you may visit their website at www.export.gov/Finland.
The following charts are based on import and export data obtained from the website of the International Trade Centre (ITC)
finland
119This copy belongs to Chris Parks

Demographics
65+20.2%
0–1416.4%
15–6463.4%
Economy
GDP-Industry26.9%
GDP-Agriculture2.9%
GDP-Service70.2%
Population in millions 5.5
Median Age 42.4Population Growth 0.40%
0
50
100
150
200
250
'15'14'13'12'11'10'09'08'07'06'05'04
Finland GDP (PPP)(U.S. $ in billions)
0
2
4
6
8
10
12
'15'14'13'12'11'10'09'08'07'06'05'04
Unemployment Rate(Percent)
-1
0
1
2
3
4
5
'15'14'13'12'11'10'09'08'07'06'05'04
In�ation (Annual Percent Rate)
FINLAND SNAPSHOT
Demographics
Economy
GDP (PPP) $224.7 billion
GDP Per Capita $41,200
GDP-Real Growth Rate 0.40%
Unemployment Rate 9.40%
Inflation –0.20%
Age Male Female
0–14 0.46 0.44
15–64 1.76 1.71
65 & Over 0.48 0.63
Data Source: Demographics, Economy and Trade from CIA World Factbook, Music Industry from The Music Trades. GDP (PPP): Gross Domestic Product based on purchasing-power-parity (PPP) valuation of country GDP in U.S. dollars.
120This copy belongs to Chris Parks

International DataFinland Snapshot
Trade
Music Industry
0
2
4
6
8
10
12
14
NetherlandsU.S.RussiaSwedenGermany
Export Partners (2015)
Ann
ual P
erce
ntag
e
0
2
4
6
8
10
12
14
16
DenmarkNetherlands
RussiaGermany
Sweden
Import Partners (2015)
Ann
ual P
erce
ntag
e
Music Sales Per Capita(U.S. $)
0
3
6
9
12
15
18
'14'13'12'11'10'09'08'07
Share of Global Music Market(Percent)
0.0
0.1
0.2
0.3
0.4
0.5
0.6
'14'13'12'11'10'09'08'07
Finland Music Market(U.S. $ in millions)
0
20
40
60
80
100
'14'13'12'11'10'09'08'07
Total Export $66.9 billion Export as % of GDP 29.77%
Total Import $58.1 billion Import as % of GDP 25.83%
Music Market $75.0 million
Sales Per Capita $13.69
Global Share 0.50%
*The Music Trades began reporting data on Finland in 2007.
121This copy belongs to Chris Parks

0.0
0.5
1.0
1.5
2.0
2.5
3.0
3.5
4.0
'15'14'13'12'11'10'09'08'07'06
Acoustic PianosImports
Valu
e in
U.S
. $ m
illio
ns
Import Value
0.0
0.5
1.0
1.5
2.0
2.5
3.0
3.5
4.0
4.5
'15'14'13'12'11'10'09'08'07'06
Fretted & Stringed InstrumentsImports
Valu
e in
U.S
. $ m
illio
ns
Import Value
0
2
4
6
8
10
12
'15'14'13'12'11'10'09'08'07'06
KeyboardsImports
Valu
e in
U.S
. $ m
illio
ns
Import Value
0
10
20
30
40
50
60
70
80
'15'14'13'12'11'10'09'08'07'06
Acoustic PianosExports
Valu
e in
U.S
. $ th
ousa
nds
Export Value
0
50
100
150
200
250
300
350
'15'14'13'12'11'10'09'08'07'06
Fretted & Stringed InstrumentsExports
Valu
e in
U.S
. $ th
ousa
nds
Export Value
0
100
200
300
400
500
600
700
800
'15'14'13'12'11'10'09'08'07'06
KeyboardsExports
Valu
e in
U.S
. $ th
ousa
nds
Export Value
Finland Imports and Exports
122This copy belongs to Chris Parks

International DataFinland
0.0
0.5
1.0
1.5
2.0
2.5
3.0
3.5
'15'14'13'12'11'10'09'08'07'06
Wind InstrumentsImports
Valu
e in
U.S
. $ m
illio
ns
Import Value
0.0
0.5
1.0
1.5
2.0
2.5
3.0
3.5
4.0
'15'14'13'12'11'10'09'08'07'06
PercussionImports
Valu
e in
U.S
. $ m
illio
ns
Import Value
0
2
4
6
8
10
12
14
16
'15'14'13'12'11'10'09'08'07'06
AccessoriesImports
Valu
e in
U.S
. $ m
illio
ns
Import Value
0
100
200
300
400
500
600
'15'14'13'12'11'10'09'08'07'06
Wind InstrumentsExports
Valu
e in
U.S
. $ th
ousa
nds
Export Value
0
25
50
75
100
125
150
'15'14'13'12'11'10'09'08'07'06
PercussionExports
Valu
e in
U.S
. $ th
ousa
nds
Export Value
0.0
0.2
0.4
0.6
0.8
1.0
1.2
1.4
1.6
'15'14'13'12'11'10'09'08'07'06
AccessoriesExports
Valu
e in
U.S
. $ m
illio
ns
Export Value
Finland Imports and Exports
123This copy belongs to Chris Parks

FRANCE
The music industry market in France in 2015 has been globally stable in amount against the previous year, with some product categories slightly up balanced by others slightly down. One of main reasons for flat sales of new products is that there has been significant development in the second-hand market through Internet sales, which is affecting not only acoustic pianos but also brasswind and woodwind instruments and guitars. Details include:
• Acoustic pianos continued to face negative growth by a few percent, especially due to grand pianos experiencing fewer institutional sales.
• Digital pianos and keyboards kept a positive curve of a similar few percent.
• Brass and woodwind instruments were roughly stable, along with strings.
• The guitar market became stable (after several years of growth), with a significant downtrend of electric guitars, fairly balanced by acoustic guitars’ steady activity.
• Acoustic drums faced another year of downtrend, while electronic drums remained quite active.
• The music production market, although popular, continued to face a decrease of average price with a decline in total amount.
• The pro audio market is still growing, which has done regularly for many years.
Commentary by Thomas Hemery, Music & ProAudio Director for Yamaha Music Europe
DOING BUSINESS IN FRANCE
Market OverviewThe U.S.-French commercial and economic alliance is one of the United States’ oldest and closest bilateral relationships. The United States and France established diplomatic relations in 1778 and the United States’ first trade agreement, the Treaty of Amity and Commerce between the U.S. and France, was also signed in 1778. Relations between the countries have remained active and friendly; the two share common values and have parallel policies on most political, economic and security issues. Differences are discussed frankly and have not generally been allowed to impair the pattern of close cooperation that characterizes relations between them.
Trade and investment between the United States and France are strong. On average, over US$1 billion in commercial transactions, including sales of U.S. and French foreign affiliates, take place every day. U.S. exports to France include industrial chemicals, aircraft and engines, electronic components, telecommunications, computer software, computers
FRA
NC
E
france
124This copy belongs to Chris Parks

International DataFrance
france
and peripherals, analytical and scientific instrumentation, medical instruments and supplies, and broadcasting equipment. The United States is the top destination for French investment and is also the largest foreign investor in France. The two countries have a bilateral convention on investment and a bilateral tax treaty addressing, among other things, double taxation and tax evasion.
With a GDP of approximately US$2.84 trillion, France is the world’s sixth largest economy and the EU’s third largest economy after Germany and the UK. It has substantial agricultural resources but its manufacturing base has declined from 15.8% of GDP in 1999 to 11.3% in 2014. A dynamic services sector accounts for an increasingly large share of economic activity and is responsible for most job creation in recent years.
As a result of the stagnant GDP growth (0.2% in 2014, after 0.7% in 2013), the unemployment rate (Metropolitan France) is now in double digits, up from 9.6% in 2013 to 10.4% at the end of 2014. GDP is expected to slowly rebound in 2015 with growth above 1.0% and around 1.7–1.8% in 2016. GDP per capita in France was US$42,813 in 2014.
France is the third largest trading nation in Western Europe (after Germany and the UK). In 2014, the country ran a US$71 billion trade deficit of goods based on total trade of US$1.2 trillion. The majority of this trade (60%) was with EU-28 countries. France is a member of the G-8 (and initiator of the G-20), the European Union, the World Trade Organization and the OECD, confirming its status as a leading economic player.
France welcomes foreign investment and has a reliable business climate that attracts investors from around the world. The government devotes significant resources to attracting foreign investment and has launched the “French Tech Ticket” to attract foreign start-ups to the country. However, France is struggling to revitalize its economy and implement reforms to improve the legal and regulatory environment, including the deregulation of some sectors. France continues to support innovation in small and medium enterprises (SMEs).
Foreign investors say they find France’s skilled and productive labor force, good infrastructure, technology and central location in Europe attractive. France’s membership in the European Union (EU) and the Eurozone (as the 19 countries that use the euro currency are known) facilitates the movement of people, services, capital and goods.
France has strong investment relations with the United States. The U.S. FDI stock in France (US$78 billion in 2013) includes more than 1,240 affiliates of U.S. firms supporting an estimated 440,000 jobs. The activities of these U.S. affiliates can be viewed as the backbone of the commercial relationship between the two countries.
Market Challenges• Disincentives to investing in France include high taxes, a complicated tax and
administrative environment, the high cost of labor (with the minimum wage, called the SMIC for “Salaire Minimum Interprofessionnel de Croissance,” at US$1,592), rigid labor markets despite efforts to introduce some flexibility, and occasional strong negative reactions toward foreign investors planning to restructure, downsize or close.
125This copy belongs to Chris Parks

• One of the challenges for U.S. SMEs interested in breaking into the French market is dealing with highly concentrated retail distribution chains and networks, as well as, in some cases, French global manufacturers/suppliers that have a strong control over their retail networks. Many of these large retail networks have extremely well-organized buying offices that have put in place very stringent selection processes for new suppliers, products and services. High retail markup, ongoing competitive market innovation and creativity combined with a constantly changing theme-designs approach are prerequisites to keep up with retail trends.
Market Opportunities• Key sectors of the French economy include aerospace, food products,
pharmaceuticals, microelectronics, logistics and healthcare equipment. Call centers, biotechnology, telecommunications, information and communication technology and environment are other sectors with high potential. The government may further reduce its stake in electricity, gas, rail transport and postal services, opening them up to domestic and foreign investors.
• France is an economically developed nation with a large, diverse and sophisticated consumer base. It has a strong manufacturing sector that seeks out quality components from foreign suppliers. Finally, its comparatively affluent populace is a leading consumer of services, particularly in the educational and travel sectors. It should be noted that while the overall French market can be viewed as essentially similar to the U.S. market, the individual French consumer of products and services is very discriminating.
Market-Entry StrategiesIn general, the commercial environment in France is favorable for sales of U.S. goods and services. Marketing products and services in France is similar to the approach in the United States, notwithstanding some significant differences in cultural factors and certain legal and regulatory restrictions. However, because the French market is sophisticated with the entrenched bias of a conservative market that sticks to known suppliers and therefore requires sustained market development, entry should be well planned. Competition can be fierce, but local partners are readily available in most sectors and product lines.
“Doing Business in France” article is provided by the U.S. Commercial Service, the trade promotion arm of the U.S. Department of Commerce’s International Trade Administration. For more information on doing business in France, you may visit their website at www.export.gov/France.
The following charts are based on import and export data obtained from the website of the International Trade Centre (ITC)
france
126This copy belongs to Chris Parks

International DataFrance Snapshot
Demographics
0–1418.7%
65+18.7%
15–6462.6%
Economy
GDP-Industry19.3%
GDP-Agriculture1.7%
GDP-Service79.0%
Population in millions 66.6
Median Age 41.1Population Growth 0.43%
0.0
0.5
1.0
1.5
2.0
2.5
3.0
'15'14'13'12'11'10'09'08'07'06'05'04
France GDP (PPP)(U.S. $ in trillions)
0
2
4
6
8
10
12
'15'14'13'12'11'10'09'08'07'06'05'04
Unemployment Rate(Percent)
0.0
0.5
1.0
1.5
2.0
2.5
3.0
'15'14'13'12'11'10'09'08'07'06'05'04
In�ation (Annual Percent Rate)
FRANCE SNAPSHOT
Demographics
Economy
GDP (PPP) $2.65 trillion
GDP Per Capita $41,400
GDP-Real Growth Rate 1.20%
Unemployment Rate 9.90%
Inflation 0.10%
Age Male Female
0–14 6.35 6.07
15–64 20.86 20.81
65 & Over 5.36 7.11
Data Source: Demographics, Economy and Trade from CIA World Factbook, Music Industry from The Music Trades. GDP (PPP): Gross Domestic Product based on purchasing-power-parity (PPP) valuation of country GDP in U.S. dollars.
127This copy belongs to Chris Parks

Trade
Music Industry
0
3
6
9
12
15
18
U.S.U.K.
SpainItaly
BelgiumGermany
Export Partners (2015)
Ann
ual P
erce
ntag
e
0
4
8
12
16
20
ChinaSpain
NetherlandsItaly
BelgiumGermany
Import Partners (2015)
Ann
ual P
erce
ntag
e
Music Sales Per Capita(U.S. $)
0
2
4
6
8
10
12
14
16
'14'13'12'11'10'09'08'07'06'05
Share of Global Music Market(Percent)
0
1
2
3
4
5
6
'14'13'12'11'10'09'08'07'06'05
France Music Market(U.S. $ in millions)
0
100
200
300
400
500
600
700
800
900
'14'13'12'11'10'09'08'07'06'05
Total Export $509.1 billion Export as % of GDP 19.21%
Total Import $539.0 billion Import as % of GDP 20.34%
Music Market $744.0 million
Sales Per Capita $11.18
Global Share 4.50%
128This copy belongs to Chris Parks

International DataFrance
0
10
20
30
40
50
60
'15'14'13'12'11'10'09'08'07'06
Acoustic PianosImports
Valu
e in
U.S
. $ m
illio
ns
Import Value
0
5
10
15
20
25
30
35
40
45
'15'14'13'12'11'10'09'08'07'06
Fretted & Stringed InstrumentsImports
Valu
e in
U.S
. $ m
illio
ns
Import Value
0
20
40
60
80
100
120
'15'14'13'12'11'10'09'08'07'06
KeyboardsImports
Valu
e in
U.S
. $ m
illio
ns
Import Value
0
3
6
9
12
15
18
'15'14'13'12'11'10'09'08'07'06
Acoustic PianosExports
Valu
e in
U.S
. $ th
ousa
nds
Export Value
0
3
6
9
12
15
18
'15'14'13'12'11'10'09'08'07'06
Fretted & Stringed InstrumentsExports
Valu
e in
U.S
. $ th
ousa
nds
Export Value
0
5
10
15
20
25
30
35
'15'14'13'12'11'10'09'08'07'06
KeyboardsExports
Valu
e in
U.S
. $ th
ousa
nds
Export Value
France Imports and Exports
129This copy belongs to Chris Parks

0
10
20
30
40
50
'15'14'13'12'11'10'09'08'07'06
Wind InstrumentsImports
Valu
e in
U.S
. $ m
illio
ns
Import Value
0
5
10
15
20
25
'15'14'13'12'11'10'09'08'07'06
PercussionImports
Valu
e in
U.S
. $ m
illio
ns
Import Value
0
20
40
60
80
100
120
'15'14'13'12'11'10'09'08'07'06
AccessoriesImports
Valu
e in
U.S
. $ m
illio
ns
Import Value
0
25
50
75
100
125
150
'15'14'13'12'11'10'09'08'07'06
Wind InstrumentsExports
Valu
e in
U.S
. $ th
ousa
nds
Export Value
0
2
4
6
8
10
'15'14'13'12'11'10'09'08'07'06
PercussionExports
Valu
e in
U.S
. $ th
ousa
nds
Export Value
0
10
20
30
40
50
60
70
'15'14'13'12'11'10'09'08'07'06
AccessoriesExports
Valu
e in
U.S
. $ m
illio
ns
Export Value
France Imports and Exports
130This copy belongs to Chris Parks

International DataGermany
GERMANY
Clear Growth Compared to the Previous Year, Strong Development of the Domestic MarketRegarding the importance of the sector: the 2014 figures of the turnover tax statistics showed that 1,216 makers of instruments reached a turnover of €611.4 million, while 1,858 dealers of musical instruments and products achieved a sector turnover of €1.3 billion.
More than half of the sector turnover comes from the 23 largest companies with more than 50 employees (4.2% of all companies, one fewer than the year before). According to preliminary data for 2015, these firms show a turnover of €334 million. This represents a growth of 4.2% compared to the previous year. A total of 2,619 employees, 4.3% fewer (due to loss of the one larger company), were involved in reaching this turnover.
In contrast to the previous year, which showed stagnation, domestic turnover showed explosive growth of 19.9%, even while overseas turnover of the larger enterprises slowed by 3.3%. Overseas turnover within the eurozone increased by 1.4%, while overseas turnover with the rest of the world showed a marked decrease of 5.8%. The importance of exporting to the eurozone has therefore grown. A total of 35.5% of all exports are going to the eurozone, while the share of exports to the rest of the world declined from 66% to 64.5%.
The quota of exports versus domestic sales in the larger companies went from 67.4% to 62.5%; these companies export on average more than smaller companies. Exports Strong; Imports Growing Even More StronglyThe significant foreign trade surplus of previous years has almost disappeared. In 2015, the surplus was only at €5 million after €32 million the year before. Exports grew by 7.8% to €562.1 million, with imports showing even stronger growth of 11.3% to €557.4 million. However, the latter growth comes after a steep decline of 12.9% last year. Deviations to the above-mentioned overseas turnover figures of the 23 companies can be explained by significantly larger participation in exports (by several hundred), as well as through exports of goods originally made elsewhere, but the contrary development as well as stark difference are more difficult to explain (or less comprehensible).
German exports are reaching a broad area. The most important export countries are France, the United States, China, Austria, Switzerland, Japan, the UK, the Netherlands and Poland. Growth of exports to the United States (26%), after the UK (38.8%), China (19.6%) and Switzerland (19.9%) are remarkable, and probably dependant upon the exchange rate.
In contrast, almost 80% of all imports into Germany are from just five countries: China, Indonesia, the United States, Japan and the Netherlands. The latter position as a strong import source is not the result of domestic Dutch production, but results from the fact that the Netherlands is a platform for instruments imported from Asia, particularly imports of electronic instruments, which in turn are re-exported to Germany. Therefore, two-thirds of all imports into Germany come from Asia.
Increased Domestic Production with Big Swings among Different Product Groups The positive development in turnover is confirmed by the numbers of instruments made in Germany. Unfortunately, we can at this point only report the first three-quarters of the year, with the traditionally strongest and most productive last quarter’s figures not yet known. The
GE
RM
AN
Y
131This copy belongs to Chris Parks

first three-quarters saw an increase in instrument production by 2.9% in comparison to the year before.
Unlike previous very strong years, the number of brass instruments produced in Germany decreased, by 9%. Wald, tenor, baritone and altus horns saw an increase of 1.2% while trumpets, cornets and fluegelhorns decreased by 2.6%, and other brass instruments such as trombones by 8.7%, tubas by almost 25%.
On the other hand, woodwind instruments saw a year of growth after a few years of decreases. Recorders increased by 17.7%; bassoons and oboes by 5.9%.
Percussion instruments, which in previous years showed weak numbers, grew significantly by 11.6%
In the segment of parts and accessories, the overall picture shows growth. Parts and accessories for organs and harmonias grew by 14.1%, for wind and brass instruments by 10.9%, for other instruments by 5.4% and for stringed instruments by 3.1%. Only parts and accessories for piano decreased, by 14.1%.
The product groups of accordions and mouth organs saw significant growth: 25%.
In the segment of large instruments, upright pianos grew again (+2.1%), while grand pianos saw a decrease of 2.8%.
The last quarter could show different final results, but the above figures show first trends.
The results shown by export statistics follow the trend of the above-mentioned production data. In addition, the export statistics show information about further instrument groups.
Exports of violins, for example, decreased again, this time by 11.3%, while exports of other stringed instruments increased by nearly 50%. Further strong growth was reported in exports of strings, namely by 12.3%.
Looking at imports, the high-value products groups (>€20 million) show the following development: percussion instruments +10.9%, guitars +19.1%, brass instruments +15.0%, woodwind instruments +10.9%, upright pianos –12.1%, grand pianos –14.8%. Almost 40% of all imports are in the category of electronic instruments, which as a group grew by only 7.1%.
2016 Expected to be StableThe sector expects to perform on the same level as the year before. The strong differences between domestic and overseas turnover are expected to level out for a more unified development. It is expected that overseas turnover with the countries in the European Union will perform more strongly than with the rest of the world.
Commentary by Winfried Baumbach of the National Association of German Musical Instruments Manufacturers (BDMH)
germany
germany
132This copy belongs to Chris Parks

International DataGermany
DOING BUSINESS IN GERMANY
Market OverviewThe German economy is the world’s fourth largest and, after the enlargement of the EU, accounts for more than one-fifth of European Union GDP. Germany is the United States’ largest European trading partner and the sixth largest market for U.S. exports. Germany’s
“social market” economy largely follows free-market principles, but with a considerable degree of government regulation and generous social welfare programs.
Germany is the largest consumer market in the European Union and has a population of 81.1 million. However, the significance of the German marketplace goes well beyond its borders. An enormous volume of trade is conducted in Germany at some of the world’s largest trade events, such as MEDICA, Hannover Fair, Automechanika and the ITB Tourism Show. The volume of trade, number of consumers and Germany’s geographic location at the center of a 28-member European Union make it a cornerstone around which many U.S. firms seek to build their European and worldwide expansion strategies.
The German economy has improved markedly in recent years after taking a serious hit during the economic crisis. Because of the country’s strong export dependency, GDP declined by more than 5% in 2009. However, the recovery was equally strong, resulting in a V-shaped recovery as pre-crisis real GDP was reached again in the second quarter of 2011. The German government expects real GDP to grow by 1.8% in 2015 and also in 2016, i.e., above its current potential rate of growth of 1.5%. The labor market remained resilient during the economic and financial crisis and continued to grow stronger in 2014. A comprehensive set of labor and social reforms introduced between 2003–2005 and termed “Agenda 2010” contributed to overcoming the structural weaknesses of the German welfare state and labor market, resulting in today’s strong employment growth and low unemployment. As a result of the positive economic development, employment in Germany has continued to rise for the last nine consecutive years and reached an all-time high of 42.7 million in 2014, an increase of 371,000 from 2013. Particularly women and the elderly have benefitted from the positive trends in the labor market. Simultaneously, unemployment has fallen by almost 2 million since 2005, reached the lowest level since German reunification (1990) in 2014 and is still receding in 2015. The global economic and financial crises increased unemployment only temporarily; the loss of about 160,000 jobs in 2008 was offset in less than two years. In 2014, fewer than 2.9 million people were unemployed, and the jobless rate was at 6.7%, according to official national data from the German Federal Employment Agency—but, using the internationally comparable concept of the International Labor Organization (ILO), the German unemployment rate stood at 5%. Germany has the lowest unemployment rate (7.7% in 2014) among all other 28 European Union member states (European Union average: 22.2%, per EUROSTAT).
germany
133This copy belongs to Chris Parks

German businesses and economists, however, expect that the recent reversal of past pension reforms and the introduction of a minimum wage, along with higher energy prices due to the “Energiewende” will seriously impair Germany’s competitiveness over the next five years.
Market ChallengesGermany presents few formal barriers to U.S. trade or investment. Germany’s acceptance of the EU’s Common Agricultural Policy and German restrictions on biotech agricultural products represent obstacles for some U.S. goods. Germany has pressed the EU Commission to reduce regulatory burdens and promote innovation to increase EU member states’ competitiveness. The government of Chancellor Angela Merkel has talked about the need for regulatory reform in Germany, still, the country’s regulations and bureaucratic procedures can be very complex. While not directly discriminatory, government regulation by virtue of its complexity may offer a degree of protection to established local suppliers. Safety or environmental standards, not inherently discriminatory but sometimes zealously applied, can complicate access to the market for U.S. products. American companies interested in exporting to Germany should make sure they know which standards apply to their product and obtain timely testing and certification. German standards are especially relevant to U.S. exporters as EU-wide standards are often based on existing German standards.
Market OpportunitiesFor U.S. companies, the German market—the largest in the EU—continues to be attractive in numerous sectors and remains an important element of any comprehensive export strategy to Europe. While U.S. investors must reckon with a relatively higher cost of doing business in Germany, they can count on high levels of productivity, a highly skilled labor force, quality engineering, a first-class infrastructure and a location in the center of Europe.
Market-Entry StrategiesThe most successful market entrants are those that offer innovative products featuring high quality and modern styling. Germans are responsive to the innovation and high technology evident in U.S. products, such as computers, computer software, electronic components, healthcare and medical devices, synthetic materials and automotive technology. Germany possesses one of the highest Internet access rates in the EU and new products in the multi-media, high-tech and service areas offer great potential as increasing numbers of Germans join the Internet generation. Certain agricultural products also represent good export prospects for U.S. producers. Price is not necessarily the determining factor for the German buyer, given the German market’s demand for quality.
The German market is decentralized and diverse, with interests and tastes differing from one German state to another. Successful market strategies take into account regional differences as part of a strong national market presence. Experienced representation is a major asset to any market strategy, given that the primary competitors for most American products are domestic firms with established presences. U.S. firms can overcome such stiff competition by offering high-quality products and services at competitive prices, and
germany
germany
134This copy belongs to Chris Parks

International DataGermany
locally based after-sales support. For investors, Germany’s relatively high marginal tax rates and complicated tax laws may constitute an obstacle, although deductions, allowances and write-offs help to move effective tax rates to internationally competitive levels.
“Doing Business in Germany” article is provided by the U.S. Commercial Service, the trade promotion arm of the U.S. Department of Commerce’s International Trade Administration. For more information on doing business in Germany, you may visit their website at www.export.gov/Germany.
The following charts are based on domestic production and export data provided by the National Association of German Musical Instruments Manufacturers (BDMH)
germany
135This copy belongs to Chris Parks

Population in millions 80.5
Median Age 46.5Population Growth -0.17%
GERMANY SNAPSHOT
Demographics
Economy
Data Source: Demographics, Economy and Trade from CIA World Factbook, Music Industry from The Music Trades. GDP (PPP): Gross Domestic Product based on purchasing-power-parity (PPP) valuation of country GDP in U.S. dollars.
Age Male Female
0–14 5.35 5.07
15–64 26.79 26.31
65 & Over 7.59 9.75
GDP (PPP) $3.84 trillion
GDP Per Capita $47,400
GDP-Real Growth Rate 1.50%
Unemployment Rate 4.80%
Inflation 0.20%
Demographics
65+21.5%
0–1412.9%
15–6465.6%
Economy
GDP-Service69.1%
GDP-Agriculture0.7%
GDP-Industry30.2%
0.0
0.5
1.0
1.5
2.0
2.5
3.0
3.5
4.0
'15'14'13'12'11'10'09'08'07'06'05'04
Germany GDP (PPP)(U.S. $ in trillions)
0
2
4
6
8
10
12
'15'14'13'12'11'10'09'08'07'06'05'04
Unemployment Rate(Percent)
0.0
0.5
1.0
1.5
2.0
2.5
3.0
'15'14'13'12'11'10'09'08'07'06'05'04
In�ation (Annual Percent Rate)
136This copy belongs to Chris Parks

International DataGermany Snapshot
Trade
Music Industry
Total Export $1.3 trillion Export as % of GDP 33.59%
Total Import $1.0 trillion Import as % of GDP 25.52%
Music Market $1.0 billion
Sales Per Capita $12.48
Global Share 6.00%
0
2
4
6
8
10
AustriaChina
U.S.Netherlands
U.K.France
Export Partners (2015)
Ann
ual P
erce
ntag
e
0
3
6
9
12
15
U.K.Italy
BelgiumChina
FranceNetherlands
Import Partners (2015)
Ann
ual P
erce
ntag
e
0
4
8
12
16
'14'13'12'11'10'09'08'07'06'05
Music Sales Per Capita(U.S. $)
0
1
2
3
4
5
6
7
8
'14'13'12'11'10'09'08'07'06'05
Share of Global Music Market(Percent)
0.0
0.2
0.4
0.6
0.8
1.0
1.2
1.4
'14'13'12'11'10'09'08'07'06'05
Germany Music Market(U.S. $ in billions)
137This copy belongs to Chris Parks

Germany Domestic Production(Data based on manufacturers with 20 or more employees)
0
5
10
15
20
25
30
35
40
'15'14'13'12'11'10'09'08'07'06
Upright Pianos
0
1
2
3
4
5
6
7
04030201
Valu
e €
in m
illio
ns
Uni
ts x
1,0
00
Value Units
0
1
2
3
4
5
6
7
'15'14'13'12'11'10'09'08'07'06
0
2
4
6
8
10
12
14
'15'14'13'12'11'10'09'08'07'06
Organs
0
20
40
60
80
100
120
04030201
Valu
e €
in m
illio
ns
Uni
ts
Value Units
0
20
40
60
80
100
120
'15'14'13'12'11'10'09'08'07'06
0
10
20
30
40
50
60
70
80
'15'14'13'12'11'10'09'08'07'06
Grand Pianos
0.0
0.5
1.0
1.5
2.0
2.5
3.0
04030201
Valu
e €
in m
illio
ns
Uni
ts x
1,0
00
Value Units
0.0
0.5
1.0
1.5
2.0
2.5
3.0
'15'14'13'12'11'10'09'08'07'06
0
4
8
12
16
20
'15'14'13'12'11'10'09'08'07'06
Woodwind Instruments
Valu
e €
in m
illio
ns
Value
0
5
10
15
20
25
'15'14'13'12'11'10'09'08'07'06
Drums & Percussion
0
200
400
600
800
1000
1200
04030201
Valu
e €
in m
illio
ns
Uni
ts x
1,0
00
Value Units
0
200
400
600
800
1000
1200
'15'14'13'12'11'10'09'08'07'06
0
5
10
15
20
25
30
35
'15'14'13'12'11'10'09'08'07'06
Brass Instruments
0
5
10
15
20
25
04030201
Valu
e €
in m
illio
ns
Uni
ts x
1,0
00
Value Units
0
5
10
15
20
25
'15'14'13'12'11'10'09'08'07'06
2015 data does not include tuba production �gures
138This copy belongs to Chris Parks

International DataGermany
0
10
20
30
40
50
60
70
80
90
'15'14'13'12'11'10'09'08'07'06
Grand Pianos
Valu
e €
in m
illio
ns
Export Value
0
100
200
300
400
500
600
'15'14'13'12'11'10'09'08'07'06
Harpsichords
Valu
e €
in th
ousa
nds
Export Value
0
2
4
6
8
10
12
'15'14'13'12'11'10'09'08'07'06
Violins
Valu
e €
in m
illio
ns Export Value
0
25
50
75
100
125
'15'14'13'12'11'10'09'08'07'06
Total Acoustic Pianos
Valu
e €
in m
illio
ns
Export Value
0
2
4
6
8
10
12
14
16
18
'15'14'13'12'11'10'09'08'07'06
Stringed InstrumentsPlayed with a Bow
Valu
e €
in m
illio
ns
Export Value
Germany Exports
0
5
10
15
20
25
'15'14'13'12'11'10'09'08'07'06
Acoustic Guitars
Valu
e €
in m
illio
ns
Export Value
139This copy belongs to Chris Parks

0
5
10
15
20
25
30
35
40
'15'14'13'12'11'10'09'08'07'06
Digital Pianos
Valu
e €
in m
illio
ns
Export Value
0
5
10
15
20
25
30
'15'14'13'12'11'10'09'08'07'06
Electric Guitars
Valu
e €
in m
illio
ns Export Value
0
20
40
60
80
100
120
'15'14'13'12'11'10'09'08'07'06
Total Electric Instruments
Valu
e €
in m
illio
ns
Export Value
0
5
10
15
20
25
30
35
40
'15'14'13'12'11'10'09'08'07'06
Drums & Percussion
Valu
e €
in m
illio
ns
Export Value
0
1
2
3
4
5
6
7
'15'14'13'12'11'10'09'08'07'06
Synthesizers
Valu
e €
in m
illio
ns
Export Value
Germany Exports
0
5
10
15
20
25
30
35
40
45
'15'14'13'12'11'10'09'08'07'06
Brass Instruments
Valu
e €
in m
illio
ns
Export Value
140This copy belongs to Chris Parks

International DataGermany
Germany Exports
0
10
20
30
40
50
60
'15'14'13'12'11'10'09'08'07'06
Woodwind Instruments
Valu
e €
in m
illio
ns
Export Value
0
2
4
6
8
10
12
14
16
'15'14'13'12'11'10'09'08'07'06
Harmonicas & Accordions
Valu
e €
in m
illio
ns Export Value
0.0
0.2
0.4
0.6
0.8
1.0
'15'14'13'12'11'10'09'08'07'06
Electric Organs
Valu
e €
in m
illio
ns
Export Value
0
1
2
3
4
5
6
7
8
9
'15'14'13'12'11'10'09'08'07'06
Total Organs & Harmoniums
Valu
e €
in m
illio
ns
Export Value
141This copy belongs to Chris Parks

HUNGARY
The Collective Musical Experience: The Participation of the Hungarian Population in Music Research shows that low participation rates of Hungary’s population in the music scene hinders the effective progress of demand and supply in the Hungarian music industry.
The majority of the musically active European population sang in the past 12 months among friends, family or in a church community, rehearsal room, on stage or at home. A total of 12.5% of the European population older than 15 (nearly 52 million Europeans) sings regularly. This rate is only 5% in Hungary, with 429,000 citizens aged 15 or older taking part in the vocal music scene.
A total of 34 million European citizens participated in the continent’s instrumental music scene, which is 8.1% of all European adults aged 15 or older. Unfortunately this number is critically low at 2.8% for Hungary, which manages to outrun only Bulgaria in this tally. In 2013, only 290,000 Hungarian adults older than 15 years played musical instruments, which is significantly lower than the Slovakian rate.
Concert attendance is one of the most important explanatory variables related to the active participation in the music scene; those who regularly sing or play a musical instrument are more likely to attend concerts. In Hungary, this rate is 19%. The number of instrument-playing citizens is higher in other countries of this region and the active participation in the music scene is even higher, which also manifests in regular concert attendance.
The situation is no different regarding album sales. Research shows that 40% of individuals who attended a concert in the last 12 months bought an album, in contrast to the 17% of non-concert attendees. Among those who do not play music, the willingness to buy CDs is 32% compared to 39% among those who do. The difference regarding the quantity of CDs purchased is even greater.
According to the statistics of the MAHASZ (Association of Hungarian Audio Recording), the sales of whole physical items—including the CD, cassette and vinyl— were US$6,437,859 in 2015. This shows a decrease of 17% from the amount in 2014. But this number is attractive in light of the 54% increase in the digital trade.
According to music industry research conducted by ProArt (the Association of Author’s Rights), Hungary needs to increase concert attendance to 2.1 million to reach the European average (despite the recent structure and ticket prices).
Unfortunately, organizing live music is more expensive in Hungary because of local tax policy. It requires 15 – 30% more paid in taxes compared to the neighboring country, even though Hungarian salaries and spending power are lower than the region’s other states. So it is huge problem for the concert manager because the relatively cheap concert ticket with the huge VAT then becomes more expensive (like other countries).
Approximately 600 stages work with fixed programs plus the cultural centers in Hungary. Besides this, Hungarian enterprises organize more big festivals like the Sziget, the biggest European festival or BalatonSound, Volt Festival and hundreds more events throughout the country.
HU
NG
AR
Y
hungary
142This copy belongs to Chris Parks

International DataHungary
The income of musicians received from record companies would increase at a 40:17 rate, any other changes aside, the number of professional musicians who could make a living from their profits on a standard level would increase by 18%, and by 23.6% on the level of minimal salary.
In Scandinavian countries, the musical lecture (both classical and pop) of children is provided by the schools. These countries can set a good example for Hungary, but it is not likely that these differing participation habits of Scandinavian culture can be established here; in Scandinavia, all age groups are involved in the music scene as a vocal or musical performer or album buyer, or as a concert attendee. Reaching the average participation rate of people in countries like Austria, the Czech Republic, Slovenia, Slovakia, whose cultures are more similar to Hungary’s, would make increasing the size of the Hungarian music market possible. In these countries—and usually in all Europe—the youngsters provide the greater music clientele, thus, a successful high school music program in our country would make significant changes with results that could be felt within five years.
Source: Music Industry Research by ProArt, the Association of Author’s Rights and MAHASZ, Association of Hungarian Audio Recording
Additional Information from the Hungarian Music MarketHANOSZ, Hungary’s National Association of Instrumentalists, surveyed its members in April 2016 to find out if those who work in the music industry notice it changing or not. The members of HANOSZ consist of music retailers, distributors, shop owners, instrument manufacturers and website operators. This survey is not representative in the meaning of strict market research.
Responses about customers were very interesting. The retail section shows that 69% of people under 25 buy low price and they do not care about quality. This number decreases to 61% for people age 26 to 35, who buy product for medium price and good quality.
Between the ages of 36 and 50, people prefer the expensive and premium-quality instruments. The three categories then level off over the age of 50; the older age group is more likely purchase products that are suitable for them, without as much attention to price and quality.
Web shops have a main effect on retail. According to 41% of respondents, customers’ habits are changing significantly. This is about the disappearance of the customer loyalty. Potential customers first search the product on the Internet, then they go to the shops, which they use like an exhibition room. They ask more information from the shop assistant and then they purchase on the web (in many cases, not that shop’s website).
At least 44% of respondents thought a bigger market would make their own businesses stronger. A full 20% indicated that they would like to be able to afford greater marketing activity in order to stay in the market.
Commentary by Géza Balogh, President of HANOSZ, Hungary’s National Association of Instrumentalists
hungary
143This copy belongs to Chris Parks

DOING BUSINESS IN HUNGARY
Market OverviewHungary is located in Central Eastern Europe with a population of 9.8 million and has fully transitioned from a centrally planned economy to a market-based one since the fall of communism in 1989. It is a member of the OECD (1996), NATO (1999) and the European Union (2004). Per-capita income is nearly two-thirds that of the EU-28 average; total GDP is US$133 billion. The private sector accounts for more than 80% of GDP. Hungary’s strategic location in Europe, access to EU markets, highly skilled and educated workforce and sound infrastructure have led companies such as GE, Alcoa, Morgan Stanley, National Instruments, Microsoft and IBM to locate facilities here, both in manufacturing and services. According to the database “Unworldly,” there are currently 417 wholly owned U.S. companies in Hungary. Including their subsidiaries, the figure totals 629. Many of these companies find that Hungary’s geographic position in Central Europe also offers a strategic logistical hub within the region. Foreign direct investment (FDI) in Hungary has helped modernize industries, create jobs, boost exports and spur economic growth. Hungary’s cumulative FDI stock has totaled more than US$104 billion since 1989. Key sectors include automotive, IT, electronics, logistics and more recently, shared services (e.g., back office and/or call center operations). American companies have invested close to US$10 billion in Hungary since 1989, making the United States the fourth largest foreign investor in the country behind Germany, Austria and Luxembourg. Meanwhile, U.S. exports to Hungary have exceeded US$1 billion in each of the last five years, led by electronics, IT equipment, automotive components, industrial engines and other manufacturing technologies and supplies. According to U.S. Department of Commerce data, exports to Hungary in 2014 totaled US$1.84 billion, which was a 7% increase over 2013.
Market ChallengesHungary was heavily impacted not only by the 2008/2009 global financial crisis but also by austerity measures and sector taxes introduced by the government in 2010. GDP annual growth rate was 1.5% in 2013 and 3.6% in 2014, the highest among the EU-28. It is expected to be between 2.5% and 3% in 2015. Hungarian exports, particularly to neighboring countries and Germany, are substantial and Hungary maintains a trade and current account surplus. The official unemployment rate decreased significantly from 10.2% in 2013 to 7.7% in 2014; however, this improvement is also due to last year’s reforms of unemployment benefits that resulted in a greater number of public workers. Although the government did manage to successfully decrease the 81.0% high debt-to-GDP ratio in 2011 to 76.9% in 2014, it introduced several new taxes to continue deficit reduction, which mostly affected the banking, energy and telecommunications sectors. The measures the government took to reduce debt were criticized by many, as they were seen as short-term, one-off solutions and not the structural reforms needed for a fiscally more stable and sustainable budget. Other actions, including suspending payments into the private pillar of the pension system (which makes it financially disadvantageous for most beneficiaries to remain in the private pillar of the pension system) and eliminating the independent Fiscal Council budget watchdog agency, have drawn widespread criticism. In 2013, the three
hungary
hungary
144This copy belongs to Chris Parks

International Data
major credit rating agencies (Moody’s, S&P and Fitch) changed their long-term ratings on Hungarian bonds to BB/Ba1; there have not been any significant improvement since. S&P currently rates Hungary as BB+ stable, Moody’s as Ba1, while Fitch gave the country a rating of BB+ positive. During the global economic crisis, most Hungarian household debt was in Swiss francs (around 50% in 2011, US$26.5 billion). Households were hit hard when the forint currency depreciated against both the Swiss franc and euro. There were several protests against banks urging the government to take action. Although the Hungarian Supreme Court ruled that there was nothing unconstitutional or illegal in those loan agreements, the government introduced serious rescue schemes to help foreign currency loan holders, resulting in a growing burden for commercial banks. Since March 15, 2015, most retail stores are prohibited from opening on Sundays. Only stores that are smaller than a certain area and are run by members of the owner’s family and/or the owner himself are allowed to open on Sundays, meaning bigger stores, retail chains and most foreign-owned shops could face a significant setback in turnover and revenue.
Market OpportunitiesIn spite of the many challenges that accompany the local business environment, Hungary remains an attractive market for U.S. investment and exports. As previously mentioned, the country’s strategic location in Europe, easy access to both EU and non-EU markets within and outside the Schengen zone, highly skilled and educated workforce, and sound infrastructure have led global companies to locate manufacturing and service facilities here. Five Reasons for Doing Business in Hungary
• It’s one of the fastest growing economies in the EU
• The country’s central location, considered to be the gateway to Central/Southeast Europe
• Its well-educated and -trained workforce
• The supply chain opportunities in the automotive and electronic industries
• The government’s emphasis on innovation and knowledge-based technologies (Hungary is home to the European Institute of Innovation)
Funding from the EU has also driven growth and will continue to do so. Since 2004, EU funds have been used to improve telecommunications, energy and highway infrastructure. As part of the National Development Plan (2014–2020), Hungary has allocated approximately €6 billion in projects ranging from tourism and infrastructure development to healthcare and protection of the environment.
hungary
Hungary
145This copy belongs to Chris Parks

Market-Entry StrategyThe U.S. government, through the American Embassy in Budapest and the departments of Commerce, State and Agriculture, stands ready to support U.S. firms, whether entering or already doing business in Hungary. The U.S. Embassy promotes a sound Hungarian business environment and advocates on behalf of U.S. companies bidding on major Hungarian government tenders or facing business problems due to government policies. In addition, the staff at the Embassy’s Commercial Section can help U.S. firms to access the Hungarian market and solve commercial problems through cost-effective service programs and market research.
“Doing Business in Hungary” article is provided by the U.S. Commercial Service, the trade promotion arm of the U.S. Department of Commerce’s International Trade Administration. For more information on doing business in Hungary, you may visit their website at www.export.gov/Hungary.
The following charts are based on import and export data obtained from the website of the International Trade Centre (ITC)
hungary
146This copy belongs to Chris Parks

International DataHungary Snapshot
Demographics
65+18.2%
0–1414.8%
15–6467.0%
Economy
GDP-Industry30.9%
GDP-Agriculture4.4%
GDP-Service68.4%
Population in millions 9.9
Median Age 41.4Population Growth -0.22%
0
50
100
150
200
250
300
'15'14'13'12'11'10'09'08'07'06'05'04
Hungary GDP (PPP)(U.S. $ in billions)
0
2
4
6
8
10
12
'15'14'13'12'11'10'09'08'07'06'05'04
Unemployment Rate(Percent)
0
1
2
3
4
5
6
7
8
9
'15'14'13'12'11'10'09'08'07'06'05'04
In�ation (Annual Percent Rate)
HUNGARY SNAPSHOT
Demographics
Economy
GDP (PPP) $257.0 billion
GDP Per Capita $26,000
GDP-Real Growth Rate 3.00%
Unemployment Rate 7.10%
Inflation 0.01%
Age Male Female
0–14 0.75 0.71
15–64 3.28 3.34
65 & Over 0.68 1.13
Data Source: Demographics, Economy and Trade from CIA World Factbook, Music Industry from HANOSZ. GDP (PPP): Gross Domestic Product based on purchasing-power-parity (PPP) valuation of country GDP in U.S. dollars.
147This copy belongs to Chris Parks

Trade
Music Industry
0
5
10
15
20
25
30
FranceItaly
SlovakiaRomania
AustriaGermany
Export Partners (2015)
Ann
ual P
erce
ntag
e
0
5
10
15
20
25
30
PolandSlovakia
ChinaRussia
AustriaGermany
Import Partners (2015)
Ann
ual P
erce
ntag
e
Music Sales Per Capita(U.S. $)
0
1
2
3
4
5
6
'14'13'12'11'10
Share of Global Music Market(Percent)
0.0
0.1
0.2
0.3
0.4
'14'13'12'11'10
Hungary Music Market(U.S. $ in millions)
0
10
20
30
40
50
60
'14'13'12'11'10
Total Export $97.6 billion Export as % of GDP 37.96%
Total Import $92.9 billion Import as % of GDP 36.16%
Music Market $51.1 million
Sales Per Capita $5.16
Global Share 0.30%
148This copy belongs to Chris Parks

International DataHungary
0
200
400
600
800
1000
'15'14'13'12'11'10'09'08'07'06
Acoustic PianosImports
Valu
e in
U.S
. $ th
ousa
nds
Import Value
0
1
2
3
4
5
6
'15'14'13'12'11'10'09'08'07'06
KeyboardsImports
Valu
e in
U.S
. $ m
illio
ns
Import Value
0
20
40
60
80
100
120
'15'14'13'12'11'10'09'08'07'06
Acoustic PianosExports
Valu
e in
U.S
. $ th
ousa
nds
Export Value
0
200
400
600
800
1000
1200
'15'14'13'12'11'10'09'08'07'06
Fretted & Stringed InstrumentsImports
Valu
e in
U.S
. $ th
ousa
nds
Import Value
0
100
200
300
400
500
'15'14'13'12'11'10'09'08'07'06
Fretted & Stringed InstrumentsExports
Valu
e in
U.S
. $ th
ousa
nds
Export Value
Hungary Imports and Exports
0
1
2
3
4
5
'15'14'13'12'11'10'09'08'07'06
KeyboardsExports
Valu
e in
U.S
. $ m
illio
ns
Export Value
149This copy belongs to Chris Parks

0
10
20
30
40
50
60
'15'14'13'12'11'10'09'08'07'06
PercussionExports
Valu
e in
U.S
. $ th
ousa
nds
Export Value
0.0
0.5
1.0
1.5
2.0
2.5
'15'14'13'12'11'10'09'08'07'06
Wind InstrumentsExports
Valu
e in
U.S
. $ m
illio
ns Export Value
0
200
400
600
800
1000
'15'14'13'12'11'10'09'08'07'06
PercussionImports
Valu
e in
U.S
. $ th
ousa
nds
Import Value
0.0
0.5
1.0
1.5
2.0
2.5
3.0
'15'14'13'12'11'10'09'08'07'06
AccessoriesImports
Valu
e in
U.S
. $ m
illio
ns
Import Value
0.0
0.5
1.0
1.5
2.0
2.5
'15'14'13'12'11'10'09'08'07'06
Wind InstrumentsImports
Valu
e in
U.S
. $ m
illio
ns
Import Value
Hungary Imports and Exports
0.0
0.5
1.0
1.5
2.0
2.5
3.0
3.5
4.0
'15'14'13'12'11'10'09'08'07'06
AccessoriesExports
Valu
e in
U.S
. $ m
illio
ns
Export Value
150This copy belongs to Chris Parks

International DataIndia
DOING BUSINESS IN INDIA
Market OverviewThe Republic of India is the 18th largest export market for U.S. goods. Two-way trade in goods and services reached US$101.8 billion in 2014. U.S. companies exported US$21.6 billion worth of goods to India, dominated by civil aircraft and spare parts, machinery and electrical machinery, which accounts for approximately 30% of the total trade. The United States presently has a trade deficit with India. U.S. imports comprise primarily diamonds, pharmaceuticals and petrochemical products. The stock of U.S. foreign direct investment (FDI) in India was US$24.32 billion in 2013 (latest data available).
The annual growth rate of the Indian economy is projected to have increased to 7.2% in 2014–15 from 6.9% in 2013–14. The IMF estimates India’s growth rate to continue to rise to 7.5% in 2015–16.
U.S. FDI in India is largely in the professional, scientific, and technical services, finance/ insurance services, and the information service sectors. Major U.S. companies include AECOM, Bank of America, Bell Helicopter, Black and Veatch, Coca-Cola, DuPont, Dow, Federal Express, Ford, General Electric, General Motors, Jacobs Engineering, KFC, Lockheed Martin, McDonalds, Microsoft, Kimberly Clark, PepsiCo, Raytheon and United Airlines. The fast-growing franchising industry in the last two years attracted U.S. major food service brands such as Dunkin’ Donuts, Krispy Kreme Donuts, Starbucks and Burger King, establishing their businesses in metropolitan areas as well as tier 1 and tier 2 cities. India is the fourth fastest growing source of FDI into the United States. The total stock of FDI from India into the United States is US$11.04 billion (2013 position per SelectUSA statistics).
In May 2014, the Narendra Modi-led Bharatiya Janata Party (BJP) won the world’s largest democratic election, defeating a Congress-led coalition that had been in power for the past decade. The 2014 election marked a turning point in investor sentiment, as a fractured minority government, seemingly unable to advance essential economic reforms, was displaced in favor of a government that had won on a platform of economic growth. The advent of a BJP-led government at the center, combined with the continued monetary stewardship of Raghuram Rajan, the respected Governor General of the Reserve Bank of India, made an immediate mark on investor sentiment. Stabilized currency rates and improved economic performance seemed to demonstrate that an era of policy paralysis and populism had ended in favor of a business-friendly growth agenda.
On August 17, 2014, India’s Independence Day, Prime Minister Modi announced his Make in India initiative—a branded campaign to attract international capital to the country’s struggling manufacturing sector. As the government appeared slow to propose economic reforms that matched its rhetoric, and struggled to pass through Parliament many of the reforms it did propose, investors have begun to wonder about the government’s strategy.
Part of the problem arises from the decentralized nature of India’s political system. Investors in India should be prepared to face varied political and economic conditions across India’s 29 states and 7 union territories. There are differences at the state level in the quality of governance, regulation, taxation, labor relations and education levels. Although India prides
IND
IA
151This copy belongs to Chris Parks

itself on its rule of law, the country ranks 186 out of 189 in the World Bank’s Ease of Doing Business Report in the category of Enforcing Contracts. Its courts have cases backlogged for years, and by some accounts more than 30 million cases could be pending at various levels of the judiciary.
While the government has managed to push through a number of investor-friendly reforms, including an increase in FDI limits in the insurance sector to 49%, on others, such as land acquisition, it has failed to muster sufficient political support. On still other long-awaited reforms—the Goods and Services Tax, labor law reforms, and subsidies reform among them—as of April 2015, the government had yet to put a program before Parliament. Thus, while the outlook has improved considerably, objective conditions for doing business in India remain similar to years past.
Opportunities in the current scenario, however, are manifold. Indian conglomerates and high-technology companies are generally equal in sophistication and prominence to their international counterparts. Certain industrial sectors, such as information technology, telecommunications and engineering, are globally recognized for their innovation and competitiveness. Foreign companies operating in India emphasize that success requires a long-term planning horizon and a state-by-state strategy to adapt to the complexity and diversity of India’s markets.
Market ChallengesInfrastructureProblems with the country’s roads, railroads, ports, airports, education, power grid and telecommunications are significant obstacles as the nation strives to achieve its full economic potential. India’s ongoing urbanization, together with rising incomes, has resulted in a heightened need for improved infrastructure, both to deliver public services and to sustain economic growth. India is seeking to invest US$1 trillion in its infrastructure during the 12th Five-Year Plan (2012—2017) and is looking for private-sector participation to fund half of this massive expansion largely through its home-grown Public-Private Partnership (PPP) model. U.S. companies have been successful in certain areas of India’s infrastructure development, but competition from other countries is becoming stiffer. As a result, U.S. industry’s market share in India in this sector has been declining. Unfortunately, the current PPP model has had a mixed record, slowing the development of numerous metro transit, road/highways, airport, mining and energy projects. One of the main shortcomings of the PPP model is that it assigns too much risk to the private sector. As a result, a government committee is currently reviewing the model with a view to establishing a more equitable risk-sharing arrangement.
High Tariffs and Protectionist PoliciesImport duties continue to be comparatively very high. Exporters and investors are also faced with non-transparent and often unpredictable regulatory and tariff regimes. Most U.S. services are still strictly excluded from the market. According to the World Bank survey for 2014, India is ranked 142nd out of 189 countries due to its difficult business climate.
india
india
152This copy belongs to Chris Parks

International DataIndia
Local Content RequirementsThe Indian government is pursuing local content requirements in specific areas including information and communications technologies (ICT), electronics and solar energy to spur an increase in the manufacturing sector’s contribution to GDP. These policies negatively affect U.S. exporters.
With regard to ICT, which has been a particular area of concern this past year, India recently drafted a policy expressing preference for domestically manufactured telecommunications and ICT products in government procurement, citing security concerns. In addition, all telecom and ICT product purchases by the government that have security implications have to be reported to the Department of Telecommunications. In April 2013, the Indian government announced that all imported ICT equipment would require mandatory licensing and certification from accredited labs in India. The limited number of labs has created yet another hurdle for U.S. exporters seeking to have their products quickly certified for sale and use here. This regulation has not been fully enforced due to the limited capacity of Indian testing labs.
This preferential market access (PMA) policy could result in hindering imports of innovative technologies, forcing the government to choose from a limited pool of approved locally manufactured products for its ICT procurement needs. Most alarmingly, procurements by private telecom companies could be affected as well. Of similar concern is a newly evolving cloud computing policy, which could mandate that all government data remain in India, effectively denying market access to any foreign cloud storage companies.
Food Product ApprovalImporters must seek formal product approval for “proprietary foods” from the Product Approval Division of the Food Safety and Standards Authority of India (FSSAI). Every
“proprietary food” for which the FSSAI has not established a standard will be tested against safety and microbiological parameters, and for heavy metals, wherever applicable, depending upon the nature of the product. Product approvals are currently in abeyance due to a lawsuit filed in Bombay High Court by Vital Nutraceuticals Pvt. Ltd. against FSSAI; the defendant has been ordered to suspend approvals pending final disposition of the case.
Weakening of the Patent Regime for Pharmaceutical Industry In 2013, large pharmaceutical companies holding patents on innovative medicines were negatively affected by a ruling that weakened protection of intellectual property, with the Indian Supreme Court’s ruling in the Novartis Glivec patent case which interpreted Section 3(d) of the Indian Patents Act as barring the grant of patents for improved formulations and compounds that may have received patent protection in other countries. In the face of such obstacles, U.S. companies are re-evaluating their business models in India.
Powers of States On June 2, 2014, Andhra Pradesh was officially split, creating two states: Telangana and Seemandhra. Companies should be prepared to face varying business and economic conditions across India’s now 29 states and 7 union territories. Power and decision-making
india
153This copy belongs to Chris Parks

are decentralized in India, making differences at the state level more apparent in political leadership, quality of governance, regulations, taxation, labor relations and education levels. Gujarat is an example of a state with a positive business climate that has succeeded in attracting significant foreign investment. Jharkand and West Bengal are on the other side of the spectrum. Each has a much lower level of foreign-owned business activity. West Bengal’s continued efforts to make land more easily available through the government’s
“Land Bank” could spark interest in small greenfield projects. However, not enough land is available in tracts for heavy industrial projects. To do business in India successfully, an investor firm should factor differences in approach by different states into its national business strategy.
Overall, many businesses find they simply cannot afford to ignore the potentially lucrative Indian market despite its well-documented poor infrastructure, high tariffs, protectionist policies, corruption, bureaucratic inefficiency and intellectual property regime, which present the biggest obstacles to domestic and foreign investment and growth. India’s massive infrastructure requirements present trade and investment opportunities for U.S. companies seeking to compete against foreign bidders. Similarly, while recent modifications in India’s defense procurement procedure will give priority to domestic public and private sector firms for major military procurements, thus reducing the country’s dependence on imports from foreign vendors, major U.S. defense firms continue to succeed in the Indian market. Many large U.S. multinationals are more optimistic about India’s long-term potential and are expanding and deepening their market penetration. American firms with advanced and niche-market products and services are entering the market for the first time, or are replacing legacy distributors appointed in the past with more capable and aggressive representatives. Logistics companies are discovering India as a base for distribution throughout Asia, Africa and the Middle East. Finally, many smaller American firms have begun to view India as a top anchor market in the region for their products and services.
Market OpportunitiesThese sectors present the best opportunities for U.S. entrants to the Indian market on the basis of estimated Indian imports and potential for growth for 2015:
• Agribusiness
• Civil aviation
• Defense
• Education services
• Environment and water
• Franchising
• Healthcare and medical equipment
india
india
154This copy belongs to Chris Parks

International DataIndia
• Infrastructure/Smart cities
• Mining and mineral processing equipment
• Power and renewable energy
• Travel and tourism
• Corrosion control
• Supply chain management
Market-Entry StrategyStrategic planning, due diligence, consistent follow-up, and perhaps most importantly, patience and commitment are all prerequisites to successful business in India. This market necessitates multiple marketing efforts that address differing regional opportunities, standards, languages, cultural differences and levels of economic development. Gaining access to India’s markets requires careful analysis of consumer preferences, existing sales channels, and changes in distribution and marketing practices, all of which are continually evolving. Finding Partners and Agents: New-to-market businesses must address issues of sales channels, distribution and marketing practices, pricing and labeling, and protection of intellectual property. These issues are best addressed through and with an Indian partner or agent. Relationships and personal meetings with potential agents are extremely important. Due diligence is strongly recommended to ensure that partners are credible and reliable. Market-Entry Options: Options include using a subsidiary relationship, a joint venture with an Indian partner, or using a liaison, agent, distributor, project or branch office. Geographic Diversity: U.S. companies, particularly small- and medium-sized enterprises, should consider approaching India’s markets on a regional level. Good localized information is a key to success in such a large and diverse country. The U.S. Commercial Service offices in New Delhi, Mumbai, Chennai, Ahmedabad, Bengaluru, Hyderabad and Kolkata provide valuable local information and advice and are well connected with local business and economic leaders. Multiple agents are often required to serve the various geographic markets in the country.
“Doing Business in India” article is provided by the U.S. Commercial Service, the trade promotion arm of the U.S. Department of Commerce’s International Trade Administration. For more information on doing business in India, you may visit their website at www.export.gov/India.
The following charts are based on import and export data obtained from the website of the International Trade Centre (ITC)
india
155This copy belongs to Chris Parks

Demographics
65+5.9%
0–1428.1%
15–6466.0%
Economy
GDP-Industry29.5%
GDP-Agriculture16.1%
GDP-Service54.4%
Population in billions 1.3
Median Age 27.3Population Growth 1.22%
0
1
2
3
4
5
6
7
8
9
'15'14'13'12'11'10'09'08'07'06'05'04
India GDP (PPP)(U.S. $ in trillions)
0
2
4
6
8
10
12
'15'14'13'12'11'10'09'08'07'06'05'04
Unemployment Rate(Percent)
0
2
4
6
8
10
12
14
'15'14'13'12'11'10'09'08'07'06'05'04
In�ation (Annual Percent Rate)
INDIA SNAPSHOT
GDP (PPP) $8.03 trillion
GDP Per Capita $6,300
GDP-Real Growth Rate 7.30%
Unemployment Rate 7.10%
Inflation 5.60%
Age Male Female
0–14 0.19 0.16
15–64 0.43 0.40
65 & Over 0.04 0.04
Data Source: Demographics, Economy and Trade from CIA World Factbook, Music Industry from The Music Trades. GDP (PPP): Gross Domestic Product based on purchasing-power-parity (PPP) valuation of country GDP in U.S. dollars.
Demographics
Economy
156This copy belongs to Chris Parks
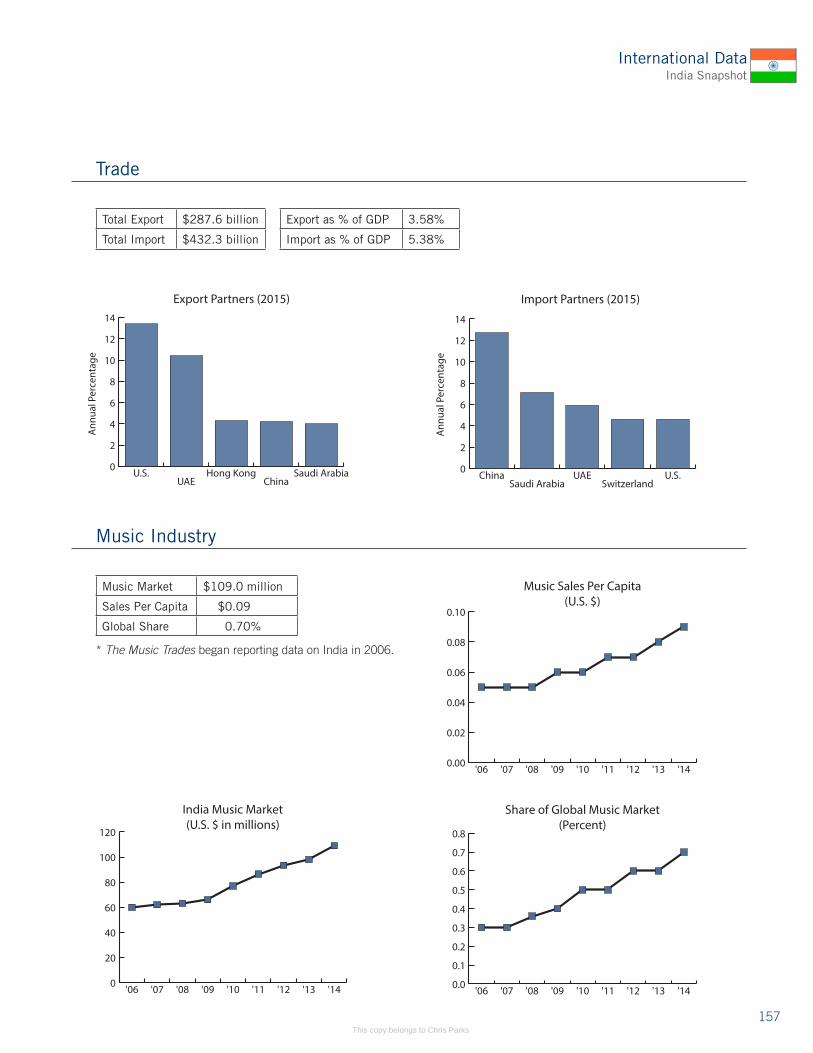
International DataIndia Snapshot
0
2
4
6
8
10
12
14
Saudi ArabiaChina
Hong KongUAE
U.S.
Export Partners (2015)
Ann
ual P
erce
ntag
e
0
2
4
6
8
10
12
14
U.S.Switzerland
UAESaudi Arabia
China
Import Partners (2015)
Ann
ual P
erce
ntag
e
Music Sales Per Capita(U.S. $)
0.00
0.02
0.04
0.06
0.08
0.10
'14'13'12'11'10'09'08'07'06
Share of Global Music Market(Percent)
0.0
0.1
0.2
0.3
0.4
0.5
0.6
0.7
0.8
'14'13'12'11'10'09'08'07'06
India Music Market(U.S. $ in millions)
0
20
40
60
80
100
120
'14'13'12'11'10'09'08'07'06
Trade
Music Industry
* The Music Trades began reporting data on India in 2006.
Total Export $287.6 billion Export as % of GDP 3.58%
Total Import $432.3 billion Import as % of GDP 5.38%
Music Market $109.0 million
Sales Per Capita $0.09
Global Share 0.70%
157This copy belongs to Chris Parks

0.0
0.5
1.0
1.5
2.0
2.5
'15'14'13'12'11'10'09'08'07'06
Acoustic PianosImports
Valu
e in
U.S
. $ m
illio
ns
Import Value
0
1
2
3
4
5
6
7
'15'14'13'12'11'10'09'08'07'06
Fretted & Stringed InstrumentsImports
Valu
e in
U.S
. $ m
illio
ns
Import Value
0
100
200
300
400
500
600
700
800
900
'15'14'13'12'11'10'09'08'07'06
Acoustic PianosExports
Valu
e in
U.S
. $ th
ousa
nds
Export Value
0
4
8
12
16
20
'15'14'13'12'11'10'09'08'07'06
KeyboardsImports
Valu
e in
U.S
. $ m
illio
ns
Import Value
0
1
2
3
4
5
6
7
8
'15'14'13'12'11'10'09'08'07'06
Fretted & Stringed InstrumentsExports
Valu
e in
U.S
. $ m
illio
ns
Export Value
0
1
2
3
4
5
'15'14'13'12'11'10'09'08'07'06
KeyboardsExports
Valu
e in
U.S
. $ m
illio
ns
Export Value
India Imports and Exports
158This copy belongs to Chris Parks

International DataIndia
0
1
2
3
4
5
'15'14'13'12'11'10'09'08'07'06
PercussionExports
Valu
e in
U.S
. $ m
illio
ns
Export Value
0.0
0.5
1.0
1.5
2.0
2.5
3.0
3.5
4.0
'15'14'13'12'11'10'09'08'07'06
PercussionImports
Valu
e in
U.S
. $ m
illio
ns
Import Value
0
1
2
3
4
5
6
7
8
9
'15'14'13'12'11'10'09'08'07'06
AccessoriesExports
Valu
e in
U.S
. $ m
illio
ns
Export Value
0
1
2
3
4
5
6
'15'14'13'12'11'10'09'08'07'06
AccessoriesImports
Valu
e in
U.S
. $ m
illio
ns
Import Value
0
200
400
600
800
1000
1200
'15'14'13'12'11'10'09'08'07'06
Wind InstrumentsImports
Valu
e in
U.S
. $ m
illio
ns
Import Value
0.0
0.2
0.4
0.6
0.8
1.0
1.2
'15'14'13'12'11'10'09'08'07'06
Wind InstrumentsExports
Valu
e in
U.S
. $ m
illio
ns Export Value
India Imports and Exports
159This copy belongs to Chris Parks

ITALY
Italy is a unitary parliamentary republic in Europe, with Rome as its capital city and covering an area of 301,338 km2 (116,347 sq. miles), with a population density of 197.7/km2. The European Union, a political entity composed of 28 European states, comprises the largest single economic area in the world. A total of 18 countries currently share the euro as a common currency. Five European countries rank in the top 10 of the world’s largest national economies in GDP (PPP), among which is Italy.
The resident population decreases and ages. In 2015, the population decreased by 139,000 people (–2.3 per thousand) compared to the previous year. On January 1, 2016, the population is estimated at 60.7 million residents. The population with an Italian citizenship drops to 55.6 million, with a loss of 179,000. In addition, the population is aging. The estimate demographic balance on January 1, 2016, is of 161.1 people aged 65 and over per every 100 people under 15 years (171.8 in central and 143.5 in southern Italy).
In 2015, the Italian economic cycle shows a moderate recovery. After a decline during the last three years, the Italian GDP in volume recorded again an increase (0.8%). Also recording moderate positive changes are national final expenditures (0.5%) and gross fixed capitals (0.8%), while exports showed a strong increase, but lower than that of imports (4.3% and 6.0%, respectively).
A boost to growth came from household consumption and disposable income. In 2015, the national final expenditures continued the ascent that was already evident in the previous year (0.5%, from 2014 at 0.2%). The most dynamic component was resident household spending, which grew by 0.9%; the government expenditure declined for the sixth consecutive year (–0.7%).
On average in 2015, inflation remains weak. Also in 2015, the harmonized index dynamics of consumer prices (HICP) showed a largely stable situation (+0.1%).
Employment growth in 2015 continues at a faster rate than the previous year. (+0.8%).
The unemployment rate descended from 12.7% in 2014 to 11.9% in 2015. During the year, the unemployment rate decreased in the first three quarters before stabilizing in the fourth quarter to 11.5%.
In 2015, the employment rate grows for both for Italian and foreign residents (respectively, 0.6 and 0.4 percentage points), and stood at 56.0% and 58.9%.
For 2016, the expectations on the international cycle show positive, albeit with signs of uncertainty. In early 2016, our country shows an emerging deterioration in confidence. Some encouraging signs, however, even if in a context of uncertainty, comes from economic indicators.
ANALYTICAL SURVEY OF THE ITALIAN M.I. MARKET IN 2015Last year, I closed my comments on the 2014 data writing that the 2014 increase of 3.3% brought the confidence back to the market and 4.2% increase in the first quarter of 2015 showed that the rise in 2014 signaled a definite trend.
ITALY
italy
160This copy belongs to Chris Parks

International DataItaly
The final result of 2015—with a total value of €290,884,084 (US$317,802,000)—corresponds to an increase of 10% from 2014, which confirms what I wrote last year. However, as is always the case, it is imperative to analyze all data, one by one, to get a clear picture of its composition in order to draw proper conclusions.
The increase of 2015 must be divided into two parts: one is due to the increases of the price lists all leading distributors and manufacturers had to apply due to the sharp increase of the US dollar/euro exchange rate, and the second is the result of an actual increase in sales.
In 2015, as many as 19 product families (from a total of 24) closed with an increase in turnover, among which eight enjoyed both an increase in units and in the average price, four instead are the product families that last year had the best performance—specifically increased units, increased turnover and decreased average price. These product families are electric guitars, educational instruments, sound reinforcement and recorders.
Five product families had an increase in turnover due to an increase of the average price, despite the reduced sales in units.
And two product families (music publishing and accessories) showed an increase in turnover, but there is no comparison in units and average prices because we only have the turnover figures.
Getting more into details, if we add the turnover of the eight product families achieving an increase in units, turnover and average price, we can see that the total exceeds €93 million (US$101 million), which represents 32.13% of the total yearly turnover.
We must add to the above eight product families the five product families that have achieved a bigger turnover because of an increase in the average price, despite the decrease in units. The total is a turnover of more than €34 million (US$37 million), representing 12% of the total yearly turnover. Putting together these two values, we have a sum of €127 million (US$139 million) that compared to the total yearly turnover, represents more than 44%.
We can say with reasonable certainty that this 44% represents the turnover achieved as a result of the U.S. dollar/euro exchange rate.
It is equally interesting to observe that the four best performing product families alone previously mentioned represent 25% of the total yearly turnover, with a total value of more than €71 million (US$77 million).
Acoustic Piano (Upright and Grands)Acoustic upright pianos have decreased moderately in units, the result of which has been offset by the average price, which determined a small increase in turnover (1.5%).
We need to mention here that the secondhand market for upright pianos in units and for grand pianos in value has a very important market share, for which we can’t have statistical returns for technical reasons, but which we should still consider.
italy
161This copy belongs to Chris Parks

italy
It’s important to mention the acoustic pianos with electronic integration which, because of an increase in average price, have immediately dropped in sales.
Digital Pianos A strong recovery on all fronts for the digital piano; this group again tops the threshold of €20 million (US$22 million). The reduction of the average price of this product family has been an excellent point that definitely had effects on the choice of the consumer. Interestingly, the 10% decrease of the average price has presumably increased the number of units sold by 54%.
The digital pianos with a traditional action appear on the market with an average price that is very near to the price of the acoustic piano.
Organs and HarpsichordsThe figures in this area unfortunately are not complete, especially in relation to the church organ, but we detect how the decisive placing of a good pipe organ on the market (see the following charts) can be in relation to the final turnover.
KeyboardsKeyboards are one of the product families showing a real market recovery. We can find in fact a substantial increase in units on all the lines (22.4%), an important increase in terms of turnover (27.1%) against a modest increase of 3.8% on the average price. The largest increase appears in a keyboard with small keys (perhaps schools are changing taste?).
Synth and SamplersEven in this area, the result is very positive: we find an 8.8% increase in units, which leads to a 12.5% bump in turnover with only a 3.4% increase in the average price.
Arrangers, Composers, ReadersThe first product family of 2015 in deep decline, but we can say that in this case, it is partially structural: MP3s have disappeared and midi readers have been drastically reduced. Here, there is a loss of 20.3% in turnover despite the reduction in average price of only 5.4%.
Acoustic GuitarsThis is another product family that confirms the recovery of the market: many more units have been brought onto the market (except for the acoustic non-electrified guitars, but these were offset by the electrified guitars, a fact that shows a change in taste by the users who tend to approach more and more the electrified acoustic rather than the traditional guitar). Ultimately, a 10.3% increase in units, 23.5% jump in sales, so again exceeding the threshold of €20 million €(US$22 million), which had not been surpassed for a long time! In addition, this category experienced a gain of 12% in average price, due almost exclusively to the U.S. dollar/euro exchange rate.
Electric GuitarsElectric guitars follow closely the trend of acoustic guitars confirming once more a recovery, although structured in a very different way. In fact, we observe a good increase of 23.4% in
italy
162This copy belongs to Chris Parks

International DataItaly
units, together with a growth of 11.6% in sales, hence bringing the total guitars turnover to more than €43 million (US$47 million) and a 9.5% decrease of the average price. Here, we need to highlight two product families: the guitar controllers, with an increase of 49.8% in units and of 29.4% in turnover and a drop of 13.6% of the average price, and the electric guitars, with a reduction of the average price of 8.2% despite the increases due to the U.S. dollar/euro exchange rate. Electric guitars are still in crisis, perhaps?
Mandolins, Banjos, Ukuleles, Etc.There has been a boom in the sale of fretted instruments, which increased from 10,765 to 13,198 units. This figure includes principally mandolins, banjos and ukuleles, where the latter have the greatest impact on the turnover. For this product family, the 2015 values are a 22.6% increase in units, a 27% increase in turnover and a 3.6% increase of the average price.
Wind InstrumentsThis is one more family of instruments backing the market recovery. Flutes, clarinets and bass tuba remain stable; saxophones and trumpets are in high growth; trombones, oboes and bassoons have an atypical drop. In general, we see a 7.4% increase in units, 9.9% increase in turnover settling at €14 million (US$15 million), with only a 2.3% increase of the average price, which supported this outcome.
Acoustic Bow InstrumentsThis area closes in positive territory, owing to the U.S. dollar/euro exchange rate. In fact, we see only a 3% gain in terms of units and an excellent increase of 18.8% in terms of turnover due to the 15.3% increase in the average price showing clearly the reasons behind the final result.
Electronic Bow Instruments This is an area with small figures; we find that the 6.7% increase in turnover is the result of the effect of the increased average price, which went up by 14.1% at the expense of a reduction of 6.5% in terms of units.
Percussion InstrumentsThe year 2015 closes for percussion instruments with a decrease of 1.5%, but we need to examine the details to get a clearer picture of these results.
Acoustic drums hold the position, losing only 1.1% against an increase of 4.9% of the electronic drums, which are slowly but steadily on the rise. The sales of individual drums (acoustic) and hardware in general are increasing, while we find an alarming plunge of 15.5% in the sales of cymbals, which must be monitored to see if this is a temporary phenomenon or whether we should seek other reasons behind this result.
AccordionsHere we have an expansion of the traditional instruments. The electronics have had a contraction, the concertinas are stable but the final result is a drop of 20.7% determined by a missed increase of units against a reduction of the average price of 21.1%.
italy
163This copy belongs to Chris Parks

italy
Educational Instruments This product family closes positively in all its segments: a 10.6% increase in units, 4.4% increase in turnover and a 5.1% decrease as average price. It is worth highlighting a significant growth for the recorders, where the reduction of the average price (8.1%) has triggered a growth of 9.6% in units, which kept the turnover unchanged from 2014. Metallophones and melodicas did very well.
Amplifiers The sales of this product family have been in distress for quite some time. This year at last the sales of guitar amplifiers with prices starting from €150 (US$164) increased by 2.8% in units and 16.3% in turnover. This happened because of the increase by 13.2% of the average price, result of the dollar/euro exchange rate. All such combinations together have determined a break-even with following values: –10.1% in units, +0.9% in turnover and +12.3% in the average price, where we can observe that the average price increase offsets the decrease in units.
Sound ReinforcementA total of 10 out of 15 segments that determine this product family closed with a remarkable increase in units with peaks reaching 71.8% in powered speakers up to €299 (US$327). A growth of 59% for passive mixers up to €360 (US$393) and of 63.2% for passive mixers from €360 to €3,600 (US$393 to US$3,933), but in this case with a value of a little more than 2,000 units, while in other segments we speak of tens of thousands. In this case, these mixers are reported because of the turnover they develop.
In terms of turnover, the sound reinforcement always remains in the lead of the whole M.I., in fact alone this product family already exceeds €44 million (US$48 million), and if we combine it with the microphone turnover, which develops over €19 million (US$21 million), the total becomes almost €65 million (US$71 million), which places this product family at the top of the ranking, followed—at a distance—by guitar sales.
MicrophonesAll traditional microphones underwent a strong increase in the average price ranging from 14.8% to 26.8%. The sales of microphones over €150 (US$164) dropped, probably due to an increase by 20.8% of the average price—with a reduction of 30.6% in turnover and 42.6% in units. Wireless microphones (+14.4% in units, +2.8% in turnover, –10.2% average price) and preamplifiers for microphones (+122.4% in units, +25.3% in turnover,
–43.6% average price) have enormously supported the whole product family, helping to contain losses within a mere 0.9%.
EffectsThe studio signal processors and single-pedal effects show a strong increase in turnover, determined by the simultaneous increase of units sold, together with the increase of the average price. The multi-effect pedals show a very important drop in terms of units and turnover, but this does not affect the final result of the product family, which closes with increases of 2.5% in units, 13.2% in turnover and 10.45% of the average price.
italy
164This copy belongs to Chris Parks

International DataItaly
Recorders Stand AloneWith the reduction of only 4% of the average price, this product family closes with a growth of 29.6% in terms of units of 24.4% in terms of turnover, reaching a total value of €2.71 million (US$2.96 million).
Music PublishingClassic Music increased from just over €6.9 million (US$7.5 million) to just over €7.1 million (US$7.8 million), with an increase of 3.3%. Light Music increased from just over €3.8 million (US$4.1 million) to just over €4.0 million (US$4.4 million), with an increase of 6.9%.
AccessoriesWe go from a turnover of €29,864,285 (US$32,627,900) to €34,075,602 (US$37,229,000) by establishing an important increase of 14.1%, which is likely due to the impact of the U.S. dollar/euro exchange rate. All accessories and strings increased, while tuners reduced by 2.9%.
Computer MusicExcept for the recording software and other software that registered a 43.7% drop in units, which causes a reduction of only 8% in sales probably generated by the increase of 63.5% of the average price, the sector closes very well with a growth of 12.3% in units, 15.4% in turnover and 2.8% in average price.
ConclusionsLast year’s great achievement deserves praise for all people working in the Italian M.I. industry. It is the result of the tremendous efforts made by those who work in the world of making music, a result that has an even greater value when you consider that it occurred in a time of profound changes in the industry’s market structure.
I refer, for example, to online sales coming from abroad, which last year took away well over €13 million (US$14 million) from the pockets of our customers, an amount that otherwise could have been added to the already-superb result.
The changes have not ended; rather, each year they are more and more defined. For those who have a business in this industry, it is necessary to make a serious and deep analysis of its structure and operating system to identify the possibility of targeted changes as innovation, communication, presentation, assortment, inventory and customer service. Today the consumer is not willing to wait, the offer comes from everywhere, and if we don’t want to miss any opportunity, we must be ready at any time.
The year 2016 has started with the best possible prospects to go in this direction; the first quarter has already yielded very positive results of a 4.87% increase (information available thanks to the cooperation of all Dismamusica members, so that every quarter we can have the current trend of the Italian M.I.).
Source: ISTAT (National Institute of Statistics) Annual Report 2016Exchange rate for euros to U.S. dollars used, as of December 31, 2015
Commentary by Claudio Formisano, President of Dismamusica
italy
165This copy belongs to Chris Parks

italy
DOING BUSINESS IN ITALY
Market Overview• Italy is the world’s eighth largest economy with a GDP of US$1.9 trillion in 2014. The
country’s economy has contracted by more than 9% since 2007, with contractions of 2.4% in 2012, 1.9% in 2013 and 0.4% in 2014. Italy emerged from recession in the first quarter of 2015.
• In 2014, Italy was the 21st largest market for U.S. exports, which totaled approximately US$17 billion, and sixth largest export market in the EU, following the UK, Germany, Netherlands, Belgium and France.
• U.S. exports to Italy are increasing steadily, and are concentrated in high-value sectors such as transportation machinery (12%), pharmaceuticals (11%) and electrical machinery (8%).
• In 2014, the United States was Italy’s third largest destination for exports (US$39.4 billion), following Germany and France. The United States is Italy’s eighth largest supplier.
• Based in part on structural reforms being pursued by the Italian government, the Italian economy is beginning to move into a solid recovery after its longest recession in recent memory, and there appears to be political momentum for improvements to Italy’s investment climate. U.S. cumulative direct investment in Italy was US$27.6 billion in 2013, ranking Italy 12th in Europe. U.S. investment is concentrated in manufacturing, computer services and software, and energy, with significant industrial relationships in the aerospace and automotive sectors.
• Italy has a population of approximately 61 million. More women are entering, and remaining, in the workforce, although their participation remains below EU averages.
• Industrial activity is concentrated in the north, in a swath that runs from Turin in the west, through Milan to Venice in the east. This is one of the most industrialized and prosperous areas in Europe and accounts for more than 50% of Italy’s national income. By contrast, Italy’s southern region, or “Mezzogiorno,” is less developed.
• Italy’s current government was formed in February 2014, when now 40-year-old Florence mayor and Democratic Party (PD) leader Matteo Renzi replaced Enrico Letta as Prime Minister.
• Renzi’s center-left PD dominates his governing coalition, which includes the New Center Right party, the Civic Choice party, and the Union of the Center.
• Renzi’s goals include stimulating the Italian economy through labor market, public administration, justice and education reform; reforming the electoral system; and streamlining Italy’s political institutions. As new reforms are implemented by the Renzi government, opportunities for U.S. companies are likely to arise in many sectors.
italy
166This copy belongs to Chris Parks

International DataItaly
• Recognizing that the U.S.-EU economic relationship is already the world’s largest, President Obama announced his administration’s plans to begin negotiations on a Transatlantic Trade and Investment Partnership (T-TIP) with the EU in 2013. T-TIP is an ambitious and comprehensive trade and investment agreement that will promote transatlantic international competitiveness, jobs and growth. Negotiations are ongoing as of summer 2015.
Market Challenges• Italy is a mature and sophisticated market. U.S. entrants face strong competition
from local and other EU companies in all market segments.
• Italy’s regulatory environment is complex and at times lacks the transparency, clarity, efficiency and certainty found in other developed economies.
• Products that involve health, safety or environmental concerns are likely to be highly regulated. While EU-wide regulations often apply, Italian laws may go beyond the basic EU requirements.
• Italy’s economy is dominated by small and medium-sized firms (SMEs), many of which are family-owned, comprising 99.9% of Italian businesses and producing 68% of Italy’s GDP.
• Italy’s SME sector has a higher proportion of firms employing fewer than 10 people than the EU average. These companies contribute nearly half of total employment and one-third of value added to the economy.
Market Opportunities• U.S. firms enjoy opportunities in sectors where new regulations or programs (often
imposed or initiated at the EU level) are creating demand; with new products/services where there is little or no domestic competition; and/or where the U.S. product offers clear technological, design or price advantages.
• Best prospects for U.S. exports include airport and ground support equipment, alternative fuel vehicles, cosmetics and toiletries, cybersecurity, energy efficiency technologies, financial services and innovative finance, medical devices and technologies, mobile communications, and travel and tourism.
• Key U.S. exports in Italy include pharmaceutical products, industrial machinery and machine tools, electrical appliances, automobiles and auto parts, food and wine, tourism services, as well as textiles/fashion.
• Pharmaceuticals represent the second sector for U.S. investors in Italy in terms of sales (20%) and employment (14%). U.S. biopharmaceutical companies have an annual turnover of €4.7 billion (30% of the total industry).
italy
167This copy belongs to Chris Parks

italy
• Italy hosts major trade shows that attract buyers from throughout Europe, the Mediterranean and beyond. The Commercial Service offers on-site support for U.S. exporters at most of the major international shows, or by request.
• Italy hosted the Milan Expo May 1–October 31, 2015, with the theme of “Feeding the Planet: Energy for Life.” The Milan Expo showcases over 140 participating countries and expects more than 20 million visitors from around the world.
• In 2014, U.S. agricultural, fish and forestry exports to Italy were US$1.4 billion, whereas, U.S. imports from Italy reached US$4.1 billion. The U.S. exports bulk and intermediary products to Italy, namely wheat, soybeans, hides and skins, hardwood lumber and planting seeds. Quantities exported in a given year can fluctuate widely depending on the internal European feed grain and wheat supply and demand situation as well as external competitive factors with third-country suppliers. Products are processed into high-value items like cured meats and cheeses, pasta, shoes and furniture, which are then re-exported to the United States.
Market-Entry Strategies• The cultivation and maintenance of personal relationships are a vital part of doing
business in Italy. Finding the right Italian agent, distributor or business partner is therefore essential to entering the Italian market. It is usually not effective to rely on agents or distributors in neighboring markets, since despite the existence of the EU common market, the Italian market remains very individualized.
• The ideal candidates should already have a network of relationships that will open doors in the market. They should have a solid understanding of local business practices and regulations. For technical products, the potential partner should have the ability to provide Italian customers with after-sales service. Patience is essential as it may take two to three times longer than expected to establish a business.
• E-commerce remains less developed in Italy due to factors such as a high level of credit card fraud, lack of trust in the postal system, limited broadband connectivity and the traditionally less favorable return practices of Italian merchants. However, Italians do use the Internet extensively for social networking and information.
“Doing Business in Italy” article is provided by the U.S. Commercial Service, the trade promotion arm of the U.S. Department of Commerce’s International Trade Administration. For more information on doing business in Italy, you may visit their website at www.export.gov/Italy.
The following charts are based on retail sales data provided by the Italian Music Association, Dismamusica
168This copy belongs to Chris Parks

International DataItaly Snapshot
Demographics
65+21.2%
0–1413.7%
15–6465.1%
Economy
GDP-Service74.2%
GDP-Agriculture2.2%
GDP-Industry23.6%
Population in millions 61.9
Median Age 44.8Population Growth 0.27%
0.0
0.5
1.0
1.5
2.0
2.5
'15'14'13'12'11'10'09'08'07'06'05'04
Italy GDP(U.S. $ in trillions)
0
2
4
6
8
10
12
14
'15'14'13'12'11'10'09'08'07'06'05'04
Unemployment Rate(Percent)
0
1
2
3
4
5
'15'14'13'12'11'10'09'08'07'06'05'04
In�ation (Annual Percent Rate)
ITALY SNAPSHOT
Demographics
Economy
GDP (PPP) $2.17 trillion
GDP Per Capita $35,800
GDP-Real Growth Rate 0.80%
Unemployment Rate 12.20%
Inflation 0.30%
Age Male Female
0–14 4.34 4.15
15–64 19.86 20.39
65 & Over 5.63 7.48
Data Source: Demographics, Economy and Trade from CIA World Factbook, Music Industry from DismaMúsica. GDP (PPP): Gross Domestic Product based on purchasing-power-parity (PPP) valuation of country GDP in U.S. dollars.
169This copy belongs to Chris Parks

0
2
4
6
8
10
12
14
SpainSwitzerland
U.K.U.S.
FranceGermany
Export Partners (2015)
Ann
ual P
erce
ntag
e
0
3
6
9
12
15
18
BelgiumSpain
NetherlandsChina
FranceGermany
Import Partners (2015)
Ann
ual P
erce
ntag
e
0
2
4
6
8
10
12
'14'13'12'11'10'09'08'07'06'05
Music Sales Per Capita(U.S. $)
0.0
0.5
1.0
1.5
2.0
2.5
3.0
3.5
'14'13'12'11'10'09'08'07'06'05
Share of Global Music Market(Percent)
0
100
200
300
400
500
600
700
'14'13'12'11'10'09'08'07'06'05
Italy Music Market(U.S. $ in millions)
Trade
Music Industry
Total Export $454.6 billion Export as % of GDP 20.95%
Total Import $389.2 billion Import as % of GDP 17.94%
Music Market $332.1 million
Sales Per Capita $5.38
Global Share 1.99%
170This copy belongs to Chris Parks

International DataItaly
0
5
10
15
20
25
'15'14'13'12'11'10'09'08'07'06
Acoustic Guitars
0
25
50
75
100
125
150
175
200
04030201
Valu
e €
in m
illio
ns
Uni
ts x
1,0
00
0
25
50
75
100
125
150
175
200
'15'14'13'12'11'10'09'08'07'06
Retail Value Units
0
5
10
15
20
25
30
35
40
'15'14'13'12'11'10'09'08'07'06
Electric Guitars
0
10
20
30
40
50
60
7080
90
04030201
Valu
e €
in m
illio
ns
Uni
ts x
1,0
00
0
10
20
30
40
50
60
70
80
90
'15'14'13'12'11'10'09'08'07'06
Retail Value Units
0
3
6
9
12
15
18
'15'14'13'12'11'10'09'08'07'06
Grand Pianos
0
100
200
300
400
500
600
700
800
900
04030201
Valu
e €
in m
illio
ns
Uni
ts
0
100
200300
400
500600
700
800900
'15'14'13'12'11'10'09'08'07'06
Retail Value Units
0
10
20
30
40
50
60
70
'15'14'13'12'11'10'09'08'07'06
Total Guitars
0
50
100
150
200
250
300
04030201
Valu
e €
in m
illio
ns
Uni
ts x
1,0
00
0
50
100
150
200
250
300
'15'14'13'12'11'10'09'08'07'06
Retail Value Units
0
2
4
6
8
10
'15'14'13'12'11'10'09'08'07'06
Upright Pianos
0.0
0.5
1.0
1.5
2.0
2.5
3.0
3.5
04030201
Valu
e €
in m
illio
ns
Uni
ts x
1,0
00
0.0
0.5
1.0
1.5
2.0
2.5
3.0
3.5
'15'14'13'12'11'10'09'08'07'06
Retail Value Units
0
5
10
15
20
25
30
'15'14'13'12'11'10'09'08'07'06
Total Acoustic Pianos
0.0
0.5
1.0
1.5
2.0
2.5
3.0
3.5
4.0
4.5
04030201
Valu
e €
in m
illio
ns
Uni
ts x
1,0
00
0.0
0.5
1.0
1.5
2.0
2.5
3.0
3.5
4.0
4.5
'15'14'13'12'11'10'09'08'07'06
Retail Value Units
Italy Domestic Sales
171This copy belongs to Chris Parks

Italy Domestic Sales
0
5
10
15
20
25
30
35
40
'15'14'13'12'11'10'09'08'07'06
Percussion
Valu
e €
in m
illio
ns
Retail Value
0
5
10
15
20
25
'15'14'13'12'11'10'09'08'07'06
Portable Keyboards
0
25
50
75
100
125
150
04030201
Valu
e €
in m
illio
ns
Uni
ts x
1,0
00
0
25
50
75
100
125
150
'15'14'13'12'11'10'09'08'07'06
Retail Value Units
0
4
8
12
16
20
'15'14'13'12'11'10'09'08'07'06
Print Music
Valu
e €
in m
illio
ns
Retail Value
0.0
0.5
1.0
1.5
2.0
2.5
3.0
3.5
'15'14'13'12'11'10'09'08'07'06
Stringed Instruments with a Bow
0
5
10
15
20
25
04030201
Valu
e €
in m
illio
ns
Uni
ts x
1,0
00
0
5
10
15
20
25
'15'14'13'12'11'10'09'08'07'06
Retail Value Units
0
5
10
15
20
25
30
'15'14'13'12'11'10'09'08'07'06
Digital Pianos
0
5
10
15
20
25
30
04030201
Valu
e €
in m
illio
ns
Uni
ts x
1,0
00
0
5
10
15
20
25
30
'15'14'13'12'11'10'09'08'07'06
Retail Value Units
0
5
10
15
20
25
'15'14'13'12'11'10'09'08'07'06
Wind Instruments
0
20
40
60
80
100
120
04030201
Valu
e €
in m
illio
ns
Uni
ts x
1,0
00
0
20
40
60
80
100
120
'15'14'13'12'11'10'09'08'07'06
Retail Value Units
172This copy belongs to Chris Parks
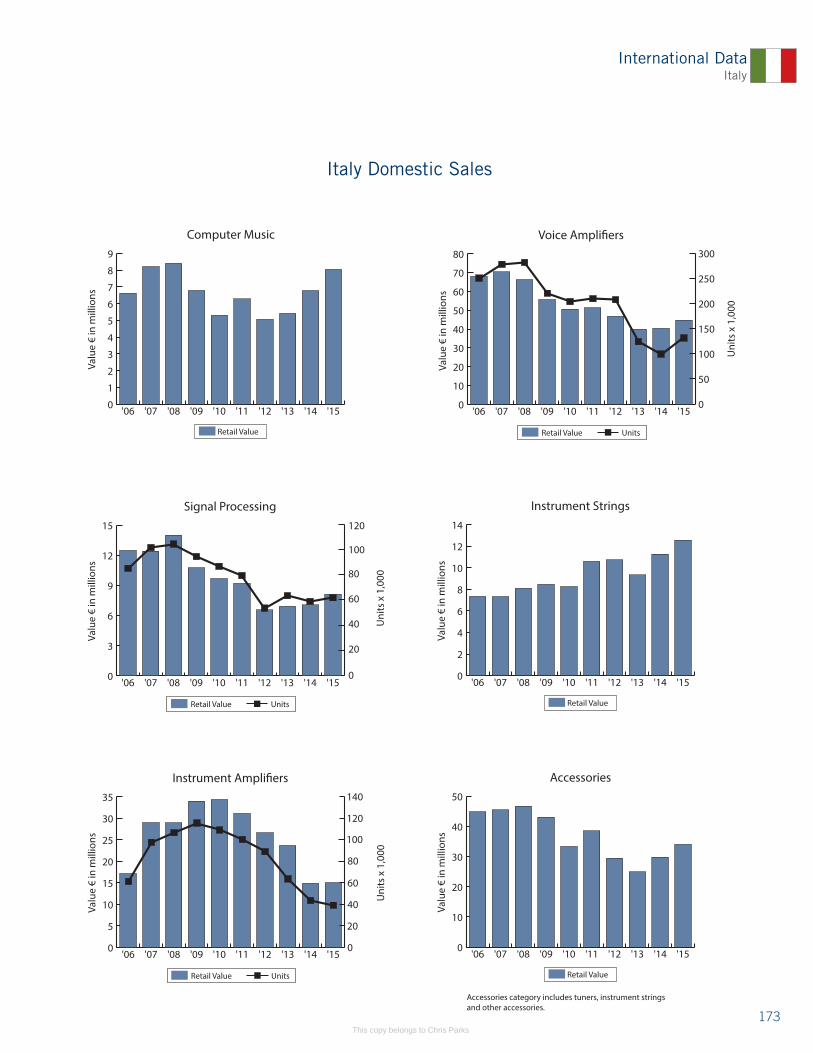
International DataItaly
0
3
6
9
12
15
'15'14'13'12'11'10'09'08'07'06
Signal Processing
0
20
40
60
80
100
120
04030201
Valu
e €
in m
illio
ns
Uni
ts x
1,0
00
0
20
40
60
80
100
120
'15'14'13'12'11'10'09'08'07'06
Retail Value Units
0
5
10
15
20
25
30
35
'15'14'13'12'11'10'09'08'07'06
Instrument Ampli�ers
0
20
40
60
80
100
120
140
04030201
Valu
e €
in m
illio
ns
Uni
ts x
1,0
00
0
20
40
60
80
100120
140
'15'14'13'12'11'10'09'08'07'06
Retail Value Units
0
1
2
3
4
5
6
7
8
9
'15'14'13'12'11'10'09'08'07'06
Computer Music
Valu
e €
in m
illio
ns
Retail Value
0
10
20
30
40
50
60
70
80
'15'14'13'12'11'10'09'08'07'06
Voice Ampli�ers
0
50
100
150
200
250
300
04030201
Valu
e €
in m
illio
ns
Uni
ts x
1,0
00
0
50
100
150
200
250
300
'15'14'13'12'11'10'09'08'07'06
Retail Value Units
0
2
4
6
8
10
12
14
'15'14'13'12'11'10'09'08'07'06
Instrument Strings
Valu
e €
in m
illio
ns
Retail Value
0
10
20
30
40
50
'15'14'13'12'11'10'09'08'07'06
Accessories
Valu
e €
in m
illio
ns
Retail Value
Accessories category includes tuners, instrument strings and other accessories.
Italy Domestic Sales
173This copy belongs to Chris Parks
JAPAN
The data and comments in this report are based on statistics compiled by the Musical Instruments Manufacturers’ Association (MIMA) and the Ministry of Economy, Trade and Industry (METI) for production, domestic sales and exports, and the Ministry of Finance (MF) for imports. Amounts and percentages are rounded.
Economic Growth Japan has been facing critically slow economic growth in addition to a flat GDP for over two decades, a recent example of which can be seen in the following trends:
2014 2015 2016Japan -0.03% 0.47% 0.49%United States 2.43% 2.43% 2.40%(Source: IMF World Economic Outlook Databases)
GDP Japan has had a very slow economy since the collapse of the bubble back in 1991. The growth rate of Japan’s GDP between 1991 and 2015 was 1.2 times in yen or 1.4 times in U.S. dollars, while the growth rate of the U.S. GDP was 2.9 times. (The gap in growth rates between the yen and the dollar is due to currency exchange rates.) Japan and U.S. GDP Growth Rate (value in billion US$)
1991 2009 2015 1991–2015Japan 3,256 5,232 4,590 +41%United States 6,174 14,419 17,968 +290%
Exchange rate (yen to the U.S. dollar)1991 - \134.70 2009 - \93.572015 - \115.49 This slow economy appears to have affected the sales of musical instruments in Japan.
Consumption TaxThe Japanese government plans another consumption tax hike to 10% in April 2017; however, this is currently uncertain as the slow economy continues. In addition, how much the recent Kumamoto earthquake will impact the general economy is unknown. And the diet election slated for this summer may influence government-related decisions.
Japan’s consumption tax1989 1997 2014 20173% 5% 8% E-10%
106.6 Billion Yen Total Sales in 2015 (Factory Shipment Amount)According to statistics compiled by the MIMA, total sales of Japanese music products in 2015 marked 106.6 billion yen, almost flat from the result of 107.6 billion yen in 2014.
JAPA
N
japan
174This copy belongs to Chris Parks

International DataJapan
Domestic sales in 2015 marked 52.4 billion yen, 91% of the total in 2014, and export sales were 54.2 billion yen, which represents 109% of the 2014 total.
Domestic sales in 2014 were 57.7 billion yen, surged by running demand before the consumption tax increase later in the year. The domestic sales for 2015 were affected by the same reason but this resulted in a slight increase compared with 51.4 billion yen in 2013. In 2015, the items exceeding 2014’s figures in both value and units were guitars (123% increase in units over 2014, 114% increase in value over 2014), concert drums (152% in units, 189% in value), keyboard harmonicas (104% in units, 118% in value), recorders (117% in units, 111% in value), portable electronic keyboards (113% in units, 123% in value), keyboard synthesizers (110% in units, 102% in value) and other electronic instruments (115% in units, 126% in value).
Export sales increased moderately due to the lower yen rate, making the growth rate in value higher than the growth rate in units on many items. The following items increased by more than 30% in value over the 2014 totals: guitars (500 million yen, 138% over 2014), other brass instruments (3.4 billion yen, 133%), other percussion instruments (16 million yen, 271%), keyboard synthesizers (5 billion yen, 135%). And most items in the percussion instruments category also marked an increase in value and units.
While live performance-oriented, mid-range keyboards showed steady growth, larger products such as Korg’s Arp Odessey and Roland’s JD series (introduced in the first half of last year) also garnered the attention of musicians and the industry. Small, lightweight, reasonably priced models such as the Yamaha Reface series and the Roland Boutique series (introduced in the second half of the year) led the market.
Almost no products showed a significant decrease. However, electronic organs (with the Yamaha Electone Stagea remodeled for the first time in 10 years) and the export of electronic keyboards (which had gained a large increase in 2014), decreased conspicuously by about 50% in 2015. In particular, electronic keyboard exports decreased significantly from 100,000 units to 5,000 units during the last five years due to the increase of overseas production.
Export data compiled by the Ministry of Finance show similar results as the MIMA statistics. The following percentages are provided as comparisons to the amounts in 2014. Total export value in 2015: 68.6 billion yen, 109%; other wind instruments: 8.4 billion yen, 113%; brass instruments: 4.8 billion yen, 126%; guitar and other stringed instruments: 800 million yen, 177%; vertical pianos (assuming the inclusion of a large percentage of used pianos): 19.3 billion yen, 123%; electric guitars: 2.1 billion yen, 113%.
Imported items that increased in units over their 2014 amounts are guitars (230,000 units, 112%) and percussion instruments (2,130,000 units, 119%). However, sales value of these items except for guitars was almost flat or declined slightly over the previous year. The currency exchange rate in 2015 was 120 yen to the U.S. dollar, while it was between 100 yen and 110 yen to the U.S. dollar in 2014. More than half of guitar imports, both value- and units-wise, are from the United States, so the exchange rate has a strong impact on the import value.
japan
175This copy belongs to Chris Parks

The total value of imports in 2015 was 58.6 billion yen, which is 99% of the 2014 figure. The top five items were electric and electronic instruments with keyboard: 11 billion yen, 19% of the total value; electric guitars: 7.8 billion yen, 13%; parts of other instruments: 5.7 billion yen, 10%; guitar and other stringed instruments: 4.9 billion yen, 8%; other wind instruments: 2.1 billion yen, 8%. Together, these categories make up approximately 60% of the total value of imports.
Commentary by Shunco Mori, Director of Japan Music Trades
DOING BUSINESS IN JAPAN
Market OverviewIntroductionThe only Asian member of the G-7, Japan is an economic and demographic trend-setter among the world’s advanced countries. It is a technology and manufacturing powerhouse that plays a leading role in the global economy and global supply chains. Japan’s large middle class demands a variety of consumer goods and services and drives a consumer economy that leads the national economy. Moreover, Japan has the second largest total amount of foreign direct investment (FDI) in the United States with a cumulative FDI stock of approximately US$342 billion. More notably still, Japan has been the single largest source of FDI into the U.S. market over the past two years. As a result, Japan sees dozens of visits by senior U.S. state and city officials annually. While the reasons U.S. firms engage with Japan are diverse, the strategic and tactical importance of the Japanese market is critical for their business in Japan, in the United States, and in third-country markets as well.
Top Five Reasons Why U.S. Companies Should Consider Exporting to Japan1. Japan is the third largest economy in the world, after the United States and
China. Japan is the fourth largest importer of U.S. products, after Canada, Mexico and China. Japan is a key player in the global economy and international trade system with well-established rule of law and strong protections for property rights, intellectual and other.
2. Japan’s strategic alliance and deep economic integration with the United States provides opportunities in cutting-edge sectors from space, defense, security, among other sectors. The country is a leading importer of U.S. aerospace and defense equipment and, increasingly, an integrated co-developer. Fast-growing markets include advanced manufacturing, healthcare, cyber security and physical security equipment.
3. Japan has a large middle class and a broad-based, highly developed consumer economy that offers great potential for consumer products and services and B2C sales. Japan has a high per-capita income, with a GDP per capita of US$37,800, with significant disposable and household consumption representing almost 61% of
japan
japan
176This copy belongs to Chris Parks
International Data
GDP. Japan’s middle-class consumption is ranked second behind that of the United States, according to the Brookings Institution. The following examples are provided to this point:
• Japan ranks No. 1 in the world in health spending per capita: over US$4,000 per year (source: Ernst and Young)
• Japan is the second largest source of overseas travel and tourism to the United States: 3.7 million visitors in 2013 (source: Commerce, ITA)
• Japan is the seventh largest source of international students to the United States: 19,334 students during the 2013–14 school year (source: Open Doors Report)
4. Japan is highly dependent upon both energy and food imports as the world’s largest net importer of food products. The United States is the leading supplier of Japan’s agricultural imports. Total U.S. food, agricultural and fishery exports to Japan were more than US$13.5 billion in 2014, and U.S. manufactured food exports to the country were US$6.5 billion in 2014. The United States is also well positioned to help Japan exploit its well-deserved reputation as a source of safe, high-value added food (and healthcare) products.
5. Japan has scarce natural resources and is highly dependent upon imports of energy, metals, minerals and other raw materials. Japan is the world’s largest liquefied natural gas importer, the second largest coal importer and the third largest net importer of crude oil and oil products. In addition to aggressively welcoming international collaboration on renewable and distributed energy, Japanese firms have also signed multi-decade purchase agreements to import liquefied natural gas from the United States.
Economic Policy and International TradePrime Minister Shinzō Abe is implementing economic policies to revitalize the economy. These new economic policies are known collectively as “Abenomics”: a three-pronged strategy that combines flexible fiscal policy, monetary easing and structural reform. While the success of this strategy in re-igniting long-term growth in Japan is uncertain, it has drawn considerable attention from U.S. businesses. Reforms to Japan’s agricultural landholding system and corporate governance disciplines aimed at increasing transparency and unlocking shareholder value have attracted particular attention.
The United States, Japan and ten other countries are in the latter stages of negotiations on the Trans-Pacific Partnership (TPP). With Japan’s participation, TPP members account for nearly 40% of world GDP. Moreover, the liberalization expected to be required of TPP member countries may play an important role in promoting the domestic economic reforms likely to be called for under “Abenomics.” As of June 2015, the U.S.-Japan TPP talks have been proceeding vigorously, with most topics nearly agreed upon (according to newspaper accounts).
japan
Japan
177This copy belongs to Chris Parks

DemographicsJapan has a declining population and rapidly aging society. The country’s population is projected by researchers to shrink by one-third by 2060 (from 127 million to 87 million), and the share of the population over age 65 is expected to rise from 25% today to 40% by 2060. The Japanese government, healthcare industry and business community are actively engaged in both seeking to ameliorate the decline in population, as well as to adapt to its impacts, beginning with a check on potential macroeconomic growth. Japan’s aging population, likewise, is often seen as a drag on the economy, but actually presents business opportunities in sectors that include:
• Medical devices and equipment• Pharmaceuticals• Healthcare facilities and
infrastructure, including in-home care• Biotechnology
• Healthcare information technology• Safety• Robotics• Leisure and travel• Educational services
Recent DevelopmentsDuring 2014 and 2015, the Japanese yen continued to weaken. Even so, U.S. products remain competitive in Japan. The country’s large government debt, which totals more than 200% of GDP, is another long-term challenge confronting the economy.
While Japan has made significant steps toward economic healing following the tragic combined earthquake, tsunami, and nuclear incident of March 2011, lasting changes on various levels remain noticeable, including idled nuclear power plants, dislocated communities and a lack of long-term confidence in wage and purchasing power growth. In particular, greater levels of manufacturing by Japanese companies outside of Japan, increased fuel imports and a weakening yen have turned Japan’s multi-decade trade surplus into a trade deficit.
Market ChallengesThe difficulty of penetrating the Japanese market depends on the specific product or service being offered. Tariffs on most imported goods into Japan are low. However, cultural, regulatory and other non-tariff barriers to market entry may exist. These can include Japanese import license requirements, restricted or prohibited imports, temporary entry of goods, certifications, standards, labeling requirements, service and quality expectations, business practices, local or third-country competition, and language (both spoken and written). By understanding and planning for the challenges of the Japanese market and market entry, U.S. exporters and companies can better prepare themselves and increase their ability to compete and succeed.
Market OpportunitiesThe Japanese market offers numerous opportunities for U.S. companies in a wide variety of sectors. Japan’s principal imports from all countries in 2014 include the following sectors:
• Mineral fuels • Electrical machinery • Manufactured goods
• Chemicals • Machinery • Foodstuffs
japan
japan
178This copy belongs to Chris Parks

International Data
• Raw materials • Clothing and accessories
• Transport equipment
Market-Entry StrategiesFor new-to-market exporters, market-entry strategies are an essential business decision. Time spent on developing a suitable market-entry strategy is key to success and longevity in the Japanese market. Possible market-entry options may include:
• Direct exporting• E-commerce• Partnering• Joint ventures• Piggybacking
• Turn-key projects• Licensing• Franchising• Buying a company• Greenfield investments
Companies exporting to Japan can improve their chances of success by learning about Japanese culture and business practices, and generally engaging in extensive business planning prior to entry and, certainly, partner selection. An investment in acquiring some Japanese language skills will pay large dividends; Japanese businesspeople will appreciate efforts made to communicate with even basic Japanese. However, effective go-betweens and professional interpreters can make the difference between success and failure. Marketing in Japanese is essential to communicate with Japanese consumers and business customers. Top priorities for marketing in Japanese include business cards, product marketing information, website and basic self-introduction phrases.
Labeling requirements for many products are specified by government regulation and must be in Japanese. It is important to appreciate the demanding expectations of the Japanese consumer in terms of quality (to the extent of blemish-free product) and service delivery. An understanding of Japanese business and social practices is useful, if not required, in establishing and maintaining successful relationships for doing business in Japan. Indifference to local business customs can indicate a lack of commitment on the part of the exporter, and may lead to misunderstandings and bad feelings, which could result in the loss of business opportunities. Key considerations include:
• Japanese society is complex, structured, respectful of age, hierarchical and group-oriented
• Group decision-making is important in Japan
• Gift giving is expected on many business occasions in Japan
• Business travelers should make sure to bring a large supply of business cards (with their title) when they visit Japan; bilingual cards are appreciated
• Business travelers visiting a Japanese firm for the first time should be accompanied by an interpreter or bilingual assistant
japan
Japan
179This copy belongs to Chris Parks

“Doing Business in Japan” article is provided by the U.S. Commercial Service, the trade promotion arm of the U.S. Department of Commerce’s International Trade Administration. For more information on doing business in Japan, visit www.export.gov/Japan.
The following charts are based on domestic sales and export data provided by the Japan Musical Instruments Manufacturers’ Association (JMIMA), the Ministry of Economy, Trade and Industry (METI), and the Customs Bureau of the Ministry of Finance, and published by the Japan Music Trades.
japan
180This copy belongs to Chris Parks

International DataJapan Snapshot
-1.5
-1.0
-0.5
0.0
0.5
1.0
1.5
2.0
2.5
3.0
'15'14'13'12'11'10'09'08'07'06'05'04
In�ation(Annual Percent Rate)
Demographics
65+13.1%
0–1426.6%
15–6460.3%
Economy
GDP-Industry26.6%
GDP-Agriculture1.2%
GDP-Service72.2%
Population in millions 126.9
Median Age 46.5Population Growth -0.16%
0
1
2
3
4
5
'15'14'13'12'11'10'09'08'07'06'05'04
Japan GDP (PPP)(U.S. $ in trillions)
0
1
2
3
4
5
6
'15'14'13'12'11'10'09'08'07'06'05'04
Unemployment Rate(Percent)
JAPAN SNAPSHOT
Age Male Female
0–14 8.58 8.05
15–64 38.31 38.23
65 & Over 14.69 19.06
GDP (PPP) $4.66 trillion
GDP Per Capita $38,200
GDP-Real Growth Rate 0.60%
Unemployment Rate 3.30%
Inflation 0.70%
Data Source: Demographics, Economy and Trade from CIA World Factbook, Music Industry from The Music Trades. GDP (PPP): Gross Domestic Product based on purchasing-power-parity (PPP) valuation of country GDP in U.S. dollars.
Demographics
Economy
181This copy belongs to Chris Parks
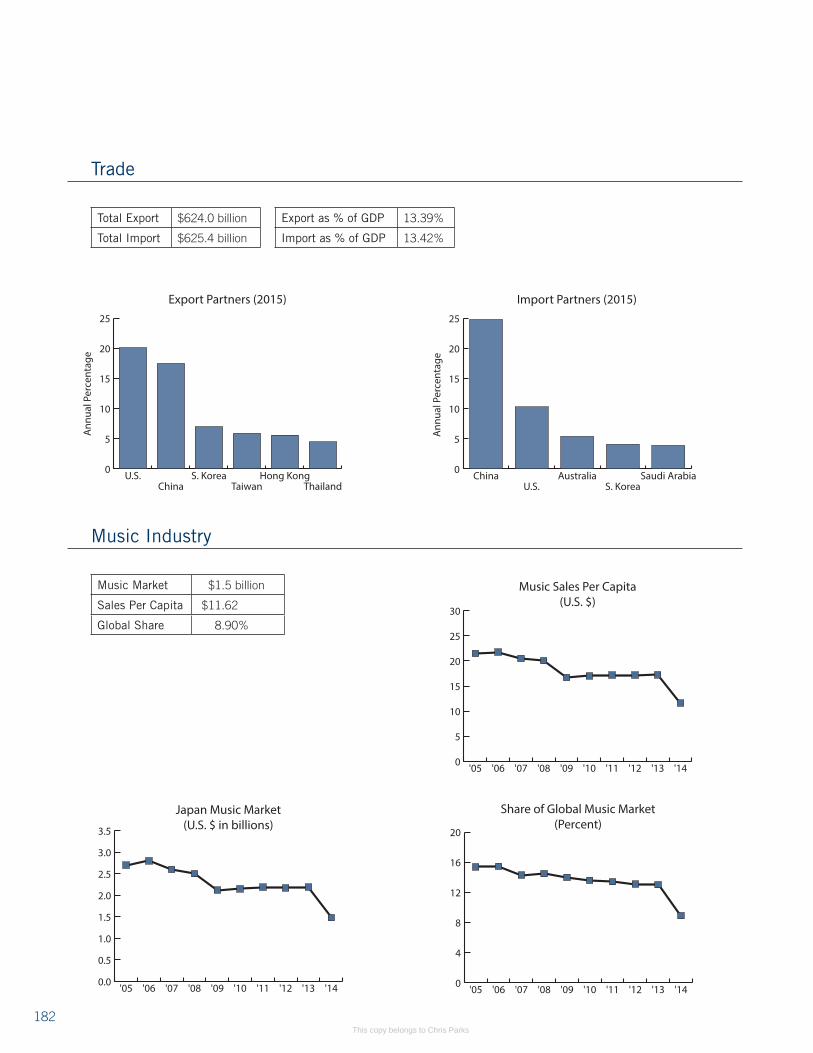
0
5
10
15
20
25
ThailandHong Kong
TaiwanS. Korea
ChinaU.S.
Export Partners (2015)
Ann
ual P
erce
ntag
e
0
5
10
15
20
25
Saudi ArabiaS. Korea
AustraliaU.S.
China
Import Partners (2015)
Ann
ual P
erce
ntag
e
0
5
10
15
20
25
30
'14'13'12'11'10'09'08'07'06'05
Music Sales Per Capita(U.S. $)
0.0
0.5
1.0
1.5
2.0
2.5
3.0
3.5
'14'13'12'11'10'09'08'07'06'05
Japan Music Market(U.S. $ in billions)
0
4
8
12
16
20
'14'13'12'11'10'09'08'07'06'05
Share of Global Music Market(Percent)
Trade
Music Industry
Total Export $624.0 billion Export as % of GDP 13.39%
Total Import $625.4 billion Import as % of GDP 13.42%
Music Market $1.5 billion
Sales Per Capita $11.62
Global Share 8.90%
182This copy belongs to Chris Parks

International DataJapan
0.0
0.3
0.6
0.9
1.2
1.5
1.8
'15'14'13'12'11'10'09'08'07'06
Acoustic GuitarsDomestic Sales
0
100
200
300
400
500
600
700
800
'04'03'02'01'00'99'98'97'96
Uni
ts x
1,0
00
Value Units
0
10
20
30
40
50
60
'15'14'13'12'11'10'09'08'07'06
Valu
e in
bill
ions
of Y
en
0
1
2
3
4
5
6
7
8
'15'14'13'12'11'10'09'08'07'06
Electric GuitarsDomestic Sales
0
20
40
60
80
100
120
140
'04'03'02'01'00'99'98'97'96
Uni
ts x
1,0
00
Value Units
0
20
40
6080
100
120
140
'15'14'13'12'11'10'09'08'07'06
Valu
e in
bill
ions
of Y
en
Japan Domestic Sales and Exports(Note regarding the export data: The knockdown production and intermediary trade data are not included starting in 2010)
0
1
2
3
4
5
6
7
8
9
'15'14'13'12'11'10'09'08'07'06
Total GuitarsDomestic Sales
0
25
50
75
100
125
150
175
'04'03'02'01'00'99'98'97'96
Uni
ts X
1,0
00
Value Units
0
25
50
75
100
125
150
175
'15'14'13'12'11'10'09'08'07'06
Valu
e in
bill
ions
of Y
en
0
2
4
6
8
10
12
'15'14'13'12'11'10'09'08'07'06
Total GuitarsExports
0
100
200
300
400
500
600
700
800
900
'04'03'02'01'00'99'98'97'96
Uni
ts x
1,0
00
Value Units
0
100
200
300
400
500
600
700
800
900
'15'14'13'12'11'10'09'08'07'06
Valu
e in
bill
ions
of Y
en
0
1
2
3
4
5
6
'15'14'13'12'11'10'09'08'07'06
Acoustic GuitarsExports
0
100
200
300
400
500
600
700
800
'04'03'02'01'00'99'98'97'96
Uni
ts x
1,0
00
Value Units
0
100
200
300
400
500
600700
800
'15'14'13'12'11'10'09'08'07'06
Valu
e in
bill
ions
of Y
en
0
1
2
3
4
5
6
7
8
'15'14'13'12'11'10'09'08'07'06
Electric GuitarsExports
0
50
100
150
200
250
300
'04'03'02'01'00'99'98'97'96
Uni
ts x
1,0
00
Value Units
0
50
100
150
200
250
300
'15'14'13'12'11'10'09'08'07'06
Valu
e in
bill
ions
of Y
en
183This copy belongs to Chris Parks

0
3
6
9
12
15
18
'15'14'13'12'11'10'09'08'07'06
Total Acoustic PianosDomestic Sales
0
5
10
15
20
25
30
35
'04'03'02'01'00'99'98'97'96
Uni
ts x
1,0
00
Value Units
0
5
10
15
20
25
30
'15'14'13'12'11'10'09'08'07'06
Valu
e in
bill
ions
of Y
en
0
5
10
15
20
25
30
35
'15'14'13'12'11'10'09'08'07'06
Total Acoustic PianosExports
0
20
40
60
80
100
120
140
160
'04'03'02'01'00'99'98'97'96
Valu
e in
mill
ions
of Y
en
Uni
ts x
1,0
00
Value Units
0
20
40
60
80
100
120
140
160
'15'14'13'12'11'10'09'08'07'06
0
1
2
3
4
5
6
7
8
9
'15'14'13'12'11'10'09'08'07'06
Grand PianosDomestic Sales
0
1
2
3
4
5
6
7
8
9
'04'03'02'01'00'99'98'97'96
Uni
ts x
1,0
00
Value Units
0
1
23
4
5
6
78
9
'15'14'13'12'11'10'09'08'07'06
Valu
e in
bill
ions
of Y
en
0
2
4
6
8
10
'15'14'13'12'11'10'09'08'07'06
Upright PianosDomestic Sales
0
10
20
30
40
50
60
70
80
90
'04'03'02'01'00'99'98'97'96
Uni
ts x
1,0
00
Value Units
0
5
10
15
20
25
'15'14'13'12'11'10'09'08'07'06
Valu
e in
bill
ions
of Y
en
0
3
6
9
12
15
'15'14'13'12'11'10'09'08'07'06
Upright PianosExports
Uni
ts x
1,0
00
Value Units
0
20
40
60
80
100
120
'15'14'13'12'11'10'09'08'07'06
Valu
e in
bill
ions
of Y
en
0
4
8
12
16
20
'15'14'13'12'11'10'09'08'07'06
Grand PianosExports
0
5
10
15
20
25
30
'04'03'02'01'00'99'98'97'96
Uni
ts x
1,0
00
Value Units
0
5
10
15
20
25
30
'15'14'13'12'11'10'09'08'07'06
Valu
e in
bill
ions
of Y
en
Japan Domestic Sales and Exports
184This copy belongs to Chris Parks

International DataJapan
0.0
0.5
1.0
1.5
2.0
2.5
'15'14'13'12'11'10'09'08'07'06
Electronic KeyboardsDomestic Sales
0
50
100
150
200
250
300
'04'03'02'01'00'99'98'97'96
Uni
ts x
1,0
00
Value Units
0
50
100
150
200
250300
'15'14'13'12'11'10'09'08'07'06
Valu
e in
bill
ions
of Y
en
0
5
10
15
20
25
'15'14'13'12'11'10'09'08'07'06
Electronic KeyboardsExports
0.0
0.2
0.4
0.6
0.8
1.0
1.2
1.4
'04'03'02'01'00'99'98'97'96
Uni
ts x
1,0
00,0
00
Value Units
0.0
0.2
0.4
0.6
0.8
1.0
1.2
1.4
'15'14'13'12'11'10'09'08'07'06
Valu
e in
bill
ions
of Y
en
0
10
20
30
40
50
60
70
80
90
'15'14'13'12'11'10'09'08'07'06
Total Electronic InstrumentsExports
0.0
0.5
1.0
1.5
2.0
2.5
3.0
'04'03'02'01'00'99'98'97'96
Uni
ts x
1,0
00,0
00
Value Units
0.0
0.5
1.0
1.5
2.0
2.5
3.0
'15'14'13'12'11'10'09'08'07'06
Valu
e in
bill
ions
of Y
en
0
5
10
15
20
25
30
'15'14'13'12'11'10'09'08'07'06
Total Electronic InstrumentsDomestic Sales
Uni
ts x
1,0
00
Value Units
0
100
200
300
400
500
600
700
800
'15'14'13'12'11'10'09'08'07'06
Valu
e in
bill
ions
of Y
en
0
2
4
6
8
10
12
14
'15'14'13'12'11'10'09'08'07'06
Electric PianosDomestic Sales
Uni
ts x
1,0
00
Value Units
0
25
50
75
100
125
150
175
200
225
'15'14'13'12'11'10'09'08'07'06
Valu
e in
bill
ions
of Y
en
0
5
10
15
20
25
'15'14'13'12'11'10'09'08'07'06
Electric PianosExports
Uni
ts x
1,0
00
Value Units
0
50
100
150
200
250
300
350
400
'15'14'13'12'11'10'09'08'07'06
Valu
e in
bill
ions
of Y
en
Japan Domestic Sales and Exports
185This copy belongs to Chris Parks

Japan Domestic Sales and Exports
0
1
2
3
4
5
6
7
'15'14'13'12'11'10'09'08'07'06
Brass InstrumentsExports
0102030405060708090100
'04'03'02'01'00'99'98'97'96
Uni
ts x
1,0
00
Value Units
0102030405060708090100
'15'14'13'12'11'10'09'08'07'06
Valu
e in
bill
ions
of Y
en
0
1
2
3
4
5
6
7
'15'14'13'12'11'10'09'08'07'06
Woodwind InstrumentsDomestic Sales
0
10
20
30
40
50
60
'04'03'02'01'00'99'98'97'96
Uni
ts x
1,0
00
Value Units
0
10
20
30
40
50
60'15'14'13'12'11'10'09'08'07'06
Valu
e in
bill
ions
of Y
en
0.0
0.5
1.0
1.5
2.0
2.5
3.0
'15'14'13'12'11'10'09'08'07'06
Brass InstrumentsDomestic Sales
0
5
10
15
20
25
'04'03'02'01'00'99'98'97'96
Uni
ts x
1,0
00
Value Units
0
5
10
15
20
25
'15'14'13'12'11'10'09'08'07'06
Valu
e in
bill
ions
of Y
en
0.0
0.5
1.0
1.5
2.0
2.5
3.0
3.5
'15'14'13'12'11'10'09'08'07'06
Stringed InstrumentsDomestic Sales
Uni
ts x
1,0
00
Value Units
0
25
50
75
100
125
'15'14'13'12'11'10'09'08'07'06
Valu
e in
bill
ions
of Y
en
0
1
2
3
4
5
6
7
'15'14'13'12'11'10'09'08'07'06
Stringed InstrumentsExports
0
100
200
300
400
500
600
700
800
'04'03'02'01'00'99'98'97'96
Uni
ts x
1,0
00
Value Units
0
100
200
300
400
500
600
700
800
'15'14'13'12'11'10'09'08'07'06
Valu
e in
bill
ions
of Y
en
0
2
4
6
8
10
12
14
'15'14'13'12'11'10'09'08'07'06
Woodwind InstrumentsExports
Uni
ts x
1,0
00
Value Units
0
50
100
150
200
250
'15'14'13'12'11'10'09'08'07'06
Valu
e in
bill
ions
of Y
en
186This copy belongs to Chris Parks

International DataJapan
0
1
2
3
4
5
6
7
'15'14'13'12'11'10'09'08'07'06
PercussionExports
Valu
e in
bill
ions
of Y
en
Uni
ts x
1,0
00
Value Units
0
100
200
300
400
500
600
700
'15'14'13'12'11'10'09'08'07'06
0
20
40
60
80
100
120
140
160
'15'14'13'12'11'10'09'08'07'06
Total Exports
0
1
2
34
5
6
7
8
9
'04'03'02'01'00'99'98'97'96
Uni
ts x
1,0
00,0
00
Value Units
0
1
23
4
5
6
78
9
'15'14'13'12'11'10'09'08'07'06
Valu
e in
bill
ions
of Y
en
Japan Domestic Sales and Exports
0
2
4
6
8
10
'15'14'13'12'11'10'09'08'07'06
Total Wind InstrumentsDomestic Sales
0
10
20
30
40
50
60
70
80
'04'03'02'01'00'99'98'97'96
Uni
ts x
1,0
00
Value Units
0
10
20
30
40
50
60
70
80
'15'14'13'12'11'10'09'08'07'06
Valu
e in
bill
ions
of Y
en
0
4
8
12
16
20
'15'14'13'12'11'10'09'08'07'06
Total Wind InstrumentsExports
Uni
ts x
1,0
00
Value Units
0
50
100
150
200
250
300
350
'15'14'13'12'11'10'09'08'07'06
Valu
e in
bill
ions
of Y
en
0
1
2
3
4
'15'14'13'12'11'10'09'08'07'06
PercussionDomestic Sales
0
25
50
75
100
125
150
175
'04'03'02'01'00'99'98'97'96
Valu
e in
bill
ions
of Y
en
Uni
ts x
1,0
00
Value Units
0
25
50
75
100
125
150
175
'15'14'13'12'11'10'09'08'07'060
10
20
30
40
50
60
70
'15'14'13'12'11'10'09'08'07'06
Total Domestic Sales
0.0
0.5
1.0
1.5
2.0
2.5
3.0
3.5
4.0
'04'03'02'01'00'99'98'97'96
Uni
ts x
1,0
00,0
00
Value Units
0.0
0.5
1.0
1.52.0
2.5
3.0
3.5
4.0
'15'14'13'12'11'10'09'08'07'06
Valu
e in
bill
ions
of Y
en
187This copy belongs to Chris Parks

MEXICO
Overall, the market has further dropped in comparison to 2014, something many of us did not believe could happen. The end consumer is still being very cautious. Major retail chains have reported decreases in their sales, which is similar to our market.
The Mexican peso devaluated against the U.S. dollar more than 30% in a 12-month period. The official inflation rate is in the 3–5% range. The real inflation for consumer goods is more than 10%. This is due to many factors, but the exchange rate is mainly to blame.
Dealers continue to focus on low-priced instruments that are of lower quality. This creates for some a problem of liquidity and ability to pay fixed costs associated with their stores. When we consider that spending has dropped even further during the first quarter of the year, dealers are struggling to pay operational costs. Credit terms have also increased by more than 90–120 days. In some cases, that amount of time is not enough to cover payments to suppliers.
Some local state elections will again draw in potential spending to some music programs and hopefully guarantee support from some voters.
Safety issues continue to be a big problem in some areas of the country. The various drug cartels fight over territories and create a negative flow of tourists (even in popular tourist spots). The Mexican economy gets more than 8% from tourist spending. This in turn also affects our industry, since fewer bands will be playing in bars and clubs.
While the main focus is on Brazil in Latin America, Mexico has escaped from the spotlight and the various cases of corruption and lack of leadership by politicians. No clear improvement or intentions to changes are seen in the future. The U.S. elections also could impact our economy in the future, which generate speculation about future trade. Mexico’s major industry is now car manufacturing, and the biggest consumer is the United States.
Commentary by Thomas Veerkamp, Marketing Director of Casa Veerkamp, SA de CV
DOING BUSINESS IN MEXICO
Market OverviewTop Five Reasons Why U.S. Companies Should Consider Exporting to Mexico
• Location, location, location — the country is literally right next door and has well-developed supply chains.
• NAFTA has eliminated most tariffs, reduced paperwork for exporting to Mexico, and increased demand for U.S. goods and services.
• Mexico continues to experience strong economic growth.
ME
XICO
mexico
188This copy belongs to Chris Parks

International DataMexico
• Recent economic reforms have liberalized key sectors such as energy and telecommunications.
• Close cultural, social, and economic ties make Mexico a natural market to consider for first-time and expanding exporters.
The North American Free Trade Agreement (NAFTA), which was enacted in 1994 and created a free trade zone for Mexico, Canada and the United States, is the most important feature in the U.S.-Mexico bilateral commercial relationship. Mexico is the United States’ third largest trading partner and second largest export market for U.S. products. U.S-Mexico bilateral trade in goods increased from US$88 billion in 1993, the year prior to the implementation of NAFTA, to US$535 billion in 2014, an increase of 508%, or 9.8% per year. Negotiations are now underway for the Trans-Pacific Partnership (TPP), with U.S. and Mexican participation. The two countries seek to boost economic growth by increasing exports in a region that includes some of the world’s most robust economies and that represents more than 40% of global trade. The TPP presents an opportunity to go beyond NAFTA. With the recent passage of Trade Promotion Authority by the U.S. Congress, President Obama hopes to complete the TPP this year. In May 2013, President Obama and Mexican President Peña Nieto announced the High Level Economic Dialogue (HLED), which was launched by Vice President Biden and his Mexican counterparts on September 20, 2013, in Mexico City. The HLED involves several government agencies from the United States and Mexico that are working together to promote competitiveness and connectivity; foster economic growth, productivity and innovation; and partner for regional and global leadership. Within the framework of the HLED, our governments are working in conjunction with the private sector to identify and reduce barriers to trade between our two countries and to increase opportunities for both U.S. and Mexican companies in our two markets. To further HLED efforts to promote entrepreneurship, stimulate innovation, and encourage the development of human capital to meet the needs of the 21st-century economy, Presidents Obama and Peña Nieto also announced a Bilateral Forum on Higher Education, Innovation, and Research (FOBESII), which was officially launched in May 2014. Through the Bilateral Forum, both governments are seeking to expand student, scholar and teacher exchanges; increase joint research in areas of mutual interest; and share best practices in higher education and innovation. In 2013, the two presidents also announced the creation of the Mexico-U.S. Entrepreneurship and Innovation Council (MUSEIC). The council is composed of seven subcommittees, providing a legal framework for programs that encourage innovative entrepreneurship, promote women’s entrepreneurship, exchange best practices on technology commercialization, and engage entrepreneurs among the Latin American diaspora residing in the United States, supporting entrepreneurs of small and medium-sized businesses, developing regional innovation clusters, and sharing best practices on financing high-impact entrepreneurship. Mexico, a stable democracy, is the most populated Spanish-speaking country in the world. Its population of over 120 million people is 79% urban. Ten percent of the population is
mexico
189This copy belongs to Chris Parks

considered wealthy and about 45% live in poverty, earning less than US$10 per day. The remaining 45% of the population is considered middle class. Mexico has a very young population with a median age of 27. It offers a large market with a GDP of approximately US$1.26 trillion with a 2014 estimated per capita income of US$17,900 (World Bank figures show US$10,300 without purchasing parity). With a shared Western and Hispanic culture, U.S. producers may find it straightforward to market and sell their services and products in Mexico. There is a large installed base of manufacturing in a wide range of sectors. Mexico’s GDP growth slowed from a strong average of 4.3% between 2010 and 2012 to 1.1% in 2013, and improved slightly to 2.1% in 2014. The World Bank estimates GDP growth to strengthen from 2.9% in 2015 to 3.5% in 2017, with growth overall strongly tied the U.S. economy and world oil prices. In 2013 and 2014, Mexico passed sweeping reforms in the energy, telecom, labor, financial and education sectors. All of these are positioning Mexico to increase its competitiveness. The energy and telecom reforms offer a multitude of new opportunities for U.S. firms. Market ChallengesMexico’s size and diversity are often underappreciated by U.S. exporters. It can be difficult to find a single distributor or agent to cover this vast market. Also, the Mexican legal system differs in fundamental ways from the U.S. system, so U.S. firms should consult with competent legal counsel before entering into any business agreements with Mexican partners. The banking system in Mexico has shown signs of growth after years of stagnation, but interest rates remain relatively high. In particular, small and medium-sized enterprises (SMEs) find it difficult to obtain financing at reasonable rates despite Mexican government efforts to increase capital for SMEs. U.S. companies need to conduct thorough due diligence before entering into business with a Mexican firm, and should be conservative in extending credit and alert to payment delays. As one element in a prudent due diligence process, the U.S. Commercial Service offices in Mexico can conduct background checks on potential Mexican partners. U.S. companies should assist Mexican buyers to explore financing options, including Export-Import Bank programs. Mexican customs regulations, product standards, and labor laws may present pitfalls for U.S. companies. U.S. Embassy commercial, agricultural, intellectual property rights, standards, and labor officers are available to counsel firms about regulations that affect their particular export product or business interest. Continued violence involving criminal organizations has created insecurity in parts of Mexico, including some border areas. For more detailed information, it is strongly recommended that prior to travel to Mexico, you consult the Department of State’s Travel Warning website.
Market OpportunitiesAbundant market opportunities for U.S. firms exist in Mexico; US$580 billion in trade in goods and services crosses the U.S.-Mexico border every year — almost US$1.6 billion every day between the two countries. Mexico’s current administration came into office in December 2012 for a six-year term. In April 2014, President Peña Nieto announced a
mexico
mexico
190This copy belongs to Chris Parks
International DataMexico
consolidated National Infrastructure Plan. The plan focuses on major sectors: transportation, water, energy, health, urban development, communications and tourism with an anticipated total investment of US$586 billion through 2018. As these projects develop, opportunities to participate in major projects, subcontracts and sales to the federal government will grow.
Mexico’s geographic proximity to the United States has propelled the maquiladora industry near the U.S.-Mexico border. This phenomenon and other global economic factors are providing U.S. businesses with increasing alternatives to Asia-based manufacturing and opportunities to sell into regional supply chains. Labor rates are competitive with China, and a robust logistics network allows rapid transport of goods to U.S. consumers.
Some of Mexico’s most promising sectors include agriculture; agribusiness; auto parts and services; education services; energy; environmental technology; franchising; housing and construction; packaging equipment; plastics and resins; security and safety equipment and services; information technology sectors; transportation infrastructure equipment and services; and travel and tourism services. However, given the size of the Mexican market, there are numerous other promising prospects, including food processing equipment, as well as architectural and engineering services. If an industry is not explicitly mentioned as a “best prospect,” it does not necessarily mean that there are not ample opportunities in the Mexican market.
Market-Entry StrategiesTo do business in Mexico, it is crucial to develop and maintain close relationships with clients and partners. Mexicans prefer direct communication such as telephone calls or face-to-face meetings. Email, however, is widely used and social media apps are increasingly popular for quick interactions. Mexican companies are extremely price conscious, seek financing options, tend to desire exclusive agreements, and value outstanding service and flexibility. U.S. firms wishing to export to Mexico will find a variety of market-entry strategies. Mexican consumers can be quite sophisticated, yet a large portion of the population is price sensitive. Due in large part to the proximity to the United States, popular U.S. brands are quite familiar in Mexico and often distributed through a variety of channels. Many factors help determine the best strategy, such as the product/service, logistics and customs, distribution, marketing, direct or indirect sales, exporting experience and language proficiency, among others.
“Doing Business in Mexico” article is provided by the U.S. Commercial Service, the trade promotion arm of the U.S. Department of Commerce’s International Trade Administration. For more information on doing business in Mexico, you may visit their website at www.export.gov/Mexico.
The following charts are based on import and export data obtained from the website of the International Trade Centre (ITC)
mexico
191This copy belongs to Chris Parks

Demographics
65+6.8%
0–1427.6%
15–6465.6%
Economy
GDP-Industry34.1%
GDP-Agriculture3.5%
GDP-Service62.4%
Population in millions 121.7
Median Age 27.6Population Growth 1.18%
0.0
0.5
1.0
1.5
2.0
2.5
'15'14'13'12'11'10'09'08'07'06'05'04
Mexico GDP (PPP)(U.S. $ in trillions)
0
1
2
3
4
5
6
'15'14'13'12'11'10'09'08'07'06'05'04
Unemployment Rate(Percent)
0
1
2
3
4
5
6
7
'15'14'13'12'11'10'09'08'07'06'05'04
In�ation (Annual Percent Rate)
MEXICO SNAPSHOT
Demographics
Economy
Age Male Female
0–14 17.18 16.41
15–64 38.83 41.07
65 & Over 3.71 4.54
GDP (PPP) $2.22 trillion
GDP Per Capita $18,500
GDP-Real Growth Rate 2.30%
Unemployment Rate 4.50%
Inflation 2.70%
Data Source: Demographics, Economy and Trade from CIA World Factbook, Music Industry from The Music Trades. GDP (PPP): Gross Domestic Product based on purchasing-power-parity (PPP) valuation of country GDP in U.S. dollars.
192This copy belongs to Chris Parks

International DataMexico Snapshot
0
10
20
30
40
50
60
70
80
90
CanadaU.S.
Export Partners (2015)
Ann
ual P
erce
ntag
e
0
10
20
30
40
50
JapanChinaU.S.
Import Partners (2015)
Ann
ual P
erce
ntag
e
Music Sales Per Capita(U.S. $)
0.0
0.2
0.4
0.6
0.8
1.0
1.2
1.4
1.6
1.8
'14'13'12'11'10'09'08'07'06'05
Mexico Music Market(U.S. $ in millions)
0
25
50
75
100
125
150
175
200
'14'13'12'11'10'09'08'07'06'05
Trade
Music Industry
Share of Global Music Market(Percent)
0.0
0.2
0.4
0.6
0.8
1.0
1.2
1.4
'14'13'12'11'10'09'08'07'06'05
Total Export $430.9 billion Export as % of GDP 19.41%
Total Import $434.8 billion Import as % of GDP 19.59%
Music Market $192.0 million
Sales Per Capita $1.58
Global Share 1.20%
193This copy belongs to Chris Parks

0
5
10
15
20
25
30
35
40
45
'15'14'13'12'11'10'09'08'07'06
Fretted & Stringed InstrumentsExports
Valu
e in
U.S
. $ m
illio
ns
Export Value
0
5
10
15
20
25
30
35
40
'15'14'13'12'11'10'09'08'07'06
KeyboardsExports
Valu
e in
U.S
. $ m
illio
ns
Export Value
Mexico Imports and Exports
0.0
0.5
1.0
1.5
2.0
2.5
3.0
3.5
4.0
4.5
'15'14'13'12'11'10'09'08'07'06
Acoustic PianosImports
Valu
e in
U.S
. $ m
illio
ns
Import Value
0
200
400
600
800
1000
1200
1400
'15'14'13'12'11'10'09'08'07'06
Acoustic PianosExports
Valu
e in
U.S
. $ th
ousa
nds
Export Value
0
2
4
6
8
10
'15'14'13'12'11'10'09'08'07'06
Fretted & Stringed InstrumentsImports
Valu
e in
U.S
. $ m
illio
ns
Import Value
0
5
10
15
20
25
30
'15'14'13'12'11'10'09'08'07'06
KeyboardsImports
Valu
e in
U.S
. $ m
illio
ns
Import Value
194This copy belongs to Chris Parks

International DataMexico
Mexico Imports and Exports
0
1
2
3
4
5
'15'14'13'12'11'10'09'08'07'06
PercussionExports
Valu
e in
U.S
. $ m
illio
ns
Export Value
0
5
10
15
20
25
'15'14'13'12'11'10'09'08'07'06
AccessoriesImports
Valu
e in
U.S
. $ m
illio
ns
Import Value
0
2
4
6
8
10
12
'15'14'13'12'11'10'09'08'07'06
PercussionImports
Valu
e in
U.S
. $ m
illio
ns
Import Value
0
2
4
6
8
10
12
'15'14'13'12'11'10'09'08'07'06
Wind InstrumentsImports
Valu
e in
U.S
. $ m
illio
ns
Import Value
0
20
40
60
80
100
'15'14'13'12'11'10'09'08'07'06
Wind InstrumentsExports
Valu
e in
U.S
. $ th
ousa
nds
Export Value
0
4
8
12
16
20
'15'14'13'12'11'10'09'08'07'06
AccessoriesExports
Valu
e in
U.S
. $ m
illio
ns
Export Value
195This copy belongs to Chris Parks

DOING BUSINESS IN THE NETHERLANDS
Market Overview• The partnership between the United States and the Netherlands is the former’s
oldest continuous relationship and dates back to the American Revolution.
• The Netherlands is a geographically small (approximately the size of the state of Maryland), densely populated (17 million people) country occupying a highly strategic commercial location, with Europe’s largest port, making it the “Gateway to Europe.”
• Over 170 million consumers (roughly one-third of the population of the expanded European Union of 28 member states) reside within a 300-mile radius of Rotterdam.
• More than 60% of the Netherlands’ GDP is generated by foreign trade in goods and services.
• The Netherlands is a key center within the global business network, with an advanced infrastructure geared toward the transportation of goods, people and electronic data.
• Its core distribution points include Rotterdam, Europe’s largest port, and Amsterdam Schiphol Airport, the fourth largest in Europe.
• The Netherlands has capitalized on its location and advanced economy to become one of the top dozen trading countries in the world.
• It is currently ranked 18th in GDP in the world, ninth in imports of goods and services from the United States, and third in direct investment in the United States.
The United States is the largest foreign investor in the Netherlands and has its largest bilateral trade surplus with this country (US$22.9 billion in 2014).
Various international surveys rank the Netherlands among the industrialized nations with the most competitive economies and most favorable business and investment climates. The World Economic Forum (WEF) Global Competitiveness Index places the Netherlands in seventh position among the world’s most competitive economies. The Economist Intelligence Unit (EIU) ranks the country 16th in its 2014 global business environment ranking for the period up to 2018.
Top Five Reasons Why U.S. Companies Should Consider Exporting to the Netherlands1. It is the ideal European starting point for new-to-export companies looking for their
first European distributor.
2. The country has an affluent, pro-U.S. population with a high opinion of U.S. products, and the highest level of English language fluency on the continent.
NE
THE
RLA
ND
S
netherlands
196This copy belongs to Chris Parks

International DataNetherlands
3. The Netherlands features an innovative business community hungry for high-quality, new products.
4. It has the best logistics and distribution networks in Europe.
5. The Netherlands is the country with the best links to the rest of Europe, and beyond.
The European Union continues to endure a serious economic crisis involving sovereign debt and the banking system, but there is evidence of a recovery. While the sovereign debt crisis has been focused on only a few euro-area members, it has become a serious issue for the entire 18-member euro area, including the Netherlands. Significant mechanisms have been adopted in order to deal with the crisis, including two major lending facilities.
Market Challenges• Except for EU-wide impediments, there are no significant trade barriers.
• Because of the size, accessibility and competitive nature of the Dutch market, importers usually insist on an exclusive distributorship.
• Exporters may need to adapt their products and documentation for the Dutch market.
Market OpportunitiesEuropean Union rules have opened public procurement to U.S. firms, and there may be attractive opportunities for U.S. companies to participate in the renewal of the Dutch transport infrastructure.
A rule of thumb is that products selling well in the U.S. market will generally have market potential in the Netherlands.
Market-Entry Strategies• The Dutch market is highly competitive; the “golden key” of customary business is
courtesy, especially replying promptly to requests for price quotes and to orders.
• Dutch business executives are generally more conservative than their U.S. counterparts; therefore, it is best to refrain from using first names until a firm relationship has been formed.
• Friendship and mutual trust are highly valued, and once trust has been earned, a productive working relationship can usually be counted upon.
• Dutch buyers appreciate quality and service and are also interested in delivery price. Care must be taken to assure that delivery dates will be met and that after-sales service will be promptly honored.
• U.S. exporters should maintain close liaison with distributors and customers to exchange information. Understanding developed through periodic personal visits is the best way to keep distributors apprised of new developments and to resolve problems quickly.
netherlands
197This copy belongs to Chris Parks

• U.S. exporters should consider warehousing in the Netherlands for speedy supply and service to their Dutch and European customers.
• A vigorous and sustained promotion is often needed to launch products because buying habits are generally strong. Products must be adapted to both technical requirements and to consumer preferences. It is not sufficient to merely label a product in conformity to national requirements for the development of the full market potential. Consumers must also be attracted to the product by its ease of use as well as by its label and packaging.
• Most Dutch speak their minds and will not waste your time or their own if they are not interested in your product.
“Doing Business in the Netherlands” article is provided by the U.S. Commercial Service, the trade promotion arm of the U.S. Department of Commerce’s International Trade Administration. For more information on doing business in the Netherlands, you may visit their website at www.export.gov/Netherlands.
The following charts are based on import and export data obtained from the website of the International Trade Centre (ITC)
netherlands
198This copy belongs to Chris Parks

International DataNetherlands Snapshot
Demographics
0–1416.7%
65+18.0%
15–6465.3%
Economy
GDP-Industry18.8%
GDP-Agriculture1.6%
GDP-Service79.6%
Population in millions 16.9
Median Age 42.3Population Growth 0.41%
0
100
200
300
400
500
600
700
800
900
'15'14'13'12'11'10'09'08'07'06'05'04
Netherlands GDP (PPP)(U.S. $ in billions)
0
1
2
3
4
5
6
7
8
9
'15'14'13'12'11'10'09'08'07'06'05'04
Unemployment Rate(Percent)
0.0
0.5
1.0
1.5
2.0
2.5
3.0
'15'14'13'12'11'10'09'08'07'06'05'04
In�ation (Annual Percent Rate)
NETHERLANDS SNAPSHOT
Demographics
Economy
Age Male Female
0–14 1.45 1.38
15–64 5.56 5.50
65 & Over 1.37 1.67
GDP (PPP) $831.4 billion
GDP Per Capita $49,300
GDP-Real Growth Rate 1.80%
Unemployment Rate 6.90%
Inflation 0.30%
Data Source: Demographics, Economy and Trade from CIA World Factbook, Music Industry from The Music Trades. GDP (PPP): Gross Domestic Product based on purchasing-power-parity (PPP) valuation of country GDP in U.S. dollars.
199This copy belongs to Chris Parks

0
5
10
15
20
25
30
ItalyFranceU.K.BelgiumGermany
Export Partners (2015)
Ann
ual P
erce
ntag
e
0
3
6
9
12
15
U.K.U.S.BelgiumChinaGermany
Import Partners (2015)
Ann
ual P
erce
ntag
e
Music Sales Per Capita(U.S. $)
0
2
4
6
8
10
12
14
'14'13'12'11'10'09'08'07'06'05
Netherlands Music Market(U.S. $ in millions)
0
50
100
150
200
250
'14'13'12'11'10'09'08'07'06'05
Trade
Music Industry
Share of Global Music Market(Percent)
0.0
0.2
0.4
0.6
0.8
1.0
1.2
1.4
'14'13'12'11'10'09'08'07'06'05
Total Export $488.3 billion Export as % of GDP 58.73%
Total Import $404.6 billion Import as % of GDP 48.66%
Music Market $179.0 million
Sales Per Capita $10.56
Global Share 1.10%
200This copy belongs to Chris Parks

International DataNetherlands
Netherlands Imports and Exports
0
10
20
30
40
50
60
70
80
'15'14'13'12'11'10'09'08'07'06
Fretted & Stringed InstrumentsExports
Valu
e in
U.S
. $ m
illio
ns
Export Value
0
25
50
75
100
125
150
175
200
'15'14'13'12'11'10'09'08'07'06
KeyboardsExports
Valu
e in
U.S
. $ m
illio
ns
Export Value
0
3
6
9
12
15
18
'15'14'13'12'11'10'09'08'07'06
Acoustic PianosImports
Valu
e in
U.S
. $ m
illio
ns
Import Value
0.0
0.5
1.0
1.5
2.0
2.5
3.0
3.5
4.0
4.5
'15'14'13'12'11'10'09'08'07'06
Acoustic PianosExports
Valu
e in
U.S
. $ m
illio
ns Export Value
0
10
20
30
40
50
60
'15'14'13'12'11'10'09'08'07'06
Fretted & Stringed InstrumentsImports
Valu
e in
U.S
. $ m
illio
ns
Import Value
0
20
40
60
80
100
120
140
'15'14'13'12'11'10'09'08'07'06
KeyboardsImports
Valu
e in
U.S
. $ m
illio
ns
Import Value
201This copy belongs to Chris Parks

Netherlands Imports and Exports
0
5
10
15
20
25
30
35
40
45
'15'14'13'12'11'10'09'08'07'06
PercussionExports
Valu
e in
U.S
. $ m
illio
ns
Export Value
0
10
20
30
40
50
60
'15'14'13'12'11'10'09'08'07'06
AccessoriesExports
Valu
e in
U.S
. $m
illio
ns
Export Value
0
2
4
6
8
10
12
'15'14'13'12'11'10'09'08'07'06
Wind InstrumentsImports
Valu
e in
U.S
. $ m
illio
ns
Import Value
0
1
2
3
4
5
6
'15'14'13'12'11'10'09'08'07'06
Wind InstrumentsExports
Valu
e in
U.S
. $ m
illio
ns Export Value
0
5
10
15
20
25
'15'14'13'12'11'10'09'08'07'06
PercussionImports
Valu
e in
U.S
. $ m
illio
ns
Import Value
0
5
10
15
20
25
'15'14'13'12'11'10'09'08'07'06
AccessoriesImports
Valu
e in
U.S
. $ m
illio
ns
Import Value
202This copy belongs to Chris Parks

International DataNorway
DOING BUSINESS IN NORWAY
Market Overview• Norway is a modern, energy-rich country with 5.2 million people.
• Norway is considered one of the world’s wealthiest countries, with a Gross National Income (GNI) per capita exceeding US$102,000 and GDP per capita based on purchasing power parities (PPP) exceeding US$67,000, ranked second among OECD countries in 2014.
• Norway’s external financial position is exceptionally strong from a global perspective and the country has an important stake in promoting a liberal environment for foreign trade.
• The country is richly endowed with natural resources—petroleum, hydropower, fish, forests and minerals—and is highly dependent on the petroleum sector.
• Norway is the world’s third largest exporter of natural gas and tenth largest exporter of crude oil. Its large merchant shipping fleet is one of the most modern among maritime nations and ranked the fifth largest by value. Other major industries, such as offshore shipping, shipbuilding, fishing and fish farming, information technology, pulp and paper products, and light metals processing, have prospered as well.
• Incomes are also more evenly distributed, making every person a consumer. Unemployment rates are still low, but edging up to 4%, and interest rates are low.
• The Norwegian economy features a combination of free-market activity and government intervention. The government controls key areas, such as the vital petroleum sector, through large-scale state enterprises.
• Norway is located in northern Europe and is a part of the Scandinavian Peninsula. Jan Mayen and the Arctic archipelago of Svalbard are also part of Norwegian territory.
• The majority of the country shares a border to the east with Sweden; its northernmost region is bordered by Finland to the south and Russia to the east and Denmark lies south of its southern tip across the Skagerrak Strait. Norway’s extensive coastline is facing the North Atlantic Ocean and the Barents Sea.
• With its population covering 323,802 square kilometers, Norway is one of the most sparsely populated countries in Europe; spread across a nearly 1,600–mile-long, narrow and mountainous country with a coastline that’s 10 times its length.
• Norway is a vibrant, stable democracy.
• The majority of Norwegians are fluent in English and many have very close cultural and family ties to the United States.
• Norwegian business ethics are similar to those of the United States.
NO
RW
AY
203This copy belongs to Chris Parks

• Norway is not a member of the European Union (EU), but is linked to the EU through the European Economic Area (EEA) agreement. By virtue of the EEA, Norway is practically part of the EU’s single market, except in fisheries and agriculture.
• Norway is part of the Schengen Agreement, which guarantees free movement of persons and the absence of internal border control between 22 of the 28 EU Member States, as well as Norway, Iceland, Switzerland and Liechtenstein. All passport controls between these Schengen countries have been abolished.
Market Challenges• The overall economic and trade relationship is strong, and Norway’s import climate
is generally open and receptive to U.S. products and investments, although the agriculture sector is well protected through trade barriers.
• The domestic market is small, but the country can serve as an attractive base for business operations in the Nordic, Baltic, and/or western Russian markets.
Market Opportunities• U.S. companies have excellent opportunities to capture a significant share of new
contract awards in Norway’s offshore oil and gas, renewable energy, information technologies, shipping and maritime, defense, healthcare, and travel and tourism, and consumer goods sectors.
• The Transatlantic Trade and Investment Partnership (TTIP) is an ambitious, comprehensive and high-standard trade and investment agreement being negotiated between the United States. and the European Union (EU). Regulatory changes and standards that may be introduced as a part of TTIP will have direct consequences for Norway and other European Free Trade Association (EFTA) countries, and Norway is interested in finding a mechanism to participate.
Market-Entry Strategy• U.S. exporters seeking general export information and assistance or country-specific
commercial information should consult with their nearest Export Assistance Center or the U.S. Department of Commerce’s website: www.export.gov.
“Doing Business in Norway” article is provided by the U.S. Commercial Service, the trade promotion arm of the U.S. Department of Commerce’s International Trade Administration. For more information on doing business in Norway, you may visit their website at www.export.gov/Norway.
The following charts are based on import and export data obtained from the website of the International Trade Centre (ITC)
norway
204This copy belongs to Chris Parks

International DataNorway Snapshot
Demographics
65+16.3%
0–1418.1%
15–64 65.6%
Economy
GDP-Industry38.9%
GDP-Agriculture1.7%
GDP-Service59.4%
Population in millions 5.2
Median Age 39.1Population Growth 1.13%
0
50
100
150
200
250
300
350
400
'15'14'13'12'11'10'09'08'07'06'05'04
Norway GDP (PPP)(U.S. $ in billions)
0
1
2
3
4
5
'15'14'13'12'11'10'09'08'07'06'05'04
Unemployment Rate(Percent)
0.0
0.5
1.0
1.5
2.0
2.5
3.0
3.5
4.0
'15'14'13'12'11'10'09'08'07'06'05'04
In�ation (Annual Percent Rate)
NORWAY SNAPSHOT
Demographics
Economy
Age Male Female
0–14 0.48 0.46
15–64 1.75 1.66
65 & Over 0.39 0.46
GDP (PPP) $352.8 billion
GDP Per Capita $68,400
GDP-Real Growth Rate 0.90%
Unemployment Rate 4.40%
Inflation 2.00%
Data Source: Demographics, Economy and Trade from CIA World Factbook, Music Industry from The Music Trades. GDP (PPP): Gross Domestic Product based on purchasing-power-parity (PPP) valuation of country GDP in U.S. dollars.
205This copy belongs to Chris Parks

0
5
10
15
20
25
BelgiumSweden
FranceNetherlands
GermanyU.K.
Export Partners (2015)
Ann
ual P
erce
ntag
e
0
2
4
6
8
10
12
14
DenmarkU.S.
U.K.China
GermanySweden
Import Partners (2015)
Ann
ual P
erce
ntag
e
Music Sales Per Capita(U.S. $)
0
4
8
12
16
20
'14'13'12'11'10'09'08'07'06'05
Norway Music Market(U.S. $ in millions)
0
10
20
30
40
50
60
70
80
90
'14'13'12'11'10'09'08'07'06'05
Trade
Music Industry
Share of Global Music Market(Percent)
0.0
0.1
0.2
0.3
0.4
0.5
0.6
'14'13'12'11'10'09'08'07'06'05
Total Export $106.2 billion Export as % of GDP 30.10%
Total Import $71.9 billion Import as % of GDP 20.38%
Music Market $74.8 million
Sales Per Capita $14.36
Global Share 0.40%
206This copy belongs to Chris Parks

International DataNorway
Norway Imports and Exports
0
100
200
300
400
500
'15'14'13'12'11'10'09'08'07'06
Fretted & Stringed InstrumentsExports
Valu
e in
U.S
. $ th
ousa
nds
Export Value
0
50
100
150
200
250
300
350
400
'15'14'13'12'11'10'09'08'07'06
KeyboardsExports
Valu
e in
U.S
. $ th
ousa
nds
Export Value
0
1
2
3
4
5
6
7
8
'15'14'13'12'11'10'09'08'07'06
Acoustic PianosImports
Valu
e in
U.S
. $ m
illio
ns
Import Value
0
25
50
75
100
125
150
175
200
'15'14'13'12'11'10'09'08'07'06
Acoustic PianosExports
Valu
e in
U.S
. $ th
ousa
nds
Export Value
0
1
2
3
4
5
6
7
8
9
'15'14'13'12'11'10'09'08'07'06
Fretted & Stringed InstrumentsImports
Valu
e in
U.S
. $ m
illio
ns
Import Value
0
4
8
12
16
20
'15'14'13'12'11'10'09'08'07'06
KeyboardsImports
Valu
e in
U.S
. $ m
illio
ns
Import Value
207This copy belongs to Chris Parks

Norway Imports and Exports
0
20
40
60
80
100
120
140
'15'14'13'12'11'10'09'08'07'06
PercussionExports
Valu
e in
U.S
. $ th
ousa
nds
Export Value
0
200
400
600
800
1000
'15'14'13'12'11'10'09'08'07'06
AccessoriesExports
Valu
e in
U.S
. $ th
ousa
nds
Export Value
0
2
4
6
8
10
'15'14'13'12'11'10'09'08'07'06
Wind InstrumentsImports
Valu
e in
U.S
. $ m
illio
ns
Import Value
0
50
100
150
200
250
300
350
'15'14'13'12'11'10'09'08'07'06
Wind InstrumentsExports
Valu
e in
U.S
. $ th
ousa
nds
Export Value
0.00.51.01.52.02.53.03.54.04.55.0
'15'14'13'12'11'10'09'08'07'06
PercussionImports
Valu
e in
U.S
. $ m
illio
ns
Import Value
0
3
6
9
12
15
'15'14'13'12'11'10'09'08'07'06
AccessoriesImports
Valu
e in
U.S
. $ m
illio
ns
Import Value
208This copy belongs to Chris Parks

International Data
RU
SS
IA
DOING BUSINESS IN RUSSIA
Market OverviewCurrent Political Situation The recent events in Ukraine have changed the landscape of the bilateral trade and investment relationship between the United States and Russia. Russia’s provocative actions, including its purported annexation of Crimea and destabilizing activities in southeastern Ukraine, have forced the United States and others in the international community to impose sanctions on Russian individuals, companies and financial institutions. The United States has suspended government-to-government economic cooperation with Russia on many fronts, including our bilateral trade and investment working group that sought to expand economic and commercial ties. Within these parameters, U.S. companies can still export their goods and services to Russia and continue working with their Russian partners to sustain their position in this market. However, companies should continuously monitor any developments concerning the United States’ political and economic relationship with Russia. Market ChallengesRussia is the largest country in the world, spanning 11 time zones and encompassing over 17 million square miles. Seriously underdeveloped infrastructure poses logistical challenges, especially in accessing markets outside of major cities. Conducting business might be impeded by burdensome regulatory regimes; inadequate Intellectual Property Rights (IPR) protection and enforcement; widespread corruption and inadequate rule of law; inconsistent application of laws and regulations; lack of transparency; and a non-level playing field for competition due to the continued presence of large state-owned or -controlled enterprises dominating strategic sectors of the economy. Investments in the wide-ranging and ever-changing list of “strategic sectors” of the Russian economy are subject to Russian government control. As of January 1, 2015, representative offices of foreign companies may apply through a fast-track simplified procedure for obtaining work visas and work permits for their foreign employees who are classified as Highly Qualified Foreign Specialists (the “HQFS”). The requirements for applying through the HQFS procedure are the same as those for employers that are a Russian commercial legal entity or a branch. Requirements vary depending on the job, salary level and skill set of the foreign employee. Rules on secondment of employees should be scrutinized for an individual company’s situation. The Russian immigration and visa system requires time and patience for business travelers to obtain necessary permissions to do business in Russia. Travel must occur within the dates specified on the visa.
Russia
209This copy belongs to Chris Parks

English is not widely spoken, although knowledge of the language is expanding, especially in the major cities.
Market OpportunitiesWith a vast landmass, extensive natural resources, more than 142 million consumers and acute infrastructure needs, Russia remains a promising market for U.S. exporters. Russia is the world’s eighth largest economy by nominal gross domestic product (GDP) and the sixth largest by purchasing power parity (PPP), as cited by the International Monetary Fund. According to the World Bank, 2014 GPP per capita GDP was US$13,210, the highest of the BRICS countries (Brazil, Russia, India, China and South Africa). Russia is a high-income country, with a highly educated and trained workforce and sophisticated, discerning consumers. Although Russia recovered quickly from the global financial crisis in 2009, economic growth slowed substantially subsequently, and GDP is expected to contract in 2015. In terms of trade in goods, Russia was the United States’ 29th largest export market and the 20th largest exporter to the country in 2014. Russia was the United States’ 25th largest trading partner overall. U.S. exports to Russia in 2014 were US$10.8 billion, a decrease of 3.3% from 2013. Russian exports to the U.S. in 2014 were US$23.7 billion, a decrease of 12.5% from 2013. Russia’s leading individual trading partners are China, the Netherlands, Germany, Italy, Turkey, Japan, the United States, Ukraine, South Korea and Poland. Stocks of U.S. investment in Russia through 2013 were approximately US$18 billion. The United States is Russia’s 10th largest foreign investor. Russia joined the World Trade Organization (WTO) in August 2012. Congress also enacted legislation to extend permanent normal trade relations to Russia in the same year. Russia’s membership in the WTO has the potential to create opportunities for U.S. exports and investments. U.S. manufacturers and exporters should have more certain and predictable access to the Russian market, because of Russia’s commitment not to raise tariffs on any products above the negotiated rates. For industrial and consumer goods, Russia’s average bound tariff rate declined from almost 10% to under 8%. For American businesses, Russia’s accession to the WTO also provides the following benefits, although Russia has been slow to fulfill many of its WTO obligations:
• More liberal treatment for service exports and service providers
• Stronger commitments for protection and enforcement of IPR
• Rules-based treatment of agricultural exports
russia
russia
210This copy belongs to Chris Parks

International DataRussia
• Market access under country-specific tariff-rate quotas
• Improved transparency in trade-related rule-making
• More effective WTO dispute-resolution mechanisms
Market-Entry Strategies• Expect to commit significant time, personnel and capital, as developing business in
Russia is resource-intensive for those companies that believe opportunities in Russia outweigh risks.
• Conduct significant due diligence, such as with the U.S. Commercial Service’s International Company Profile service, to ascertain the reliability of business partners.
• Consult with U.S. companies already in the market, as well as with the U.S. Commercial Service and business organizations such as the American Chamber of Commerce in Russia and the U.S.-Russia Business Council.
• Communicate regularly with Russian business partners to ensure common understanding of expectations.
• Travel frequently to Russia in order to establish and maintain relationships with partners and to understand changing market conditions.
• Maintain a long-term time frame.
“Doing Business in Russia” article is provided by the U.S. Commercial Service, the trade promotion arm of the U.S. Department of Commerce’s International Trade Administration. For more information on doing business in Russia, you may visit their website at www.export.gov/Russia.
The following charts are based on import and export data obtained from the website of the International Trade Centre (ITC)
russia
211This copy belongs to Chris Parks

Demographics
65+13.6%
0–1416.7%
15–6469.7%
Economy
GDP-Industry35.9%
GDP-Agriculture4.4%
GDP-Service59.7%
Population in millions 142.4
Median Age 39.1Population Growth -0.04%
0.0
0.5
1.0
1.5
2.0
2.5
3.0
3.5
4.0
'15'14'13'12'11'10'09'08'07'06'05'04
Russia GDP (PPP)(U.S. $ in trillions)
0
2
4
6
8
10
12
'15'14'13'12'11'10'09'08'07'06'05'04
Unemployment Rate(Percent)
0
2
4
6
8
10
12
14
16
'15'14'13'12'11'10'09'08'07'06'05'04
In�ation (Annual Percent Rate)
RUSSIA SNAPSHOT
Demographics
Economy
Age Male Female
0–14 12.20 11.56
15–64 47.72 51.56
65 & Over 5.98 13.41
GDP (PPP) $3.47 trillion
GDP Per Capita $23,700
GDP-Real Growth Rate –3.90%
Unemployment Rate 5.40%
Inflation 15.40%
Data Source: Demographics, Economy and Trade from CIA World Factbook, Music Industry from The Music Trades. GDP (PPP): Gross Domestic Product based on purchasing-power-parity (PPP) valuation of country GDP in U.S. dollars.
212This copy belongs to Chris Parks

International DataRussia Snapshot
0
2
4
6
8
10
12
14
TurkeyGermany
ItalyChina
Netherlands
Export Partners (2015)
Ann
ual P
erce
ntag
e
0
2
4
6
8
10
12
14
16
18
UkraineBelarus
ItalyU.S.
GermanyChina
Import Partners (2015)
Ann
ual P
erce
ntag
e
Music Sales Per Capita(U.S. $)
0.0
0.4
0.8
1.2
1.6
2.0
'14'13'12'11'10'09'08'07'06'05
Russia Music Market(U.S. $ in millions)
0
50
100
150
200
250
300
'14'13'12'11'10'09'08'07'06'05
Trade
Music Industry
Share of Global Music Market(Percent)
0.0
0.2
0.4
0.6
0.8
1.0
1.2
1.4
1.6
'14'13'12'11'10'09'08'07'06'05
Total Export $337.8 billion Export as % of GDP 9.73%
Total Import $197.3 billion Import as % of GDP 5.69%
Music Market $125.0 million
Sales Per Capita $0.88
Global Share 0.80%
213This copy belongs to Chris Parks

Russia Imports and Exports
0
40
80
120
160
200
'15'14'13'12'11'10'09'08'07'06
Fretted & Stringed InstrumentsExports
Valu
e in
U.S
. $ th
ousa
nds
Export Value
0
50
100
150
200
250
300
350
'15'14'13'12'11'10'09'08'07'06
KeyboardsExports
Valu
e in
U.S
. $ th
ousa
nds
Export Value
0
5
10
15
20
25
'15'14'13'12'11'10'09'08'07'06
Acoustic PianosImports
Valu
e in
U.S
. $ m
illio
ns
Import Value
0
10
20
30
40
50
60
70
80
90
'15'14'13'12'11'10'09'08'07'06
Acoustic PianosExports
Valu
e in
U.S
. $ th
ousa
nds
Export Value
0
4
8
12
16
20
'15'14'13'12'11'10'09'08'07'06
Fretted & Stringed InstrumentsImports
Valu
e in
U.S
. $ m
illio
ns
Import Value
0
10
20
30
40
50
60
'15'14'13'12'11'10'09'08'07'06
KeyboardsImports
Valu
e in
U.S
. $ m
illio
ns
Import Value
214This copy belongs to Chris Parks

International DataRussia
Russia Imports and Exports
0
25
50
75
100
125
'15'14'13'12'11'10'09'08'07'06
PercussionExports
Valu
e in
U.S
. $ th
ousa
nds
Export Value
0
10
20
30
40
50
60
70
'15'14'13'12'11'10'09'08'07'06
AccessoriesExports
Valu
e in
U.S
. $ th
ousa
nds
Export Value
0
1
2
3
4
5
6
7
8
9
'15'14'13'12'11'10'09'08'07'06
Wind InstrumentsImports
Valu
e in
U.S
. $ m
illio
ns
Import Value
0
200
400
600
800
1000
1200
'15'14'13'12'11'10'09'08'07'06
Wind InstrumentsExports
Valu
e in
U.S
. $ th
ousa
nds
Export Value
0.0
0.5
1.0
1.5
2.0
2.5
3.0
3.5
4.0
'15'14'13'12'11'10'09'08'07'06
PercussionImports
Valu
e in
U.S
. $ m
illio
ns
Import Value
0
1
2
3
4
5
6
7
8
9
'15'14'13'12'11'10'09'08'07'06
AccessoriesImports
Valu
e in
U.S
. $ m
illio
ns
Import Value
215This copy belongs to Chris Parks
SO
UTH
KO
RE
A
DOING BUSINESS IN SOUTH KOREA
Market OverviewIt has been over three years since the Korea-U.S. Free Trade Agreement (KORUS) went into force on March 15, 2012, becoming our nation’s largest FTA since NAFTA. The Agreement is expected to increase U.S. exports to Korea by approximately US$10–12 billion.
Total 2011 U.S.-Korea trade exceeded US$100 billion for the first time ever, also surpassing that mark in 2012, 2013 and 2014. Total U.S. exports to Korea in 2014 exceeded US$44.5 billion.
Korea is the United States’ seventh largest export market. The United States is the third largest exporter to Korea, with an 8.6% market share of Korea’s total imports. Key competitors include China (17.1%), Japan (10.2%) and the EU’s 28 nations (16.2%). Trade with China reflects significant re-export activity.
Korea’s projected 2015 GDP growth forecast is 3.1%, according to the Bank of Korea. Its commercial banks maintain strong reserves, in case of a possible global slowdown or difficulties within the Euro Zone.
Korea will continue to focus its development on key economic growth sectors. Patents, trademarks and industrial designs issued by the Korea Intellectual Property Office (KIPO) reached 434,000 in 2014, a 0.9% increase from 2013. This growing trend in local patent and trademark filings reflects a move toward more technology-intensive and capital-intensive industries and services.
Market ChallengesUnique industry standards, less-than-transparent regulations, pressures to reduce prices and contract negotiations continue to affect U.S. business in Korea. However, firms that are innovative, patient and exhibit a commitment to the Korean market generally find business to be rewarding and Koreans to be loyal customers. With the implementation of KORUS, Korea’s attractiveness as a market should continue to improve. U.S. products will become increasingly cost-competitive, and bilateral trade should increase over time. EU products have had reduced or zero-tariff access to this market since mid-2011. Australia and Canada have also concluded Free Trade Agreements (FTA) with Korea.
U.S. SMEs must remain flexible and ready to work with Korean business counterparts as it pertains to amending contract terms or renegotiating price, quantity and delivery terms, following a business deal or bilateral contractual agreement. In Korea, the principal of “consideration,” as is the case in English law, is not present. In other words, a request to amend an offer or to restart negotiations with a counteroffer likely will not include any payment for consideration on the Korean side. Koreans feel that the signing of a contract is only the beginning of a business relationship.
U.S. exporters of agricultural commodities also face market challenges related to import regulations and testing requirements.
south korea
216This copy belongs to Chris Parks

International DataSouth Korea
Market OpportunitiesThe US$1 trillion Korean economy is heavily weighted toward international trade. Trade accounts for a whopping 90% of Korean GDP. As the country continues to move toward more technology-intensive industries, U.S. companies will find market opportunities in leading industries such as life sciences (medical devices, pharmaceuticals and biotechnology), industrial chemicals, IT, nanotechnology, aerospace/defense, energy, environmental technology and transportation, to name a few. U.S. companies are already partnering with local Korean companies and industries to expand market opportunities from Korea to third-country markets, including ASEAN, the Middle East and other markets of the Asia-Pacific. Given Korea’s strong shipping and air cargo infrastructure, this is not only a market endpoint for U.S. goods and services, but also a hub for expansion into other markets.
As one example, the Korean security and safety sector has not offered great opportunities for U.S. companies over the last 7–10 years. However, during 2014, President Park Geun-hye initiated numerous safety and security reforms and initiatives, which even included the complete reformulation of Korea’s Coast Guard. In late 2014, under the purview of the National Emergency Management Agency (NEMA), Korea announced the development of a large (US$200 million) firefighting and disaster-training facility. This facility will be designed to be one of the largest and most comprehensive in Asia.
Market-Entry Strategies• A local presence is essential for success. Retain a manufacturer’s representative,
distributor or name a registered trading company as an agent or establish a branch sales office.
• Establishing and maintaining a strong business relationship is essential. Companies should visit Korea frequently to cultivate contacts and to better understand business conditions.
“Doing Business in South Korea” article is provided by the U.S. Commercial Service, the trade promotion arm of the U.S. Department of Commerce’s International Trade Administration. For more information on doing business in South Korea, you may visit their website at www.export.gov/SouthKorea.
The following charts are based on import and export data obtained from the website of the International Trade Centre (ITC)
south korea
217This copy belongs to Chris Parks

Demographics
65+13.0%
0–1413.7%
15–6473.3%
Economy
GDP-Industry38.0%
GDP-Agriculture2.3%
GDP-Service59.7%
Population in millions 49.1
Median Age 40.8Population Growth 0.14%
0.0
0.4
0.8
1.2
1.6
2.0
'15'14'13'12'11'10'09'08'07'06'05'04
South Korea GDP (PPP)(U.S. $ in trillions)
0
1
2
3
4
5
'15'14'13'12'11'10'09'08'07'06'05'04
Unemployment Rate(Percent)
0
1
2
3
4
5
'15'14'13'12'11'10'09'08'07'06'05'04
In�ation (Annual Percent Rate)
SOUTH KOREA SNAPSHOT
Demographics
Economy
Age Male Female
0–14 3.49 3.23
15–64 18.40 17.60
65 & Over 2.66 3.73
GDP (PPP) $1.85 trillion
GDP Per Capita $36,700
GDP-Real Growth Rate 2.70%
Unemployment Rate 3.50%
Inflation 0.70%
Data Source: Demographics, Economy and Trade from CIA World Factbook, Music Industry from The Music Trades. GDP (PPP): Gross Domestic Product based on purchasing-power-parity (PPP) valuation of country GDP in U.S. dollars.
218This copy belongs to Chris Parks

International DataSouth Korea Snapshot
0
5
10
15
20
25
30
SingaporeHong Kong
JapanU.S.
China
Export Partners (2015)
Ann
ual P
erce
ntag
e
0
2
4
6
8
10
12
14
16
18
QatarSaudi Arabia
U.S.Japan
China
Import Partners (2015)
Ann
ual P
erce
ntag
e
Music Sales Per Capita(U.S. $)
0
1
2
3
4
5
6
7
'14'13'12'11'10'09'08'07'06'05
South Korea Music Market(U.S. $ in millions)
0
50
100
150
200
250
300
350
400
'14'13'12'11'10'09'08'07'06'05
Trade
Music Industry
Share of Global Music Market(Percent)
0.0
0.5
1.0
1.5
2.0
2.5
'14'13'12'11'10'09'08'07'06'05
Total Export $535.5 billion Export as % of GDP 28.95%
Total Import $430.8 billion Import as % of GDP 23.29%
Music Market $299.0 million
Sales Per Capita $6.09
Global Share 1.80%
219This copy belongs to Chris Parks

South Korea Imports and Exports
0
2
4
6
8
10
12
14
'15'14'13'12'11'10'09'08'07'06
Acoustic PianosExports
Valu
e in
U.S
. $ m
illio
ns Export Value
0
10
20
30
40
50
60
70
80
90
'15'14'13'12'11'10'09'08'07'06
KeyboardsExports
Valu
e in
U.S
. $ m
illio
ns
Export Value
0
5
10
15
20
25
30
35
40
'15'14'13'12'11'10'09'08'07'06
Fretted & Stringed InstrumentsImports
Valu
e in
U.S
. $ m
illio
ns
Import Value
0
5
10
15
20
25
30
'15'14'13'12'11'10'09'08'07'06
Fretted & Stringed InstrumentsExports
Valu
e in
U.S
. $ m
illio
ns
Export Value
0
5
10
15
20
25
30
35
40
'15'14'13'12'11'10'09'08'07'06
Acoustic PianosImports
Valu
e in
U.S
. $ m
illio
ns
Import Value
0
10
20
30
40
50
60
'15'14'13'12'11'10'09'08'07'06
KeyboardsImports
Valu
e in
U.S
. $ m
illio
ns
Import Value
220This copy belongs to Chris Parks

International DataSouth Korea
South Korea Imports and Exports
0.0
0.3
0.6
0.9
1.2
1.5
1.8
'15'14'13'12'11'10'09'08'07'06
PercussionExports
Valu
e in
U.S
. $ m
illio
ns
Export Value
0
20
40
60
80
100
'15'14'13'12'11'10'09'08'07'06
AccessoriesExports
Valu
e in
U.S
. $ m
illio
ns
Export Value
0
10
20
30
40
50
60
'15'14'13'12'11'10'09'08'07'06
Wind InstrumentsImports
Valu
e in
U.S
. $ m
illio
ns
Import Value
0.0
0.5
1.0
1.5
2.0
2.5
3.0
3.5
'15'14'13'12'11'10'09'08'07'06
Wind InstrumentsExports
Valu
e in
U.S
. $ m
illio
ns Export Value
0
2
4
6
8
10
12
14
'15'14'13'12'11'10'09'08'07'06
PercussionImports
Valu
e in
U.S
. $ m
illio
ns
Import Value
0
10
20
30
40
50
60
'15'14'13'12'11'10'09'08'07'06
AccessoriesImports
Valu
e in
U.S
. $ m
illio
ns
Import Value
221This copy belongs to Chris Parks

SPAIN
CLASSICAL GUITARSThe increase in sales that we began to see in 2014 continued in 2015. However, this increase in sales cannot be considered a market consolidation, as it occurs irregularly, with ups and downs in sales. The market is more active in low-priced and higher-priced products. The data indicate that sales increased in 2015 by 10% compared to 2014. In 2016, the same trend continues.
ACOUSTIC AND ELECTRIC GUITARSIn 2015, the Spanish market showed an increase of approximately 18% in terms of sales, of which 5% can be attributed to the difference in the exchange rate between the dollar and the euro. After several years of decreasing sales, this could indicate that the recession in this market segment has begun to subside. Acoustic guitars show the most growth, and sales of electric guitar accessories has also increased, but to a lesser extent. ACOUSTIC PERCUSSION AND DIGITAL PERCUSSION Sales in the percussion market recovered slightly throughout 2015. It is important to note that this recovery has been more apparent in the digital market than in the acoustic. We estimate that sales of digital percussion increased by about 8%, while in the acoustic market this recovery hardly reaches 5%. The outlook for 2016 continues to be one of improving sales, although these fluctuate and do not have a steady rhythm throughout the year. An important price slowdown is noted, which, accompanied by the higher cost of instruments, results in a visible and dangerous decline in profit margins. PIANOSThe piano market remains stable with a slight upward trend; it is important to note that in recent years the drop in sales was quite significant, and at this time recovery cannot yet be confirmed.
WOODWIND AND BRASSWINDIn the wind instrument market, sales have held steady throughout the past few years of crisis, and in recent years we have seen substantial growth of nearly 20%. Growth has been primarily in student instruments, with a gradual growth—albeit much less—in professional equipment. The Asian market is growing, but its prices are increasing and there is an overall growth of somewhat higher priced instruments, which could signify that the market has grown both in price and units. It is important to note that there is a significant slowdown of mid-range priced instruments (1,000 to 2,000 euros). Commentary by Juan Grecos, IC Delegate for COMUSICA, the Spanish Music Products Association, and Managing Director of Caprice, S.L.
SPA
IN
spain
222This copy belongs to Chris Parks

International DataSpain
DOING BUSINESS IN SPAIN
Market OverviewSpain, with a GDP of US$1.4 trillion and a population of 46.46 million people in 2014, is the fourth largest economy in the Eurozone. Its economy grew 1.8% in 2014, the first positive growth rate since 2007. Forecasts for 2015 surpass 3% growth. Record tourism and export levels, coupled with a revived domestic consumption, have helped drive the recovery.
After 15 years of solid GDP growth that made it the world’s ninth largest economy, Spain entered into a recession in the second quarter of 2008, from which it emerged in the third quarter of 2013. Responding to the crisis, the Popular Party (PP) government undertook major initiatives in 2012 to reduce the deficit and reform labor laws, public services and the financial sector. These reforms have made Spain much more competitive in comparison to costs in other European countries.
The crisis led to a dramatic rise in unemployment, which grew to more than 27% in 2013. As of March 2015, the unemployment rate had decreased slightly to 23.8%. Youth unemployment has remained stubbornly above 50%. While a recovery is clearly underway and the government projects 500,000 new jobs this year, economists forecast high unemployment will linger and not dip below 20% until 2016.
Spain has traditionally represented a significant export market. According to the U.S. Department of Commerce, U.S. exports of goods to Spain in 2014 amounted to US$10.11 billion. The actual U.S. export numbers to Spain are substantially higher than the reported numbers, since many of Spain’s imports from the United States arrive in Europe via ports of entry in other European countries. Services exports from the United States to Spain continue to be strong.
Spanish exports to the United States increased in 2014 to US$14.4 billion, up from US$11.7 billion in 2013.
As a member country of the European Union (EU), Spain adheres to EU legislation, as is the case of all member countries.
The government remains a strong supporter of the Transatlantic Trade and Investment Partnership (T-TIP).
Investment plays a key role in the bilateral economic relationship. Spain’s recovery has made it more attractive to foreign direct investment. The United States is the third largest investor in Spain. Spanish investments in the United States have increased substantially in recent years, making Spain the ninth largest investor in the United States.
It is estimated that U.S. firms in Spain employ over 163,000 people. These companies represent approximately 7% of the GDP. Most of the large U.S. names are present, many of which are in the industrial sector – automobiles, chemical factories, pharmaceutical, industrial machinery, etc. The presence of large, well-known foreign names serves as a catalyst for innumerable local providers and, in almost all cases, increases exports. More than 50% of Spanish exports are made by foreign multinationals located in Spain. U.S. investors also hold significant portfolio investments in shares of some of Spain’s largest companies.
spain
223This copy belongs to Chris Parks

Spain has also been investing abroad and is currently the ninth most important source of FDI into the United States, accounting for approximately 7.4% of Spanish outbound investment. Much of the investment has taken place in the past seven years, going from US$14 billion in 2006 to US$52 billion in 2013. U.S. subsidiaries of Spanish firms employed over 75,000 people in the United States in 2014, while contributing US$140 million worth of R&D and US$1.25 billion to U.S. exports that same year.
Spanish energy companies continue to invest heavily in the United States. The cutting-edge technology of major Spanish multinationals such as Abengoa, Gamesa, ACS, and Iberdrola has allowed them to successfully undertake multiple renewable-energy projects in numerous states (Abengoa currently has the world’s largest CSP solar plant in Arizona). Spanish wind- generation companies are in more than 20 U.S. states. Spain´s premier position in the construction and transportation sectors has also enabled Spanish companies to be in the front line for major infrastructure, railroad and metro projects throughout the country. The success of the larger Spanish multinationals is gradually attracting the interest of their service providers.
Spain is home to dozens of multinational companies, including five of the world’s 10 largest construction companies, Europe’s second largest phone company and Europe’s second largest bank. Major Spanish firms in the banking, telecommunications, and infrastructure and energy sectors have become global leaders. Procurement decisions for these companies continue to be made in Spain.
The auto equipment and parts sector is another leading sector, ranked the sixth largest in the world by turnover and the third largest in Europe. It is the second in terms of total vehicle production and is the 12th largest in the world.
Tourism has traditionally been one of Spain’s most important sectors. The country is the world´s third largest tourist destination, receiving almost 65 million foreign visitors in 2014. It ranks second in terms of receipts, following the United States. In terms of outbound travel, Spain offers excellent potential as a source of visitors to this country. It is currently the world’s 16th largest market for outbound travel to the United States, and the fifth largest in Europe.
With 1,864 miles of high-speed rail, Spain is second only to China in terms of high-speed train infrastructure. Madrid has high-speed train connections with 23 cities, making it the country with the most connections in Europe.
Wind energy is the third most important source of electrical generation in Spain after gas and nuclear. In 2014, it covered 25.3% of the electrical demand in the country. Spain is the fourth country in the world in terms of installed wind power after the United States, Germany and China. Installed wind capacity in Spain was 22,900 MW by the end of 2014. More than 30,000 people work in the sector. Spain is the world’s fifth largest wind technology exporter after Germany, China, Denmark and the United States. The industry exports technology worth over €2.4 billion (US$3 billion) per year.
spain
spain
224This copy belongs to Chris Parks

International Data
Market Challenges• Cost, financing terms and after-sales service are important competitive factors.
European exporters provide generous financing and extensive cooperative advertising, and most European governments support exporting with trade promotion events. Japanese and Chinese companies are also emerging as formidable competitors. Although U.S. products are well respected for their high level of technology and quality, American firms sometimes fall short of their competitors in flexibility on financing, adaptation of product design to local market needs, and assistance with marketing and after sales service.
• Delays in reimbursement. The EU revised legislation in 2010 to shorten payment delays. Spain enacted this legislation in July of the same year. Nonetheless, delays in reimbursement continue to represent a major problem, particularly in the public sector, although there were improvements in 2014.
• The economic downturn resulted in some companies being reluctant to commit to purchase or represent new products or services. However, due to the continuing economic recovery, and given that developing export sales or distribution channels takes time, export-ready U.S. firms are urged to explore opportunities in Spain and throughout the Eurozone.
Market Opportunities• Chemicals were the principal U.S. export to Spain in 2014, accounting for 28.6% of
total exports, followed by agricultural products (15.2%), transportation equipment (10.3%), and petroleum and coal products (7%). Primary U.S. exports to Spain have consistently included aircraft and associated parts and equipment, pollution control and water resources equipment, medical products and equipment, outbound travel and tourism, electric power systems, telecommunications equipment, automotive parts and supplies and pharmaceuticals. Other sectors offering good prospects include defense, security equipment, renewable energy equipment and services, e-commerce, and industrial machinery. The service sector is playing an increasingly important role in the Spanish economy (74.3%).
• Due to the macroeconomic reforms in the financial sector and labor laws, costs have dropped and productivity has increased in comparison to other major markets in the region. These reforms have sharply increased Spain’s competitiveness, making it a good market for entry not only into the European region but also for Latin America and Africa.
• Spanish firms are value-added partners for the Latin American and Caribbean market – their language and cultural skills are a key advantage for developing opportunities in the LAC region.
• With the lack of available credit in the Spanish market, ExIm Bank can now play a more active role in financing exports of U.S. products and services by financing Spanish buyers through loan guarantees. This tool is an attractive alternative for Spanish importers.
spain
Spain
225This copy belongs to Chris Parks

• Principal agricultural exports to Spain from the United States in 2014 included tree nuts, soybeans and products, coarse grains, fish products, distilled spirits, and forest products.
• Spain’s food, beverage and agricultural processing sectors have fared well in recent years despite the economic crisis, supported in part by increased exports. U.S. exports of ingredients and raw materials have great prospects in this environment.
• Principal Growth Sectors:• Seafood• Tree nuts• Consumer-oriented products• Food ingredients• Specialty foods
• Since June 1, 2012, the U.S.-EU Organic Equivalence Agreement is in place. Thus, products certified as organic for one market can be sold as organic in the other market. This partnership, in combination with the growing demand in the EU, is expected to open new opportunities for U.S exporters.
Market-Entry StrategiesThere are 17 autonomous communities in Spain with varying degrees of autonomy and cultural identity. A number of regional markets joined by the two hubs of Madrid and Barcelona make up the Spanish market. The majority of agents, distributors, foreign subsidiaries and government-controlled entities that comprise the economic power bloc of the country operate in these two hubs.
Spanish commercial procedures are in line with the rest of Western Europe, where price and value remain paramount. However, credit terms, marketing assistance and after-sales service are important factors in local purchase decisions. The use of credit to purchase consumer goods is widely accepted in Spain, particularly in the cities, with banks competing to offer coverage.
The Spanish government has eased regulations at all levels and increased incentives in an effort to attract foreign firms and investments. In recent years, investment incentives designed to reward investors for establishing manufacturing operations in less developed areas have dispersed some investment from the major hubs. Except for in a few cases, Spanish law permits foreign investment of up to 100% of equity. Unit labor costs have fallen dramatically over the last three years, and Spain has regained most of the competitiveness that it lost during the construction boom in terms of labor costs. However, despite changes in labor legislation, the law remains relatively inflexible.
Spaniards tend to be more formal in personal relations than Americans, but much less rigid than they were 10 years ago. The approach to doing business is similar to that of Italy or France. Professional attire is recommended.
spain
spain
226This copy belongs to Chris Parks

International Data
spain
Spain
In order to break into this market, there is no substitute for face-to-face meetings with Spanish business representatives. Spaniards expect a personal relationship with suppliers. It can be challenging to elicit a response to initial communication by phone or email. Direct mail campaigns generally yield meager results. Less than 30% of local managers are fluent in English.
Spaniards tend to be conservative in their buying habits. Recognized brands do well. Large government and private sector buyers appear more comfortable dealing with other large, established organizations, or with firms that are recognized as leaders within their sectors.
“Doing Business in Spain” article is provided by the U.S. Commercial Service, the trade promotion arm of the U.S. Department of Commerce’s International Trade Administration. For more information on doing business in Spain, you may visit their website at www.export.gov/Spain.
The following charts are based on import and export data obtained from the website of the International Trade Centre (ITC)
227This copy belongs to Chris Parks

Demographics
65+17.8%
0–1415.5%
15–6466.7%
Economy
GDP-Industry22.7%
GDP-Agriculture2.5%
GDP-Service74.8%
Population in millions 48.1
Median Age 42.0Population Growth 0.89%
0.0
0.2
0.4
0.6
0.8
1.0
1.2
1.4
1.6
1.8
'15'14'13'12'11'10'09'08'07'06'05'04
Spain GDP (PPP)(U.S. $ in trillions)
0
5
10
15
20
25
30
'15'14'13'12'11'10'09'08'07'06'05'04
Unemployment Rate(Percent)
-1
0
1
2
3
4
5
'15'14'13'12'11'10'09'08'07'06'05'04
In�ation (Annual Percent Rate)
SPAIN SNAPSHOT
Demographics
Economy
Age Male Female
0–14 3.83 3.61
15–64 16.30 15.86
65 & Over 3.64 4.90
GDP (PPP) $1.64 trillion
GDP Per Capita $35,200
GDP-Real Growth Rate 3.10%
Unemployment Rate 22.50%
Inflation -0.60%
Data Source: Demographics, Economy and Trade from CIA World Factbook, Music Industry from The Music Trades. GDP (PPP): Gross Domestic Product based on purchasing-power-parity (PPP) valuation of country GDP in U.S. dollars.
228This copy belongs to Chris Parks

International DataSpain Snapshot
0
2
4
6
8
10
12
14
16
18
U.K.ItalyPortugalGermanyFrance
Export Partners (2015)
Ann
ual P
erce
ntag
e
0
2
4
6
8
10
12
14
U.K.Netherlands
ChinaItaly
FranceGermany
Import Partners (2015)
Ann
ual P
erce
ntag
e
Music Sales Per Capita(U.S. $)
0
1
2
3
4
5
6
'14'13'12'11'10'09'08'07'06'05
Spain Music Market(U.S. $ in millions)
0
25
50
75
100
125
150
175
200
225
'14'13'12'11'10'09'08'07'06'05
Trade
Music Industry
Share of Global Music Market(Percent)
0.0
0.2
0.4
0.6
0.8
1.0
1.2
'14'13'12'11'10'09'08'07'06'05
Total Export $277.3 billion Export as % of GDP 16.91%
Total Import $298.3 billion Import as % of GDP 18.19%
Music Market $100.1 million
Sales Per Capita $2.08
Global Share 0.60%
229This copy belongs to Chris Parks

Spain Imports and Exports
0
5
10
15
20
25
30
35
'15'14'13'12'11'10'09'08'07'06
Fretted & Stringed InstrumentsExports
Valu
e in
U.S
. $ th
ousa
nds
Export Value
0
1
2
3
4
5
6
7
8
9
'15'14'13'12'11'10'09'08'07'06
KeyboardsExports
Valu
e in
U.S
. $ th
ousa
nds
Export Value
0.0
0.5
1.0
1.5
2.0
2.5
3.0
'15'14'13'12'11'10'09'08'07'06
Acoustic PianosExports
Valu
e in
U.S
. $ th
ousa
nds
Export Value
0
4
8
12
16
20
'15'14'13'12'11'10'09'08'07'06
Acoustic PianosImports
Valu
e in
U.S
. $ m
illio
ns
Import Value
0
3
6
9
12
15
'15'14'13'12'11'10'09'08'07'06
Fretted & Stringed InstrumentsImports
Valu
e in
U.S
. $ m
illio
ns
Import Value
0
5
10
15
20
25
30
35
40
45
'15'14'13'12'11'10'09'08'07'06
KeyboardsImports
Valu
e in
U.S
. $ m
illio
ns
Import Value
230This copy belongs to Chris Parks

International DataSpain
Spain Imports and Exports
0.0
0.3
0.6
0.9
1.2
1.5
1.8
'15'14'13'12'11'10'09'08'07'06
PercussionExports
Valu
e in
U.S
. $ th
ousa
nds
Export Value
0
1
2
3
4
5
6
7
8
'15'14'13'12'11'10'09'08'07'06
AccessoriesExports
Valu
e in
U.S
. $ m
illio
ns
Export Value
0
1
2
3
4
5
6
'15'14'13'12'11'10'09'08'07'06
Wind InstrumentsExports
Valu
e in
U.S
. $ th
ousa
nds
Export Value
0
5
10
15
20
25
30
'15'14'13'12'11'10'09'08'07'06
Wind InstrumentsImports
Valu
e in
U.S
. $ m
illio
ns
Import Value
0
3
6
9
12
15
'15'14'13'12'11'10'09'08'07'06
PercussionImports
Valu
e in
U.S
. $ m
illio
ns
Import Value
0
10
20
30
40
50
'15'14'13'12'11'10'09'08'07'06
AccessoriesImports
Valu
e in
U.S
. $ m
illio
ns
Import Value
231This copy belongs to Chris Parks

SW
ED
EN
DOING BUSINESS IN SWEDEN
Market Overview• Sweden has been one of the best fiscal performers since the start of the global
crisis in 2008. Whereas in 2007, government debt as a percentage of GDP was 45.3%, it had increased by 5.9 percentage points in 2014, reaching 51.2%. This was the smallest increase for OECD countries with available information where debt increased.
• The GDP in Sweden was worth US$570.59 billion in 2014. Sweden is the largest Nordic economy and represents a transparent, highly developed, sophisticated and diversified market with few barriers to entry.
• According to the World Economic Forum’s Global Information Technology Report 2014, Sweden ranks third in the world in the Networked Readiness Index.
• The Nordics rank among the top countries in WIPO’s 2014 Global Innovation Index (Sweden No. 3, Finland No. 4, Denmark No. 8, Norway No. 14 and Iceland No. 19).
• With export-oriented manufacturing, a diversified economy, competitive SMEs and budgetary discipline, Sweden ranks fifth on the IMD’s 2014 competitiveness ratings.
• More than 1,300 U.S. companies are present in Sweden, and Sweden is the top location in the Nordics for regional headquarters covering the Nordics and the Baltics.
• The United States and Sweden share strong ties in trade and investment. Annual U.S.-Swedish trade in goods and services is valued at an estimated US$25 billion, and cumulative bilateral investment is valued at more than US$62 billion.
• Major categories of U.S. exports to Sweden include aerospace/defense, automotive aftermarket, healthcare/life sciences, information technologies, safety/security, clean-tech and renewable energy.
• More American companies operate in Sweden than companies from any other foreign country, creating over 72,000 Swedish jobs.
• With strong historical, cultural and business ties to the United States, Sweden is a top European market for travel to the United States with about 440,000 visits annually, accounting for over US$1 billion of benefit to the U.S. economy.
Market Challenges• Facing strong competition from Swedish and third-country suppliers, U.S. exporters
must offer advanced technologies as well as competitive prices and terms.
• Sweden has a high cost of living with expensive labor and individual tax rates that are among the highest worldwide. A VAT rate of 25% applies to the import or sale of most products.
sweden
232This copy belongs to Chris Parks

International DataSweden
• Representing about 20% of Sweden’s GDP, public procurement at all levels is much higher than the EU average of 11%. Incorporating innovative products and services into the process remains a major systemic challenge.
Market Opportunities• Sweden has a long-established tradition of expertise in engineering, shipbuilding,
mining and the life sciences, making it a highly receptive market to new, advanced technologies.
• There is ongoing, strong demand for advanced technologies and products/services that improve productivity, including IT software and services that lower costs and improve business efficiencies, as well as equipment and services for safety/security, including cybersecurity.
• Driven by rapid, widespread adoption of smart devices, Sweden’s Internet economy is growing more than 10% annually and represents about 8% of total GDP.
• Since Swedes are early adopters of new technologies, Sweden is considered to be an ideal test market, albeit an expensive one.
• Green opportunities: Sweden’s commitment to sustainability across industry sectors drives market demand for U.S. products and services in renewable energy/low carbon/green technologies and energy efficiency.
• Sweden’s rapid developments in smart grid, bioenergy, cybersecurity and e-health make the country a critically important market for U.S. companies offering advanced technologies.
• English is widely spoken, and is the language used for business agreements.
Market-Entry Strategies• Demonstrate a clear competitive advantage (i.e., price, quality, branding).
• Pay close attention to both the obvious and subtle cultural differences between the United States and Sweden and adjust marketing strategies accordingly. The Swedish cultural philosophy of jantelagen eschews overt self-promotion and achievement as unworthy and inappropriate.
• Evaluate prospective partners carefully and choose an experienced, well-established distributor.
• Be flexible and adjust expectations to the scale of the market. Although Sweden is the size of California, its population is only 9.6 million
• Evaluate the potential for distributors to cover the entire Nordic region (total population in the Nordics is 25 million).
sweden
233This copy belongs to Chris Parks

• Depending on the industry sector, prospective business partners may be based in Stockholm, Gothenburg or Malmo or another Nordic city.
• Express commitment to the market with a long-term perspective. Visits are important since Nordic partners want firsthand assurance of a partner’s reliability and commitment.
“Doing Business in Sweden” article is provided by the U.S. Commercial Service, the trade promotion arm of the U.S. Department of Commerce’s International Trade Administration. For more information on doing business in Sweden, you may visit their website at www.export.gov/Sweden.
The following charts are based on import and export data obtained from the website of the International Trade Centre (ITC)sw
eden
234This copy belongs to Chris Parks
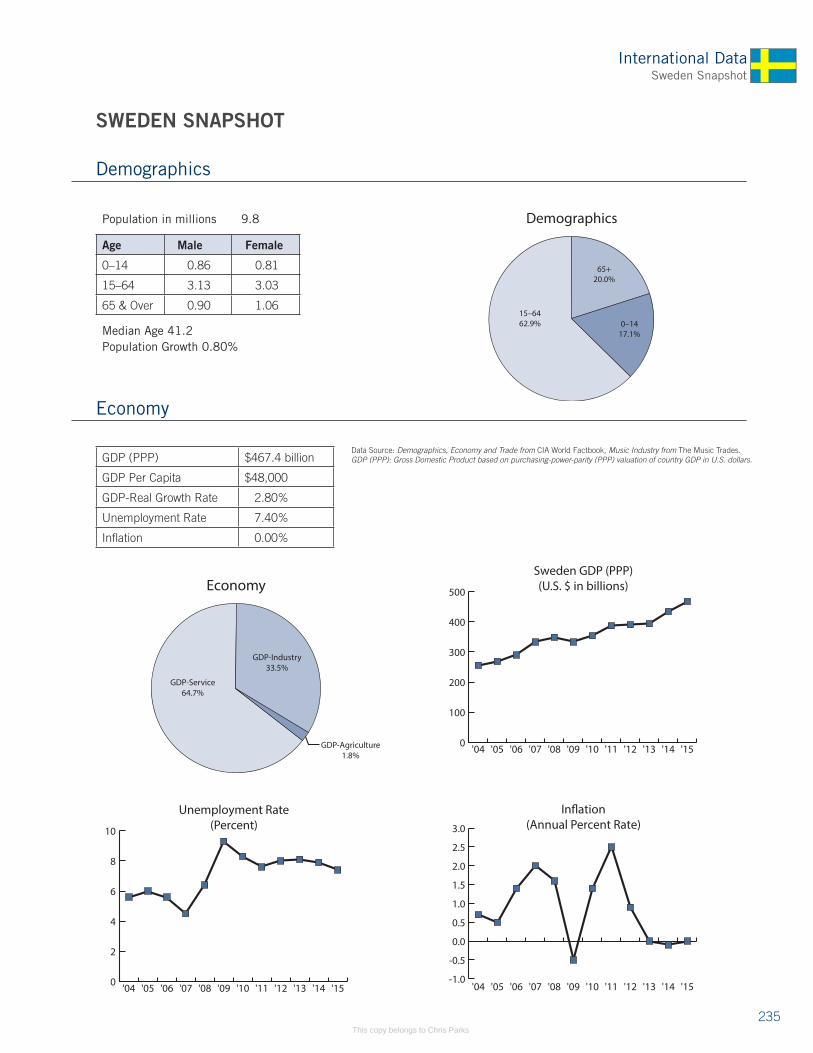
International DataSweden Snapshot
Demographics
65+20.0%
0–1417.1%
15–6462.9%
Economy
GDP-Industry33.5%
GDP-Agriculture1.8%
GDP-Service64.7%
Population in millions 9.8
Median Age 41.2 Population Growth 0.80%
0
100
200
300
400
500
'15'14'13'12'11'10'09'08'07'06'05'04
Sweden GDP (PPP)(U.S. $ in billions)
0
2
4
6
8
10
'15'14'13'12'11'10'09'08'07'06'05'04
Unemployment Rate(Percent)
-1.0
-0.5
0.0
0.5
1.0
1.5
2.0
2.5
3.0
'15'14'13'12'11'10'09'08'07'06'05'04
In�ation (Annual Percent Rate)
SWEDEN SNAPSHOT
Demographics
Economy
Age Male Female
0–14 0.86 0.81
15–64 3.13 3.03
65 & Over 0.90 1.06
GDP (PPP) $467.4 billion
GDP Per Capita $48,000
GDP-Real Growth Rate 2.80%
Unemployment Rate 7.40%
Inflation 0.00%
Data Source: Demographics, Economy and Trade from CIA World Factbook, Music Industry from The Music Trades. GDP (PPP): Gross Domestic Product based on purchasing-power-parity (PPP) valuation of country GDP in U.S. dollars.
235This copy belongs to Chris Parks

0
2
4
6
8
10
12
U.S.Denmark
FinlandU.K.
NorwayGermany
Export Partners (2015)
Ann
ual P
erce
ntag
e
0
3
6
9
12
15
18
ChinaU.K.
DenmarkNorway
NetherlandsGermany
Import Partners (2015)
Ann
ual P
erce
ntag
e
Music Sales Per Capita(U.S. $)
0
2
4
6
8
10
12
'14'13'12'11'10'09'08'07'06'05
Share of Global Music Market(Percent)
0.0
0.1
0.2
0.3
0.4
0.5
0.6
0.7
'14'13'12'11'10'09'08'07'06'05
Sweden Music Market(U.S. $ in millions)
0
20
40
60
80
100
120
'14'13'12'11'10'09'08'07'06'05
Trade
Total Export $151.1 billion Export as % of GDP 32.33%
Total Import $133.2 billion Import as % of GDP 28.50%
Music Market $92.0 million
Sales Per Capita $9.39
Global Share 0.50%
Music Industry
236This copy belongs to Chris Parks

International DataSweden
Sweden Imports and Exports
0.0
0.2
0.4
0.6
0.8
1.0
1.2
1.4
1.6
'15'14'13'12'11'10'09'08'07'06
Acoustic PianosExports
Valu
e in
U.S
. $ m
illio
ns Export Value
0
5
10
15
20
25
30
35
40
'15'14'13'12'11'10'09'08'07'06
KeyboardsExports
Valu
e in
U.S
. $ m
illio
ns
Export Value
0
2
4
6
8
10
'15'14'13'12'11'10'09'08'07'06
Fretted & Stringed InstrumentsImports
Valu
e in
U.S
. $ m
illio
ns
Import Value
0.0
0.5
1.0
1.5
2.0
2.5
3.0
3.5
'15'14'13'12'11'10'09'08'07'06
Fretted & Stringed InstrumentsExports
Valu
e in
U.S
. $ m
illio
ns
Export Value
0.0
0.5
1.0
1.5
2.0
2.5
3.0
'15'14'13'12'11'10'09'08'07'06
Acoustic PianosImports
Valu
e in
U.S
. $ m
illio
ns
Import Value
0
5
10
15
20
25
30
35
'15'14'13'12'11'10'09'08'07'06
KeyboardsImports
Valu
e in
U.S
. $ m
illio
ns
Import Value
237This copy belongs to Chris Parks

Sweden Imports and Exports
0.0
0.5
1.0
1.5
2.0
2.5
3.0
3.5
'15'14'13'12'11'10'09'08'07'06
Wind InstrumentsExports
Valu
e in
U.S
. $ m
illio
ns Export Value
0
1
2
3
4
5
6
7
8
9
'15'14'13'12'11'10'09'08'07'06
AccessoriesExports
Valu
e in
U.S
. $ m
illio
ns
Export Value
0
1
2
3
4
5
6
7
'15'14'13'12'11'10'09'08'07'06
PercussionImports
Valu
e in
U.S
. $ m
illio
ns
Import Value
0.0
0.5
1.0
1.5
2.0
2.5
3.0
3.5
'15'14'13'12'11'10'09'08'07'06
PercussionExports
Valu
e in
U.S
. $ m
illio
ns
Export Value
0.0
0.5
1.0
1.5
2.0
2.5
3.0
3.5
4.0
4.5
'15'14'13'12'11'10'09'08'07'06
Wind InstrumentsImports
Valu
e in
U.S
. $ m
illio
ns
Import Value
0
4
8
12
16
20
'15'14'13'12'11'10'09'08'07'06
AccessoriesImports
Valu
e in
U.S
. $ m
illio
ns
Import Value
238This copy belongs to Chris Parks

International DataSwitzerland
DOING BUSINESS IN SWITZERLAND
Market Overview• Switzerland’s population of 8 million is affluent and cosmopolitan
• GDP of about US$631 billion; growth forecast of 2.2% for 2014
• In 2013, total exports from the United States to Switzerland amounted to US$27 billion
• U.S.-Swiss trade generally stable despite financial and economic crisis
• World-class infrastructure, business-friendly legal and regulatory environment
• Highly educated, reliable and flexible workforce
• Consumer and producer of high-quality, value-added industrial/consumer goods
• Manufacturing sector is highly automated and efficient
• Strong market demand for U.S. components and production systems
• Strong demand for high-quality products with competitive prices
• Highest per capita IT spending in the world
• Multilingual/multicultural European test market and business environment
• Many U.S. firms with European and regional headquarters in Switzerland
Market Challenges• Market is sophisticated, quality-conscious, high-tech and competitive
• An epicenter of European and global competition
• While EU-type regulations and standards exist in general, there are significant exceptions
• Unique Swiss requirements for pharmaceuticals, cosmetics, detergents and chemicals
Market Opportunities• Products with relatively advanced technologies are best prospects
• Switzerland is strategically placed as a gateway to EU markets
• Ideal test market for introduction of new high-tech and consumer products
• Excellent platform for marketing into Europe, Middle East and Africa
SW
ITZER
LAN
D
239This copy belongs to Chris Parks

• High concentration of computer/Internet usage per capita
• Sophisticated market for U.S. devices
• Switzerland is becoming a European center for the commercial aviation business
• Fast-growing demand for highly sophisticated security equipment/systems
• One of the world’s top countries for R&D
• Excellent opportunities for partnerships in biotech, nanotech and renewable energies, especially solar
• Significant assets pooled from around the world under Swiss management, creating excellent opportunities for U.S. financial services providers
Market-Entry Strategies• Express commitment to the market and establish long-term relationships
• Work directly with Swiss importers/distributors for maximum market penetration
• Be prepared to meet customer’s needs and willing to sell in small volumes
• Offer high-quality and environmentally friendly products
• Enter the market early to gain and maintain competitive edge
• Evaluate carefully prospective partners’ technical qualifications and ability to cover the German, French and Italian regions
“Doing Business in Switzerland” article is provided by the U.S. Commercial Service, the trade promotion arm of the U.S. Department of Commerce’s International Trade Administration. For more information on doing business in Switzerland, you may visit their website at www.export.gov/Switzerland.
The following charts are based on import data provided by The Federal Office of Statistics in Switzerland and the personal research of Michael Heuser, President of Roland Switzerland and Delegate of Suissemusic for International Relations and the Confederation of European Music Industries (CAFIM) as well as the website of the International Trade Centre (ITC)
switzerland
240This copy belongs to Chris Parks

International DataSwitzerland Snapshot
Demographics
65+17.8%
0–1415.1%
15–64 67.1%
Economy
GDP-Industry26.7%
GDP-Service72.5%
GDP-Agriculture0.8%
Population in millions 8.1
Median Age 42.1 Population Growth 0.71%
0
100
200
300
400
500
'15'14'13'12'11'10'09'08'07'06'05'04
Switzerland GDP (PPP)(U.S. $ in billions)
0
1
2
3
4
5
'15'14'13'12'11'10'09'08'07'06'05'04
Unemployment Rate(Percent)
-1.5
-1.0
-0.5
0.0
0.5
1.0
1.5
2.0
2.5
3.0
'15'14'13'12'11'10'09'08'07'06'05'04
In�ation (Annual Percent Rate)
SWITZERLAND SNAPSHOT
Demographics
Economy
Age Male Female
0–14 0.63 0.59
15–64 2.74 2.71
65 & Over 0.63 0.81
GDP (PPP) $482.7 billion
GDP Per Capita $59,300
GDP-Real Growth Rate 1.00%
Unemployment Rate 3.30%
Inflation -1.10%
Data Source: Demographics, Economy and Trade from CIA World Factbook, Music Industry from The Music Trades. GDP (PPP): Gross Domestic Product based on purchasing-power-parity (PPP) valuation of country GDP in U.S. dollars.
241This copy belongs to Chris Parks

0
4
8
12
16
20
ChinaU.K.ItalyFranceU.S.Germany
Export Partners (2015)
Ann
ual P
erce
ntag
e
0
5
10
15
20
25
30
AustriaChinaU.S.FranceItalyGermany
Import Partners (2015)
Ann
ual P
erce
ntag
e
Music Sales Per Capita(U.S. $)
0
5
10
15
20
25
'14'13'12'11'10'09'08'07'06'05
Share of Global Music Market(Percent)
0.0
0.2
0.4
0.6
0.8
1.0
1.2
'14'13'12'11'10'09'08'07'06'05
Switzerland Music Market(U.S. $ in millions)
0
25
50
75
100
125
150
175
'14'13'12'11'10'09'08'07'06'05
Music Industry
Trade
Total Export $270.6 billion Export as % of GDP 56.06%
Total Import $214.8 billion Import as % of GDP 44.50%
Music Market $131.0 million
Sales Per Capita $16.13
Global Share 0.80%
242This copy belongs to Chris Parks

International DataSwitzerland
Switzerland Imports
0
2
4
6
8
10
12
14
'15'14'13'12'11'10'09'08'07'06
Upright Pianos
Valu
e in
Sw
iss F
ranc
s m
illio
nsImport Value
0
3
6
9
12
15
'15'14'13'12'11'10'09'08'07'06
Fretted Instruments
Valu
e in
Sw
iss F
ranc
s m
illio
ns
Import Value
0
2
4
6
8
10
12
'15'14'13'12'11'10'09'08'07'06
Grand Pianos
Valu
e in
Sw
iss F
ranc
s m
illio
ns
Import Value
0.0
0.5
1.0
1.5
2.0
2.5
3.0
3.5
4.0
4.5
'15'14'13'12'11'10'09'08'07'06
Stringed Instruments with a Bow
Valu
e in
Sw
iss F
ranc
s m
illio
ns
Import Value
0
25
50
75
100
125
'15'14'13'12'11'10'09'08'07'06
Total Imports
Valu
e in
Sw
iss F
ranc
s m
illio
ns
Import Value
0
1
2
3
4
5
6
7
8
9
'15'14'13'12'11'10'09'08'07'06
Guitars
Valu
e in
Sw
iss F
ranc
s m
illio
ns
Import Value
243This copy belongs to Chris Parks

Switzerland Imports
0
2
4
6
8
10
12
'15'14'13'12'11'10'09'08'07'06
Wind Instruments
Valu
e in
Sw
iss F
ranc
s m
illio
nsImport Value
0.0
0.2
0.4
0.6
0.8
1.0
1.2
1.4
1.6
'15'14'13'12'11'10'09'08'07'06
Pipe Organs & Harmonium
Valu
e in
Sw
iss F
ranc
s m
illio
ns
Import Value
0
2
4
6
8
10
12
'15'14'13'12'11'10'09'08'07'06
Percussion
Valu
e in
Sw
iss F
ranc
s m
illio
ns
Import Value
0
3
6
9
12
15
18
'15'14'13'12'11'10'09'08'07'06
Keyboards
Valu
e in
Sw
iss F
ranc
s m
illio
ns
Import Value
0
1
2
3
4
5
6
7
8
9
'15'14'13'12'11'10'09'08'07'06
Brass Instruments
Valu
e in
Sw
iss F
ranc
s m
illio
ns
Import Value
0.0
0.3
0.6
0.9
1.2
1.5
1.8
'15'14'13'12'11'10'09'08'07'06
Accordions
Valu
e in
Sw
iss F
ranc
s m
illio
ns
Import Value
244This copy belongs to Chris Parks

International DataUnited Kingdom
UNITED KINGDOM
The UK economic recovery continues at a gradual pace, albeit it remains fragile and susceptible to a wide variety of internal and external factors. General retailing in the country is showing a single-digit percentage growth year-on-year and this is mainly reflected in the musical products industry. The UK music industry typically enters late into a recession, but it also recovers later than the general trend. Whilst the UK general public are gradually starting to return to more positive spending habits, buying an instrument is far from being at the “front of the queue” in purchasing priorities.
The political backdrop of the “Brexit” vote in 2016 regarding future UK membership in the European Union is creating an unwelcome level of uncertainty, and the vote itself may naturally have an effect on UK trade and the exchange rates between sterling, the euro and the U.S. dollar. British manufacturing (which is showing signs of growth) and, indeed, British retailing are all keenly waiting to see the outcome of the vote.
The UK still maintains a large and vibrant community of musical instrument shops and many are adapting and adopting the technologies and service propositions required by today’s demanding and savvy consumers.
The actual retail landscape is changing; it has been recently revealed that the UK has the world’s highest per-capita usage of online retailing. We now average 17% of total retailing online and in pure sales terms, are second only to the United States and China. UK M.I. retailers have gradually produced a far more competitive online retailing proposition and many of our businesses are showing impressive sales increases on the year. It is worth noting that many UK retailers are creating a far more compelling offer, with both e-commerce and bricks and mortar, in the competitive European marketplace.
The problem still persists, however, of market “cannibalisation,” with the large businesses taking a bigger percentage of the total market without the market actually growing. The industry challenge to create more brand-new musicians and revitalised lapsed ones is becoming an ever-growing and critical priority for all of us. Industry data still shows that there are more people in the UK who want to play (or return to play) than actually do — the market is still ripe for major expansion!
Brian Majeski of The Music Trades recently offered a fascinating insight into the total monetary worth of the global musical products industry and the fact that two specific factors are currently hindering us all from ever returning to the previous heights we scaled back in 2006/07. These factors are the ever-decreasing costs of products with technology components — in real terms the sales value of such products will never again attain the levels of previous years, even with volume growth in units. The second factor is the elusive but highly significant scale of the second-hand market (eBay, Gumtree, Reverb, etc.), which is achieving millions in sales, but all outside of our control (and contribution to our monitored sales).
So, in summary, the UK faces both challenges and opportunities for the M.I. sector. The recovery is timid and fragile, but the desire to play an instrument and generally be part of the music-making world is high.
Commentary by Paul McManus, Chief Executive of the Music Industries Association (MIA) and Music for All charity (MfA)
UN
ITED K
INGDOM
245This copy belongs to Chris Parks

DOING BUSINESS IN THE UNITED KINGDOM
Market Overview• The United Kingdom (estimated 2014 GDP of US$2.8 trillion) has the sixth largest
economy in the world according to the CIA’s 2014 World Factbook, the third largest economy in the European Union, and is a major international trading power.
• While the United Kingdom is geographically relatively small (about the size of Oregon), it has a population of more than 66 million people.
• Highly developed, sophisticated and diversified, the UK market is the largest in Europe and the fifth largest in the world for exported U.S. goods. The country is the second largest market in the world for U.S. service exports.
• With few trade barriers, the United Kingdom serves as the entry market into the European Union for more than 43,000 U.S. exporters.
• U.S. exports to the UK of goods and services combined were estimated to be worth about US$110 billion in 2014.
• Major categories of U.S. exports include aerospace products, building products and sustainable construction, cyber security, medical equipment, pet products, low carbon energy and smart grids, and travel & tourism.
• The United Kingdom remains the top overseas market for travel to the United States with nearly 4 million UK travelers estimated to have visited the United States in 2014.
• The U.S.-UK investment relationship is the largest in the world with cumulative bilateral stock in direct investment valued at nearly US$1.1 trillion in 2013. More than 2 million jobs, approximately 1 million in each country, have been created over the years to manage and drive this investment.
• More than 7,500 U.S. firms have a presence in the United Kingdom, which is also the top location in Europe for U.S. regional headquarters covering Europe, the Middle East and Africa.
• The UK economy grew by 2.8% in 2014, reflecting a continued recovery from the recession. The economy is expected to remain relatively strong in 2015 with forecast growth of 2.5%.
• A major international financial, media and transportation hub, London is also headquarters to the European Bank for Reconstruction and Development (EBRD).
united kingdom
united kingdom
246This copy belongs to Chris Parks

International DataUnited Kingdom
Market Challenges• The pound remains strong against the dollar, making London one of the world’s most
expensive cities in which to do business.
• As UK and third-country suppliers represent strong competition, U.S. exporters need to offer differentiated products at competitive prices.
• Complex EU technical/regulatory requirements can be burdensome.
• “Devolved Administrations” present some differences in policies and regulations among England, Northern Ireland, Scotland and Wales. While Scotland voted to stay in the UK in 2014, the Scottish National Party has won the most seats in the Scottish Parliament and is determined to see greater devolution, including fiscal autonomy, for Scotland.
• The UK government has introduced deep cuts to public-sector spending, affecting many businesses and, more broadly, consumer confidence. Despite the country’s improving economic picture, the government is committed to reducing its deficit, and the cuts are likely to continue now that the Conservative party has won a majority in parliament.
Market Opportunities• The United Kingdom is a highly sophisticated market with strong demand for
products and services that improve productivity, including information and communications technology software and services that lower costs and improve business efficiencies.
• There is ongoing, strong demand for a wide range of equipment and services related to safety/security and, in particular, cyber security.
• The United Kingdom’s commitment to low-carbon targets is driving market demand for U.S. products and services in the area of renewable energy, energy efficiency, low carbon/green technologies, smart grid technologies and e-vehicles.
• The proposed U.S.-EU Transatlantic Trade and Investment Partnership (TTIP) has the potential to cut tariffs and address market barriers, thus creating additional opportunities in the UK for U.S. exporters.
Market-Entry Strategies• Demonstrate a clear value proposition and competitive advantage (i.e., price, quality,
branding).
• Pay close attention to both the obvious and subtle cultural differences between the United States and the United Kingdom and adjust marketing strategies accordingly.
united kingdom
247This copy belongs to Chris Parks

• Evaluate prospective partners carefully and choose an experienced, well-established local distributor.
• Be flexible working with a UK partner during this prolonged period of economic recovery.
• Express commitment to the market with a long-term perspective.
“Doing Business in the United Kingdom” article is provided by the U.S. Commercial Service, the trade promotion arm of the U.S. Department of Commerce’s International Trade Administration. For more information on doing business in the United Kingdom, you may visit their website at www.export.gov/UnitedKingdom.
The following charts and data are based on results from a survey conducted by Nexus Research on behalf of the Music for All charity in conjunction with the Music Industries Association (MIA)
united kingdom
248This copy belongs to Chris Parks

International DataUnited Kingdom Snapshot
UNITED KINGDOM SNAPSHOT
Population in millions 64.1
Median Age 40.4Population Growth 0.54%
Demographics
Economy
Age Male Female
0–14 5.71 5.42
15–64 21.08 20.51
65 & Over 5.09 6.28
GDP (PPP) $2.66 trillion
GDP Per Capita $41,200
GDP-Real Growth Rate 2.50%
Unemployment Rate 5.40%
Inflation 0.10%
Data Source: Demographics, Economy, and Trade from CIA World Factbook, Music Industry from The Music Trades. GDP (PPP): Gross Domestic product based on purchasing-power-parity (PPP) valuation of country GDP in U.S. dollars.
Demographics
65+17.7%
0–1417.4%
15–6464.9%
Economy
GDP-Industry19.7%
GDP-Agriculture0.6%
GDP-Service79.6%
0.0
0.5
1.0
1.5
2.0
2.5
3.0
'15'14'13'12'11'10'09'08'07'06'05'04
United Kingdom GDP (PPP)(U.S. $ in trillions)
0
2
4
6
8
10
'15'14'13'12'11'10'09'08'07'06'05'04
Unemployment Rate(Percent)
0
1
2
3
4
5
'15'14'13'12'11'10'09'08'07'06'05'04
In�ation(Annual Percent Rate)
249This copy belongs to Chris Parks

Trade
Music Industry
Total Export $442.0 billion Export as % of GDP 16.62%
Total Import $617.1 billion Import as % of GDP 23.20%
Music Market $544.0 million
Sales Per Capita $8.49
Global Share 3.30%
0
2
4
6
8
10
12
14
BelgiumIreland
FranceNetherlands
GermanyU.S.
Export Partners (2015)
Ann
ual P
erce
ntag
e
0
2
4
6
8
10
12
14
16
BelgiumFrance
U.S.Netherlands
ChinaGermany
Import Partners (2015)
Ann
ual P
erce
ntag
e
Music Sales Per Capita(U.S. $)
0
2
4
6
8
10
12
14
16
'14'13'12'11'10'09'08'07'06'05
0
1
2
3
4
5
6
'14'13'12'11'10'09'08'07'06'05
Share of Global Music Market(Percent)
United Kingdom Music Market(U.S. $ in millions)
0
200
400
600
800
1000
'14'13'12'11'10'09'08'07'06'05
250This copy belongs to Chris Parks

International DataUnited Kingdom
United Kingdom
Music Making in the UK Survey
20142005
PERCENTAGE OF HOUSEHOLDS THAT CURRENTLYHAVE AT LEAST ONE MUSICAL INSTRUMENT PLAYER
37%
47%
20142005
PERCENTAGE OF POPULATION OVER 5 YEARSTHAT CURRENTLY PLAYS A MUSICAL INSTRUMENT
21%
28%
This survey was conducted by Nexus Research on behalf of the Music for All charity. The objectives were to:
• Provide feedback on music players’, lapsed players’ and non-players’ profiles, behavior and attitudes
• Provide reference data for promoting the value of music in the community
• Obtain insight as to how best to encourage more people to make music
The results are based on 1,812 Internet surveys with people (16+ years) spread across England, Wales, Scotland and Northern Ireland. During these surveys, data on an additional 2,167 members of households was also collected regarding their music making.
Highlights• There are an estimated 13.6m (5+ years) lapsed players, 58% (7.9m) of whom
would like to start playing again and 58% of whom are women.
• Of the lapsed players, 66% stopped playing by 16 years.
• Of those who have never played, 58% (14.6m) agreed they would like to learn to play a musical instrument. Over 76% of non-players indicated that they wished they had learned to play an instrument.
• Over 40% of those who had never played completely agreed that you are never too old to learn to play.
251This copy belongs to Chris Parks

• The most popular instruments played are guitars (by 42% of instrument players), pianos and keyboards (by 40%) and woodwind (by 25%). Some 67% of guitar players are male while 56% of piano/keyboard players and 62% of woodwind players are female.
• People first learn to play an instrument by teaching themselves (40%), by private one-to-one lessons (31%) and/or by school lessons (26%).
• When purchasing, specialist (brick-and-mortar) music retailers are the most likely consideration (36% overall, 41% current players), closely followed by the Internet (32% overall, 40% current players).
• A third of respondents indicated that they had seen or heard about the benefits of playing a musical instrument and its positive effects on health, well-being or education.
• Between 55% and 60% of the general population completely agree that music brings people together, playing a musical instrument provides a sense of personal accomplishment and that they’d be proud of their children playing. This proportion rises to 75% to 85% on a
“completely and mostly agree” basis.
• 53% of people consider it very important that the government continue to financially support the provision of music in schools, rising to 92% on a “very + quite important” basis.
252This copy belongs to Chris Parks

NAMM EXECUTIVE COMMITTEE & BOARD OF DIRECTORS NAMM EXECUTIVE COMMITTEE
ChairMark GoffW.H. Paige & Co., Inc.Indianapolis, IN
Vice ChairRobin WalentaWest Music Co., Inc.Coralville, IA
TreasurerChris MartinC.F. Martin & Co., Inc.Nazareth, PA
SecretaryJoel MencheyMenchey Music Service, Inc.Hanover, PA
President/CEOJoe LamondNAMMCarlsbad, CA
NAMM YP PRESIDENT
Ryan WestWest Music Co., Inc.Coralville, IA
NAMM BOARD OFDIRECTORS
Blake AugsburgerHARMAN InternationalElkhart, IN
Pat AverwaterAmro Music Stores, Inc.Memphis, TN
Ron LosbySteinway & Sons, Inc.Long Island City, NY
Richard McDonaldFender Musical Instruments CorporationScottsdale, AZ
Clinton MunteanMainline Marketing, Inc.Orlando, FL
Brian ReardonMonster MusicLevittown, NY
Liz ReismanCreative Music & Arts, LLCMonroe, CT
Peter SidesRobert M. Sides Family Music CentersState College, PA
Myrna SislenMiddle C Music Corp.Washington, DC
Tabor StamperKHS America, Inc.Mount Juliet, TN
Clint StraitStrait Music Co.Austin, TX
Tom SumnerYamaha Corporation of AmericaBuena Park, CA
Martin SzpiroJam Industries Ltd.Baie D’urfe, Canada
Joe CastronovoKorg USA, Inc.Melville, NY
Steve CeoC.A. House MusicSaint Clairsville, OH
Cindy CookThe Candyman Strings & ThingsSanta Fe, NM
Paul DeckerMusic VillaBozeman, MT
Greg DeeringDeering Banjo Company, Inc.Spring Valley, CA
Peter DodsEasy Music CenterHonolulu, HI
Michael DoyleGuitar Center, Inc.Westlake Village, CA
Larry FishmanFishman Transducers, Inc.Andover, MA
Todd HeidHeid Music Company, Inc.Appleton, WI
Gabriela KönigKönig & Meyer GmbH & Co. KGWertheim, Germany
Sheryl LaukatCannonball Musical InstrumentsSandy, UT
253This copy belongs to Chris Parks
ACKNOWLEDGEMENTS
NAMM wishes to express our sincere appreciation to everyone who helped make the 2016 NAMM Global Report possible, including Paul and Brian Majeski of The Music Trades magazine for the U.S. music products industry sales statistics and unit information and analysis; and Ariel Sedeno of the U.S. Census Bureau for the U.S. import and export statistics.
We also want to acknowledge the contributions of those organizations and individuals who helped us assemble the global statistics: Alfredo Campanelli of Import Music Argentina; Rob Walker of the Australian Music Association (AMA); Otmar Hammerschmidt of the Austrian Musical Instruments Retailer’s Association; Daniel Neves of Música & Mercado, Brazil; Jim Norris of Norris-Whitney Communications, Inc. and Steven Butterworth of Yamaha Canada Music Ltd., Canada; Zeng Zemin and Chang Jie of the China Musical Instrument Association (CMIA); Zuzana Petrofová of PETROF, spol. s r.o., Czech Republic; Thomas Hemery of the French Music Industry Association (C.S.F.I.); Winfried Baumbach of the National Association of German Musical Instruments Manufacturers (BDMH); Géza Balogh of HANOSZ, Hungary; Claudio Formisano of Dismamusica, Italy; Shuncho Mori and Toshio Suganuma of The Japan Music Trades; Thomas Veerkamp of Casa Veerkamp, SA de CV, Mexico; Juan Grecos of Caprice, S.L., Spain; and Paul McManus of the Music Industries Association (MIA), United Kingdom.
Your assistance was crucial and is greatly appreciated. Thank you.
254This copy belongs to Chris Parks

NAMM, the National Association of Music Merchants 5790 Armada Drive • Carlsbad, CA 92008 • USA • 800.767.NAMM (6266) • www.namm.org
This copy belongs to Chris Parks