Embed Size (px)
Citation preview
Feature Article
The 2009 Economic Landscape How the Recession Is Unfolding across Four US Regions
Foreword With the intensification of financial market turmoil in the fourth quarter of 2008 came a new round of distress to the US economy making this not only one of the longest but one of the most severe US recessions since World War II Real gross domestic product (GDP) declined at an annualized rate of 63 percent in the fourth quarter the most in any quarter since 1982 As of March 2009 the downturn marked its 16th month making it equal to the longest period of uninterrupted contraction in the US economy since the 1930s
While events in the US and global financial markets are powerful drivers of the recession that began in 2007 this economic downturn is unfolding in unique ways across the various regional economies For example most areas of the country are experiencing housing market distress but some are seeing more severe deteri-oration in local housing markets than indicated by national averages One analysis shows that more than half of all residential foreclosure filings in 2008 took place in 35 US counties where 20 percent of the US population lives1 Similarly while some 41 states saw payroll jobs decline in 2008 the remaining 9 states (and the District of Columbia) continued to report employment growth
The following series of articles takes a closer look at the distinct way that this recession is playing out in four major regions of the country The first article describes how the latest downturn is exacerbating long-term problems in the manufacturing sector of the Industrial Midwest In the second article we explore how formerly booming housing markets in Arizona Califor-nia Florida and Nevada have given way to a housing bust that has sharply reversed the momentum of the regional economy The third article focuses on the impact of financial market turmoil on New York City and other financial centers along the East Coast while the fourth article outlines why a number of states in the nationrsquos midsection have fared better than most thus far because of their high dependence on energy and agri-cultural production
Richard A Brown Chief Economist
1 ldquoMost foreclosures pack into a few countiesrdquo USAToday March 6 2009
FDIC QUARTERLY 26 2009 VOLUME 3 NO 1
The 2009 Economic Landscape
Recession Adds to Long-Term Manufacturing Challenges in the Industrial Midwest
The manufacturing sector has long been a primary economic driver of the Industrial Midwest1 This region which comprises eight states in the north-central United States is known for its durable goods manufac-turing a sector that includes the production of automo-biles and other types of heavy machinery The emphasis on manufacturing has posed challenges for the region as the sector has contracted This article discusses manu-facturing trends in the Industrial Midwest particularly with respect to the troubled auto sector and the economic outlook for the region
The Industrial Midwest Has Not Recovered from the Last Recession The US manufacturing sector has struggled throughout this decade Historically nationwide manufacturing-related employment has tended to decline a few quarters before the US economy contracts and then recover in tandem with the broader economy However job growth in the US manufacturing sector did not
1 In this article the Industrial Midwest is defined as the region encom-passing Indiana Wisconsin Michigan Ohio Iowa Kentucky Minne-sota and Illinois
Chart 1
rebound after the 2001 recession even while overall US economic growth was strong (see Chart 1)2
These manufacturing weaknesses have had a dispropor-tionate effect on the Industrial Midwest economy In each state in the region manufacturing employment as a percentage of total employment is higher than the nationrsquos Moreover Indiana Wisconsin Michigan and Ohio have the highest concentrations of manufacturing employment in the country3 Because of its reliance on manufacturing during a period of weakness in this sector total employment in the region has yet to return to pre-2001 levels (see Chart 2)
Two long-term issues are adversely affecting manufac-turing in the Industrial Midwest First over the past two decades much of the regionrsquos manufacturing base has
2 The trend of outsourcing may contribute to overcounting of manu-facturing job losses As manufacturers ldquopurchaserdquo a growing number of services the value of which is ultimately embedded in product value manufacturing employment levels may have simply shifted to service industry sectors See ldquoIs Manufacturing at a Crossroadsrdquo Chicago Fed Letter Number 204a July 2004 3 Bureau of Labor Statistics December 31 2008 Manufacturing concentrations are defined as durable goods manufacturing and wholesale trade jobs as a percentage of total nonfarm payrolls
-10
-5
0
5
10
Q1-79 Q1-83 Q1-87 Q1-91 Q1-95 Q1-99 Q1-03 Q1-07 -10
-5
0
5
10
Sources Bureau of Economic Analysis Bureau of Labor Statistics (Haver Analytics) Note Data are seasonally adjusted Shaded areas denote US recessions
Manufacturing Employment Year-to-Year Percent Change
US Manufacturing Employment Did Not Rebound following the 2001 Recession Real GDP
Quarterly Percent Change at an Annual Rate
FDIC QUARTERLY 27 2009 VOLUME 3 NO 1
Chart 2 Chart 3
States in the Industrial Midwest Began Contracting before the Current National Recession
90
95
100
0 2 4 6 8 10 12 14 16 18 20 22 24 26 28 30
Recent Cyclical Job Losses in the Industrial Midwest Have Proven to Be Long-Lived
Indexed Total Employment Seasonally Adjusted Prior Peak=100
Source Bureau of Labor Statistics (Haver Analytics)
Quarters since Peak
2007-08 1990-92
2000-07
1979-86
been lost to competition both foreign and domestic Second technological improvements in US factories have led to much higher productivity levels4 These productivity advances have been brought about by capi-tal investments that require fewer low-skilled workers
More recently the erosion of market share and struc-tural cost problems at General Motors (GM) Chrysler and Ford have led to large-scale restructurings and job losses These challenges at US automakers have contributed to the loss of more than 140000 manufac-turing jobs since 20055 Hundreds of thousands of addi-tional workers at auto assembly plants and auto parts suppliers could potentially lose their jobs during the current downturn6
Auto sector layoffs have disproportionately affected Michigan Ohio and Indiana the states most exposed to the troubled auto sector These states were essentially in recession before the nation as a whole with Michi-gan preceding the national downturn by more than three years (see Chart 3) Michigan is the state most heavily concentrated in auto manufacturing with the most motor vehicle manufacturing jobs and the highest
4 Bureau of Labor Statistics From 2002 to 2006 US manufacturing multifactor productivity growthmdashthe increase in the ratio of goods output to labor capital and other inputsmdashaveraged 22 percent well above the 30-year average of 14 percent 5 The figure cited refers to job losses in the transportation manufactur-ing sector of the Industrial Midwest through 2008 These job losses have occurred mostly at auto parts suppliers and automakers 6 See CAR Research Memorandum The Impact on the US Economy of a Major Contraction of the Detroit Three Automakers Center for Automotive Research November 4 2008
Minnesota +4 months
Illinois+1 month Iowa +1 month
Kentucky -1 month
Indiana -3 months
Wisconsin -6 months
Ohio -6 monthsMichigan -37 months
-40 -30 -20 -10 0 10 Number of Months Selected States Entered Recession
before (-) or after (+) the Nation Source Moodyrsquos Economycom
number and proportion of direct and indirect jobs connected to motor vehicle parts production7
Employment Weakness Has Also Spilled into the Regionrsquos Housing Markets Although the Industrial Midwest did not experience the significant home price appreciation of the post-2001 housing boom to the same degree as other regions its residential real estate markets have still suffered Existing home sales in the Industrial Midwest declined 33 percent from their second quarter 2005 peak roughly in line with the nationwide decline8 In 2008 home prices fell in all of the regionrsquos states led by Michigan where prices declined by more than 10 percent9 Further in half of the Industrial Midwest states foreclosure rates are at or slightly higher than the national rate10
Weak housing markets have in turn adversely affected the regionrsquos construction industry Construction employment was virtually unchanged across the Indus-trial Midwest from 2003 through 2006 while it grew more than 10 percent nationwide Since 2006 the construction sector in the Industrial Midwest has declined by 77 percent or 96000 jobs
7 Contribution of the Motor Vehicle Supplier Sector to the Economies of the United States and Its 50 States Center for Automotive Research January 2007 8 National Association of Realtors data available as of fourth quarter 2008 9 Based on the Federal Housing Finance Agency Purchase-Only House Price Index 10 Mortgage Bankers Association fourth quarter 2008
FDIC QUARTERLY 28 2009 VOLUME 3 NO 1
2009 Economic Landscape
The Industrial Midwest Faces a Potentially Long Road to Recovery Employment in the Industrial Midwest has declined substantially during the current downturn and the near-term outlook for Detroitrsquos auto industry remains unclear Automakers have been shrinking their busi-nesses to match reduced market share In addition financial press reports and analytical studies indicate that hundreds of thousands of jobs are potentially at stake as Chrysler and GM continue to negotiate restructuring plans with the Obama administrationrsquos auto task force Though foreign-based automakers with production facilities in the region might increase output to partially offset this gap their new hiring likely would not fully absorb jobs shed by Detroit automakers
Two other economic indicators also point to a prolonged path to recovery First the outlook for the metal fabrication and machinery manufacturing indus-tries has diminished These industries which include companies involved in the transformation of metal into intermediate or final products and the production of machines used in industrial applications provided some economic stability to the Industrial Midwest following the last recession However the weakening national economy has softened demand for their products Nationally investment in machinery and other fixed assets has slowed consistently since mid-2007 and fell 21 percent during fourth quarter 200811 As a result employment in fabrication and machinery manufactur-ing in the region declined 14 percent or about 13000 jobs in 2008
Second contraction or slowing growth in the econo-mies of US trading partners will likely limit future export opportunities that had provided a counterbal-ance to the weakened auto sector over the past few years Exports rose 13 percent and 11 percent respec-tively in 2006 and 2007 benefiting from strong foreign demand and a decline in the value of the dollar However the economies of foreign trading partners are now slowing or contracting and the decline in the dollar has reversed direction returning to trade-weighted levels not seen since 200612
A more positive outlook for the region hinges in no small part on the success of federal government initia-tives directed at stimulating the economy in general and the auto sector in particular Spending on infrastructure projects should generate new jobs while other provi-sions of the $787 billion American Recovery and Rein-vestment Act are intended to maintain existing jobs However most of the affected jobs will be outside of the manufacturing sector While employment will likely continue to decline in the automotive sector it is likely that fewer jobs would be lost under a government-assisted restructuring than would occur otherwise Over the long term job growth is likely to become more dependent on emerging and expanding industries such as those found in the energy education and health care sectors
Authors Patrick M Dervin Regional Economist
John M Anderlik Assistant Director
12 The Blue Chip Economic Indicators consensus forecast as of December 2008 calls for a 01 percent decline in Canadarsquos GDP in 2009 and only a 02 percent increase in Mexicorsquos GDP Growth in China one of the fastest growing export markets is expected to slow from 95 percent in 2008 to 76 percent in 2009 well below trend
11 Bureau of Economic Analysis seasonally adjusted annualized growth in real private nonresidential fixed investment
FDIC QUARTERLY 29 2009 VOLUME 3 NO 1
The 2009 Economic Landscape
The Sand States Anatomy of a Perfect Housing-Market Storm
The historic boom and subsequent decline in the nationrsquos housing market has been a defining feature of the current recession The housing downturn has been most acute in four statesmdashArizona California Florida and Nevadamdash that had experienced some of the highest rates of home price appreciation in the first half of the decade While these states are not all contiguously located their similar housing cycles and abundance of either beaches or deserts have led some analysts to label them ldquoSand Statesrdquo This article discusses the factors that led to an expanding housing sector in these states and the market imbalances that culminated in a sharp correction in home prices The article also explores the ripple effects that the hous-ing downturn has had on the local economies
Rapid Population Growth in the Sand States Propelled Housing Markets For many years rapid population growth in the Sand States spurred higher than average rates of home construction Favorable weather and relatively afford-able housing are two factors that attracted retirees as well as younger families to these states In the 1980s and 1990s population growth rates in Arizona Florida and Nevada were between two and four times the national rate Certain parts of California such as the RiversidendashSan Bernardino metropolitan area experi-enced similarly high rates of population growth Rapid population growth continued into the early years of this decade From 2004 to 2007 Arizona and Nevada ranked as the two fastest growing states in the nation followed closely by Florida which ranked ninth1
The influx of new residents into Arizona Florida and Nevada also contributed to strong employment growth Job creation in these states frequently outpaced the rest of the nation during the past few decades From 2000 to 2006 these states repeatedly ranked among the top ten for job growth far exceeding the national average California generally reported job growth similar to the national average during this period although the state was hit hard by the dot-com recession from mid-2001 to 2003
1 US Census Bureau
Affordability Mortgages Contributed to Housing Imbalances During this decade strong demand for housing supported by a growing population and an expanding economy contributed to growing housing market imbalances across the Sand States Perhaps the best measure of the imbalances that accumulated in boom-ing housing markets during this decade was the rela-tionship between home prices and incomes In the years leading up to the housing downturn escalating home prices far outpaced income growth For example in 2003 housing in Nevada was considered relatively affordable both in absolute terms and as compared to other states According to one analysis a family earning the median income in Nevada in 2003 could afford a home that was priced approximately 20 percent above the median house price in the state using traditional mortgage financing2 However by late 2005 home prices had risen so much that a family earning the median income could only afford a home priced at 24 percent below the statersquos median price
A combination of factors drove the housing sector imbalances in the Sand States to unprecedented levels Under normal market conditions strained affordability tends to limit housing demand because fewer house-holds can purchase a home using traditional mortgage financing However in this cycle new mortgage ldquoafford-abilityrdquo products were commonly used to finance home purchases Besides traditional adjustable-rate mortgages (ARMs) affordability products included hybrid ARMs which have a low fixed interest rate for several years followed by a market rate that is frequently much higher Affordability products also comprised the so-called nontraditional mortgage products which included interest-only loans where amortization of prin-cipal was not required during the first few years of the
2 Moodyrsquos Economycom Affordability Index The calculation assumes a 30-year maturity and a down payment of 20 percent It also assumes that the monthly principal and interest payments do not exceed 25 percent of the median family income To interpret the indices a value of 100 means that the family earning the median income can afford only 100 percent of the traditional mortgage payment of the median-priced home taking into consideration the 20 percent down payment
FDIC QUARTERLY 30 2009 VOLUME 3 NO 1
2009 Economic Landscape
loan negative-amortization loans that offered initial payments well below the amount required to cover interest and amortize principal and balloon payment loans which typically required a large lump-sum payment at the end of the loan Unlike subprime mort-gage products that were designed for home buyers with limited or weaker credit histories these nontraditional mortgages were marketed broadly and often used by first-time home buyers and investors who did not provide a down payment In addition originators of these products frequently did not require buyers to verify that their income could support the mortgage payments
By 2006 nearly half of total US originations of privately securitized affordability mortgages were made in the four Sand States alone Moreover the proportion of these mortgages originated in these states including nontradi-tional mortgages rose as home prices escalated During 2002 these products accounted for roughly half of the privately securitized mortgage originations in each of the Sand States comparable to the rest of the nation By 2006 however the proportion of these products had increased to 80 percent of privately securitized mortgage originations Nationwide the percentage was about 70 percent3
The increased presence of speculators or investors in the Sand States also contributed to growing imbalances in the housing sector Data from mortgage servicers indicate that nonowner investor and second-home mortgage originations increased noticeably in Arizona Florida and Nevada between 2000 and 20054 Investor and second-home purchases tended to be more heavily concentrated in major metropolitan areas in these states such as Las Vegas West Palm Beach Miami and Phoenix
Strong housing demand coupled with escalating home prices served as a dual incentive for builders to increase the supply of homes arguably at a rate that exceeded short-term demand New home construction started to accelerate in 2002 and over the next three years housing starts in these four states increased an average of 11 percent annually or about twice the rate of increase elsewhere in the nation Housing construction in the Sand States far outpaced annual growth in the number of households which peaked at 16 percent in 2004 and 2005
3 Data are from Loan Performance Affordability mortgage products include ARM loans interest-only loans negative amortization mortgages balloon loans and hybrid ARMs Affordability originations are measured as a percentage of privately securitized origination first liens only 4 In contrast California had less investor activity during the period likely because the median home price in the state was relatively high resulting in a less attractive rate of return for potential investors
Labor market imbalances also arose as job growth became skewed toward the housing sector During the height of the boom construction employment grew 10 percent per year in these states far outpacing growth in other indus-try sectors During this time construction jobs accounted for a disproportionate 25 percent share of new jobs while representing less than 10 percent of total employment
Tipping Point Imbalances Lead to Housing Collapse Ultimately the housing boom in the Sand States proved to be mostly a mirage The first signs of trouble came in the form of sharply decelerating rates of home price appreciation Between 2003 and 2006 annual home price appreciation rates in these states had consis-tently exceeded the national average Year-over-year house price appreciation in Nevada peaked in 2004 at 37 percent In Arizona and Florida appreciation peaked in 2005 at rates more than twice the national average Since then average home prices in the four states have declined between 27 and 38 percent from their peak5
Price declines have been most severe in metropolitan markets such as Phoenix and Las Vegas which regis-tered the largest percentage declines in the nation at 34 percent and 33 percent respectively during 20086
As home prices slumped foreclosure activity rose at a startling pace While this phenomenon was occurring across the nation it was most pronounced in the Sand States According to the Mortgage Bankers Associa-tion the Sand States accounted for more than 40 percent of all mortgage foreclosures started in 2008 which is nearly double the share of mortgages held by borrowers in these four states (see Table 1) This disproportionate share of troubled mortgages in the Sand States was most acute among ARMs In 2008 these states held 46 percent of the prime ARMs outstanding nationwide and 64 percent of foreclosures started within this mortgage category
In fourth quarter 2008 foreclosure resales accounted for more than 55 percent of all California resale activity almost three times the level of a year ago Foreclosure resales were also prevalent in Las Vegas and Phoenix where this type of transaction accounted for about 71 and 65 percent respectively of house and condominium resales7
5 Federal Housing Finance Agency purchase-only index data through fourth quarter 2008 6 SampPCase-Shiller Home Price Index data as of December 2008 7 Data Quick Information Systems through wwwdqnewscom Las Vegas and Phoenix data are for February 2009
FDIC QUARTERLY 31 2009 VOLUME 3 NO 1
Table 1 Chart 1
The Sand States Account for a Disproportionately High Share of
Foreclosure Activity National Share of
Foreclosures Started
National Share of Mortgages Serviced
California Florida Arizona Nevada
192 162 44 27
129 78 27 12
Sand States Total 425 246 Source Mortgage Bankers Association
Note Data from first quarter 2008 through fourth quarter 2008 ldquoSand Statesrdquo is the aggregate of California Florida Arizona and Nevada
-20
-15
-10
-5
0
5
10
15
91 92 93 94 95 96 97 98 99 00 01 02 03 04 05 06 07 08
Year-over-Year Change in Sand State Nonfarm Employment Percent
The Construction Sector in the Sand States Has Been an Important Driver of Job Growth
Source Bureau of Labor Statistics (Haver Analytics) Note ldquoSand Statesrdquo is the aggregate of California Florida Arizona and Nevada ldquoAll Other Sectorsrdquo is the state aggregate nonfarm employment minus the construction sector
All Other Sectors Job Growth
Construction Sector Job Growth
Economic Conditions Remain Fragile as the Effects of the Housing Collapse Spread Compounding the housing-sector problems in the Sand States and elsewhere has been the virtual shutdown of private mortgage-backed securities (MBS) issuance since 2007 MBS issuance had largely financed the subprime and nontraditional lending that fueled the boom Total issuance of private MBS which had topped $1 trillion annually in both 2005 and 2006 fell precipitously thereafter totaling just over $50 billion in 2008 Meanwhile the difficulties that market partici-pants have had in valuing complex mortgage securities and the derivatives based on them have contributed to wider risk aversion in financial markets which has reached historic proportions For housing markets particularly in the credit-fueled boom markets of these four states these financial market disruptions are compounding what would in any case have been a steep and extended housing market downturn
The housing market downturn in the Sand States is now having serious ripple effects on other parts of the local economy Each of the Sand States lost jobs in 2008 The losses have been most pronounced in the construction sector which has shed more than 450000 jobs or about 24 percent between fourth quarter 2006 and fourth quarter 2008 (see Chart 1) In addition job losses have spread to the financial services and retail trade sectors Retail sales also have declined particu-larly for home improvement furniture and electronics store sales contributing to additional layoffs
Although the Sand States entered this downturn with relatively low rates of unemployment joblessness increased during 2008 to levels not seen since the 2001 recession The unemployment rates for California Florida and Nevada ranked among the top ten in the
nation as of fourth quarter 2008 While Arizonarsquos unemployment rate remained slightly below the national average as of fourth quarter 2008 it too rose markedly during the year These rising unemployment rates are due primarily to widespread job losses and to a lesser degree to additional people entering the labor force in search of employment including college gradu-ates and retirees8 Also rising unemployment claims are putting more pressure on already strained state budgets
Nonetheless a few positive albeit very preliminary signs may be emerging The volume of home sales in Arizona California and Nevada improved during 2008 relative to year-ago levels The increase in fore-closures sales is likely contributing to some renewal in sales activity In addition while a sharp decline in housing starts is eliminating construction jobs in the near term it should eventually facilitate the return to a more stable housing landscape Seasonally adjusted housing starts in the Sand States dropped 40 percent in 2007 and again in 2008 Also despite the weakened housing and labor markets population growth in Arizona California and Nevada was estimated to be above the national rate in 20089 This continued growth will be an important source of long-term hous-ing demand that will eventually help bring a measure of stability to these troubled housing markets
Authors Shayna M Olesiuk Regional Manager
Kathy R Kalser Assistant Director
8 California Employment Development Department 9 US Census estimates of state-level population growth between July 1 2007 and July 1 2008 the latest data available
FDIC QUARTERLY 32 2009 VOLUME 3 NO 1
The 2009 Economic Landscape
Financial Sector Woes Pressure the Northeast
The downturn in US housing markets that began in 2006 was arguably the catalyst for the nationrsquos ongoing recession However turmoil in the financial sector has contributed to further deterioration in the US and global economies Since 2007 a succession of financial market disturbances has heightened risk aversion and credit spreads and has severely limited the availability of credit across certain sectors of the economy These developments have placed enormous pressure on some classes of financial companies particularly those that exist outside of the regulatory umbrella and those that depend on the ability to sell loans or issue debt on the open market
The severity and duration of the recent distress has resulted in considerable job losses in the financial sector Initially job cuts were centered in residential-related financial employment such as mortgage brokers consistent with the nationrsquos housing downturn However as financial stress permeated the capital markets job losses became widespread across the finan-cial industry By fourth quarter 2008 employment in the US financial sector had declined by 24 percent from a year earlier the sharpest decline since World War II1
Retrenchment in the Nationrsquos Financial Sector Is Centered in New York Contraction in the nationrsquos financial sector is magnified in New York State and particularly New York Citymdash the nationrsquos financial center (see text box at right for the effects of financial sector contraction on other Northeast economies) Statewide the contribution of financial jobs to total wages has increased in recent years At its peak in 2007 wages from financial jobs accounted for 25 percent of statewide wages consider-ably more than their contribution at the national level (see Chart 1)
In New York City the economy ebbs and flows with fluctuations in the financial sector because the city has a large share of financial jobs Indeed the proportion of financial jobs to total employment in New York City is
Contraction in the Financial Sector Is Weighing on Other
Northeast Economies Financial employment is a major economic driver in other parts of the Northeast including some cities in New England and metropolitan areas along the East Coast Like New York these markets are vulnerable to contraction in financial employment
New Jersey particularly the metropolitan areas around New York City has a slightly higher concen-tration of financial employment than the nation In fourth quarter 2008 New Jersey lost 12500 financial jobs about 46 percent from one year ago This rate of decline was nearly double the national rate and was the largest percentage decline for the state since first quarter 1991
Boston Massachusetts and Hartford Connecticut also had high concentrations of financial sector employment at 72 percent and 117 percent respec-tively at year-end 2008 Employment in Bostonrsquos financial sector fell by 40 percent in fourth quarter 2008 the largest decline since fourth quarter 1991 Much of the decline was centered in commercial banks and securities firms although real estate employ-ment also reported job losses Employment in Hart-fordrsquos financial sector also continues to contract During the fourth quarter the arearsquos financial employ-ment declined 08 percent from one year ago
The financial sector in Charlotte North Carolina is also contracting This sector which accounted for 85 percent of the metro arearsquos total jobs in fourth quarter 2008 and 405 percent of the arearsquos economic output in 2006 (the most recent data available) has been losing jobs since mid-2007 The rate of decline rose during 2008 reaching 54 percent in the fourth quarter
Wilmington Delaware also shed financial sector jobs in the fourth quarter although the rate of loss was less than that of the nation Employment associated with credit card banking which has a substantial presence in Wilmington has been relatively steady over the past year
1 Bureau of Labor Statistics
FDIC QUARTERLY 33 2009 VOLUME 3 NO 1
Chart 1 Chart 2
5
10
15
20
25
30
90 91 92 93 94 95 96 97 98 99 00 01 02 03 04 05 06 07 08
Source Bureau of Economic Analysis (Haver Analytics) Note Financial wages are those earned in the banking insurance real estate and securities industries Data are through fourth quarter 2008 (most recent available) and are seasonally adjusted at annual rates
New York State
United States
Ratio of Financial Wages to Total Wages
New Yorkrsquos Economy Has Grown More Dependent on Financial Wages
Recessions
-20
-15
-10
-5
0
5
10
15
20
00 01 02 03 04 05 06 07 08
Source Bureau of Labor Statistics (Haver Analytics) Note Data are through fourth quarter 2008 and are not seasonally adjusted
Securities Industry - New York City
Securities Industry - Rest of the US
Employment Losses in the Securities Industry Are Centered in New York City
Year-over-Year Change
12 percent or double the national share Perhaps more important wages in the securities industry a key component of the cityrsquos financial sector account for a disproportionate share of total wages paid in the city Wages in the securities industry accounted for more than 25 percent of total wages paid in the city but the industry itself accounted for only 5 percent of total jobs Securities industry wages increased almost four times faster than wages in the rest of New York City between 2003 and 20072
As the disruption in financial markets persisted during 2008 job losses in New York Cityrsquos financial sector continued to mount The securities industry was particularly hard hit During fourth quarter 2008 the cityrsquos securities industry lost more than 9000 jobs a 48 percent decline compared with one year earlier and the worst percentage decline since second quarter 2003 (see Chart 2)
Job losses in the cityrsquos securities industry will be ampli-fied across other sectors of the economy According to the New York State Comptroller for every new job in the securities industry three additional jobs are created in New York City and its suburbs Conversely losses in the securities industry will have a ripple effect across the arearsquos economy Estimates suggest that during the 2001 recession this sector directly and indirectly
2 New York State Comptroller The Securities Industry in New York City November 2008 Data are as of 2007 The securities industrymdasha component of the broader financial industrymdashis composed of jobs classified as securities and commodities brokers portfolio managers and investment advisors This sector accounted for more than one-third of financial jobs in New York City in fourth quarter 2008
contributed to more than half of the private sector jobs lost in the city3
In addition the sharp downturn in New Yorkrsquos finan-cial sector is negatively affecting state and local tax budgets In fiscal year 2007ndash2008 tax collections from the securities industry accounted for almost 20 percent of total tax collections in New York State The New York State Comptroller estimated that state tax collec-tions from the securities industry including business and personal filings could drop by 38 percent in fiscal 20104
Job losses and reduced compensation in New York Cityrsquos financial sector are also having a detrimental effect across real estate markets Home prices in the New York City metro area declined by 92 percent on average in 2008 This year-over-year decline in home prices was the largest in the 22-year history of these data slightly exceeding the previous high recorded in March 19915 Still New York City home prices fell much less during 2008 than in some other major cities which saw double-digit declines
New York Cityrsquos commercial real estate market is also showing signs of weakness particularly in Manhattan
3 Ibid 4 Ibid 5 SampPCase-Shiller Home Price Index This index defines the New York metro area as the New York City metropolitan statistical area plus other counties in New York State Connecticut New Jersey and Penn-sylvania that are within commuting distance of New York City Declines are calculated based on the year-over-year percentage change in home prices
FDIC QUARTERLY 34 2009 VOLUME 3 NO 1
2009 Economic Landscape
The financial sector occupies as much as 30 percent of Manhattanrsquos office space6 With intensifying pressure in the financial sector office rents are dropping The arearsquos vacancy rates are also on the rise but remained below the national average at year-end 20087 However a size-able amount of office space is estimated to return to the market which may further pressure rental and vacancy rates Some estimates suggest that the percentage of available office space in Manhattan may soon rise to its highest level since 19968
New York Cityrsquos Financial Industry Has Been Resilient in Past Cycles Forecasts suggest that job losses in New York Cityrsquos financial industry will get worse before they get better A March 2009 report by the New York City Indepen-dent Budget Office states that the city could lose 51000 securities industry jobs through third quarter 2011 which would be a decline of about 27 percent from the 2008 peak9 Job losses of this magnitude would
6 Grubb and Ellis Research Office Market Trends New York City second quarter 2008 7 Torto Wheaton Research fourth quarter 2008 8 David M Levitt ldquoBanks Vacate Towers Pushing Empty NYC Space to Recordrdquo Bloombergcom February 26 2008 wwwbloombergcom appsnewspid=newsarchiveampsid=aSYcApYshDw (accessed on March 2 2009) 9 New York City Independent Budget Office Analysis of the Mayorrsquos Preliminary Budget for 2010 IBOrsquos Reestimate of the Mayorrsquos Prelimi-nary Budget for 2010 and the Financial Plan through 2013 March 2009
exceed the number of securities jobs lost in the city during either the 1990ndash91 or 2001 recession10 In addi-tion job losses in New York Cityrsquos overall financial sector are projected to reach 8980011 According to the March report job growth in the financial sector is fore-cast to resume in 2012 and 2013 but at a slow pace
Although the near-term outlook for the financial services industry in New York City remains tenuous the cityrsquos financial sector should recover as it has following every recession since World War II During its long history New Yorkrsquos financial sector has proven resilient and resurgent following periods of adversity
Authors Robert M DiChiara Regional Manager
Kathy R Kalser Assistant Director
The authors would like to thank Norman Gertner Regional Economist Division of Insurance and Research for his contributions to this article
10 FDIC analysis quarterly data from the Bureau of Labor Statistics and annual data from the Securities Industry and Financial Markets Association 11 David Belkin (senior economist New York City Independent Budget Office) in discussion with FDIC staff April 2009 regarding the Analy-sis of the Mayorrsquos Preliminary Budget for 2010 dated March 2009
FDIC QUARTERLY 35 2009 VOLUME 3 NO 1
The 2009 Economic Landscape
How Long Can Energy and Agriculture Boost the Nationrsquos Midsection
The energy and agricultural sectors are important economic drivers for states in the center of the country Extending from the oil patch of Texas Louisiana Arkansas and Oklahoma northward through the plains states and eastward to the Corn Belt the states in the nationrsquos midsection are not only rich in land and other natural resources but also tend to rely heav-ily on these resources as drivers of economic activity Booming commodity prices during the middle years of this decade have helped buoy the economies of these states even while the rest of the country was moving toward recession However recent declines in many of these same commodity prices raise concerns about wider economic repercussions for these regions as the US recession continues This article describes how commodity industries drive the economies of the nationrsquos midsection and evaluates their outlook after the commodity price boom
Energy and Agriculture Regions Do Not Always Follow the US Business Cycle Energy prices can have a profound effect on the national economy In fact since World War II nearly all recessions were preceded by oil price shocks These shocks adversely affect businesses and consumers caus-ing economic growth to slow For example around the time of the Iranian revolution in 1979 oil prices doubled within a year contributing to the 1980 and 1981ndash82 national recessions Similarly the 1990ndash91 recession was precipitated in part by another doubling of oil prices in the months following the invasion of Kuwait and leading up to the first Gulf War
Unlike the rest of the nation oil-patch states tend to benefit from higher oil prices In the early 1980s and early 1990s higher oil prices helped these states grow even during national recessions However when prices collapsed during the mid-1980s oil-patch states fell into their own regional recession The lingering effects of the ldquooil bustrdquo resulted in falling real incomes in the region The subsequent loss of jobs income and output contributed to house price declines that created turmoil
in residential real estate markets and led to hundreds of bank failures1
Like the energy sector agriculture does not move in perfect tandem with the national economy though influences from US and global trends can be strong For example global economic conditions affect the demand for food which helps drive agricultural commodity prices In addition large interest rate move-ments can have a profound effect on farmland prices For example in the early 1970s strong demand for farm commodities caused farm incomes to rise rapidly When combined with negative real interest rates this favor-able environment caused sharp increases in the value of farmland In the late 1970s however soaring interest rates and changing conditions in global supply and demand brought the boom period to an end The result was a significant decline in real farm incomes a rapid and long-lasting decline in farmland values and hundreds of farm bank failures in the 1980s2
Energy and Agriculture Boomed through Mid-Year 2008 Current energy and agricultural conditions have for the most part played out independently of national economic trends Despite the weakening US economy the health of the energy and agricultural industries has been very strong over the past several years Crude oil prices quadrupled in dollar terms between 2003 and mid-2008 setting the trend for overall energy prices This price inflation was an economic boon to oil-patch states3 During the five-year period ending in second quarter 2008 inflation-adjusted economic growth in these four states grew at an annualized rate of 36 percent
1 FDIC History of the EightiesmdashLessons for the Future (Washington DC FDIC 1997) 291ndash336 2 Ibid 259ndash290 3 While the energy discussion and analysis in this article focus on oil-patch states it should be noted that Wyoming and Montana have characteristics similar to this region Both states rely considerably on energy extraction and experienced employment growth above the national average during the period of high oil prices Wyoming in fact had one of the most vibrant economies in the nation during that time
FDIC QUARTERLY 36 2009 VOLUME 3 NO 1
2009 Economic Landscape
Chart 1 Map 1
60 70 80 90
100 110 120 130 140 150 160
Jan-80 Jan-84 Jan-88 Jan-92 Jan-96 Jan-00 Jan-04 Jan-08
Source US Department of Agriculture Note ldquoPrices received by farmersrdquo is a composite index of leading crop and livestock prices produced in the United States The prices of these commodities are ldquofarm-gaterdquo or wholesale prices
Agricultural Prices Rose Steadily from Late 2002 through Mid-2008 but Have Settled Somewhat since Then
Prices Received by Farmers Index 1990-92=100
compared with 28 percent for the nation4 The biggest impact however was on real personal income which grew at an annualized rate of 46 percent in the four oil-patch states compared with only 29 percent nationally The regionrsquos oil and gas industry not only supports a large number of high-paying jobs in the mining industry itself but also has strong indirect multiplier effects on job growth in professional and business services whole-sale and retail trade and financial activities
The agricultural sector also has performed quite well over the past few years A number of factors including global economic growth and a weaker dollar contrib-uted to an extended period of rising prices for a broad array of agricultural products Prices for these commodi-ties generally began to rise in late 2002 and many reached new highs in the past two years before moder-ating in the second half of 2008 (see Chart 1) High commodity prices have led to record net farm incomes in three of the past four years and also have contributed to significant increases in farmland values5
Ethanol production has also played an important role in both agricultural and energy markets in recent years As the price of crude oil increased from less than $26 per barrel in 2001 to more than $133 per barrel in July 2008 ethanol became a viable and very profitable alter-
4 Growth rates used in this paragraph were calculated by the FDIC using data from the US Bureau of Economic Analysis and Moodyrsquos Economycom 5 For a detailed farmland analysis see Richard D Cofer Jeffrey W Walser and Troy D Osborne ldquoDo Record Farmland Prices Portend Another Steep Downturn for Agriculture and Farm Banksrdquo FDIC Quar-terly 2 no 4 (2008) 25
The Center of the Nation Has Avoided Significant Job Losses in This Recession
Employment Growth Percent Change December 2007 - January 2009
gt0 0 to -2 -2 to -4 Source Bureau of Labor Statistics US Average -25
(Haver Analytics) lt-4
native Strong profitability government mandates on renewable fuels that supported demand and tariffs and subsidies that supported prices all led to considerable increases in ethanol output6 Indeed annual ethanol output in 2008 had grown by more than five times the levels of 20007 The growth in ethanol production in turn increased the demand for corn the primary input in the production process to a point where ethanol production is projected to use nearly 30 percent of the 2008 crop8 As farmers planted more corn to meet the higher demand from ethanol plants they reduced plant-ings of soybeans which contributed to higher prices for this commodity as well The result was record incomes for farmers and double-digit average annual increases in farmland values in corn- and soybean-producing states between 2003 and 2007
The health of the energy and agricultural sectors combined with relatively stable and affordable housing markets in the central United States has caused the national recession to largely bypass the nationrsquos midsec-tion so far (see Map 1) The energy-rich oil patch was
6 Don Hofstrand ldquoCorn-Ethanol Profitabilityrdquo AgMRC Renewable Energy Newsletter Agricultural Marketing Resource Center November December 2008 and Bruce A Babcock Center for Agricultural and Rural Development at Iowa State University statement before the US Senate Committee on Homeland Security and Government Affairs Hearing on Fuel Subsidies and Impact on Food Prices 110th Cong 2nd sess May 7 2008 7 Renewable Fuels Association Ethanol Industry Outlook 2009 8 ldquoWorld Agricultural Supply and Demand Estimatesrdquo US Department of Agriculture January 12 2009
FDIC QUARTERLY 37 2009 VOLUME 3 NO 1
the only region that added jobs after the national reces-sion began in December 2007 and Farm Belt states reported small job losses relative to the rest of the nation
The Outlook for Energy and Agriculture Has Dimmed Though the energy and agricultural sectors have provided insulation against recession for the central United States these sectors have weakened consider-ably in recent months The Energy Information Administrationrsquos (EIA) short-term energy outlook is projecting a long severe global economic slowdown that will lead to further reductions in global energy demand and additional declines in crude oil and other energy prices9 The EIA projects oil prices in 2009 to average between $40 and $50 per barrel on a quarterly basis but prices could plunge below $3010 Falling energy prices are now putting pressure on oil-patch employment growth (see Chart 2) This trend alone should not cause a repeat of the 1980s oil bust as the regionrsquos economy has become increasingly diverse since that time somewhat muting the impact of oil price movements11 However when falling energy prices are combined with a severe national recession and a global financial crisis a significant regional downturn cannot be ruled out
Declining agricultural commodity prices are also of concern A severe downward price cycle in agricultural commodities and land values that causes farm incomes and land values to fall could result in prolonged economic weakness among farm states Aggravating the situation could be a rapid and significant consolidation in the ethanol industry which was already showing weakness in mid-2008 because of overcapacity and low margins caused by high corn prices Some of the largest ethanol producers delayed the startup of ethanol plants last year and some analysts predicted that many small and medium-sized plants would shut down12 Deteriorat-ing conditions in the ethanol industry will not only
9 Energy Information Administration Short-Term Energy Outlook December 2008 10 Several leading analysts have discussed the possibility of oil prices falling below $30 per barrel in 2009 One notable example is ldquoOil May Fall Below $25 Next Year Merrill Lynch Saysrdquo Bloombergcom December 4 2008 11 Stephen PA Brown and Mine K Yucel ldquoEnergy Prices and State Economic Performancerdquo Federal Reserve Bank of Dallas Economic Review second quarter 1995 12 ldquoToo Much Ethanolrdquo Farm Industry News November 1 2008
Chart 2
$0
$20
$40
$60
$80
$100
$120
$140
$160
1995 1997 1999 2001 2003 2005 2007 2009 -2
-1
0
1
2
3
4
5
The Recent Downturn in Oil Prices Appears to Spell the End of the Growth Period in Oil-Patch Employment
Sources Wall Street Journal Bureau of Labor Statistics (Haver Analytics) FDIC
Year-over-Year Employment Growth Oil-Patch States
Dollars per Barrel (2008 dollars)
weigh on crop prices but are also likely to affect farmers and rural communities who have come to rely on the industry for high-paying jobs
Though the economies in the nationrsquos midsection continue to perform well relative to the nation the downward trends in the energy and agricultural sectors may weigh on the region in the near future Moderating commodity prices are likely to put a damper on the arearsquos economic conditions and the region may not only cease to be a source of economic strength but also could enter recession at a much later stage than the nation
Authors Adrian R Sanchez Regional Economist
John M Anderlik Assistant Director
FDIC QUARTERLY 38 2009 VOLUME 3 NO 1

The 2009 Economic Landscape
Recession Adds to Long-Term Manufacturing Challenges in the Industrial Midwest
The manufacturing sector has long been a primary economic driver of the Industrial Midwest1 This region which comprises eight states in the north-central United States is known for its durable goods manufac-turing a sector that includes the production of automo-biles and other types of heavy machinery The emphasis on manufacturing has posed challenges for the region as the sector has contracted This article discusses manu-facturing trends in the Industrial Midwest particularly with respect to the troubled auto sector and the economic outlook for the region
The Industrial Midwest Has Not Recovered from the Last Recession The US manufacturing sector has struggled throughout this decade Historically nationwide manufacturing-related employment has tended to decline a few quarters before the US economy contracts and then recover in tandem with the broader economy However job growth in the US manufacturing sector did not
1 In this article the Industrial Midwest is defined as the region encom-passing Indiana Wisconsin Michigan Ohio Iowa Kentucky Minne-sota and Illinois
Chart 1
rebound after the 2001 recession even while overall US economic growth was strong (see Chart 1)2
These manufacturing weaknesses have had a dispropor-tionate effect on the Industrial Midwest economy In each state in the region manufacturing employment as a percentage of total employment is higher than the nationrsquos Moreover Indiana Wisconsin Michigan and Ohio have the highest concentrations of manufacturing employment in the country3 Because of its reliance on manufacturing during a period of weakness in this sector total employment in the region has yet to return to pre-2001 levels (see Chart 2)
Two long-term issues are adversely affecting manufac-turing in the Industrial Midwest First over the past two decades much of the regionrsquos manufacturing base has
2 The trend of outsourcing may contribute to overcounting of manu-facturing job losses As manufacturers ldquopurchaserdquo a growing number of services the value of which is ultimately embedded in product value manufacturing employment levels may have simply shifted to service industry sectors See ldquoIs Manufacturing at a Crossroadsrdquo Chicago Fed Letter Number 204a July 2004 3 Bureau of Labor Statistics December 31 2008 Manufacturing concentrations are defined as durable goods manufacturing and wholesale trade jobs as a percentage of total nonfarm payrolls
-10
-5
0
5
10
Q1-79 Q1-83 Q1-87 Q1-91 Q1-95 Q1-99 Q1-03 Q1-07 -10
-5
0
5
10
Sources Bureau of Economic Analysis Bureau of Labor Statistics (Haver Analytics) Note Data are seasonally adjusted Shaded areas denote US recessions
Manufacturing Employment Year-to-Year Percent Change
US Manufacturing Employment Did Not Rebound following the 2001 Recession Real GDP
Quarterly Percent Change at an Annual Rate
FDIC QUARTERLY 27 2009 VOLUME 3 NO 1
Chart 2 Chart 3
States in the Industrial Midwest Began Contracting before the Current National Recession
90
95
100
0 2 4 6 8 10 12 14 16 18 20 22 24 26 28 30
Recent Cyclical Job Losses in the Industrial Midwest Have Proven to Be Long-Lived
Indexed Total Employment Seasonally Adjusted Prior Peak=100
Source Bureau of Labor Statistics (Haver Analytics)
Quarters since Peak
2007-08 1990-92
2000-07
1979-86
been lost to competition both foreign and domestic Second technological improvements in US factories have led to much higher productivity levels4 These productivity advances have been brought about by capi-tal investments that require fewer low-skilled workers
More recently the erosion of market share and struc-tural cost problems at General Motors (GM) Chrysler and Ford have led to large-scale restructurings and job losses These challenges at US automakers have contributed to the loss of more than 140000 manufac-turing jobs since 20055 Hundreds of thousands of addi-tional workers at auto assembly plants and auto parts suppliers could potentially lose their jobs during the current downturn6
Auto sector layoffs have disproportionately affected Michigan Ohio and Indiana the states most exposed to the troubled auto sector These states were essentially in recession before the nation as a whole with Michi-gan preceding the national downturn by more than three years (see Chart 3) Michigan is the state most heavily concentrated in auto manufacturing with the most motor vehicle manufacturing jobs and the highest
4 Bureau of Labor Statistics From 2002 to 2006 US manufacturing multifactor productivity growthmdashthe increase in the ratio of goods output to labor capital and other inputsmdashaveraged 22 percent well above the 30-year average of 14 percent 5 The figure cited refers to job losses in the transportation manufactur-ing sector of the Industrial Midwest through 2008 These job losses have occurred mostly at auto parts suppliers and automakers 6 See CAR Research Memorandum The Impact on the US Economy of a Major Contraction of the Detroit Three Automakers Center for Automotive Research November 4 2008
Minnesota +4 months
Illinois+1 month Iowa +1 month
Kentucky -1 month
Indiana -3 months
Wisconsin -6 months
Ohio -6 monthsMichigan -37 months
-40 -30 -20 -10 0 10 Number of Months Selected States Entered Recession
before (-) or after (+) the Nation Source Moodyrsquos Economycom
number and proportion of direct and indirect jobs connected to motor vehicle parts production7
Employment Weakness Has Also Spilled into the Regionrsquos Housing Markets Although the Industrial Midwest did not experience the significant home price appreciation of the post-2001 housing boom to the same degree as other regions its residential real estate markets have still suffered Existing home sales in the Industrial Midwest declined 33 percent from their second quarter 2005 peak roughly in line with the nationwide decline8 In 2008 home prices fell in all of the regionrsquos states led by Michigan where prices declined by more than 10 percent9 Further in half of the Industrial Midwest states foreclosure rates are at or slightly higher than the national rate10
Weak housing markets have in turn adversely affected the regionrsquos construction industry Construction employment was virtually unchanged across the Indus-trial Midwest from 2003 through 2006 while it grew more than 10 percent nationwide Since 2006 the construction sector in the Industrial Midwest has declined by 77 percent or 96000 jobs
7 Contribution of the Motor Vehicle Supplier Sector to the Economies of the United States and Its 50 States Center for Automotive Research January 2007 8 National Association of Realtors data available as of fourth quarter 2008 9 Based on the Federal Housing Finance Agency Purchase-Only House Price Index 10 Mortgage Bankers Association fourth quarter 2008
FDIC QUARTERLY 28 2009 VOLUME 3 NO 1
2009 Economic Landscape
The Industrial Midwest Faces a Potentially Long Road to Recovery Employment in the Industrial Midwest has declined substantially during the current downturn and the near-term outlook for Detroitrsquos auto industry remains unclear Automakers have been shrinking their busi-nesses to match reduced market share In addition financial press reports and analytical studies indicate that hundreds of thousands of jobs are potentially at stake as Chrysler and GM continue to negotiate restructuring plans with the Obama administrationrsquos auto task force Though foreign-based automakers with production facilities in the region might increase output to partially offset this gap their new hiring likely would not fully absorb jobs shed by Detroit automakers
Two other economic indicators also point to a prolonged path to recovery First the outlook for the metal fabrication and machinery manufacturing indus-tries has diminished These industries which include companies involved in the transformation of metal into intermediate or final products and the production of machines used in industrial applications provided some economic stability to the Industrial Midwest following the last recession However the weakening national economy has softened demand for their products Nationally investment in machinery and other fixed assets has slowed consistently since mid-2007 and fell 21 percent during fourth quarter 200811 As a result employment in fabrication and machinery manufactur-ing in the region declined 14 percent or about 13000 jobs in 2008
Second contraction or slowing growth in the econo-mies of US trading partners will likely limit future export opportunities that had provided a counterbal-ance to the weakened auto sector over the past few years Exports rose 13 percent and 11 percent respec-tively in 2006 and 2007 benefiting from strong foreign demand and a decline in the value of the dollar However the economies of foreign trading partners are now slowing or contracting and the decline in the dollar has reversed direction returning to trade-weighted levels not seen since 200612
A more positive outlook for the region hinges in no small part on the success of federal government initia-tives directed at stimulating the economy in general and the auto sector in particular Spending on infrastructure projects should generate new jobs while other provi-sions of the $787 billion American Recovery and Rein-vestment Act are intended to maintain existing jobs However most of the affected jobs will be outside of the manufacturing sector While employment will likely continue to decline in the automotive sector it is likely that fewer jobs would be lost under a government-assisted restructuring than would occur otherwise Over the long term job growth is likely to become more dependent on emerging and expanding industries such as those found in the energy education and health care sectors
Authors Patrick M Dervin Regional Economist
John M Anderlik Assistant Director
12 The Blue Chip Economic Indicators consensus forecast as of December 2008 calls for a 01 percent decline in Canadarsquos GDP in 2009 and only a 02 percent increase in Mexicorsquos GDP Growth in China one of the fastest growing export markets is expected to slow from 95 percent in 2008 to 76 percent in 2009 well below trend
11 Bureau of Economic Analysis seasonally adjusted annualized growth in real private nonresidential fixed investment
FDIC QUARTERLY 29 2009 VOLUME 3 NO 1
The 2009 Economic Landscape
The Sand States Anatomy of a Perfect Housing-Market Storm
The historic boom and subsequent decline in the nationrsquos housing market has been a defining feature of the current recession The housing downturn has been most acute in four statesmdashArizona California Florida and Nevadamdash that had experienced some of the highest rates of home price appreciation in the first half of the decade While these states are not all contiguously located their similar housing cycles and abundance of either beaches or deserts have led some analysts to label them ldquoSand Statesrdquo This article discusses the factors that led to an expanding housing sector in these states and the market imbalances that culminated in a sharp correction in home prices The article also explores the ripple effects that the hous-ing downturn has had on the local economies
Rapid Population Growth in the Sand States Propelled Housing Markets For many years rapid population growth in the Sand States spurred higher than average rates of home construction Favorable weather and relatively afford-able housing are two factors that attracted retirees as well as younger families to these states In the 1980s and 1990s population growth rates in Arizona Florida and Nevada were between two and four times the national rate Certain parts of California such as the RiversidendashSan Bernardino metropolitan area experi-enced similarly high rates of population growth Rapid population growth continued into the early years of this decade From 2004 to 2007 Arizona and Nevada ranked as the two fastest growing states in the nation followed closely by Florida which ranked ninth1
The influx of new residents into Arizona Florida and Nevada also contributed to strong employment growth Job creation in these states frequently outpaced the rest of the nation during the past few decades From 2000 to 2006 these states repeatedly ranked among the top ten for job growth far exceeding the national average California generally reported job growth similar to the national average during this period although the state was hit hard by the dot-com recession from mid-2001 to 2003
1 US Census Bureau
Affordability Mortgages Contributed to Housing Imbalances During this decade strong demand for housing supported by a growing population and an expanding economy contributed to growing housing market imbalances across the Sand States Perhaps the best measure of the imbalances that accumulated in boom-ing housing markets during this decade was the rela-tionship between home prices and incomes In the years leading up to the housing downturn escalating home prices far outpaced income growth For example in 2003 housing in Nevada was considered relatively affordable both in absolute terms and as compared to other states According to one analysis a family earning the median income in Nevada in 2003 could afford a home that was priced approximately 20 percent above the median house price in the state using traditional mortgage financing2 However by late 2005 home prices had risen so much that a family earning the median income could only afford a home priced at 24 percent below the statersquos median price
A combination of factors drove the housing sector imbalances in the Sand States to unprecedented levels Under normal market conditions strained affordability tends to limit housing demand because fewer house-holds can purchase a home using traditional mortgage financing However in this cycle new mortgage ldquoafford-abilityrdquo products were commonly used to finance home purchases Besides traditional adjustable-rate mortgages (ARMs) affordability products included hybrid ARMs which have a low fixed interest rate for several years followed by a market rate that is frequently much higher Affordability products also comprised the so-called nontraditional mortgage products which included interest-only loans where amortization of prin-cipal was not required during the first few years of the
2 Moodyrsquos Economycom Affordability Index The calculation assumes a 30-year maturity and a down payment of 20 percent It also assumes that the monthly principal and interest payments do not exceed 25 percent of the median family income To interpret the indices a value of 100 means that the family earning the median income can afford only 100 percent of the traditional mortgage payment of the median-priced home taking into consideration the 20 percent down payment
FDIC QUARTERLY 30 2009 VOLUME 3 NO 1
2009 Economic Landscape
loan negative-amortization loans that offered initial payments well below the amount required to cover interest and amortize principal and balloon payment loans which typically required a large lump-sum payment at the end of the loan Unlike subprime mort-gage products that were designed for home buyers with limited or weaker credit histories these nontraditional mortgages were marketed broadly and often used by first-time home buyers and investors who did not provide a down payment In addition originators of these products frequently did not require buyers to verify that their income could support the mortgage payments
By 2006 nearly half of total US originations of privately securitized affordability mortgages were made in the four Sand States alone Moreover the proportion of these mortgages originated in these states including nontradi-tional mortgages rose as home prices escalated During 2002 these products accounted for roughly half of the privately securitized mortgage originations in each of the Sand States comparable to the rest of the nation By 2006 however the proportion of these products had increased to 80 percent of privately securitized mortgage originations Nationwide the percentage was about 70 percent3
The increased presence of speculators or investors in the Sand States also contributed to growing imbalances in the housing sector Data from mortgage servicers indicate that nonowner investor and second-home mortgage originations increased noticeably in Arizona Florida and Nevada between 2000 and 20054 Investor and second-home purchases tended to be more heavily concentrated in major metropolitan areas in these states such as Las Vegas West Palm Beach Miami and Phoenix
Strong housing demand coupled with escalating home prices served as a dual incentive for builders to increase the supply of homes arguably at a rate that exceeded short-term demand New home construction started to accelerate in 2002 and over the next three years housing starts in these four states increased an average of 11 percent annually or about twice the rate of increase elsewhere in the nation Housing construction in the Sand States far outpaced annual growth in the number of households which peaked at 16 percent in 2004 and 2005
3 Data are from Loan Performance Affordability mortgage products include ARM loans interest-only loans negative amortization mortgages balloon loans and hybrid ARMs Affordability originations are measured as a percentage of privately securitized origination first liens only 4 In contrast California had less investor activity during the period likely because the median home price in the state was relatively high resulting in a less attractive rate of return for potential investors
Labor market imbalances also arose as job growth became skewed toward the housing sector During the height of the boom construction employment grew 10 percent per year in these states far outpacing growth in other indus-try sectors During this time construction jobs accounted for a disproportionate 25 percent share of new jobs while representing less than 10 percent of total employment
Tipping Point Imbalances Lead to Housing Collapse Ultimately the housing boom in the Sand States proved to be mostly a mirage The first signs of trouble came in the form of sharply decelerating rates of home price appreciation Between 2003 and 2006 annual home price appreciation rates in these states had consis-tently exceeded the national average Year-over-year house price appreciation in Nevada peaked in 2004 at 37 percent In Arizona and Florida appreciation peaked in 2005 at rates more than twice the national average Since then average home prices in the four states have declined between 27 and 38 percent from their peak5
Price declines have been most severe in metropolitan markets such as Phoenix and Las Vegas which regis-tered the largest percentage declines in the nation at 34 percent and 33 percent respectively during 20086
As home prices slumped foreclosure activity rose at a startling pace While this phenomenon was occurring across the nation it was most pronounced in the Sand States According to the Mortgage Bankers Associa-tion the Sand States accounted for more than 40 percent of all mortgage foreclosures started in 2008 which is nearly double the share of mortgages held by borrowers in these four states (see Table 1) This disproportionate share of troubled mortgages in the Sand States was most acute among ARMs In 2008 these states held 46 percent of the prime ARMs outstanding nationwide and 64 percent of foreclosures started within this mortgage category
In fourth quarter 2008 foreclosure resales accounted for more than 55 percent of all California resale activity almost three times the level of a year ago Foreclosure resales were also prevalent in Las Vegas and Phoenix where this type of transaction accounted for about 71 and 65 percent respectively of house and condominium resales7
5 Federal Housing Finance Agency purchase-only index data through fourth quarter 2008 6 SampPCase-Shiller Home Price Index data as of December 2008 7 Data Quick Information Systems through wwwdqnewscom Las Vegas and Phoenix data are for February 2009
FDIC QUARTERLY 31 2009 VOLUME 3 NO 1
Table 1 Chart 1
The Sand States Account for a Disproportionately High Share of
Foreclosure Activity National Share of
Foreclosures Started
National Share of Mortgages Serviced
California Florida Arizona Nevada
192 162 44 27
129 78 27 12
Sand States Total 425 246 Source Mortgage Bankers Association
Note Data from first quarter 2008 through fourth quarter 2008 ldquoSand Statesrdquo is the aggregate of California Florida Arizona and Nevada
-20
-15
-10
-5
0
5
10
15
91 92 93 94 95 96 97 98 99 00 01 02 03 04 05 06 07 08
Year-over-Year Change in Sand State Nonfarm Employment Percent
The Construction Sector in the Sand States Has Been an Important Driver of Job Growth
Source Bureau of Labor Statistics (Haver Analytics) Note ldquoSand Statesrdquo is the aggregate of California Florida Arizona and Nevada ldquoAll Other Sectorsrdquo is the state aggregate nonfarm employment minus the construction sector
All Other Sectors Job Growth
Construction Sector Job Growth
Economic Conditions Remain Fragile as the Effects of the Housing Collapse Spread Compounding the housing-sector problems in the Sand States and elsewhere has been the virtual shutdown of private mortgage-backed securities (MBS) issuance since 2007 MBS issuance had largely financed the subprime and nontraditional lending that fueled the boom Total issuance of private MBS which had topped $1 trillion annually in both 2005 and 2006 fell precipitously thereafter totaling just over $50 billion in 2008 Meanwhile the difficulties that market partici-pants have had in valuing complex mortgage securities and the derivatives based on them have contributed to wider risk aversion in financial markets which has reached historic proportions For housing markets particularly in the credit-fueled boom markets of these four states these financial market disruptions are compounding what would in any case have been a steep and extended housing market downturn
The housing market downturn in the Sand States is now having serious ripple effects on other parts of the local economy Each of the Sand States lost jobs in 2008 The losses have been most pronounced in the construction sector which has shed more than 450000 jobs or about 24 percent between fourth quarter 2006 and fourth quarter 2008 (see Chart 1) In addition job losses have spread to the financial services and retail trade sectors Retail sales also have declined particu-larly for home improvement furniture and electronics store sales contributing to additional layoffs
Although the Sand States entered this downturn with relatively low rates of unemployment joblessness increased during 2008 to levels not seen since the 2001 recession The unemployment rates for California Florida and Nevada ranked among the top ten in the
nation as of fourth quarter 2008 While Arizonarsquos unemployment rate remained slightly below the national average as of fourth quarter 2008 it too rose markedly during the year These rising unemployment rates are due primarily to widespread job losses and to a lesser degree to additional people entering the labor force in search of employment including college gradu-ates and retirees8 Also rising unemployment claims are putting more pressure on already strained state budgets
Nonetheless a few positive albeit very preliminary signs may be emerging The volume of home sales in Arizona California and Nevada improved during 2008 relative to year-ago levels The increase in fore-closures sales is likely contributing to some renewal in sales activity In addition while a sharp decline in housing starts is eliminating construction jobs in the near term it should eventually facilitate the return to a more stable housing landscape Seasonally adjusted housing starts in the Sand States dropped 40 percent in 2007 and again in 2008 Also despite the weakened housing and labor markets population growth in Arizona California and Nevada was estimated to be above the national rate in 20089 This continued growth will be an important source of long-term hous-ing demand that will eventually help bring a measure of stability to these troubled housing markets
Authors Shayna M Olesiuk Regional Manager
Kathy R Kalser Assistant Director
8 California Employment Development Department 9 US Census estimates of state-level population growth between July 1 2007 and July 1 2008 the latest data available
FDIC QUARTERLY 32 2009 VOLUME 3 NO 1
The 2009 Economic Landscape
Financial Sector Woes Pressure the Northeast
The downturn in US housing markets that began in 2006 was arguably the catalyst for the nationrsquos ongoing recession However turmoil in the financial sector has contributed to further deterioration in the US and global economies Since 2007 a succession of financial market disturbances has heightened risk aversion and credit spreads and has severely limited the availability of credit across certain sectors of the economy These developments have placed enormous pressure on some classes of financial companies particularly those that exist outside of the regulatory umbrella and those that depend on the ability to sell loans or issue debt on the open market
The severity and duration of the recent distress has resulted in considerable job losses in the financial sector Initially job cuts were centered in residential-related financial employment such as mortgage brokers consistent with the nationrsquos housing downturn However as financial stress permeated the capital markets job losses became widespread across the finan-cial industry By fourth quarter 2008 employment in the US financial sector had declined by 24 percent from a year earlier the sharpest decline since World War II1
Retrenchment in the Nationrsquos Financial Sector Is Centered in New York Contraction in the nationrsquos financial sector is magnified in New York State and particularly New York Citymdash the nationrsquos financial center (see text box at right for the effects of financial sector contraction on other Northeast economies) Statewide the contribution of financial jobs to total wages has increased in recent years At its peak in 2007 wages from financial jobs accounted for 25 percent of statewide wages consider-ably more than their contribution at the national level (see Chart 1)
In New York City the economy ebbs and flows with fluctuations in the financial sector because the city has a large share of financial jobs Indeed the proportion of financial jobs to total employment in New York City is
Contraction in the Financial Sector Is Weighing on Other
Northeast Economies Financial employment is a major economic driver in other parts of the Northeast including some cities in New England and metropolitan areas along the East Coast Like New York these markets are vulnerable to contraction in financial employment
New Jersey particularly the metropolitan areas around New York City has a slightly higher concen-tration of financial employment than the nation In fourth quarter 2008 New Jersey lost 12500 financial jobs about 46 percent from one year ago This rate of decline was nearly double the national rate and was the largest percentage decline for the state since first quarter 1991
Boston Massachusetts and Hartford Connecticut also had high concentrations of financial sector employment at 72 percent and 117 percent respec-tively at year-end 2008 Employment in Bostonrsquos financial sector fell by 40 percent in fourth quarter 2008 the largest decline since fourth quarter 1991 Much of the decline was centered in commercial banks and securities firms although real estate employ-ment also reported job losses Employment in Hart-fordrsquos financial sector also continues to contract During the fourth quarter the arearsquos financial employ-ment declined 08 percent from one year ago
The financial sector in Charlotte North Carolina is also contracting This sector which accounted for 85 percent of the metro arearsquos total jobs in fourth quarter 2008 and 405 percent of the arearsquos economic output in 2006 (the most recent data available) has been losing jobs since mid-2007 The rate of decline rose during 2008 reaching 54 percent in the fourth quarter
Wilmington Delaware also shed financial sector jobs in the fourth quarter although the rate of loss was less than that of the nation Employment associated with credit card banking which has a substantial presence in Wilmington has been relatively steady over the past year
1 Bureau of Labor Statistics
FDIC QUARTERLY 33 2009 VOLUME 3 NO 1
Chart 1 Chart 2
5
10
15
20
25
30
90 91 92 93 94 95 96 97 98 99 00 01 02 03 04 05 06 07 08
Source Bureau of Economic Analysis (Haver Analytics) Note Financial wages are those earned in the banking insurance real estate and securities industries Data are through fourth quarter 2008 (most recent available) and are seasonally adjusted at annual rates
New York State
United States
Ratio of Financial Wages to Total Wages
New Yorkrsquos Economy Has Grown More Dependent on Financial Wages
Recessions
-20
-15
-10
-5
0
5
10
15
20
00 01 02 03 04 05 06 07 08
Source Bureau of Labor Statistics (Haver Analytics) Note Data are through fourth quarter 2008 and are not seasonally adjusted
Securities Industry - New York City
Securities Industry - Rest of the US
Employment Losses in the Securities Industry Are Centered in New York City
Year-over-Year Change
12 percent or double the national share Perhaps more important wages in the securities industry a key component of the cityrsquos financial sector account for a disproportionate share of total wages paid in the city Wages in the securities industry accounted for more than 25 percent of total wages paid in the city but the industry itself accounted for only 5 percent of total jobs Securities industry wages increased almost four times faster than wages in the rest of New York City between 2003 and 20072
As the disruption in financial markets persisted during 2008 job losses in New York Cityrsquos financial sector continued to mount The securities industry was particularly hard hit During fourth quarter 2008 the cityrsquos securities industry lost more than 9000 jobs a 48 percent decline compared with one year earlier and the worst percentage decline since second quarter 2003 (see Chart 2)
Job losses in the cityrsquos securities industry will be ampli-fied across other sectors of the economy According to the New York State Comptroller for every new job in the securities industry three additional jobs are created in New York City and its suburbs Conversely losses in the securities industry will have a ripple effect across the arearsquos economy Estimates suggest that during the 2001 recession this sector directly and indirectly
2 New York State Comptroller The Securities Industry in New York City November 2008 Data are as of 2007 The securities industrymdasha component of the broader financial industrymdashis composed of jobs classified as securities and commodities brokers portfolio managers and investment advisors This sector accounted for more than one-third of financial jobs in New York City in fourth quarter 2008
contributed to more than half of the private sector jobs lost in the city3
In addition the sharp downturn in New Yorkrsquos finan-cial sector is negatively affecting state and local tax budgets In fiscal year 2007ndash2008 tax collections from the securities industry accounted for almost 20 percent of total tax collections in New York State The New York State Comptroller estimated that state tax collec-tions from the securities industry including business and personal filings could drop by 38 percent in fiscal 20104
Job losses and reduced compensation in New York Cityrsquos financial sector are also having a detrimental effect across real estate markets Home prices in the New York City metro area declined by 92 percent on average in 2008 This year-over-year decline in home prices was the largest in the 22-year history of these data slightly exceeding the previous high recorded in March 19915 Still New York City home prices fell much less during 2008 than in some other major cities which saw double-digit declines
New York Cityrsquos commercial real estate market is also showing signs of weakness particularly in Manhattan
3 Ibid 4 Ibid 5 SampPCase-Shiller Home Price Index This index defines the New York metro area as the New York City metropolitan statistical area plus other counties in New York State Connecticut New Jersey and Penn-sylvania that are within commuting distance of New York City Declines are calculated based on the year-over-year percentage change in home prices
FDIC QUARTERLY 34 2009 VOLUME 3 NO 1
2009 Economic Landscape
The financial sector occupies as much as 30 percent of Manhattanrsquos office space6 With intensifying pressure in the financial sector office rents are dropping The arearsquos vacancy rates are also on the rise but remained below the national average at year-end 20087 However a size-able amount of office space is estimated to return to the market which may further pressure rental and vacancy rates Some estimates suggest that the percentage of available office space in Manhattan may soon rise to its highest level since 19968
New York Cityrsquos Financial Industry Has Been Resilient in Past Cycles Forecasts suggest that job losses in New York Cityrsquos financial industry will get worse before they get better A March 2009 report by the New York City Indepen-dent Budget Office states that the city could lose 51000 securities industry jobs through third quarter 2011 which would be a decline of about 27 percent from the 2008 peak9 Job losses of this magnitude would
6 Grubb and Ellis Research Office Market Trends New York City second quarter 2008 7 Torto Wheaton Research fourth quarter 2008 8 David M Levitt ldquoBanks Vacate Towers Pushing Empty NYC Space to Recordrdquo Bloombergcom February 26 2008 wwwbloombergcom appsnewspid=newsarchiveampsid=aSYcApYshDw (accessed on March 2 2009) 9 New York City Independent Budget Office Analysis of the Mayorrsquos Preliminary Budget for 2010 IBOrsquos Reestimate of the Mayorrsquos Prelimi-nary Budget for 2010 and the Financial Plan through 2013 March 2009
exceed the number of securities jobs lost in the city during either the 1990ndash91 or 2001 recession10 In addi-tion job losses in New York Cityrsquos overall financial sector are projected to reach 8980011 According to the March report job growth in the financial sector is fore-cast to resume in 2012 and 2013 but at a slow pace
Although the near-term outlook for the financial services industry in New York City remains tenuous the cityrsquos financial sector should recover as it has following every recession since World War II During its long history New Yorkrsquos financial sector has proven resilient and resurgent following periods of adversity
Authors Robert M DiChiara Regional Manager
Kathy R Kalser Assistant Director
The authors would like to thank Norman Gertner Regional Economist Division of Insurance and Research for his contributions to this article
10 FDIC analysis quarterly data from the Bureau of Labor Statistics and annual data from the Securities Industry and Financial Markets Association 11 David Belkin (senior economist New York City Independent Budget Office) in discussion with FDIC staff April 2009 regarding the Analy-sis of the Mayorrsquos Preliminary Budget for 2010 dated March 2009
FDIC QUARTERLY 35 2009 VOLUME 3 NO 1
The 2009 Economic Landscape
How Long Can Energy and Agriculture Boost the Nationrsquos Midsection
The energy and agricultural sectors are important economic drivers for states in the center of the country Extending from the oil patch of Texas Louisiana Arkansas and Oklahoma northward through the plains states and eastward to the Corn Belt the states in the nationrsquos midsection are not only rich in land and other natural resources but also tend to rely heav-ily on these resources as drivers of economic activity Booming commodity prices during the middle years of this decade have helped buoy the economies of these states even while the rest of the country was moving toward recession However recent declines in many of these same commodity prices raise concerns about wider economic repercussions for these regions as the US recession continues This article describes how commodity industries drive the economies of the nationrsquos midsection and evaluates their outlook after the commodity price boom
Energy and Agriculture Regions Do Not Always Follow the US Business Cycle Energy prices can have a profound effect on the national economy In fact since World War II nearly all recessions were preceded by oil price shocks These shocks adversely affect businesses and consumers caus-ing economic growth to slow For example around the time of the Iranian revolution in 1979 oil prices doubled within a year contributing to the 1980 and 1981ndash82 national recessions Similarly the 1990ndash91 recession was precipitated in part by another doubling of oil prices in the months following the invasion of Kuwait and leading up to the first Gulf War
Unlike the rest of the nation oil-patch states tend to benefit from higher oil prices In the early 1980s and early 1990s higher oil prices helped these states grow even during national recessions However when prices collapsed during the mid-1980s oil-patch states fell into their own regional recession The lingering effects of the ldquooil bustrdquo resulted in falling real incomes in the region The subsequent loss of jobs income and output contributed to house price declines that created turmoil
in residential real estate markets and led to hundreds of bank failures1
Like the energy sector agriculture does not move in perfect tandem with the national economy though influences from US and global trends can be strong For example global economic conditions affect the demand for food which helps drive agricultural commodity prices In addition large interest rate move-ments can have a profound effect on farmland prices For example in the early 1970s strong demand for farm commodities caused farm incomes to rise rapidly When combined with negative real interest rates this favor-able environment caused sharp increases in the value of farmland In the late 1970s however soaring interest rates and changing conditions in global supply and demand brought the boom period to an end The result was a significant decline in real farm incomes a rapid and long-lasting decline in farmland values and hundreds of farm bank failures in the 1980s2
Energy and Agriculture Boomed through Mid-Year 2008 Current energy and agricultural conditions have for the most part played out independently of national economic trends Despite the weakening US economy the health of the energy and agricultural industries has been very strong over the past several years Crude oil prices quadrupled in dollar terms between 2003 and mid-2008 setting the trend for overall energy prices This price inflation was an economic boon to oil-patch states3 During the five-year period ending in second quarter 2008 inflation-adjusted economic growth in these four states grew at an annualized rate of 36 percent
1 FDIC History of the EightiesmdashLessons for the Future (Washington DC FDIC 1997) 291ndash336 2 Ibid 259ndash290 3 While the energy discussion and analysis in this article focus on oil-patch states it should be noted that Wyoming and Montana have characteristics similar to this region Both states rely considerably on energy extraction and experienced employment growth above the national average during the period of high oil prices Wyoming in fact had one of the most vibrant economies in the nation during that time
FDIC QUARTERLY 36 2009 VOLUME 3 NO 1
2009 Economic Landscape
Chart 1 Map 1
60 70 80 90
100 110 120 130 140 150 160
Jan-80 Jan-84 Jan-88 Jan-92 Jan-96 Jan-00 Jan-04 Jan-08
Source US Department of Agriculture Note ldquoPrices received by farmersrdquo is a composite index of leading crop and livestock prices produced in the United States The prices of these commodities are ldquofarm-gaterdquo or wholesale prices
Agricultural Prices Rose Steadily from Late 2002 through Mid-2008 but Have Settled Somewhat since Then
Prices Received by Farmers Index 1990-92=100
compared with 28 percent for the nation4 The biggest impact however was on real personal income which grew at an annualized rate of 46 percent in the four oil-patch states compared with only 29 percent nationally The regionrsquos oil and gas industry not only supports a large number of high-paying jobs in the mining industry itself but also has strong indirect multiplier effects on job growth in professional and business services whole-sale and retail trade and financial activities
The agricultural sector also has performed quite well over the past few years A number of factors including global economic growth and a weaker dollar contrib-uted to an extended period of rising prices for a broad array of agricultural products Prices for these commodi-ties generally began to rise in late 2002 and many reached new highs in the past two years before moder-ating in the second half of 2008 (see Chart 1) High commodity prices have led to record net farm incomes in three of the past four years and also have contributed to significant increases in farmland values5
Ethanol production has also played an important role in both agricultural and energy markets in recent years As the price of crude oil increased from less than $26 per barrel in 2001 to more than $133 per barrel in July 2008 ethanol became a viable and very profitable alter-
4 Growth rates used in this paragraph were calculated by the FDIC using data from the US Bureau of Economic Analysis and Moodyrsquos Economycom 5 For a detailed farmland analysis see Richard D Cofer Jeffrey W Walser and Troy D Osborne ldquoDo Record Farmland Prices Portend Another Steep Downturn for Agriculture and Farm Banksrdquo FDIC Quar-terly 2 no 4 (2008) 25
The Center of the Nation Has Avoided Significant Job Losses in This Recession
Employment Growth Percent Change December 2007 - January 2009
gt0 0 to -2 -2 to -4 Source Bureau of Labor Statistics US Average -25
(Haver Analytics) lt-4
native Strong profitability government mandates on renewable fuels that supported demand and tariffs and subsidies that supported prices all led to considerable increases in ethanol output6 Indeed annual ethanol output in 2008 had grown by more than five times the levels of 20007 The growth in ethanol production in turn increased the demand for corn the primary input in the production process to a point where ethanol production is projected to use nearly 30 percent of the 2008 crop8 As farmers planted more corn to meet the higher demand from ethanol plants they reduced plant-ings of soybeans which contributed to higher prices for this commodity as well The result was record incomes for farmers and double-digit average annual increases in farmland values in corn- and soybean-producing states between 2003 and 2007
The health of the energy and agricultural sectors combined with relatively stable and affordable housing markets in the central United States has caused the national recession to largely bypass the nationrsquos midsec-tion so far (see Map 1) The energy-rich oil patch was
6 Don Hofstrand ldquoCorn-Ethanol Profitabilityrdquo AgMRC Renewable Energy Newsletter Agricultural Marketing Resource Center November December 2008 and Bruce A Babcock Center for Agricultural and Rural Development at Iowa State University statement before the US Senate Committee on Homeland Security and Government Affairs Hearing on Fuel Subsidies and Impact on Food Prices 110th Cong 2nd sess May 7 2008 7 Renewable Fuels Association Ethanol Industry Outlook 2009 8 ldquoWorld Agricultural Supply and Demand Estimatesrdquo US Department of Agriculture January 12 2009
FDIC QUARTERLY 37 2009 VOLUME 3 NO 1
the only region that added jobs after the national reces-sion began in December 2007 and Farm Belt states reported small job losses relative to the rest of the nation
The Outlook for Energy and Agriculture Has Dimmed Though the energy and agricultural sectors have provided insulation against recession for the central United States these sectors have weakened consider-ably in recent months The Energy Information Administrationrsquos (EIA) short-term energy outlook is projecting a long severe global economic slowdown that will lead to further reductions in global energy demand and additional declines in crude oil and other energy prices9 The EIA projects oil prices in 2009 to average between $40 and $50 per barrel on a quarterly basis but prices could plunge below $3010 Falling energy prices are now putting pressure on oil-patch employment growth (see Chart 2) This trend alone should not cause a repeat of the 1980s oil bust as the regionrsquos economy has become increasingly diverse since that time somewhat muting the impact of oil price movements11 However when falling energy prices are combined with a severe national recession and a global financial crisis a significant regional downturn cannot be ruled out
Declining agricultural commodity prices are also of concern A severe downward price cycle in agricultural commodities and land values that causes farm incomes and land values to fall could result in prolonged economic weakness among farm states Aggravating the situation could be a rapid and significant consolidation in the ethanol industry which was already showing weakness in mid-2008 because of overcapacity and low margins caused by high corn prices Some of the largest ethanol producers delayed the startup of ethanol plants last year and some analysts predicted that many small and medium-sized plants would shut down12 Deteriorat-ing conditions in the ethanol industry will not only
9 Energy Information Administration Short-Term Energy Outlook December 2008 10 Several leading analysts have discussed the possibility of oil prices falling below $30 per barrel in 2009 One notable example is ldquoOil May Fall Below $25 Next Year Merrill Lynch Saysrdquo Bloombergcom December 4 2008 11 Stephen PA Brown and Mine K Yucel ldquoEnergy Prices and State Economic Performancerdquo Federal Reserve Bank of Dallas Economic Review second quarter 1995 12 ldquoToo Much Ethanolrdquo Farm Industry News November 1 2008
Chart 2
$0
$20
$40
$60
$80
$100
$120
$140
$160
1995 1997 1999 2001 2003 2005 2007 2009 -2
-1
0
1
2
3
4
5
The Recent Downturn in Oil Prices Appears to Spell the End of the Growth Period in Oil-Patch Employment
Sources Wall Street Journal Bureau of Labor Statistics (Haver Analytics) FDIC
Year-over-Year Employment Growth Oil-Patch States
Dollars per Barrel (2008 dollars)
weigh on crop prices but are also likely to affect farmers and rural communities who have come to rely on the industry for high-paying jobs
Though the economies in the nationrsquos midsection continue to perform well relative to the nation the downward trends in the energy and agricultural sectors may weigh on the region in the near future Moderating commodity prices are likely to put a damper on the arearsquos economic conditions and the region may not only cease to be a source of economic strength but also could enter recession at a much later stage than the nation
Authors Adrian R Sanchez Regional Economist
John M Anderlik Assistant Director
FDIC QUARTERLY 38 2009 VOLUME 3 NO 1
2009 Economic Landscape
The Industrial Midwest Faces a Potentially Long Road to Recovery Employment in the Industrial Midwest has declined substantially during the current downturn and the near-term outlook for Detroitrsquos auto industry remains unclear Automakers have been shrinking their busi-nesses to match reduced market share In addition financial press reports and analytical studies indicate that hundreds of thousands of jobs are potentially at stake as Chrysler and GM continue to negotiate restructuring plans with the Obama administrationrsquos auto task force Though foreign-based automakers with production facilities in the region might increase output to partially offset this gap their new hiring likely would not fully absorb jobs shed by Detroit automakers
Two other economic indicators also point to a prolonged path to recovery First the outlook for the metal fabrication and machinery manufacturing indus-tries has diminished These industries which include companies involved in the transformation of metal into intermediate or final products and the production of machines used in industrial applications provided some economic stability to the Industrial Midwest following the last recession However the weakening national economy has softened demand for their products Nationally investment in machinery and other fixed assets has slowed consistently since mid-2007 and fell 21 percent during fourth quarter 200811 As a result employment in fabrication and machinery manufactur-ing in the region declined 14 percent or about 13000 jobs in 2008
Second contraction or slowing growth in the econo-mies of US trading partners will likely limit future export opportunities that had provided a counterbal-ance to the weakened auto sector over the past few years Exports rose 13 percent and 11 percent respec-tively in 2006 and 2007 benefiting from strong foreign demand and a decline in the value of the dollar However the economies of foreign trading partners are now slowing or contracting and the decline in the dollar has reversed direction returning to trade-weighted levels not seen since 200612
A more positive outlook for the region hinges in no small part on the success of federal government initia-tives directed at stimulating the economy in general and the auto sector in particular Spending on infrastructure projects should generate new jobs while other provi-sions of the $787 billion American Recovery and Rein-vestment Act are intended to maintain existing jobs However most of the affected jobs will be outside of the manufacturing sector While employment will likely continue to decline in the automotive sector it is likely that fewer jobs would be lost under a government-assisted restructuring than would occur otherwise Over the long term job growth is likely to become more dependent on emerging and expanding industries such as those found in the energy education and health care sectors
Authors Patrick M Dervin Regional Economist
John M Anderlik Assistant Director
12 The Blue Chip Economic Indicators consensus forecast as of December 2008 calls for a 01 percent decline in Canadarsquos GDP in 2009 and only a 02 percent increase in Mexicorsquos GDP Growth in China one of the fastest growing export markets is expected to slow from 95 percent in 2008 to 76 percent in 2009 well below trend
11 Bureau of Economic Analysis seasonally adjusted annualized growth in real private nonresidential fixed investment
FDIC QUARTERLY 29 2009 VOLUME 3 NO 1
The 2009 Economic Landscape
The Sand States Anatomy of a Perfect Housing-Market Storm
The historic boom and subsequent decline in the nationrsquos housing market has been a defining feature of the current recession The housing downturn has been most acute in four statesmdashArizona California Florida and Nevadamdash that had experienced some of the highest rates of home price appreciation in the first half of the decade While these states are not all contiguously located their similar housing cycles and abundance of either beaches or deserts have led some analysts to label them ldquoSand Statesrdquo This article discusses the factors that led to an expanding housing sector in these states and the market imbalances that culminated in a sharp correction in home prices The article also explores the ripple effects that the hous-ing downturn has had on the local economies
Rapid Population Growth in the Sand States Propelled Housing Markets For many years rapid population growth in the Sand States spurred higher than average rates of home construction Favorable weather and relatively afford-able housing are two factors that attracted retirees as well as younger families to these states In the 1980s and 1990s population growth rates in Arizona Florida and Nevada were between two and four times the national rate Certain parts of California such as the RiversidendashSan Bernardino metropolitan area experi-enced similarly high rates of population growth Rapid population growth continued into the early years of this decade From 2004 to 2007 Arizona and Nevada ranked as the two fastest growing states in the nation followed closely by Florida which ranked ninth1
The influx of new residents into Arizona Florida and Nevada also contributed to strong employment growth Job creation in these states frequently outpaced the rest of the nation during the past few decades From 2000 to 2006 these states repeatedly ranked among the top ten for job growth far exceeding the national average California generally reported job growth similar to the national average during this period although the state was hit hard by the dot-com recession from mid-2001 to 2003
1 US Census Bureau
Affordability Mortgages Contributed to Housing Imbalances During this decade strong demand for housing supported by a growing population and an expanding economy contributed to growing housing market imbalances across the Sand States Perhaps the best measure of the imbalances that accumulated in boom-ing housing markets during this decade was the rela-tionship between home prices and incomes In the years leading up to the housing downturn escalating home prices far outpaced income growth For example in 2003 housing in Nevada was considered relatively affordable both in absolute terms and as compared to other states According to one analysis a family earning the median income in Nevada in 2003 could afford a home that was priced approximately 20 percent above the median house price in the state using traditional mortgage financing2 However by late 2005 home prices had risen so much that a family earning the median income could only afford a home priced at 24 percent below the statersquos median price
A combination of factors drove the housing sector imbalances in the Sand States to unprecedented levels Under normal market conditions strained affordability tends to limit housing demand because fewer house-holds can purchase a home using traditional mortgage financing However in this cycle new mortgage ldquoafford-abilityrdquo products were commonly used to finance home purchases Besides traditional adjustable-rate mortgages (ARMs) affordability products included hybrid ARMs which have a low fixed interest rate for several years followed by a market rate that is frequently much higher Affordability products also comprised the so-called nontraditional mortgage products which included interest-only loans where amortization of prin-cipal was not required during the first few years of the
2 Moodyrsquos Economycom Affordability Index The calculation assumes a 30-year maturity and a down payment of 20 percent It also assumes that the monthly principal and interest payments do not exceed 25 percent of the median family income To interpret the indices a value of 100 means that the family earning the median income can afford only 100 percent of the traditional mortgage payment of the median-priced home taking into consideration the 20 percent down payment
FDIC QUARTERLY 30 2009 VOLUME 3 NO 1
2009 Economic Landscape
loan negative-amortization loans that offered initial payments well below the amount required to cover interest and amortize principal and balloon payment loans which typically required a large lump-sum payment at the end of the loan Unlike subprime mort-gage products that were designed for home buyers with limited or weaker credit histories these nontraditional mortgages were marketed broadly and often used by first-time home buyers and investors who did not provide a down payment In addition originators of these products frequently did not require buyers to verify that their income could support the mortgage payments
By 2006 nearly half of total US originations of privately securitized affordability mortgages were made in the four Sand States alone Moreover the proportion of these mortgages originated in these states including nontradi-tional mortgages rose as home prices escalated During 2002 these products accounted for roughly half of the privately securitized mortgage originations in each of the Sand States comparable to the rest of the nation By 2006 however the proportion of these products had increased to 80 percent of privately securitized mortgage originations Nationwide the percentage was about 70 percent3
The increased presence of speculators or investors in the Sand States also contributed to growing imbalances in the housing sector Data from mortgage servicers indicate that nonowner investor and second-home mortgage originations increased noticeably in Arizona Florida and Nevada between 2000 and 20054 Investor and second-home purchases tended to be more heavily concentrated in major metropolitan areas in these states such as Las Vegas West Palm Beach Miami and Phoenix
Strong housing demand coupled with escalating home prices served as a dual incentive for builders to increase the supply of homes arguably at a rate that exceeded short-term demand New home construction started to accelerate in 2002 and over the next three years housing starts in these four states increased an average of 11 percent annually or about twice the rate of increase elsewhere in the nation Housing construction in the Sand States far outpaced annual growth in the number of households which peaked at 16 percent in 2004 and 2005
3 Data are from Loan Performance Affordability mortgage products include ARM loans interest-only loans negative amortization mortgages balloon loans and hybrid ARMs Affordability originations are measured as a percentage of privately securitized origination first liens only 4 In contrast California had less investor activity during the period likely because the median home price in the state was relatively high resulting in a less attractive rate of return for potential investors
Labor market imbalances also arose as job growth became skewed toward the housing sector During the height of the boom construction employment grew 10 percent per year in these states far outpacing growth in other indus-try sectors During this time construction jobs accounted for a disproportionate 25 percent share of new jobs while representing less than 10 percent of total employment
Tipping Point Imbalances Lead to Housing Collapse Ultimately the housing boom in the Sand States proved to be mostly a mirage The first signs of trouble came in the form of sharply decelerating rates of home price appreciation Between 2003 and 2006 annual home price appreciation rates in these states had consis-tently exceeded the national average Year-over-year house price appreciation in Nevada peaked in 2004 at 37 percent In Arizona and Florida appreciation peaked in 2005 at rates more than twice the national average Since then average home prices in the four states have declined between 27 and 38 percent from their peak5
Price declines have been most severe in metropolitan markets such as Phoenix and Las Vegas which regis-tered the largest percentage declines in the nation at 34 percent and 33 percent respectively during 20086
As home prices slumped foreclosure activity rose at a startling pace While this phenomenon was occurring across the nation it was most pronounced in the Sand States According to the Mortgage Bankers Associa-tion the Sand States accounted for more than 40 percent of all mortgage foreclosures started in 2008 which is nearly double the share of mortgages held by borrowers in these four states (see Table 1) This disproportionate share of troubled mortgages in the Sand States was most acute among ARMs In 2008 these states held 46 percent of the prime ARMs outstanding nationwide and 64 percent of foreclosures started within this mortgage category
In fourth quarter 2008 foreclosure resales accounted for more than 55 percent of all California resale activity almost three times the level of a year ago Foreclosure resales were also prevalent in Las Vegas and Phoenix where this type of transaction accounted for about 71 and 65 percent respectively of house and condominium resales7
5 Federal Housing Finance Agency purchase-only index data through fourth quarter 2008 6 SampPCase-Shiller Home Price Index data as of December 2008 7 Data Quick Information Systems through wwwdqnewscom Las Vegas and Phoenix data are for February 2009
FDIC QUARTERLY 31 2009 VOLUME 3 NO 1
Table 1 Chart 1
The Sand States Account for a Disproportionately High Share of
Foreclosure Activity National Share of
Foreclosures Started
National Share of Mortgages Serviced
California Florida Arizona Nevada
192 162 44 27
129 78 27 12
Sand States Total 425 246 Source Mortgage Bankers Association
Note Data from first quarter 2008 through fourth quarter 2008 ldquoSand Statesrdquo is the aggregate of California Florida Arizona and Nevada
-20
-15
-10
-5
0
5
10
15
91 92 93 94 95 96 97 98 99 00 01 02 03 04 05 06 07 08
Year-over-Year Change in Sand State Nonfarm Employment Percent
The Construction Sector in the Sand States Has Been an Important Driver of Job Growth
Source Bureau of Labor Statistics (Haver Analytics) Note ldquoSand Statesrdquo is the aggregate of California Florida Arizona and Nevada ldquoAll Other Sectorsrdquo is the state aggregate nonfarm employment minus the construction sector
All Other Sectors Job Growth
Construction Sector Job Growth
Economic Conditions Remain Fragile as the Effects of the Housing Collapse Spread Compounding the housing-sector problems in the Sand States and elsewhere has been the virtual shutdown of private mortgage-backed securities (MBS) issuance since 2007 MBS issuance had largely financed the subprime and nontraditional lending that fueled the boom Total issuance of private MBS which had topped $1 trillion annually in both 2005 and 2006 fell precipitously thereafter totaling just over $50 billion in 2008 Meanwhile the difficulties that market partici-pants have had in valuing complex mortgage securities and the derivatives based on them have contributed to wider risk aversion in financial markets which has reached historic proportions For housing markets particularly in the credit-fueled boom markets of these four states these financial market disruptions are compounding what would in any case have been a steep and extended housing market downturn
The housing market downturn in the Sand States is now having serious ripple effects on other parts of the local economy Each of the Sand States lost jobs in 2008 The losses have been most pronounced in the construction sector which has shed more than 450000 jobs or about 24 percent between fourth quarter 2006 and fourth quarter 2008 (see Chart 1) In addition job losses have spread to the financial services and retail trade sectors Retail sales also have declined particu-larly for home improvement furniture and electronics store sales contributing to additional layoffs
Although the Sand States entered this downturn with relatively low rates of unemployment joblessness increased during 2008 to levels not seen since the 2001 recession The unemployment rates for California Florida and Nevada ranked among the top ten in the
nation as of fourth quarter 2008 While Arizonarsquos unemployment rate remained slightly below the national average as of fourth quarter 2008 it too rose markedly during the year These rising unemployment rates are due primarily to widespread job losses and to a lesser degree to additional people entering the labor force in search of employment including college gradu-ates and retirees8 Also rising unemployment claims are putting more pressure on already strained state budgets
Nonetheless a few positive albeit very preliminary signs may be emerging The volume of home sales in Arizona California and Nevada improved during 2008 relative to year-ago levels The increase in fore-closures sales is likely contributing to some renewal in sales activity In addition while a sharp decline in housing starts is eliminating construction jobs in the near term it should eventually facilitate the return to a more stable housing landscape Seasonally adjusted housing starts in the Sand States dropped 40 percent in 2007 and again in 2008 Also despite the weakened housing and labor markets population growth in Arizona California and Nevada was estimated to be above the national rate in 20089 This continued growth will be an important source of long-term hous-ing demand that will eventually help bring a measure of stability to these troubled housing markets
Authors Shayna M Olesiuk Regional Manager
Kathy R Kalser Assistant Director
8 California Employment Development Department 9 US Census estimates of state-level population growth between July 1 2007 and July 1 2008 the latest data available
FDIC QUARTERLY 32 2009 VOLUME 3 NO 1
The 2009 Economic Landscape
Financial Sector Woes Pressure the Northeast
The downturn in US housing markets that began in 2006 was arguably the catalyst for the nationrsquos ongoing recession However turmoil in the financial sector has contributed to further deterioration in the US and global economies Since 2007 a succession of financial market disturbances has heightened risk aversion and credit spreads and has severely limited the availability of credit across certain sectors of the economy These developments have placed enormous pressure on some classes of financial companies particularly those that exist outside of the regulatory umbrella and those that depend on the ability to sell loans or issue debt on the open market
The severity and duration of the recent distress has resulted in considerable job losses in the financial sector Initially job cuts were centered in residential-related financial employment such as mortgage brokers consistent with the nationrsquos housing downturn However as financial stress permeated the capital markets job losses became widespread across the finan-cial industry By fourth quarter 2008 employment in the US financial sector had declined by 24 percent from a year earlier the sharpest decline since World War II1
Retrenchment in the Nationrsquos Financial Sector Is Centered in New York Contraction in the nationrsquos financial sector is magnified in New York State and particularly New York Citymdash the nationrsquos financial center (see text box at right for the effects of financial sector contraction on other Northeast economies) Statewide the contribution of financial jobs to total wages has increased in recent years At its peak in 2007 wages from financial jobs accounted for 25 percent of statewide wages consider-ably more than their contribution at the national level (see Chart 1)
In New York City the economy ebbs and flows with fluctuations in the financial sector because the city has a large share of financial jobs Indeed the proportion of financial jobs to total employment in New York City is
Contraction in the Financial Sector Is Weighing on Other
Northeast Economies Financial employment is a major economic driver in other parts of the Northeast including some cities in New England and metropolitan areas along the East Coast Like New York these markets are vulnerable to contraction in financial employment
New Jersey particularly the metropolitan areas around New York City has a slightly higher concen-tration of financial employment than the nation In fourth quarter 2008 New Jersey lost 12500 financial jobs about 46 percent from one year ago This rate of decline was nearly double the national rate and was the largest percentage decline for the state since first quarter 1991
Boston Massachusetts and Hartford Connecticut also had high concentrations of financial sector employment at 72 percent and 117 percent respec-tively at year-end 2008 Employment in Bostonrsquos financial sector fell by 40 percent in fourth quarter 2008 the largest decline since fourth quarter 1991 Much of the decline was centered in commercial banks and securities firms although real estate employ-ment also reported job losses Employment in Hart-fordrsquos financial sector also continues to contract During the fourth quarter the arearsquos financial employ-ment declined 08 percent from one year ago
The financial sector in Charlotte North Carolina is also contracting This sector which accounted for 85 percent of the metro arearsquos total jobs in fourth quarter 2008 and 405 percent of the arearsquos economic output in 2006 (the most recent data available) has been losing jobs since mid-2007 The rate of decline rose during 2008 reaching 54 percent in the fourth quarter
Wilmington Delaware also shed financial sector jobs in the fourth quarter although the rate of loss was less than that of the nation Employment associated with credit card banking which has a substantial presence in Wilmington has been relatively steady over the past year
1 Bureau of Labor Statistics
FDIC QUARTERLY 33 2009 VOLUME 3 NO 1
Chart 1 Chart 2
5
10
15
20
25
30
90 91 92 93 94 95 96 97 98 99 00 01 02 03 04 05 06 07 08
Source Bureau of Economic Analysis (Haver Analytics) Note Financial wages are those earned in the banking insurance real estate and securities industries Data are through fourth quarter 2008 (most recent available) and are seasonally adjusted at annual rates
New York State
United States
Ratio of Financial Wages to Total Wages
New Yorkrsquos Economy Has Grown More Dependent on Financial Wages
Recessions
-20
-15
-10
-5
0
5
10
15
20
00 01 02 03 04 05 06 07 08
Source Bureau of Labor Statistics (Haver Analytics) Note Data are through fourth quarter 2008 and are not seasonally adjusted
Securities Industry - New York City
Securities Industry - Rest of the US
Employment Losses in the Securities Industry Are Centered in New York City
Year-over-Year Change
12 percent or double the national share Perhaps more important wages in the securities industry a key component of the cityrsquos financial sector account for a disproportionate share of total wages paid in the city Wages in the securities industry accounted for more than 25 percent of total wages paid in the city but the industry itself accounted for only 5 percent of total jobs Securities industry wages increased almost four times faster than wages in the rest of New York City between 2003 and 20072
As the disruption in financial markets persisted during 2008 job losses in New York Cityrsquos financial sector continued to mount The securities industry was particularly hard hit During fourth quarter 2008 the cityrsquos securities industry lost more than 9000 jobs a 48 percent decline compared with one year earlier and the worst percentage decline since second quarter 2003 (see Chart 2)
Job losses in the cityrsquos securities industry will be ampli-fied across other sectors of the economy According to the New York State Comptroller for every new job in the securities industry three additional jobs are created in New York City and its suburbs Conversely losses in the securities industry will have a ripple effect across the arearsquos economy Estimates suggest that during the 2001 recession this sector directly and indirectly
2 New York State Comptroller The Securities Industry in New York City November 2008 Data are as of 2007 The securities industrymdasha component of the broader financial industrymdashis composed of jobs classified as securities and commodities brokers portfolio managers and investment advisors This sector accounted for more than one-third of financial jobs in New York City in fourth quarter 2008
contributed to more than half of the private sector jobs lost in the city3
In addition the sharp downturn in New Yorkrsquos finan-cial sector is negatively affecting state and local tax budgets In fiscal year 2007ndash2008 tax collections from the securities industry accounted for almost 20 percent of total tax collections in New York State The New York State Comptroller estimated that state tax collec-tions from the securities industry including business and personal filings could drop by 38 percent in fiscal 20104
Job losses and reduced compensation in New York Cityrsquos financial sector are also having a detrimental effect across real estate markets Home prices in the New York City metro area declined by 92 percent on average in 2008 This year-over-year decline in home prices was the largest in the 22-year history of these data slightly exceeding the previous high recorded in March 19915 Still New York City home prices fell much less during 2008 than in some other major cities which saw double-digit declines
New York Cityrsquos commercial real estate market is also showing signs of weakness particularly in Manhattan
3 Ibid 4 Ibid 5 SampPCase-Shiller Home Price Index This index defines the New York metro area as the New York City metropolitan statistical area plus other counties in New York State Connecticut New Jersey and Penn-sylvania that are within commuting distance of New York City Declines are calculated based on the year-over-year percentage change in home prices
FDIC QUARTERLY 34 2009 VOLUME 3 NO 1
2009 Economic Landscape
The financial sector occupies as much as 30 percent of Manhattanrsquos office space6 With intensifying pressure in the financial sector office rents are dropping The arearsquos vacancy rates are also on the rise but remained below the national average at year-end 20087 However a size-able amount of office space is estimated to return to the market which may further pressure rental and vacancy rates Some estimates suggest that the percentage of available office space in Manhattan may soon rise to its highest level since 19968
New York Cityrsquos Financial Industry Has Been Resilient in Past Cycles Forecasts suggest that job losses in New York Cityrsquos financial industry will get worse before they get better A March 2009 report by the New York City Indepen-dent Budget Office states that the city could lose 51000 securities industry jobs through third quarter 2011 which would be a decline of about 27 percent from the 2008 peak9 Job losses of this magnitude would
6 Grubb and Ellis Research Office Market Trends New York City second quarter 2008 7 Torto Wheaton Research fourth quarter 2008 8 David M Levitt ldquoBanks Vacate Towers Pushing Empty NYC Space to Recordrdquo Bloombergcom February 26 2008 wwwbloombergcom appsnewspid=newsarchiveampsid=aSYcApYshDw (accessed on March 2 2009) 9 New York City Independent Budget Office Analysis of the Mayorrsquos Preliminary Budget for 2010 IBOrsquos Reestimate of the Mayorrsquos Prelimi-nary Budget for 2010 and the Financial Plan through 2013 March 2009
exceed the number of securities jobs lost in the city during either the 1990ndash91 or 2001 recession10 In addi-tion job losses in New York Cityrsquos overall financial sector are projected to reach 8980011 According to the March report job growth in the financial sector is fore-cast to resume in 2012 and 2013 but at a slow pace
Although the near-term outlook for the financial services industry in New York City remains tenuous the cityrsquos financial sector should recover as it has following every recession since World War II During its long history New Yorkrsquos financial sector has proven resilient and resurgent following periods of adversity
Authors Robert M DiChiara Regional Manager
Kathy R Kalser Assistant Director
The authors would like to thank Norman Gertner Regional Economist Division of Insurance and Research for his contributions to this article
10 FDIC analysis quarterly data from the Bureau of Labor Statistics and annual data from the Securities Industry and Financial Markets Association 11 David Belkin (senior economist New York City Independent Budget Office) in discussion with FDIC staff April 2009 regarding the Analy-sis of the Mayorrsquos Preliminary Budget for 2010 dated March 2009
FDIC QUARTERLY 35 2009 VOLUME 3 NO 1
The 2009 Economic Landscape
How Long Can Energy and Agriculture Boost the Nationrsquos Midsection
The energy and agricultural sectors are important economic drivers for states in the center of the country Extending from the oil patch of Texas Louisiana Arkansas and Oklahoma northward through the plains states and eastward to the Corn Belt the states in the nationrsquos midsection are not only rich in land and other natural resources but also tend to rely heav-ily on these resources as drivers of economic activity Booming commodity prices during the middle years of this decade have helped buoy the economies of these states even while the rest of the country was moving toward recession However recent declines in many of these same commodity prices raise concerns about wider economic repercussions for these regions as the US recession continues This article describes how commodity industries drive the economies of the nationrsquos midsection and evaluates their outlook after the commodity price boom
Energy and Agriculture Regions Do Not Always Follow the US Business Cycle Energy prices can have a profound effect on the national economy In fact since World War II nearly all recessions were preceded by oil price shocks These shocks adversely affect businesses and consumers caus-ing economic growth to slow For example around the time of the Iranian revolution in 1979 oil prices doubled within a year contributing to the 1980 and 1981ndash82 national recessions Similarly the 1990ndash91 recession was precipitated in part by another doubling of oil prices in the months following the invasion of Kuwait and leading up to the first Gulf War
Unlike the rest of the nation oil-patch states tend to benefit from higher oil prices In the early 1980s and early 1990s higher oil prices helped these states grow even during national recessions However when prices collapsed during the mid-1980s oil-patch states fell into their own regional recession The lingering effects of the ldquooil bustrdquo resulted in falling real incomes in the region The subsequent loss of jobs income and output contributed to house price declines that created turmoil
in residential real estate markets and led to hundreds of bank failures1
Like the energy sector agriculture does not move in perfect tandem with the national economy though influences from US and global trends can be strong For example global economic conditions affect the demand for food which helps drive agricultural commodity prices In addition large interest rate move-ments can have a profound effect on farmland prices For example in the early 1970s strong demand for farm commodities caused farm incomes to rise rapidly When combined with negative real interest rates this favor-able environment caused sharp increases in the value of farmland In the late 1970s however soaring interest rates and changing conditions in global supply and demand brought the boom period to an end The result was a significant decline in real farm incomes a rapid and long-lasting decline in farmland values and hundreds of farm bank failures in the 1980s2
Energy and Agriculture Boomed through Mid-Year 2008 Current energy and agricultural conditions have for the most part played out independently of national economic trends Despite the weakening US economy the health of the energy and agricultural industries has been very strong over the past several years Crude oil prices quadrupled in dollar terms between 2003 and mid-2008 setting the trend for overall energy prices This price inflation was an economic boon to oil-patch states3 During the five-year period ending in second quarter 2008 inflation-adjusted economic growth in these four states grew at an annualized rate of 36 percent
1 FDIC History of the EightiesmdashLessons for the Future (Washington DC FDIC 1997) 291ndash336 2 Ibid 259ndash290 3 While the energy discussion and analysis in this article focus on oil-patch states it should be noted that Wyoming and Montana have characteristics similar to this region Both states rely considerably on energy extraction and experienced employment growth above the national average during the period of high oil prices Wyoming in fact had one of the most vibrant economies in the nation during that time
FDIC QUARTERLY 36 2009 VOLUME 3 NO 1
2009 Economic Landscape
Chart 1 Map 1
60 70 80 90
100 110 120 130 140 150 160
Jan-80 Jan-84 Jan-88 Jan-92 Jan-96 Jan-00 Jan-04 Jan-08
Source US Department of Agriculture Note ldquoPrices received by farmersrdquo is a composite index of leading crop and livestock prices produced in the United States The prices of these commodities are ldquofarm-gaterdquo or wholesale prices
Agricultural Prices Rose Steadily from Late 2002 through Mid-2008 but Have Settled Somewhat since Then
Prices Received by Farmers Index 1990-92=100
compared with 28 percent for the nation4 The biggest impact however was on real personal income which grew at an annualized rate of 46 percent in the four oil-patch states compared with only 29 percent nationally The regionrsquos oil and gas industry not only supports a large number of high-paying jobs in the mining industry itself but also has strong indirect multiplier effects on job growth in professional and business services whole-sale and retail trade and financial activities
The agricultural sector also has performed quite well over the past few years A number of factors including global economic growth and a weaker dollar contrib-uted to an extended period of rising prices for a broad array of agricultural products Prices for these commodi-ties generally began to rise in late 2002 and many reached new highs in the past two years before moder-ating in the second half of 2008 (see Chart 1) High commodity prices have led to record net farm incomes in three of the past four years and also have contributed to significant increases in farmland values5
Ethanol production has also played an important role in both agricultural and energy markets in recent years As the price of crude oil increased from less than $26 per barrel in 2001 to more than $133 per barrel in July 2008 ethanol became a viable and very profitable alter-
4 Growth rates used in this paragraph were calculated by the FDIC using data from the US Bureau of Economic Analysis and Moodyrsquos Economycom 5 For a detailed farmland analysis see Richard D Cofer Jeffrey W Walser and Troy D Osborne ldquoDo Record Farmland Prices Portend Another Steep Downturn for Agriculture and Farm Banksrdquo FDIC Quar-terly 2 no 4 (2008) 25
The Center of the Nation Has Avoided Significant Job Losses in This Recession
Employment Growth Percent Change December 2007 - January 2009
gt0 0 to -2 -2 to -4 Source Bureau of Labor Statistics US Average -25
(Haver Analytics) lt-4
native Strong profitability government mandates on renewable fuels that supported demand and tariffs and subsidies that supported prices all led to considerable increases in ethanol output6 Indeed annual ethanol output in 2008 had grown by more than five times the levels of 20007 The growth in ethanol production in turn increased the demand for corn the primary input in the production process to a point where ethanol production is projected to use nearly 30 percent of the 2008 crop8 As farmers planted more corn to meet the higher demand from ethanol plants they reduced plant-ings of soybeans which contributed to higher prices for this commodity as well The result was record incomes for farmers and double-digit average annual increases in farmland values in corn- and soybean-producing states between 2003 and 2007
The health of the energy and agricultural sectors combined with relatively stable and affordable housing markets in the central United States has caused the national recession to largely bypass the nationrsquos midsec-tion so far (see Map 1) The energy-rich oil patch was
6 Don Hofstrand ldquoCorn-Ethanol Profitabilityrdquo AgMRC Renewable Energy Newsletter Agricultural Marketing Resource Center November December 2008 and Bruce A Babcock Center for Agricultural and Rural Development at Iowa State University statement before the US Senate Committee on Homeland Security and Government Affairs Hearing on Fuel Subsidies and Impact on Food Prices 110th Cong 2nd sess May 7 2008 7 Renewable Fuels Association Ethanol Industry Outlook 2009 8 ldquoWorld Agricultural Supply and Demand Estimatesrdquo US Department of Agriculture January 12 2009
FDIC QUARTERLY 37 2009 VOLUME 3 NO 1
the only region that added jobs after the national reces-sion began in December 2007 and Farm Belt states reported small job losses relative to the rest of the nation
The Outlook for Energy and Agriculture Has Dimmed Though the energy and agricultural sectors have provided insulation against recession for the central United States these sectors have weakened consider-ably in recent months The Energy Information Administrationrsquos (EIA) short-term energy outlook is projecting a long severe global economic slowdown that will lead to further reductions in global energy demand and additional declines in crude oil and other energy prices9 The EIA projects oil prices in 2009 to average between $40 and $50 per barrel on a quarterly basis but prices could plunge below $3010 Falling energy prices are now putting pressure on oil-patch employment growth (see Chart 2) This trend alone should not cause a repeat of the 1980s oil bust as the regionrsquos economy has become increasingly diverse since that time somewhat muting the impact of oil price movements11 However when falling energy prices are combined with a severe national recession and a global financial crisis a significant regional downturn cannot be ruled out
Declining agricultural commodity prices are also of concern A severe downward price cycle in agricultural commodities and land values that causes farm incomes and land values to fall could result in prolonged economic weakness among farm states Aggravating the situation could be a rapid and significant consolidation in the ethanol industry which was already showing weakness in mid-2008 because of overcapacity and low margins caused by high corn prices Some of the largest ethanol producers delayed the startup of ethanol plants last year and some analysts predicted that many small and medium-sized plants would shut down12 Deteriorat-ing conditions in the ethanol industry will not only
9 Energy Information Administration Short-Term Energy Outlook December 2008 10 Several leading analysts have discussed the possibility of oil prices falling below $30 per barrel in 2009 One notable example is ldquoOil May Fall Below $25 Next Year Merrill Lynch Saysrdquo Bloombergcom December 4 2008 11 Stephen PA Brown and Mine K Yucel ldquoEnergy Prices and State Economic Performancerdquo Federal Reserve Bank of Dallas Economic Review second quarter 1995 12 ldquoToo Much Ethanolrdquo Farm Industry News November 1 2008
Chart 2
$0
$20
$40
$60
$80
$100
$120
$140
$160
1995 1997 1999 2001 2003 2005 2007 2009 -2
-1
0
1
2
3
4
5
The Recent Downturn in Oil Prices Appears to Spell the End of the Growth Period in Oil-Patch Employment
Sources Wall Street Journal Bureau of Labor Statistics (Haver Analytics) FDIC
Year-over-Year Employment Growth Oil-Patch States
Dollars per Barrel (2008 dollars)
weigh on crop prices but are also likely to affect farmers and rural communities who have come to rely on the industry for high-paying jobs
Though the economies in the nationrsquos midsection continue to perform well relative to the nation the downward trends in the energy and agricultural sectors may weigh on the region in the near future Moderating commodity prices are likely to put a damper on the arearsquos economic conditions and the region may not only cease to be a source of economic strength but also could enter recession at a much later stage than the nation
Authors Adrian R Sanchez Regional Economist
John M Anderlik Assistant Director
FDIC QUARTERLY 38 2009 VOLUME 3 NO 1

The 2009 Economic Landscape
The Sand States Anatomy of a Perfect Housing-Market Storm
The historic boom and subsequent decline in the nationrsquos housing market has been a defining feature of the current recession The housing downturn has been most acute in four statesmdashArizona California Florida and Nevadamdash that had experienced some of the highest rates of home price appreciation in the first half of the decade While these states are not all contiguously located their similar housing cycles and abundance of either beaches or deserts have led some analysts to label them ldquoSand Statesrdquo This article discusses the factors that led to an expanding housing sector in these states and the market imbalances that culminated in a sharp correction in home prices The article also explores the ripple effects that the hous-ing downturn has had on the local economies
Rapid Population Growth in the Sand States Propelled Housing Markets For many years rapid population growth in the Sand States spurred higher than average rates of home construction Favorable weather and relatively afford-able housing are two factors that attracted retirees as well as younger families to these states In the 1980s and 1990s population growth rates in Arizona Florida and Nevada were between two and four times the national rate Certain parts of California such as the RiversidendashSan Bernardino metropolitan area experi-enced similarly high rates of population growth Rapid population growth continued into the early years of this decade From 2004 to 2007 Arizona and Nevada ranked as the two fastest growing states in the nation followed closely by Florida which ranked ninth1
The influx of new residents into Arizona Florida and Nevada also contributed to strong employment growth Job creation in these states frequently outpaced the rest of the nation during the past few decades From 2000 to 2006 these states repeatedly ranked among the top ten for job growth far exceeding the national average California generally reported job growth similar to the national average during this period although the state was hit hard by the dot-com recession from mid-2001 to 2003
1 US Census Bureau
Affordability Mortgages Contributed to Housing Imbalances During this decade strong demand for housing supported by a growing population and an expanding economy contributed to growing housing market imbalances across the Sand States Perhaps the best measure of the imbalances that accumulated in boom-ing housing markets during this decade was the rela-tionship between home prices and incomes In the years leading up to the housing downturn escalating home prices far outpaced income growth For example in 2003 housing in Nevada was considered relatively affordable both in absolute terms and as compared to other states According to one analysis a family earning the median income in Nevada in 2003 could afford a home that was priced approximately 20 percent above the median house price in the state using traditional mortgage financing2 However by late 2005 home prices had risen so much that a family earning the median income could only afford a home priced at 24 percent below the statersquos median price
A combination of factors drove the housing sector imbalances in the Sand States to unprecedented levels Under normal market conditions strained affordability tends to limit housing demand because fewer house-holds can purchase a home using traditional mortgage financing However in this cycle new mortgage ldquoafford-abilityrdquo products were commonly used to finance home purchases Besides traditional adjustable-rate mortgages (ARMs) affordability products included hybrid ARMs which have a low fixed interest rate for several years followed by a market rate that is frequently much higher Affordability products also comprised the so-called nontraditional mortgage products which included interest-only loans where amortization of prin-cipal was not required during the first few years of the
2 Moodyrsquos Economycom Affordability Index The calculation assumes a 30-year maturity and a down payment of 20 percent It also assumes that the monthly principal and interest payments do not exceed 25 percent of the median family income To interpret the indices a value of 100 means that the family earning the median income can afford only 100 percent of the traditional mortgage payment of the median-priced home taking into consideration the 20 percent down payment
FDIC QUARTERLY 30 2009 VOLUME 3 NO 1
2009 Economic Landscape
loan negative-amortization loans that offered initial payments well below the amount required to cover interest and amortize principal and balloon payment loans which typically required a large lump-sum payment at the end of the loan Unlike subprime mort-gage products that were designed for home buyers with limited or weaker credit histories these nontraditional mortgages were marketed broadly and often used by first-time home buyers and investors who did not provide a down payment In addition originators of these products frequently did not require buyers to verify that their income could support the mortgage payments
By 2006 nearly half of total US originations of privately securitized affordability mortgages were made in the four Sand States alone Moreover the proportion of these mortgages originated in these states including nontradi-tional mortgages rose as home prices escalated During 2002 these products accounted for roughly half of the privately securitized mortgage originations in each of the Sand States comparable to the rest of the nation By 2006 however the proportion of these products had increased to 80 percent of privately securitized mortgage originations Nationwide the percentage was about 70 percent3
The increased presence of speculators or investors in the Sand States also contributed to growing imbalances in the housing sector Data from mortgage servicers indicate that nonowner investor and second-home mortgage originations increased noticeably in Arizona Florida and Nevada between 2000 and 20054 Investor and second-home purchases tended to be more heavily concentrated in major metropolitan areas in these states such as Las Vegas West Palm Beach Miami and Phoenix
Strong housing demand coupled with escalating home prices served as a dual incentive for builders to increase the supply of homes arguably at a rate that exceeded short-term demand New home construction started to accelerate in 2002 and over the next three years housing starts in these four states increased an average of 11 percent annually or about twice the rate of increase elsewhere in the nation Housing construction in the Sand States far outpaced annual growth in the number of households which peaked at 16 percent in 2004 and 2005
3 Data are from Loan Performance Affordability mortgage products include ARM loans interest-only loans negative amortization mortgages balloon loans and hybrid ARMs Affordability originations are measured as a percentage of privately securitized origination first liens only 4 In contrast California had less investor activity during the period likely because the median home price in the state was relatively high resulting in a less attractive rate of return for potential investors
Labor market imbalances also arose as job growth became skewed toward the housing sector During the height of the boom construction employment grew 10 percent per year in these states far outpacing growth in other indus-try sectors During this time construction jobs accounted for a disproportionate 25 percent share of new jobs while representing less than 10 percent of total employment
Tipping Point Imbalances Lead to Housing Collapse Ultimately the housing boom in the Sand States proved to be mostly a mirage The first signs of trouble came in the form of sharply decelerating rates of home price appreciation Between 2003 and 2006 annual home price appreciation rates in these states had consis-tently exceeded the national average Year-over-year house price appreciation in Nevada peaked in 2004 at 37 percent In Arizona and Florida appreciation peaked in 2005 at rates more than twice the national average Since then average home prices in the four states have declined between 27 and 38 percent from their peak5
Price declines have been most severe in metropolitan markets such as Phoenix and Las Vegas which regis-tered the largest percentage declines in the nation at 34 percent and 33 percent respectively during 20086
As home prices slumped foreclosure activity rose at a startling pace While this phenomenon was occurring across the nation it was most pronounced in the Sand States According to the Mortgage Bankers Associa-tion the Sand States accounted for more than 40 percent of all mortgage foreclosures started in 2008 which is nearly double the share of mortgages held by borrowers in these four states (see Table 1) This disproportionate share of troubled mortgages in the Sand States was most acute among ARMs In 2008 these states held 46 percent of the prime ARMs outstanding nationwide and 64 percent of foreclosures started within this mortgage category
In fourth quarter 2008 foreclosure resales accounted for more than 55 percent of all California resale activity almost three times the level of a year ago Foreclosure resales were also prevalent in Las Vegas and Phoenix where this type of transaction accounted for about 71 and 65 percent respectively of house and condominium resales7
5 Federal Housing Finance Agency purchase-only index data through fourth quarter 2008 6 SampPCase-Shiller Home Price Index data as of December 2008 7 Data Quick Information Systems through wwwdqnewscom Las Vegas and Phoenix data are for February 2009
FDIC QUARTERLY 31 2009 VOLUME 3 NO 1
Table 1 Chart 1
The Sand States Account for a Disproportionately High Share of
Foreclosure Activity National Share of
Foreclosures Started
National Share of Mortgages Serviced
California Florida Arizona Nevada
192 162 44 27
129 78 27 12
Sand States Total 425 246 Source Mortgage Bankers Association
Note Data from first quarter 2008 through fourth quarter 2008 ldquoSand Statesrdquo is the aggregate of California Florida Arizona and Nevada
-20
-15
-10
-5
0
5
10
15
91 92 93 94 95 96 97 98 99 00 01 02 03 04 05 06 07 08
Year-over-Year Change in Sand State Nonfarm Employment Percent
The Construction Sector in the Sand States Has Been an Important Driver of Job Growth
Source Bureau of Labor Statistics (Haver Analytics) Note ldquoSand Statesrdquo is the aggregate of California Florida Arizona and Nevada ldquoAll Other Sectorsrdquo is the state aggregate nonfarm employment minus the construction sector
All Other Sectors Job Growth
Construction Sector Job Growth
Economic Conditions Remain Fragile as the Effects of the Housing Collapse Spread Compounding the housing-sector problems in the Sand States and elsewhere has been the virtual shutdown of private mortgage-backed securities (MBS) issuance since 2007 MBS issuance had largely financed the subprime and nontraditional lending that fueled the boom Total issuance of private MBS which had topped $1 trillion annually in both 2005 and 2006 fell precipitously thereafter totaling just over $50 billion in 2008 Meanwhile the difficulties that market partici-pants have had in valuing complex mortgage securities and the derivatives based on them have contributed to wider risk aversion in financial markets which has reached historic proportions For housing markets particularly in the credit-fueled boom markets of these four states these financial market disruptions are compounding what would in any case have been a steep and extended housing market downturn
The housing market downturn in the Sand States is now having serious ripple effects on other parts of the local economy Each of the Sand States lost jobs in 2008 The losses have been most pronounced in the construction sector which has shed more than 450000 jobs or about 24 percent between fourth quarter 2006 and fourth quarter 2008 (see Chart 1) In addition job losses have spread to the financial services and retail trade sectors Retail sales also have declined particu-larly for home improvement furniture and electronics store sales contributing to additional layoffs
Although the Sand States entered this downturn with relatively low rates of unemployment joblessness increased during 2008 to levels not seen since the 2001 recession The unemployment rates for California Florida and Nevada ranked among the top ten in the
nation as of fourth quarter 2008 While Arizonarsquos unemployment rate remained slightly below the national average as of fourth quarter 2008 it too rose markedly during the year These rising unemployment rates are due primarily to widespread job losses and to a lesser degree to additional people entering the labor force in search of employment including college gradu-ates and retirees8 Also rising unemployment claims are putting more pressure on already strained state budgets
Nonetheless a few positive albeit very preliminary signs may be emerging The volume of home sales in Arizona California and Nevada improved during 2008 relative to year-ago levels The increase in fore-closures sales is likely contributing to some renewal in sales activity In addition while a sharp decline in housing starts is eliminating construction jobs in the near term it should eventually facilitate the return to a more stable housing landscape Seasonally adjusted housing starts in the Sand States dropped 40 percent in 2007 and again in 2008 Also despite the weakened housing and labor markets population growth in Arizona California and Nevada was estimated to be above the national rate in 20089 This continued growth will be an important source of long-term hous-ing demand that will eventually help bring a measure of stability to these troubled housing markets
Authors Shayna M Olesiuk Regional Manager
Kathy R Kalser Assistant Director
8 California Employment Development Department 9 US Census estimates of state-level population growth between July 1 2007 and July 1 2008 the latest data available
FDIC QUARTERLY 32 2009 VOLUME 3 NO 1
The 2009 Economic Landscape
Financial Sector Woes Pressure the Northeast
The downturn in US housing markets that began in 2006 was arguably the catalyst for the nationrsquos ongoing recession However turmoil in the financial sector has contributed to further deterioration in the US and global economies Since 2007 a succession of financial market disturbances has heightened risk aversion and credit spreads and has severely limited the availability of credit across certain sectors of the economy These developments have placed enormous pressure on some classes of financial companies particularly those that exist outside of the regulatory umbrella and those that depend on the ability to sell loans or issue debt on the open market
The severity and duration of the recent distress has resulted in considerable job losses in the financial sector Initially job cuts were centered in residential-related financial employment such as mortgage brokers consistent with the nationrsquos housing downturn However as financial stress permeated the capital markets job losses became widespread across the finan-cial industry By fourth quarter 2008 employment in the US financial sector had declined by 24 percent from a year earlier the sharpest decline since World War II1
Retrenchment in the Nationrsquos Financial Sector Is Centered in New York Contraction in the nationrsquos financial sector is magnified in New York State and particularly New York Citymdash the nationrsquos financial center (see text box at right for the effects of financial sector contraction on other Northeast economies) Statewide the contribution of financial jobs to total wages has increased in recent years At its peak in 2007 wages from financial jobs accounted for 25 percent of statewide wages consider-ably more than their contribution at the national level (see Chart 1)
In New York City the economy ebbs and flows with fluctuations in the financial sector because the city has a large share of financial jobs Indeed the proportion of financial jobs to total employment in New York City is
Contraction in the Financial Sector Is Weighing on Other
Northeast Economies Financial employment is a major economic driver in other parts of the Northeast including some cities in New England and metropolitan areas along the East Coast Like New York these markets are vulnerable to contraction in financial employment
New Jersey particularly the metropolitan areas around New York City has a slightly higher concen-tration of financial employment than the nation In fourth quarter 2008 New Jersey lost 12500 financial jobs about 46 percent from one year ago This rate of decline was nearly double the national rate and was the largest percentage decline for the state since first quarter 1991
Boston Massachusetts and Hartford Connecticut also had high concentrations of financial sector employment at 72 percent and 117 percent respec-tively at year-end 2008 Employment in Bostonrsquos financial sector fell by 40 percent in fourth quarter 2008 the largest decline since fourth quarter 1991 Much of the decline was centered in commercial banks and securities firms although real estate employ-ment also reported job losses Employment in Hart-fordrsquos financial sector also continues to contract During the fourth quarter the arearsquos financial employ-ment declined 08 percent from one year ago
The financial sector in Charlotte North Carolina is also contracting This sector which accounted for 85 percent of the metro arearsquos total jobs in fourth quarter 2008 and 405 percent of the arearsquos economic output in 2006 (the most recent data available) has been losing jobs since mid-2007 The rate of decline rose during 2008 reaching 54 percent in the fourth quarter
Wilmington Delaware also shed financial sector jobs in the fourth quarter although the rate of loss was less than that of the nation Employment associated with credit card banking which has a substantial presence in Wilmington has been relatively steady over the past year
1 Bureau of Labor Statistics
FDIC QUARTERLY 33 2009 VOLUME 3 NO 1
Chart 1 Chart 2
5
10
15
20
25
30
90 91 92 93 94 95 96 97 98 99 00 01 02 03 04 05 06 07 08
Source Bureau of Economic Analysis (Haver Analytics) Note Financial wages are those earned in the banking insurance real estate and securities industries Data are through fourth quarter 2008 (most recent available) and are seasonally adjusted at annual rates
New York State
United States
Ratio of Financial Wages to Total Wages
New Yorkrsquos Economy Has Grown More Dependent on Financial Wages
Recessions
-20
-15
-10
-5
0
5
10
15
20
00 01 02 03 04 05 06 07 08
Source Bureau of Labor Statistics (Haver Analytics) Note Data are through fourth quarter 2008 and are not seasonally adjusted
Securities Industry - New York City
Securities Industry - Rest of the US
Employment Losses in the Securities Industry Are Centered in New York City
Year-over-Year Change
12 percent or double the national share Perhaps more important wages in the securities industry a key component of the cityrsquos financial sector account for a disproportionate share of total wages paid in the city Wages in the securities industry accounted for more than 25 percent of total wages paid in the city but the industry itself accounted for only 5 percent of total jobs Securities industry wages increased almost four times faster than wages in the rest of New York City between 2003 and 20072
As the disruption in financial markets persisted during 2008 job losses in New York Cityrsquos financial sector continued to mount The securities industry was particularly hard hit During fourth quarter 2008 the cityrsquos securities industry lost more than 9000 jobs a 48 percent decline compared with one year earlier and the worst percentage decline since second quarter 2003 (see Chart 2)
Job losses in the cityrsquos securities industry will be ampli-fied across other sectors of the economy According to the New York State Comptroller for every new job in the securities industry three additional jobs are created in New York City and its suburbs Conversely losses in the securities industry will have a ripple effect across the arearsquos economy Estimates suggest that during the 2001 recession this sector directly and indirectly
2 New York State Comptroller The Securities Industry in New York City November 2008 Data are as of 2007 The securities industrymdasha component of the broader financial industrymdashis composed of jobs classified as securities and commodities brokers portfolio managers and investment advisors This sector accounted for more than one-third of financial jobs in New York City in fourth quarter 2008
contributed to more than half of the private sector jobs lost in the city3
In addition the sharp downturn in New Yorkrsquos finan-cial sector is negatively affecting state and local tax budgets In fiscal year 2007ndash2008 tax collections from the securities industry accounted for almost 20 percent of total tax collections in New York State The New York State Comptroller estimated that state tax collec-tions from the securities industry including business and personal filings could drop by 38 percent in fiscal 20104
Job losses and reduced compensation in New York Cityrsquos financial sector are also having a detrimental effect across real estate markets Home prices in the New York City metro area declined by 92 percent on average in 2008 This year-over-year decline in home prices was the largest in the 22-year history of these data slightly exceeding the previous high recorded in March 19915 Still New York City home prices fell much less during 2008 than in some other major cities which saw double-digit declines
New York Cityrsquos commercial real estate market is also showing signs of weakness particularly in Manhattan
3 Ibid 4 Ibid 5 SampPCase-Shiller Home Price Index This index defines the New York metro area as the New York City metropolitan statistical area plus other counties in New York State Connecticut New Jersey and Penn-sylvania that are within commuting distance of New York City Declines are calculated based on the year-over-year percentage change in home prices
FDIC QUARTERLY 34 2009 VOLUME 3 NO 1
2009 Economic Landscape
The financial sector occupies as much as 30 percent of Manhattanrsquos office space6 With intensifying pressure in the financial sector office rents are dropping The arearsquos vacancy rates are also on the rise but remained below the national average at year-end 20087 However a size-able amount of office space is estimated to return to the market which may further pressure rental and vacancy rates Some estimates suggest that the percentage of available office space in Manhattan may soon rise to its highest level since 19968
New York Cityrsquos Financial Industry Has Been Resilient in Past Cycles Forecasts suggest that job losses in New York Cityrsquos financial industry will get worse before they get better A March 2009 report by the New York City Indepen-dent Budget Office states that the city could lose 51000 securities industry jobs through third quarter 2011 which would be a decline of about 27 percent from the 2008 peak9 Job losses of this magnitude would
6 Grubb and Ellis Research Office Market Trends New York City second quarter 2008 7 Torto Wheaton Research fourth quarter 2008 8 David M Levitt ldquoBanks Vacate Towers Pushing Empty NYC Space to Recordrdquo Bloombergcom February 26 2008 wwwbloombergcom appsnewspid=newsarchiveampsid=aSYcApYshDw (accessed on March 2 2009) 9 New York City Independent Budget Office Analysis of the Mayorrsquos Preliminary Budget for 2010 IBOrsquos Reestimate of the Mayorrsquos Prelimi-nary Budget for 2010 and the Financial Plan through 2013 March 2009
exceed the number of securities jobs lost in the city during either the 1990ndash91 or 2001 recession10 In addi-tion job losses in New York Cityrsquos overall financial sector are projected to reach 8980011 According to the March report job growth in the financial sector is fore-cast to resume in 2012 and 2013 but at a slow pace
Although the near-term outlook for the financial services industry in New York City remains tenuous the cityrsquos financial sector should recover as it has following every recession since World War II During its long history New Yorkrsquos financial sector has proven resilient and resurgent following periods of adversity
Authors Robert M DiChiara Regional Manager
Kathy R Kalser Assistant Director
The authors would like to thank Norman Gertner Regional Economist Division of Insurance and Research for his contributions to this article
10 FDIC analysis quarterly data from the Bureau of Labor Statistics and annual data from the Securities Industry and Financial Markets Association 11 David Belkin (senior economist New York City Independent Budget Office) in discussion with FDIC staff April 2009 regarding the Analy-sis of the Mayorrsquos Preliminary Budget for 2010 dated March 2009
FDIC QUARTERLY 35 2009 VOLUME 3 NO 1
The 2009 Economic Landscape
How Long Can Energy and Agriculture Boost the Nationrsquos Midsection
The energy and agricultural sectors are important economic drivers for states in the center of the country Extending from the oil patch of Texas Louisiana Arkansas and Oklahoma northward through the plains states and eastward to the Corn Belt the states in the nationrsquos midsection are not only rich in land and other natural resources but also tend to rely heav-ily on these resources as drivers of economic activity Booming commodity prices during the middle years of this decade have helped buoy the economies of these states even while the rest of the country was moving toward recession However recent declines in many of these same commodity prices raise concerns about wider economic repercussions for these regions as the US recession continues This article describes how commodity industries drive the economies of the nationrsquos midsection and evaluates their outlook after the commodity price boom
Energy and Agriculture Regions Do Not Always Follow the US Business Cycle Energy prices can have a profound effect on the national economy In fact since World War II nearly all recessions were preceded by oil price shocks These shocks adversely affect businesses and consumers caus-ing economic growth to slow For example around the time of the Iranian revolution in 1979 oil prices doubled within a year contributing to the 1980 and 1981ndash82 national recessions Similarly the 1990ndash91 recession was precipitated in part by another doubling of oil prices in the months following the invasion of Kuwait and leading up to the first Gulf War
Unlike the rest of the nation oil-patch states tend to benefit from higher oil prices In the early 1980s and early 1990s higher oil prices helped these states grow even during national recessions However when prices collapsed during the mid-1980s oil-patch states fell into their own regional recession The lingering effects of the ldquooil bustrdquo resulted in falling real incomes in the region The subsequent loss of jobs income and output contributed to house price declines that created turmoil
in residential real estate markets and led to hundreds of bank failures1
Like the energy sector agriculture does not move in perfect tandem with the national economy though influences from US and global trends can be strong For example global economic conditions affect the demand for food which helps drive agricultural commodity prices In addition large interest rate move-ments can have a profound effect on farmland prices For example in the early 1970s strong demand for farm commodities caused farm incomes to rise rapidly When combined with negative real interest rates this favor-able environment caused sharp increases in the value of farmland In the late 1970s however soaring interest rates and changing conditions in global supply and demand brought the boom period to an end The result was a significant decline in real farm incomes a rapid and long-lasting decline in farmland values and hundreds of farm bank failures in the 1980s2
Energy and Agriculture Boomed through Mid-Year 2008 Current energy and agricultural conditions have for the most part played out independently of national economic trends Despite the weakening US economy the health of the energy and agricultural industries has been very strong over the past several years Crude oil prices quadrupled in dollar terms between 2003 and mid-2008 setting the trend for overall energy prices This price inflation was an economic boon to oil-patch states3 During the five-year period ending in second quarter 2008 inflation-adjusted economic growth in these four states grew at an annualized rate of 36 percent
1 FDIC History of the EightiesmdashLessons for the Future (Washington DC FDIC 1997) 291ndash336 2 Ibid 259ndash290 3 While the energy discussion and analysis in this article focus on oil-patch states it should be noted that Wyoming and Montana have characteristics similar to this region Both states rely considerably on energy extraction and experienced employment growth above the national average during the period of high oil prices Wyoming in fact had one of the most vibrant economies in the nation during that time
FDIC QUARTERLY 36 2009 VOLUME 3 NO 1
2009 Economic Landscape
Chart 1 Map 1
60 70 80 90
100 110 120 130 140 150 160
Jan-80 Jan-84 Jan-88 Jan-92 Jan-96 Jan-00 Jan-04 Jan-08
Source US Department of Agriculture Note ldquoPrices received by farmersrdquo is a composite index of leading crop and livestock prices produced in the United States The prices of these commodities are ldquofarm-gaterdquo or wholesale prices
Agricultural Prices Rose Steadily from Late 2002 through Mid-2008 but Have Settled Somewhat since Then
Prices Received by Farmers Index 1990-92=100
compared with 28 percent for the nation4 The biggest impact however was on real personal income which grew at an annualized rate of 46 percent in the four oil-patch states compared with only 29 percent nationally The regionrsquos oil and gas industry not only supports a large number of high-paying jobs in the mining industry itself but also has strong indirect multiplier effects on job growth in professional and business services whole-sale and retail trade and financial activities
The agricultural sector also has performed quite well over the past few years A number of factors including global economic growth and a weaker dollar contrib-uted to an extended period of rising prices for a broad array of agricultural products Prices for these commodi-ties generally began to rise in late 2002 and many reached new highs in the past two years before moder-ating in the second half of 2008 (see Chart 1) High commodity prices have led to record net farm incomes in three of the past four years and also have contributed to significant increases in farmland values5
Ethanol production has also played an important role in both agricultural and energy markets in recent years As the price of crude oil increased from less than $26 per barrel in 2001 to more than $133 per barrel in July 2008 ethanol became a viable and very profitable alter-
4 Growth rates used in this paragraph were calculated by the FDIC using data from the US Bureau of Economic Analysis and Moodyrsquos Economycom 5 For a detailed farmland analysis see Richard D Cofer Jeffrey W Walser and Troy D Osborne ldquoDo Record Farmland Prices Portend Another Steep Downturn for Agriculture and Farm Banksrdquo FDIC Quar-terly 2 no 4 (2008) 25
The Center of the Nation Has Avoided Significant Job Losses in This Recession
Employment Growth Percent Change December 2007 - January 2009
gt0 0 to -2 -2 to -4 Source Bureau of Labor Statistics US Average -25
(Haver Analytics) lt-4
native Strong profitability government mandates on renewable fuels that supported demand and tariffs and subsidies that supported prices all led to considerable increases in ethanol output6 Indeed annual ethanol output in 2008 had grown by more than five times the levels of 20007 The growth in ethanol production in turn increased the demand for corn the primary input in the production process to a point where ethanol production is projected to use nearly 30 percent of the 2008 crop8 As farmers planted more corn to meet the higher demand from ethanol plants they reduced plant-ings of soybeans which contributed to higher prices for this commodity as well The result was record incomes for farmers and double-digit average annual increases in farmland values in corn- and soybean-producing states between 2003 and 2007
The health of the energy and agricultural sectors combined with relatively stable and affordable housing markets in the central United States has caused the national recession to largely bypass the nationrsquos midsec-tion so far (see Map 1) The energy-rich oil patch was
6 Don Hofstrand ldquoCorn-Ethanol Profitabilityrdquo AgMRC Renewable Energy Newsletter Agricultural Marketing Resource Center November December 2008 and Bruce A Babcock Center for Agricultural and Rural Development at Iowa State University statement before the US Senate Committee on Homeland Security and Government Affairs Hearing on Fuel Subsidies and Impact on Food Prices 110th Cong 2nd sess May 7 2008 7 Renewable Fuels Association Ethanol Industry Outlook 2009 8 ldquoWorld Agricultural Supply and Demand Estimatesrdquo US Department of Agriculture January 12 2009
FDIC QUARTERLY 37 2009 VOLUME 3 NO 1
the only region that added jobs after the national reces-sion began in December 2007 and Farm Belt states reported small job losses relative to the rest of the nation
The Outlook for Energy and Agriculture Has Dimmed Though the energy and agricultural sectors have provided insulation against recession for the central United States these sectors have weakened consider-ably in recent months The Energy Information Administrationrsquos (EIA) short-term energy outlook is projecting a long severe global economic slowdown that will lead to further reductions in global energy demand and additional declines in crude oil and other energy prices9 The EIA projects oil prices in 2009 to average between $40 and $50 per barrel on a quarterly basis but prices could plunge below $3010 Falling energy prices are now putting pressure on oil-patch employment growth (see Chart 2) This trend alone should not cause a repeat of the 1980s oil bust as the regionrsquos economy has become increasingly diverse since that time somewhat muting the impact of oil price movements11 However when falling energy prices are combined with a severe national recession and a global financial crisis a significant regional downturn cannot be ruled out
Declining agricultural commodity prices are also of concern A severe downward price cycle in agricultural commodities and land values that causes farm incomes and land values to fall could result in prolonged economic weakness among farm states Aggravating the situation could be a rapid and significant consolidation in the ethanol industry which was already showing weakness in mid-2008 because of overcapacity and low margins caused by high corn prices Some of the largest ethanol producers delayed the startup of ethanol plants last year and some analysts predicted that many small and medium-sized plants would shut down12 Deteriorat-ing conditions in the ethanol industry will not only
9 Energy Information Administration Short-Term Energy Outlook December 2008 10 Several leading analysts have discussed the possibility of oil prices falling below $30 per barrel in 2009 One notable example is ldquoOil May Fall Below $25 Next Year Merrill Lynch Saysrdquo Bloombergcom December 4 2008 11 Stephen PA Brown and Mine K Yucel ldquoEnergy Prices and State Economic Performancerdquo Federal Reserve Bank of Dallas Economic Review second quarter 1995 12 ldquoToo Much Ethanolrdquo Farm Industry News November 1 2008
Chart 2
$0
$20
$40
$60
$80
$100
$120
$140
$160
1995 1997 1999 2001 2003 2005 2007 2009 -2
-1
0
1
2
3
4
5
The Recent Downturn in Oil Prices Appears to Spell the End of the Growth Period in Oil-Patch Employment
Sources Wall Street Journal Bureau of Labor Statistics (Haver Analytics) FDIC
Year-over-Year Employment Growth Oil-Patch States
Dollars per Barrel (2008 dollars)
weigh on crop prices but are also likely to affect farmers and rural communities who have come to rely on the industry for high-paying jobs
Though the economies in the nationrsquos midsection continue to perform well relative to the nation the downward trends in the energy and agricultural sectors may weigh on the region in the near future Moderating commodity prices are likely to put a damper on the arearsquos economic conditions and the region may not only cease to be a source of economic strength but also could enter recession at a much later stage than the nation
Authors Adrian R Sanchez Regional Economist
John M Anderlik Assistant Director
FDIC QUARTERLY 38 2009 VOLUME 3 NO 1

2009 Economic Landscape
loan negative-amortization loans that offered initial payments well below the amount required to cover interest and amortize principal and balloon payment loans which typically required a large lump-sum payment at the end of the loan Unlike subprime mort-gage products that were designed for home buyers with limited or weaker credit histories these nontraditional mortgages were marketed broadly and often used by first-time home buyers and investors who did not provide a down payment In addition originators of these products frequently did not require buyers to verify that their income could support the mortgage payments
By 2006 nearly half of total US originations of privately securitized affordability mortgages were made in the four Sand States alone Moreover the proportion of these mortgages originated in these states including nontradi-tional mortgages rose as home prices escalated During 2002 these products accounted for roughly half of the privately securitized mortgage originations in each of the Sand States comparable to the rest of the nation By 2006 however the proportion of these products had increased to 80 percent of privately securitized mortgage originations Nationwide the percentage was about 70 percent3
The increased presence of speculators or investors in the Sand States also contributed to growing imbalances in the housing sector Data from mortgage servicers indicate that nonowner investor and second-home mortgage originations increased noticeably in Arizona Florida and Nevada between 2000 and 20054 Investor and second-home purchases tended to be more heavily concentrated in major metropolitan areas in these states such as Las Vegas West Palm Beach Miami and Phoenix
Strong housing demand coupled with escalating home prices served as a dual incentive for builders to increase the supply of homes arguably at a rate that exceeded short-term demand New home construction started to accelerate in 2002 and over the next three years housing starts in these four states increased an average of 11 percent annually or about twice the rate of increase elsewhere in the nation Housing construction in the Sand States far outpaced annual growth in the number of households which peaked at 16 percent in 2004 and 2005
3 Data are from Loan Performance Affordability mortgage products include ARM loans interest-only loans negative amortization mortgages balloon loans and hybrid ARMs Affordability originations are measured as a percentage of privately securitized origination first liens only 4 In contrast California had less investor activity during the period likely because the median home price in the state was relatively high resulting in a less attractive rate of return for potential investors
Labor market imbalances also arose as job growth became skewed toward the housing sector During the height of the boom construction employment grew 10 percent per year in these states far outpacing growth in other indus-try sectors During this time construction jobs accounted for a disproportionate 25 percent share of new jobs while representing less than 10 percent of total employment
Tipping Point Imbalances Lead to Housing Collapse Ultimately the housing boom in the Sand States proved to be mostly a mirage The first signs of trouble came in the form of sharply decelerating rates of home price appreciation Between 2003 and 2006 annual home price appreciation rates in these states had consis-tently exceeded the national average Year-over-year house price appreciation in Nevada peaked in 2004 at 37 percent In Arizona and Florida appreciation peaked in 2005 at rates more than twice the national average Since then average home prices in the four states have declined between 27 and 38 percent from their peak5
Price declines have been most severe in metropolitan markets such as Phoenix and Las Vegas which regis-tered the largest percentage declines in the nation at 34 percent and 33 percent respectively during 20086
As home prices slumped foreclosure activity rose at a startling pace While this phenomenon was occurring across the nation it was most pronounced in the Sand States According to the Mortgage Bankers Associa-tion the Sand States accounted for more than 40 percent of all mortgage foreclosures started in 2008 which is nearly double the share of mortgages held by borrowers in these four states (see Table 1) This disproportionate share of troubled mortgages in the Sand States was most acute among ARMs In 2008 these states held 46 percent of the prime ARMs outstanding nationwide and 64 percent of foreclosures started within this mortgage category
In fourth quarter 2008 foreclosure resales accounted for more than 55 percent of all California resale activity almost three times the level of a year ago Foreclosure resales were also prevalent in Las Vegas and Phoenix where this type of transaction accounted for about 71 and 65 percent respectively of house and condominium resales7
5 Federal Housing Finance Agency purchase-only index data through fourth quarter 2008 6 SampPCase-Shiller Home Price Index data as of December 2008 7 Data Quick Information Systems through wwwdqnewscom Las Vegas and Phoenix data are for February 2009
FDIC QUARTERLY 31 2009 VOLUME 3 NO 1
Table 1 Chart 1
The Sand States Account for a Disproportionately High Share of
Foreclosure Activity National Share of
Foreclosures Started
National Share of Mortgages Serviced
California Florida Arizona Nevada
192 162 44 27
129 78 27 12
Sand States Total 425 246 Source Mortgage Bankers Association
Note Data from first quarter 2008 through fourth quarter 2008 ldquoSand Statesrdquo is the aggregate of California Florida Arizona and Nevada
-20
-15
-10
-5
0
5
10
15
91 92 93 94 95 96 97 98 99 00 01 02 03 04 05 06 07 08
Year-over-Year Change in Sand State Nonfarm Employment Percent
The Construction Sector in the Sand States Has Been an Important Driver of Job Growth
Source Bureau of Labor Statistics (Haver Analytics) Note ldquoSand Statesrdquo is the aggregate of California Florida Arizona and Nevada ldquoAll Other Sectorsrdquo is the state aggregate nonfarm employment minus the construction sector
All Other Sectors Job Growth
Construction Sector Job Growth
Economic Conditions Remain Fragile as the Effects of the Housing Collapse Spread Compounding the housing-sector problems in the Sand States and elsewhere has been the virtual shutdown of private mortgage-backed securities (MBS) issuance since 2007 MBS issuance had largely financed the subprime and nontraditional lending that fueled the boom Total issuance of private MBS which had topped $1 trillion annually in both 2005 and 2006 fell precipitously thereafter totaling just over $50 billion in 2008 Meanwhile the difficulties that market partici-pants have had in valuing complex mortgage securities and the derivatives based on them have contributed to wider risk aversion in financial markets which has reached historic proportions For housing markets particularly in the credit-fueled boom markets of these four states these financial market disruptions are compounding what would in any case have been a steep and extended housing market downturn
The housing market downturn in the Sand States is now having serious ripple effects on other parts of the local economy Each of the Sand States lost jobs in 2008 The losses have been most pronounced in the construction sector which has shed more than 450000 jobs or about 24 percent between fourth quarter 2006 and fourth quarter 2008 (see Chart 1) In addition job losses have spread to the financial services and retail trade sectors Retail sales also have declined particu-larly for home improvement furniture and electronics store sales contributing to additional layoffs
Although the Sand States entered this downturn with relatively low rates of unemployment joblessness increased during 2008 to levels not seen since the 2001 recession The unemployment rates for California Florida and Nevada ranked among the top ten in the
nation as of fourth quarter 2008 While Arizonarsquos unemployment rate remained slightly below the national average as of fourth quarter 2008 it too rose markedly during the year These rising unemployment rates are due primarily to widespread job losses and to a lesser degree to additional people entering the labor force in search of employment including college gradu-ates and retirees8 Also rising unemployment claims are putting more pressure on already strained state budgets
Nonetheless a few positive albeit very preliminary signs may be emerging The volume of home sales in Arizona California and Nevada improved during 2008 relative to year-ago levels The increase in fore-closures sales is likely contributing to some renewal in sales activity In addition while a sharp decline in housing starts is eliminating construction jobs in the near term it should eventually facilitate the return to a more stable housing landscape Seasonally adjusted housing starts in the Sand States dropped 40 percent in 2007 and again in 2008 Also despite the weakened housing and labor markets population growth in Arizona California and Nevada was estimated to be above the national rate in 20089 This continued growth will be an important source of long-term hous-ing demand that will eventually help bring a measure of stability to these troubled housing markets
Authors Shayna M Olesiuk Regional Manager
Kathy R Kalser Assistant Director
8 California Employment Development Department 9 US Census estimates of state-level population growth between July 1 2007 and July 1 2008 the latest data available
FDIC QUARTERLY 32 2009 VOLUME 3 NO 1
The 2009 Economic Landscape
Financial Sector Woes Pressure the Northeast
The downturn in US housing markets that began in 2006 was arguably the catalyst for the nationrsquos ongoing recession However turmoil in the financial sector has contributed to further deterioration in the US and global economies Since 2007 a succession of financial market disturbances has heightened risk aversion and credit spreads and has severely limited the availability of credit across certain sectors of the economy These developments have placed enormous pressure on some classes of financial companies particularly those that exist outside of the regulatory umbrella and those that depend on the ability to sell loans or issue debt on the open market
The severity and duration of the recent distress has resulted in considerable job losses in the financial sector Initially job cuts were centered in residential-related financial employment such as mortgage brokers consistent with the nationrsquos housing downturn However as financial stress permeated the capital markets job losses became widespread across the finan-cial industry By fourth quarter 2008 employment in the US financial sector had declined by 24 percent from a year earlier the sharpest decline since World War II1
Retrenchment in the Nationrsquos Financial Sector Is Centered in New York Contraction in the nationrsquos financial sector is magnified in New York State and particularly New York Citymdash the nationrsquos financial center (see text box at right for the effects of financial sector contraction on other Northeast economies) Statewide the contribution of financial jobs to total wages has increased in recent years At its peak in 2007 wages from financial jobs accounted for 25 percent of statewide wages consider-ably more than their contribution at the national level (see Chart 1)
In New York City the economy ebbs and flows with fluctuations in the financial sector because the city has a large share of financial jobs Indeed the proportion of financial jobs to total employment in New York City is
Contraction in the Financial Sector Is Weighing on Other
Northeast Economies Financial employment is a major economic driver in other parts of the Northeast including some cities in New England and metropolitan areas along the East Coast Like New York these markets are vulnerable to contraction in financial employment
New Jersey particularly the metropolitan areas around New York City has a slightly higher concen-tration of financial employment than the nation In fourth quarter 2008 New Jersey lost 12500 financial jobs about 46 percent from one year ago This rate of decline was nearly double the national rate and was the largest percentage decline for the state since first quarter 1991
Boston Massachusetts and Hartford Connecticut also had high concentrations of financial sector employment at 72 percent and 117 percent respec-tively at year-end 2008 Employment in Bostonrsquos financial sector fell by 40 percent in fourth quarter 2008 the largest decline since fourth quarter 1991 Much of the decline was centered in commercial banks and securities firms although real estate employ-ment also reported job losses Employment in Hart-fordrsquos financial sector also continues to contract During the fourth quarter the arearsquos financial employ-ment declined 08 percent from one year ago
The financial sector in Charlotte North Carolina is also contracting This sector which accounted for 85 percent of the metro arearsquos total jobs in fourth quarter 2008 and 405 percent of the arearsquos economic output in 2006 (the most recent data available) has been losing jobs since mid-2007 The rate of decline rose during 2008 reaching 54 percent in the fourth quarter
Wilmington Delaware also shed financial sector jobs in the fourth quarter although the rate of loss was less than that of the nation Employment associated with credit card banking which has a substantial presence in Wilmington has been relatively steady over the past year
1 Bureau of Labor Statistics
FDIC QUARTERLY 33 2009 VOLUME 3 NO 1
Chart 1 Chart 2
5
10
15
20
25
30
90 91 92 93 94 95 96 97 98 99 00 01 02 03 04 05 06 07 08
Source Bureau of Economic Analysis (Haver Analytics) Note Financial wages are those earned in the banking insurance real estate and securities industries Data are through fourth quarter 2008 (most recent available) and are seasonally adjusted at annual rates
New York State
United States
Ratio of Financial Wages to Total Wages
New Yorkrsquos Economy Has Grown More Dependent on Financial Wages
Recessions
-20
-15
-10
-5
0
5
10
15
20
00 01 02 03 04 05 06 07 08
Source Bureau of Labor Statistics (Haver Analytics) Note Data are through fourth quarter 2008 and are not seasonally adjusted
Securities Industry - New York City
Securities Industry - Rest of the US
Employment Losses in the Securities Industry Are Centered in New York City
Year-over-Year Change
12 percent or double the national share Perhaps more important wages in the securities industry a key component of the cityrsquos financial sector account for a disproportionate share of total wages paid in the city Wages in the securities industry accounted for more than 25 percent of total wages paid in the city but the industry itself accounted for only 5 percent of total jobs Securities industry wages increased almost four times faster than wages in the rest of New York City between 2003 and 20072
As the disruption in financial markets persisted during 2008 job losses in New York Cityrsquos financial sector continued to mount The securities industry was particularly hard hit During fourth quarter 2008 the cityrsquos securities industry lost more than 9000 jobs a 48 percent decline compared with one year earlier and the worst percentage decline since second quarter 2003 (see Chart 2)
Job losses in the cityrsquos securities industry will be ampli-fied across other sectors of the economy According to the New York State Comptroller for every new job in the securities industry three additional jobs are created in New York City and its suburbs Conversely losses in the securities industry will have a ripple effect across the arearsquos economy Estimates suggest that during the 2001 recession this sector directly and indirectly
2 New York State Comptroller The Securities Industry in New York City November 2008 Data are as of 2007 The securities industrymdasha component of the broader financial industrymdashis composed of jobs classified as securities and commodities brokers portfolio managers and investment advisors This sector accounted for more than one-third of financial jobs in New York City in fourth quarter 2008
contributed to more than half of the private sector jobs lost in the city3
In addition the sharp downturn in New Yorkrsquos finan-cial sector is negatively affecting state and local tax budgets In fiscal year 2007ndash2008 tax collections from the securities industry accounted for almost 20 percent of total tax collections in New York State The New York State Comptroller estimated that state tax collec-tions from the securities industry including business and personal filings could drop by 38 percent in fiscal 20104
Job losses and reduced compensation in New York Cityrsquos financial sector are also having a detrimental effect across real estate markets Home prices in the New York City metro area declined by 92 percent on average in 2008 This year-over-year decline in home prices was the largest in the 22-year history of these data slightly exceeding the previous high recorded in March 19915 Still New York City home prices fell much less during 2008 than in some other major cities which saw double-digit declines
New York Cityrsquos commercial real estate market is also showing signs of weakness particularly in Manhattan
3 Ibid 4 Ibid 5 SampPCase-Shiller Home Price Index This index defines the New York metro area as the New York City metropolitan statistical area plus other counties in New York State Connecticut New Jersey and Penn-sylvania that are within commuting distance of New York City Declines are calculated based on the year-over-year percentage change in home prices
FDIC QUARTERLY 34 2009 VOLUME 3 NO 1
2009 Economic Landscape
The financial sector occupies as much as 30 percent of Manhattanrsquos office space6 With intensifying pressure in the financial sector office rents are dropping The arearsquos vacancy rates are also on the rise but remained below the national average at year-end 20087 However a size-able amount of office space is estimated to return to the market which may further pressure rental and vacancy rates Some estimates suggest that the percentage of available office space in Manhattan may soon rise to its highest level since 19968
New York Cityrsquos Financial Industry Has Been Resilient in Past Cycles Forecasts suggest that job losses in New York Cityrsquos financial industry will get worse before they get better A March 2009 report by the New York City Indepen-dent Budget Office states that the city could lose 51000 securities industry jobs through third quarter 2011 which would be a decline of about 27 percent from the 2008 peak9 Job losses of this magnitude would
6 Grubb and Ellis Research Office Market Trends New York City second quarter 2008 7 Torto Wheaton Research fourth quarter 2008 8 David M Levitt ldquoBanks Vacate Towers Pushing Empty NYC Space to Recordrdquo Bloombergcom February 26 2008 wwwbloombergcom appsnewspid=newsarchiveampsid=aSYcApYshDw (accessed on March 2 2009) 9 New York City Independent Budget Office Analysis of the Mayorrsquos Preliminary Budget for 2010 IBOrsquos Reestimate of the Mayorrsquos Prelimi-nary Budget for 2010 and the Financial Plan through 2013 March 2009
exceed the number of securities jobs lost in the city during either the 1990ndash91 or 2001 recession10 In addi-tion job losses in New York Cityrsquos overall financial sector are projected to reach 8980011 According to the March report job growth in the financial sector is fore-cast to resume in 2012 and 2013 but at a slow pace
Although the near-term outlook for the financial services industry in New York City remains tenuous the cityrsquos financial sector should recover as it has following every recession since World War II During its long history New Yorkrsquos financial sector has proven resilient and resurgent following periods of adversity
Authors Robert M DiChiara Regional Manager
Kathy R Kalser Assistant Director
The authors would like to thank Norman Gertner Regional Economist Division of Insurance and Research for his contributions to this article
10 FDIC analysis quarterly data from the Bureau of Labor Statistics and annual data from the Securities Industry and Financial Markets Association 11 David Belkin (senior economist New York City Independent Budget Office) in discussion with FDIC staff April 2009 regarding the Analy-sis of the Mayorrsquos Preliminary Budget for 2010 dated March 2009
FDIC QUARTERLY 35 2009 VOLUME 3 NO 1
The 2009 Economic Landscape
How Long Can Energy and Agriculture Boost the Nationrsquos Midsection
The energy and agricultural sectors are important economic drivers for states in the center of the country Extending from the oil patch of Texas Louisiana Arkansas and Oklahoma northward through the plains states and eastward to the Corn Belt the states in the nationrsquos midsection are not only rich in land and other natural resources but also tend to rely heav-ily on these resources as drivers of economic activity Booming commodity prices during the middle years of this decade have helped buoy the economies of these states even while the rest of the country was moving toward recession However recent declines in many of these same commodity prices raise concerns about wider economic repercussions for these regions as the US recession continues This article describes how commodity industries drive the economies of the nationrsquos midsection and evaluates their outlook after the commodity price boom
Energy and Agriculture Regions Do Not Always Follow the US Business Cycle Energy prices can have a profound effect on the national economy In fact since World War II nearly all recessions were preceded by oil price shocks These shocks adversely affect businesses and consumers caus-ing economic growth to slow For example around the time of the Iranian revolution in 1979 oil prices doubled within a year contributing to the 1980 and 1981ndash82 national recessions Similarly the 1990ndash91 recession was precipitated in part by another doubling of oil prices in the months following the invasion of Kuwait and leading up to the first Gulf War
Unlike the rest of the nation oil-patch states tend to benefit from higher oil prices In the early 1980s and early 1990s higher oil prices helped these states grow even during national recessions However when prices collapsed during the mid-1980s oil-patch states fell into their own regional recession The lingering effects of the ldquooil bustrdquo resulted in falling real incomes in the region The subsequent loss of jobs income and output contributed to house price declines that created turmoil
in residential real estate markets and led to hundreds of bank failures1
Like the energy sector agriculture does not move in perfect tandem with the national economy though influences from US and global trends can be strong For example global economic conditions affect the demand for food which helps drive agricultural commodity prices In addition large interest rate move-ments can have a profound effect on farmland prices For example in the early 1970s strong demand for farm commodities caused farm incomes to rise rapidly When combined with negative real interest rates this favor-able environment caused sharp increases in the value of farmland In the late 1970s however soaring interest rates and changing conditions in global supply and demand brought the boom period to an end The result was a significant decline in real farm incomes a rapid and long-lasting decline in farmland values and hundreds of farm bank failures in the 1980s2
Energy and Agriculture Boomed through Mid-Year 2008 Current energy and agricultural conditions have for the most part played out independently of national economic trends Despite the weakening US economy the health of the energy and agricultural industries has been very strong over the past several years Crude oil prices quadrupled in dollar terms between 2003 and mid-2008 setting the trend for overall energy prices This price inflation was an economic boon to oil-patch states3 During the five-year period ending in second quarter 2008 inflation-adjusted economic growth in these four states grew at an annualized rate of 36 percent
1 FDIC History of the EightiesmdashLessons for the Future (Washington DC FDIC 1997) 291ndash336 2 Ibid 259ndash290 3 While the energy discussion and analysis in this article focus on oil-patch states it should be noted that Wyoming and Montana have characteristics similar to this region Both states rely considerably on energy extraction and experienced employment growth above the national average during the period of high oil prices Wyoming in fact had one of the most vibrant economies in the nation during that time
FDIC QUARTERLY 36 2009 VOLUME 3 NO 1
2009 Economic Landscape
Chart 1 Map 1
60 70 80 90
100 110 120 130 140 150 160
Jan-80 Jan-84 Jan-88 Jan-92 Jan-96 Jan-00 Jan-04 Jan-08
Source US Department of Agriculture Note ldquoPrices received by farmersrdquo is a composite index of leading crop and livestock prices produced in the United States The prices of these commodities are ldquofarm-gaterdquo or wholesale prices
Agricultural Prices Rose Steadily from Late 2002 through Mid-2008 but Have Settled Somewhat since Then
Prices Received by Farmers Index 1990-92=100
compared with 28 percent for the nation4 The biggest impact however was on real personal income which grew at an annualized rate of 46 percent in the four oil-patch states compared with only 29 percent nationally The regionrsquos oil and gas industry not only supports a large number of high-paying jobs in the mining industry itself but also has strong indirect multiplier effects on job growth in professional and business services whole-sale and retail trade and financial activities
The agricultural sector also has performed quite well over the past few years A number of factors including global economic growth and a weaker dollar contrib-uted to an extended period of rising prices for a broad array of agricultural products Prices for these commodi-ties generally began to rise in late 2002 and many reached new highs in the past two years before moder-ating in the second half of 2008 (see Chart 1) High commodity prices have led to record net farm incomes in three of the past four years and also have contributed to significant increases in farmland values5
Ethanol production has also played an important role in both agricultural and energy markets in recent years As the price of crude oil increased from less than $26 per barrel in 2001 to more than $133 per barrel in July 2008 ethanol became a viable and very profitable alter-
4 Growth rates used in this paragraph were calculated by the FDIC using data from the US Bureau of Economic Analysis and Moodyrsquos Economycom 5 For a detailed farmland analysis see Richard D Cofer Jeffrey W Walser and Troy D Osborne ldquoDo Record Farmland Prices Portend Another Steep Downturn for Agriculture and Farm Banksrdquo FDIC Quar-terly 2 no 4 (2008) 25
The Center of the Nation Has Avoided Significant Job Losses in This Recession
Employment Growth Percent Change December 2007 - January 2009
gt0 0 to -2 -2 to -4 Source Bureau of Labor Statistics US Average -25
(Haver Analytics) lt-4
native Strong profitability government mandates on renewable fuels that supported demand and tariffs and subsidies that supported prices all led to considerable increases in ethanol output6 Indeed annual ethanol output in 2008 had grown by more than five times the levels of 20007 The growth in ethanol production in turn increased the demand for corn the primary input in the production process to a point where ethanol production is projected to use nearly 30 percent of the 2008 crop8 As farmers planted more corn to meet the higher demand from ethanol plants they reduced plant-ings of soybeans which contributed to higher prices for this commodity as well The result was record incomes for farmers and double-digit average annual increases in farmland values in corn- and soybean-producing states between 2003 and 2007
The health of the energy and agricultural sectors combined with relatively stable and affordable housing markets in the central United States has caused the national recession to largely bypass the nationrsquos midsec-tion so far (see Map 1) The energy-rich oil patch was
6 Don Hofstrand ldquoCorn-Ethanol Profitabilityrdquo AgMRC Renewable Energy Newsletter Agricultural Marketing Resource Center November December 2008 and Bruce A Babcock Center for Agricultural and Rural Development at Iowa State University statement before the US Senate Committee on Homeland Security and Government Affairs Hearing on Fuel Subsidies and Impact on Food Prices 110th Cong 2nd sess May 7 2008 7 Renewable Fuels Association Ethanol Industry Outlook 2009 8 ldquoWorld Agricultural Supply and Demand Estimatesrdquo US Department of Agriculture January 12 2009
FDIC QUARTERLY 37 2009 VOLUME 3 NO 1
the only region that added jobs after the national reces-sion began in December 2007 and Farm Belt states reported small job losses relative to the rest of the nation
The Outlook for Energy and Agriculture Has Dimmed Though the energy and agricultural sectors have provided insulation against recession for the central United States these sectors have weakened consider-ably in recent months The Energy Information Administrationrsquos (EIA) short-term energy outlook is projecting a long severe global economic slowdown that will lead to further reductions in global energy demand and additional declines in crude oil and other energy prices9 The EIA projects oil prices in 2009 to average between $40 and $50 per barrel on a quarterly basis but prices could plunge below $3010 Falling energy prices are now putting pressure on oil-patch employment growth (see Chart 2) This trend alone should not cause a repeat of the 1980s oil bust as the regionrsquos economy has become increasingly diverse since that time somewhat muting the impact of oil price movements11 However when falling energy prices are combined with a severe national recession and a global financial crisis a significant regional downturn cannot be ruled out
Declining agricultural commodity prices are also of concern A severe downward price cycle in agricultural commodities and land values that causes farm incomes and land values to fall could result in prolonged economic weakness among farm states Aggravating the situation could be a rapid and significant consolidation in the ethanol industry which was already showing weakness in mid-2008 because of overcapacity and low margins caused by high corn prices Some of the largest ethanol producers delayed the startup of ethanol plants last year and some analysts predicted that many small and medium-sized plants would shut down12 Deteriorat-ing conditions in the ethanol industry will not only
9 Energy Information Administration Short-Term Energy Outlook December 2008 10 Several leading analysts have discussed the possibility of oil prices falling below $30 per barrel in 2009 One notable example is ldquoOil May Fall Below $25 Next Year Merrill Lynch Saysrdquo Bloombergcom December 4 2008 11 Stephen PA Brown and Mine K Yucel ldquoEnergy Prices and State Economic Performancerdquo Federal Reserve Bank of Dallas Economic Review second quarter 1995 12 ldquoToo Much Ethanolrdquo Farm Industry News November 1 2008
Chart 2
$0
$20
$40
$60
$80
$100
$120
$140
$160
1995 1997 1999 2001 2003 2005 2007 2009 -2
-1
0
1
2
3
4
5
The Recent Downturn in Oil Prices Appears to Spell the End of the Growth Period in Oil-Patch Employment
Sources Wall Street Journal Bureau of Labor Statistics (Haver Analytics) FDIC
Year-over-Year Employment Growth Oil-Patch States
Dollars per Barrel (2008 dollars)
weigh on crop prices but are also likely to affect farmers and rural communities who have come to rely on the industry for high-paying jobs
Though the economies in the nationrsquos midsection continue to perform well relative to the nation the downward trends in the energy and agricultural sectors may weigh on the region in the near future Moderating commodity prices are likely to put a damper on the arearsquos economic conditions and the region may not only cease to be a source of economic strength but also could enter recession at a much later stage than the nation
Authors Adrian R Sanchez Regional Economist
John M Anderlik Assistant Director
FDIC QUARTERLY 38 2009 VOLUME 3 NO 1
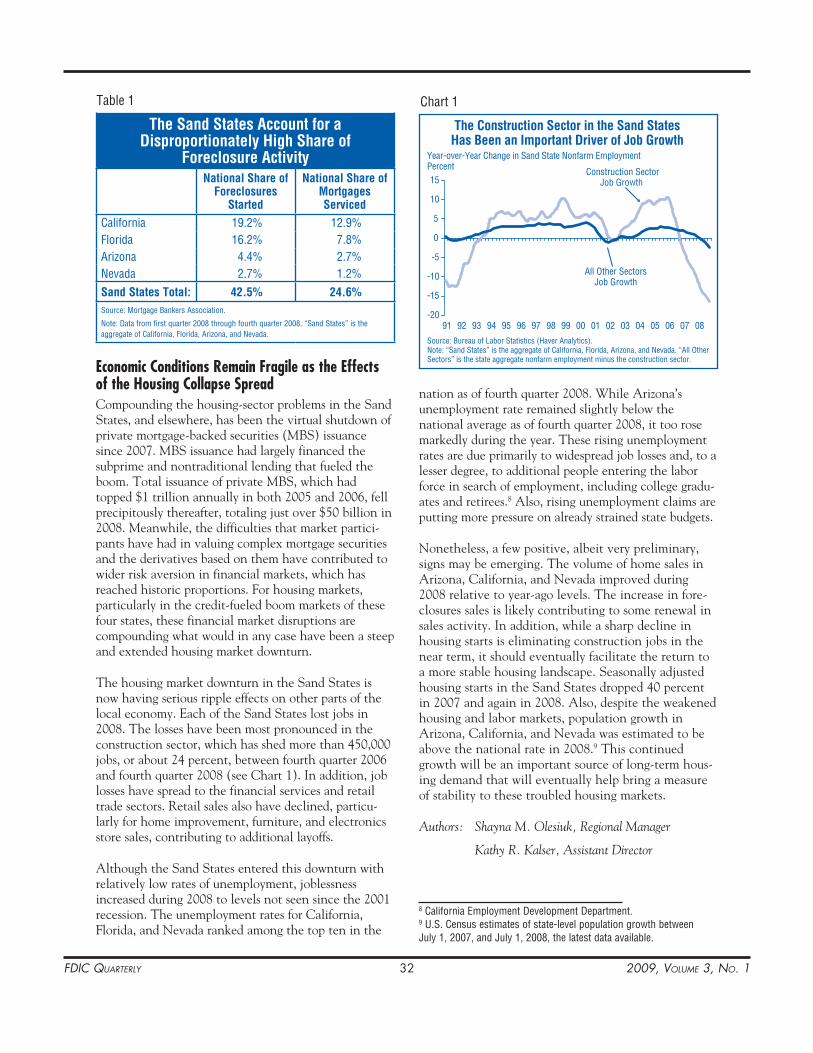

The 2009 Economic Landscape
Financial Sector Woes Pressure the Northeast
The downturn in US housing markets that began in 2006 was arguably the catalyst for the nationrsquos ongoing recession However turmoil in the financial sector has contributed to further deterioration in the US and global economies Since 2007 a succession of financial market disturbances has heightened risk aversion and credit spreads and has severely limited the availability of credit across certain sectors of the economy These developments have placed enormous pressure on some classes of financial companies particularly those that exist outside of the regulatory umbrella and those that depend on the ability to sell loans or issue debt on the open market
The severity and duration of the recent distress has resulted in considerable job losses in the financial sector Initially job cuts were centered in residential-related financial employment such as mortgage brokers consistent with the nationrsquos housing downturn However as financial stress permeated the capital markets job losses became widespread across the finan-cial industry By fourth quarter 2008 employment in the US financial sector had declined by 24 percent from a year earlier the sharpest decline since World War II1
Retrenchment in the Nationrsquos Financial Sector Is Centered in New York Contraction in the nationrsquos financial sector is magnified in New York State and particularly New York Citymdash the nationrsquos financial center (see text box at right for the effects of financial sector contraction on other Northeast economies) Statewide the contribution of financial jobs to total wages has increased in recent years At its peak in 2007 wages from financial jobs accounted for 25 percent of statewide wages consider-ably more than their contribution at the national level (see Chart 1)
In New York City the economy ebbs and flows with fluctuations in the financial sector because the city has a large share of financial jobs Indeed the proportion of financial jobs to total employment in New York City is
Contraction in the Financial Sector Is Weighing on Other
Northeast Economies Financial employment is a major economic driver in other parts of the Northeast including some cities in New England and metropolitan areas along the East Coast Like New York these markets are vulnerable to contraction in financial employment
New Jersey particularly the metropolitan areas around New York City has a slightly higher concen-tration of financial employment than the nation In fourth quarter 2008 New Jersey lost 12500 financial jobs about 46 percent from one year ago This rate of decline was nearly double the national rate and was the largest percentage decline for the state since first quarter 1991
Boston Massachusetts and Hartford Connecticut also had high concentrations of financial sector employment at 72 percent and 117 percent respec-tively at year-end 2008 Employment in Bostonrsquos financial sector fell by 40 percent in fourth quarter 2008 the largest decline since fourth quarter 1991 Much of the decline was centered in commercial banks and securities firms although real estate employ-ment also reported job losses Employment in Hart-fordrsquos financial sector also continues to contract During the fourth quarter the arearsquos financial employ-ment declined 08 percent from one year ago
The financial sector in Charlotte North Carolina is also contracting This sector which accounted for 85 percent of the metro arearsquos total jobs in fourth quarter 2008 and 405 percent of the arearsquos economic output in 2006 (the most recent data available) has been losing jobs since mid-2007 The rate of decline rose during 2008 reaching 54 percent in the fourth quarter
Wilmington Delaware also shed financial sector jobs in the fourth quarter although the rate of loss was less than that of the nation Employment associated with credit card banking which has a substantial presence in Wilmington has been relatively steady over the past year
1 Bureau of Labor Statistics
FDIC QUARTERLY 33 2009 VOLUME 3 NO 1
Chart 1 Chart 2
5
10
15
20
25
30
90 91 92 93 94 95 96 97 98 99 00 01 02 03 04 05 06 07 08
Source Bureau of Economic Analysis (Haver Analytics) Note Financial wages are those earned in the banking insurance real estate and securities industries Data are through fourth quarter 2008 (most recent available) and are seasonally adjusted at annual rates
New York State
United States
Ratio of Financial Wages to Total Wages
New Yorkrsquos Economy Has Grown More Dependent on Financial Wages
Recessions
-20
-15
-10
-5
0
5
10
15
20
00 01 02 03 04 05 06 07 08
Source Bureau of Labor Statistics (Haver Analytics) Note Data are through fourth quarter 2008 and are not seasonally adjusted
Securities Industry - New York City
Securities Industry - Rest of the US
Employment Losses in the Securities Industry Are Centered in New York City
Year-over-Year Change
12 percent or double the national share Perhaps more important wages in the securities industry a key component of the cityrsquos financial sector account for a disproportionate share of total wages paid in the city Wages in the securities industry accounted for more than 25 percent of total wages paid in the city but the industry itself accounted for only 5 percent of total jobs Securities industry wages increased almost four times faster than wages in the rest of New York City between 2003 and 20072
As the disruption in financial markets persisted during 2008 job losses in New York Cityrsquos financial sector continued to mount The securities industry was particularly hard hit During fourth quarter 2008 the cityrsquos securities industry lost more than 9000 jobs a 48 percent decline compared with one year earlier and the worst percentage decline since second quarter 2003 (see Chart 2)
Job losses in the cityrsquos securities industry will be ampli-fied across other sectors of the economy According to the New York State Comptroller for every new job in the securities industry three additional jobs are created in New York City and its suburbs Conversely losses in the securities industry will have a ripple effect across the arearsquos economy Estimates suggest that during the 2001 recession this sector directly and indirectly
2 New York State Comptroller The Securities Industry in New York City November 2008 Data are as of 2007 The securities industrymdasha component of the broader financial industrymdashis composed of jobs classified as securities and commodities brokers portfolio managers and investment advisors This sector accounted for more than one-third of financial jobs in New York City in fourth quarter 2008
contributed to more than half of the private sector jobs lost in the city3
In addition the sharp downturn in New Yorkrsquos finan-cial sector is negatively affecting state and local tax budgets In fiscal year 2007ndash2008 tax collections from the securities industry accounted for almost 20 percent of total tax collections in New York State The New York State Comptroller estimated that state tax collec-tions from the securities industry including business and personal filings could drop by 38 percent in fiscal 20104
Job losses and reduced compensation in New York Cityrsquos financial sector are also having a detrimental effect across real estate markets Home prices in the New York City metro area declined by 92 percent on average in 2008 This year-over-year decline in home prices was the largest in the 22-year history of these data slightly exceeding the previous high recorded in March 19915 Still New York City home prices fell much less during 2008 than in some other major cities which saw double-digit declines
New York Cityrsquos commercial real estate market is also showing signs of weakness particularly in Manhattan
3 Ibid 4 Ibid 5 SampPCase-Shiller Home Price Index This index defines the New York metro area as the New York City metropolitan statistical area plus other counties in New York State Connecticut New Jersey and Penn-sylvania that are within commuting distance of New York City Declines are calculated based on the year-over-year percentage change in home prices
FDIC QUARTERLY 34 2009 VOLUME 3 NO 1
2009 Economic Landscape
The financial sector occupies as much as 30 percent of Manhattanrsquos office space6 With intensifying pressure in the financial sector office rents are dropping The arearsquos vacancy rates are also on the rise but remained below the national average at year-end 20087 However a size-able amount of office space is estimated to return to the market which may further pressure rental and vacancy rates Some estimates suggest that the percentage of available office space in Manhattan may soon rise to its highest level since 19968
New York Cityrsquos Financial Industry Has Been Resilient in Past Cycles Forecasts suggest that job losses in New York Cityrsquos financial industry will get worse before they get better A March 2009 report by the New York City Indepen-dent Budget Office states that the city could lose 51000 securities industry jobs through third quarter 2011 which would be a decline of about 27 percent from the 2008 peak9 Job losses of this magnitude would
6 Grubb and Ellis Research Office Market Trends New York City second quarter 2008 7 Torto Wheaton Research fourth quarter 2008 8 David M Levitt ldquoBanks Vacate Towers Pushing Empty NYC Space to Recordrdquo Bloombergcom February 26 2008 wwwbloombergcom appsnewspid=newsarchiveampsid=aSYcApYshDw (accessed on March 2 2009) 9 New York City Independent Budget Office Analysis of the Mayorrsquos Preliminary Budget for 2010 IBOrsquos Reestimate of the Mayorrsquos Prelimi-nary Budget for 2010 and the Financial Plan through 2013 March 2009
exceed the number of securities jobs lost in the city during either the 1990ndash91 or 2001 recession10 In addi-tion job losses in New York Cityrsquos overall financial sector are projected to reach 8980011 According to the March report job growth in the financial sector is fore-cast to resume in 2012 and 2013 but at a slow pace
Although the near-term outlook for the financial services industry in New York City remains tenuous the cityrsquos financial sector should recover as it has following every recession since World War II During its long history New Yorkrsquos financial sector has proven resilient and resurgent following periods of adversity
Authors Robert M DiChiara Regional Manager
Kathy R Kalser Assistant Director
The authors would like to thank Norman Gertner Regional Economist Division of Insurance and Research for his contributions to this article
10 FDIC analysis quarterly data from the Bureau of Labor Statistics and annual data from the Securities Industry and Financial Markets Association 11 David Belkin (senior economist New York City Independent Budget Office) in discussion with FDIC staff April 2009 regarding the Analy-sis of the Mayorrsquos Preliminary Budget for 2010 dated March 2009
FDIC QUARTERLY 35 2009 VOLUME 3 NO 1
The 2009 Economic Landscape
How Long Can Energy and Agriculture Boost the Nationrsquos Midsection
The energy and agricultural sectors are important economic drivers for states in the center of the country Extending from the oil patch of Texas Louisiana Arkansas and Oklahoma northward through the plains states and eastward to the Corn Belt the states in the nationrsquos midsection are not only rich in land and other natural resources but also tend to rely heav-ily on these resources as drivers of economic activity Booming commodity prices during the middle years of this decade have helped buoy the economies of these states even while the rest of the country was moving toward recession However recent declines in many of these same commodity prices raise concerns about wider economic repercussions for these regions as the US recession continues This article describes how commodity industries drive the economies of the nationrsquos midsection and evaluates their outlook after the commodity price boom
Energy and Agriculture Regions Do Not Always Follow the US Business Cycle Energy prices can have a profound effect on the national economy In fact since World War II nearly all recessions were preceded by oil price shocks These shocks adversely affect businesses and consumers caus-ing economic growth to slow For example around the time of the Iranian revolution in 1979 oil prices doubled within a year contributing to the 1980 and 1981ndash82 national recessions Similarly the 1990ndash91 recession was precipitated in part by another doubling of oil prices in the months following the invasion of Kuwait and leading up to the first Gulf War
Unlike the rest of the nation oil-patch states tend to benefit from higher oil prices In the early 1980s and early 1990s higher oil prices helped these states grow even during national recessions However when prices collapsed during the mid-1980s oil-patch states fell into their own regional recession The lingering effects of the ldquooil bustrdquo resulted in falling real incomes in the region The subsequent loss of jobs income and output contributed to house price declines that created turmoil
in residential real estate markets and led to hundreds of bank failures1
Like the energy sector agriculture does not move in perfect tandem with the national economy though influences from US and global trends can be strong For example global economic conditions affect the demand for food which helps drive agricultural commodity prices In addition large interest rate move-ments can have a profound effect on farmland prices For example in the early 1970s strong demand for farm commodities caused farm incomes to rise rapidly When combined with negative real interest rates this favor-able environment caused sharp increases in the value of farmland In the late 1970s however soaring interest rates and changing conditions in global supply and demand brought the boom period to an end The result was a significant decline in real farm incomes a rapid and long-lasting decline in farmland values and hundreds of farm bank failures in the 1980s2
Energy and Agriculture Boomed through Mid-Year 2008 Current energy and agricultural conditions have for the most part played out independently of national economic trends Despite the weakening US economy the health of the energy and agricultural industries has been very strong over the past several years Crude oil prices quadrupled in dollar terms between 2003 and mid-2008 setting the trend for overall energy prices This price inflation was an economic boon to oil-patch states3 During the five-year period ending in second quarter 2008 inflation-adjusted economic growth in these four states grew at an annualized rate of 36 percent
1 FDIC History of the EightiesmdashLessons for the Future (Washington DC FDIC 1997) 291ndash336 2 Ibid 259ndash290 3 While the energy discussion and analysis in this article focus on oil-patch states it should be noted that Wyoming and Montana have characteristics similar to this region Both states rely considerably on energy extraction and experienced employment growth above the national average during the period of high oil prices Wyoming in fact had one of the most vibrant economies in the nation during that time
FDIC QUARTERLY 36 2009 VOLUME 3 NO 1
2009 Economic Landscape
Chart 1 Map 1
60 70 80 90
100 110 120 130 140 150 160
Jan-80 Jan-84 Jan-88 Jan-92 Jan-96 Jan-00 Jan-04 Jan-08
Source US Department of Agriculture Note ldquoPrices received by farmersrdquo is a composite index of leading crop and livestock prices produced in the United States The prices of these commodities are ldquofarm-gaterdquo or wholesale prices
Agricultural Prices Rose Steadily from Late 2002 through Mid-2008 but Have Settled Somewhat since Then
Prices Received by Farmers Index 1990-92=100
compared with 28 percent for the nation4 The biggest impact however was on real personal income which grew at an annualized rate of 46 percent in the four oil-patch states compared with only 29 percent nationally The regionrsquos oil and gas industry not only supports a large number of high-paying jobs in the mining industry itself but also has strong indirect multiplier effects on job growth in professional and business services whole-sale and retail trade and financial activities
The agricultural sector also has performed quite well over the past few years A number of factors including global economic growth and a weaker dollar contrib-uted to an extended period of rising prices for a broad array of agricultural products Prices for these commodi-ties generally began to rise in late 2002 and many reached new highs in the past two years before moder-ating in the second half of 2008 (see Chart 1) High commodity prices have led to record net farm incomes in three of the past four years and also have contributed to significant increases in farmland values5
Ethanol production has also played an important role in both agricultural and energy markets in recent years As the price of crude oil increased from less than $26 per barrel in 2001 to more than $133 per barrel in July 2008 ethanol became a viable and very profitable alter-
4 Growth rates used in this paragraph were calculated by the FDIC using data from the US Bureau of Economic Analysis and Moodyrsquos Economycom 5 For a detailed farmland analysis see Richard D Cofer Jeffrey W Walser and Troy D Osborne ldquoDo Record Farmland Prices Portend Another Steep Downturn for Agriculture and Farm Banksrdquo FDIC Quar-terly 2 no 4 (2008) 25
The Center of the Nation Has Avoided Significant Job Losses in This Recession
Employment Growth Percent Change December 2007 - January 2009
gt0 0 to -2 -2 to -4 Source Bureau of Labor Statistics US Average -25
(Haver Analytics) lt-4
native Strong profitability government mandates on renewable fuels that supported demand and tariffs and subsidies that supported prices all led to considerable increases in ethanol output6 Indeed annual ethanol output in 2008 had grown by more than five times the levels of 20007 The growth in ethanol production in turn increased the demand for corn the primary input in the production process to a point where ethanol production is projected to use nearly 30 percent of the 2008 crop8 As farmers planted more corn to meet the higher demand from ethanol plants they reduced plant-ings of soybeans which contributed to higher prices for this commodity as well The result was record incomes for farmers and double-digit average annual increases in farmland values in corn- and soybean-producing states between 2003 and 2007
The health of the energy and agricultural sectors combined with relatively stable and affordable housing markets in the central United States has caused the national recession to largely bypass the nationrsquos midsec-tion so far (see Map 1) The energy-rich oil patch was
6 Don Hofstrand ldquoCorn-Ethanol Profitabilityrdquo AgMRC Renewable Energy Newsletter Agricultural Marketing Resource Center November December 2008 and Bruce A Babcock Center for Agricultural and Rural Development at Iowa State University statement before the US Senate Committee on Homeland Security and Government Affairs Hearing on Fuel Subsidies and Impact on Food Prices 110th Cong 2nd sess May 7 2008 7 Renewable Fuels Association Ethanol Industry Outlook 2009 8 ldquoWorld Agricultural Supply and Demand Estimatesrdquo US Department of Agriculture January 12 2009
FDIC QUARTERLY 37 2009 VOLUME 3 NO 1
the only region that added jobs after the national reces-sion began in December 2007 and Farm Belt states reported small job losses relative to the rest of the nation
The Outlook for Energy and Agriculture Has Dimmed Though the energy and agricultural sectors have provided insulation against recession for the central United States these sectors have weakened consider-ably in recent months The Energy Information Administrationrsquos (EIA) short-term energy outlook is projecting a long severe global economic slowdown that will lead to further reductions in global energy demand and additional declines in crude oil and other energy prices9 The EIA projects oil prices in 2009 to average between $40 and $50 per barrel on a quarterly basis but prices could plunge below $3010 Falling energy prices are now putting pressure on oil-patch employment growth (see Chart 2) This trend alone should not cause a repeat of the 1980s oil bust as the regionrsquos economy has become increasingly diverse since that time somewhat muting the impact of oil price movements11 However when falling energy prices are combined with a severe national recession and a global financial crisis a significant regional downturn cannot be ruled out
Declining agricultural commodity prices are also of concern A severe downward price cycle in agricultural commodities and land values that causes farm incomes and land values to fall could result in prolonged economic weakness among farm states Aggravating the situation could be a rapid and significant consolidation in the ethanol industry which was already showing weakness in mid-2008 because of overcapacity and low margins caused by high corn prices Some of the largest ethanol producers delayed the startup of ethanol plants last year and some analysts predicted that many small and medium-sized plants would shut down12 Deteriorat-ing conditions in the ethanol industry will not only
9 Energy Information Administration Short-Term Energy Outlook December 2008 10 Several leading analysts have discussed the possibility of oil prices falling below $30 per barrel in 2009 One notable example is ldquoOil May Fall Below $25 Next Year Merrill Lynch Saysrdquo Bloombergcom December 4 2008 11 Stephen PA Brown and Mine K Yucel ldquoEnergy Prices and State Economic Performancerdquo Federal Reserve Bank of Dallas Economic Review second quarter 1995 12 ldquoToo Much Ethanolrdquo Farm Industry News November 1 2008
Chart 2
$0
$20
$40
$60
$80
$100
$120
$140
$160
1995 1997 1999 2001 2003 2005 2007 2009 -2
-1
0
1
2
3
4
5
The Recent Downturn in Oil Prices Appears to Spell the End of the Growth Period in Oil-Patch Employment
Sources Wall Street Journal Bureau of Labor Statistics (Haver Analytics) FDIC
Year-over-Year Employment Growth Oil-Patch States
Dollars per Barrel (2008 dollars)
weigh on crop prices but are also likely to affect farmers and rural communities who have come to rely on the industry for high-paying jobs
Though the economies in the nationrsquos midsection continue to perform well relative to the nation the downward trends in the energy and agricultural sectors may weigh on the region in the near future Moderating commodity prices are likely to put a damper on the arearsquos economic conditions and the region may not only cease to be a source of economic strength but also could enter recession at a much later stage than the nation
Authors Adrian R Sanchez Regional Economist
John M Anderlik Assistant Director
FDIC QUARTERLY 38 2009 VOLUME 3 NO 1
2009 Economic Landscape
The financial sector occupies as much as 30 percent of Manhattanrsquos office space6 With intensifying pressure in the financial sector office rents are dropping The arearsquos vacancy rates are also on the rise but remained below the national average at year-end 20087 However a size-able amount of office space is estimated to return to the market which may further pressure rental and vacancy rates Some estimates suggest that the percentage of available office space in Manhattan may soon rise to its highest level since 19968
New York Cityrsquos Financial Industry Has Been Resilient in Past Cycles Forecasts suggest that job losses in New York Cityrsquos financial industry will get worse before they get better A March 2009 report by the New York City Indepen-dent Budget Office states that the city could lose 51000 securities industry jobs through third quarter 2011 which would be a decline of about 27 percent from the 2008 peak9 Job losses of this magnitude would
6 Grubb and Ellis Research Office Market Trends New York City second quarter 2008 7 Torto Wheaton Research fourth quarter 2008 8 David M Levitt ldquoBanks Vacate Towers Pushing Empty NYC Space to Recordrdquo Bloombergcom February 26 2008 wwwbloombergcom appsnewspid=newsarchiveampsid=aSYcApYshDw (accessed on March 2 2009) 9 New York City Independent Budget Office Analysis of the Mayorrsquos Preliminary Budget for 2010 IBOrsquos Reestimate of the Mayorrsquos Prelimi-nary Budget for 2010 and the Financial Plan through 2013 March 2009
exceed the number of securities jobs lost in the city during either the 1990ndash91 or 2001 recession10 In addi-tion job losses in New York Cityrsquos overall financial sector are projected to reach 8980011 According to the March report job growth in the financial sector is fore-cast to resume in 2012 and 2013 but at a slow pace
Although the near-term outlook for the financial services industry in New York City remains tenuous the cityrsquos financial sector should recover as it has following every recession since World War II During its long history New Yorkrsquos financial sector has proven resilient and resurgent following periods of adversity
Authors Robert M DiChiara Regional Manager
Kathy R Kalser Assistant Director
The authors would like to thank Norman Gertner Regional Economist Division of Insurance and Research for his contributions to this article
10 FDIC analysis quarterly data from the Bureau of Labor Statistics and annual data from the Securities Industry and Financial Markets Association 11 David Belkin (senior economist New York City Independent Budget Office) in discussion with FDIC staff April 2009 regarding the Analy-sis of the Mayorrsquos Preliminary Budget for 2010 dated March 2009
FDIC QUARTERLY 35 2009 VOLUME 3 NO 1
The 2009 Economic Landscape
How Long Can Energy and Agriculture Boost the Nationrsquos Midsection
The energy and agricultural sectors are important economic drivers for states in the center of the country Extending from the oil patch of Texas Louisiana Arkansas and Oklahoma northward through the plains states and eastward to the Corn Belt the states in the nationrsquos midsection are not only rich in land and other natural resources but also tend to rely heav-ily on these resources as drivers of economic activity Booming commodity prices during the middle years of this decade have helped buoy the economies of these states even while the rest of the country was moving toward recession However recent declines in many of these same commodity prices raise concerns about wider economic repercussions for these regions as the US recession continues This article describes how commodity industries drive the economies of the nationrsquos midsection and evaluates their outlook after the commodity price boom
Energy and Agriculture Regions Do Not Always Follow the US Business Cycle Energy prices can have a profound effect on the national economy In fact since World War II nearly all recessions were preceded by oil price shocks These shocks adversely affect businesses and consumers caus-ing economic growth to slow For example around the time of the Iranian revolution in 1979 oil prices doubled within a year contributing to the 1980 and 1981ndash82 national recessions Similarly the 1990ndash91 recession was precipitated in part by another doubling of oil prices in the months following the invasion of Kuwait and leading up to the first Gulf War
Unlike the rest of the nation oil-patch states tend to benefit from higher oil prices In the early 1980s and early 1990s higher oil prices helped these states grow even during national recessions However when prices collapsed during the mid-1980s oil-patch states fell into their own regional recession The lingering effects of the ldquooil bustrdquo resulted in falling real incomes in the region The subsequent loss of jobs income and output contributed to house price declines that created turmoil
in residential real estate markets and led to hundreds of bank failures1
Like the energy sector agriculture does not move in perfect tandem with the national economy though influences from US and global trends can be strong For example global economic conditions affect the demand for food which helps drive agricultural commodity prices In addition large interest rate move-ments can have a profound effect on farmland prices For example in the early 1970s strong demand for farm commodities caused farm incomes to rise rapidly When combined with negative real interest rates this favor-able environment caused sharp increases in the value of farmland In the late 1970s however soaring interest rates and changing conditions in global supply and demand brought the boom period to an end The result was a significant decline in real farm incomes a rapid and long-lasting decline in farmland values and hundreds of farm bank failures in the 1980s2
Energy and Agriculture Boomed through Mid-Year 2008 Current energy and agricultural conditions have for the most part played out independently of national economic trends Despite the weakening US economy the health of the energy and agricultural industries has been very strong over the past several years Crude oil prices quadrupled in dollar terms between 2003 and mid-2008 setting the trend for overall energy prices This price inflation was an economic boon to oil-patch states3 During the five-year period ending in second quarter 2008 inflation-adjusted economic growth in these four states grew at an annualized rate of 36 percent
1 FDIC History of the EightiesmdashLessons for the Future (Washington DC FDIC 1997) 291ndash336 2 Ibid 259ndash290 3 While the energy discussion and analysis in this article focus on oil-patch states it should be noted that Wyoming and Montana have characteristics similar to this region Both states rely considerably on energy extraction and experienced employment growth above the national average during the period of high oil prices Wyoming in fact had one of the most vibrant economies in the nation during that time
FDIC QUARTERLY 36 2009 VOLUME 3 NO 1
2009 Economic Landscape
Chart 1 Map 1
60 70 80 90
100 110 120 130 140 150 160
Jan-80 Jan-84 Jan-88 Jan-92 Jan-96 Jan-00 Jan-04 Jan-08
Source US Department of Agriculture Note ldquoPrices received by farmersrdquo is a composite index of leading crop and livestock prices produced in the United States The prices of these commodities are ldquofarm-gaterdquo or wholesale prices
Agricultural Prices Rose Steadily from Late 2002 through Mid-2008 but Have Settled Somewhat since Then
Prices Received by Farmers Index 1990-92=100
compared with 28 percent for the nation4 The biggest impact however was on real personal income which grew at an annualized rate of 46 percent in the four oil-patch states compared with only 29 percent nationally The regionrsquos oil and gas industry not only supports a large number of high-paying jobs in the mining industry itself but also has strong indirect multiplier effects on job growth in professional and business services whole-sale and retail trade and financial activities
The agricultural sector also has performed quite well over the past few years A number of factors including global economic growth and a weaker dollar contrib-uted to an extended period of rising prices for a broad array of agricultural products Prices for these commodi-ties generally began to rise in late 2002 and many reached new highs in the past two years before moder-ating in the second half of 2008 (see Chart 1) High commodity prices have led to record net farm incomes in three of the past four years and also have contributed to significant increases in farmland values5
Ethanol production has also played an important role in both agricultural and energy markets in recent years As the price of crude oil increased from less than $26 per barrel in 2001 to more than $133 per barrel in July 2008 ethanol became a viable and very profitable alter-
4 Growth rates used in this paragraph were calculated by the FDIC using data from the US Bureau of Economic Analysis and Moodyrsquos Economycom 5 For a detailed farmland analysis see Richard D Cofer Jeffrey W Walser and Troy D Osborne ldquoDo Record Farmland Prices Portend Another Steep Downturn for Agriculture and Farm Banksrdquo FDIC Quar-terly 2 no 4 (2008) 25
The Center of the Nation Has Avoided Significant Job Losses in This Recession
Employment Growth Percent Change December 2007 - January 2009
gt0 0 to -2 -2 to -4 Source Bureau of Labor Statistics US Average -25
(Haver Analytics) lt-4
native Strong profitability government mandates on renewable fuels that supported demand and tariffs and subsidies that supported prices all led to considerable increases in ethanol output6 Indeed annual ethanol output in 2008 had grown by more than five times the levels of 20007 The growth in ethanol production in turn increased the demand for corn the primary input in the production process to a point where ethanol production is projected to use nearly 30 percent of the 2008 crop8 As farmers planted more corn to meet the higher demand from ethanol plants they reduced plant-ings of soybeans which contributed to higher prices for this commodity as well The result was record incomes for farmers and double-digit average annual increases in farmland values in corn- and soybean-producing states between 2003 and 2007
The health of the energy and agricultural sectors combined with relatively stable and affordable housing markets in the central United States has caused the national recession to largely bypass the nationrsquos midsec-tion so far (see Map 1) The energy-rich oil patch was
6 Don Hofstrand ldquoCorn-Ethanol Profitabilityrdquo AgMRC Renewable Energy Newsletter Agricultural Marketing Resource Center November December 2008 and Bruce A Babcock Center for Agricultural and Rural Development at Iowa State University statement before the US Senate Committee on Homeland Security and Government Affairs Hearing on Fuel Subsidies and Impact on Food Prices 110th Cong 2nd sess May 7 2008 7 Renewable Fuels Association Ethanol Industry Outlook 2009 8 ldquoWorld Agricultural Supply and Demand Estimatesrdquo US Department of Agriculture January 12 2009
FDIC QUARTERLY 37 2009 VOLUME 3 NO 1
the only region that added jobs after the national reces-sion began in December 2007 and Farm Belt states reported small job losses relative to the rest of the nation
The Outlook for Energy and Agriculture Has Dimmed Though the energy and agricultural sectors have provided insulation against recession for the central United States these sectors have weakened consider-ably in recent months The Energy Information Administrationrsquos (EIA) short-term energy outlook is projecting a long severe global economic slowdown that will lead to further reductions in global energy demand and additional declines in crude oil and other energy prices9 The EIA projects oil prices in 2009 to average between $40 and $50 per barrel on a quarterly basis but prices could plunge below $3010 Falling energy prices are now putting pressure on oil-patch employment growth (see Chart 2) This trend alone should not cause a repeat of the 1980s oil bust as the regionrsquos economy has become increasingly diverse since that time somewhat muting the impact of oil price movements11 However when falling energy prices are combined with a severe national recession and a global financial crisis a significant regional downturn cannot be ruled out
Declining agricultural commodity prices are also of concern A severe downward price cycle in agricultural commodities and land values that causes farm incomes and land values to fall could result in prolonged economic weakness among farm states Aggravating the situation could be a rapid and significant consolidation in the ethanol industry which was already showing weakness in mid-2008 because of overcapacity and low margins caused by high corn prices Some of the largest ethanol producers delayed the startup of ethanol plants last year and some analysts predicted that many small and medium-sized plants would shut down12 Deteriorat-ing conditions in the ethanol industry will not only
9 Energy Information Administration Short-Term Energy Outlook December 2008 10 Several leading analysts have discussed the possibility of oil prices falling below $30 per barrel in 2009 One notable example is ldquoOil May Fall Below $25 Next Year Merrill Lynch Saysrdquo Bloombergcom December 4 2008 11 Stephen PA Brown and Mine K Yucel ldquoEnergy Prices and State Economic Performancerdquo Federal Reserve Bank of Dallas Economic Review second quarter 1995 12 ldquoToo Much Ethanolrdquo Farm Industry News November 1 2008
Chart 2
$0
$20
$40
$60
$80
$100
$120
$140
$160
1995 1997 1999 2001 2003 2005 2007 2009 -2
-1
0
1
2
3
4
5
The Recent Downturn in Oil Prices Appears to Spell the End of the Growth Period in Oil-Patch Employment
Sources Wall Street Journal Bureau of Labor Statistics (Haver Analytics) FDIC
Year-over-Year Employment Growth Oil-Patch States
Dollars per Barrel (2008 dollars)
weigh on crop prices but are also likely to affect farmers and rural communities who have come to rely on the industry for high-paying jobs
Though the economies in the nationrsquos midsection continue to perform well relative to the nation the downward trends in the energy and agricultural sectors may weigh on the region in the near future Moderating commodity prices are likely to put a damper on the arearsquos economic conditions and the region may not only cease to be a source of economic strength but also could enter recession at a much later stage than the nation
Authors Adrian R Sanchez Regional Economist
John M Anderlik Assistant Director
FDIC QUARTERLY 38 2009 VOLUME 3 NO 1


![Economic Recession[2]](https://img.dokumen.tips/doc/110x75/55566aa9d8b42a144c8b4edd/economic-recession2.jpg)


