Embed Size (px)
Citation preview
1
The 1,000% Blue Chip Boost:
Three Ready-to-Boost ASX Winners to
Buy Now
1
The 1,000% Blue Chip Boost: Three Ready-to-Boost ASX
Winners to Buy Nowby Matt Hibbard
‘Boost Stock’ #1 How you could collect big, triple-digit gains
no matter the direction of the market
‘Good short sellers are born, not trained.’ — Jim Chanos
Legendary fund manager Jim Chanos has made a fortune short selling shares. He’s been doing it all his life.
In the late 1990s, an American energy and services stock was taking off. What for decades had been no more than a boring utilities company, had re-invented itself into a commodities trading powerhouse.
For six straight years, they had won one of Fortune magazine’s most coveted titles: ‘America’s Most Innovative Company’. They beat companies like Apple and Microsoft along the way.
Investors marvelled at the company’s record profits. Brokers continued to pump out ‘buy’ recommendations on the stock.
Century-old Wall Street investment bank Bear Stearns’ 86-page report in January 2001 stated: ‘Our Attractive rating and 12-month price target ($98) reflect their highly successful existing businesses,’ putting a price target 10% above its all-time high.
JP Morgan reiterated their ‘buy’ recommendation on the stock only six months later.
But not everyone bought into the story. Chanos, a Milwaukee born trader beginning to make a name for himself on Wall Street, wouldn’t have a bar of it. And the more he dug into the company accounts, the more he knew something wasn’t right.
Whichever way he cut it, the numbers didn’t add up.
2
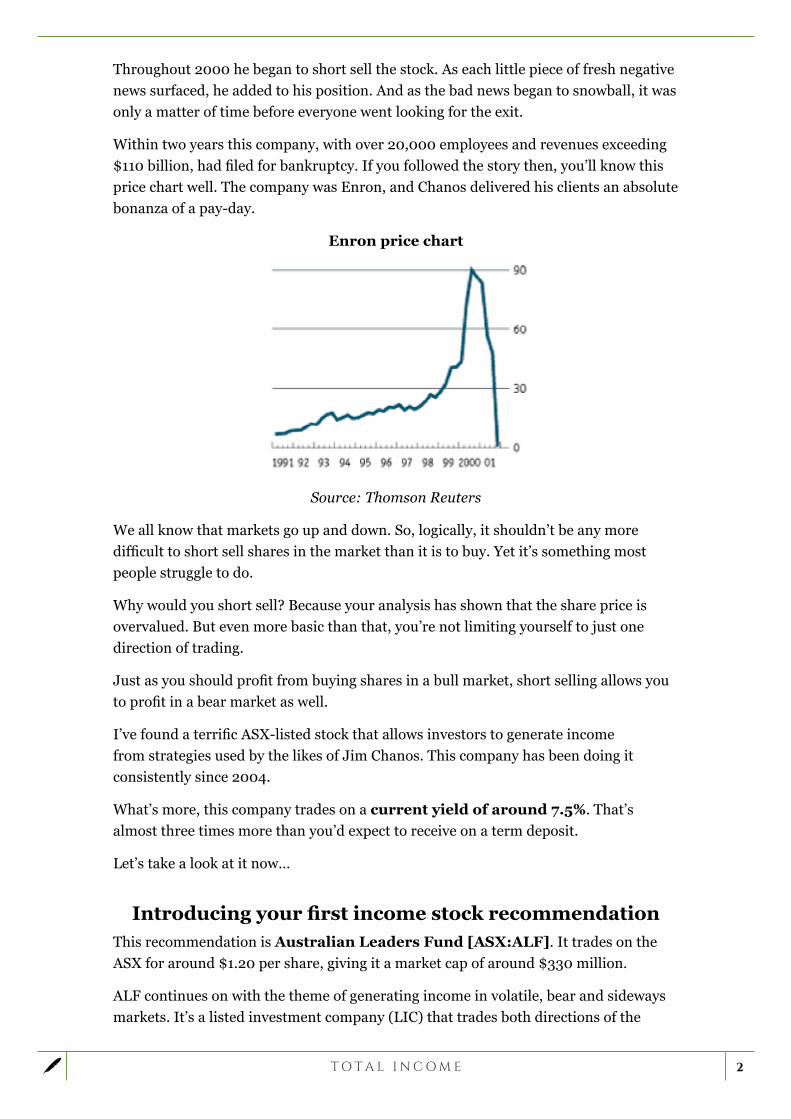
Throughout 2000 he began to short sell the stock. As each little piece of fresh negative news surfaced, he added to his position. And as the bad news began to snowball, it was only a matter of time before everyone went looking for the exit.
Within two years this company, with over 20,000 employees and revenues exceeding $110 billion, had filed for bankruptcy. If you followed the story then, you’ll know this price chart well. The company was Enron, and Chanos delivered his clients an absolute bonanza of a pay-day.
Enron price chart
Source: Thomson Reuters
We all know that markets go up and down. So, logically, it shouldn’t be any more difficult to short sell shares in the market than it is to buy. Yet it’s something most people struggle to do.
Why would you short sell? Because your analysis has shown that the share price is overvalued. But even more basic than that, you’re not limiting yourself to just one direction of trading.
Just as you should profit from buying shares in a bull market, short selling allows you to profit in a bear market as well.
I’ve found a terrific ASX-listed stock that allows investors to generate income from strategies used by the likes of Jim Chanos. This company has been doing it consistently since 2004.
What’s more, this company trades on a current yield of around 7.5%. That’s almost three times more than you’d expect to receive on a term deposit.
Let’s take a look at it now…
Introducing your first income stock recommendationThis recommendation is Australian Leaders Fund [ASX:ALF]. It trades on the ASX for around $1.20 per share, giving it a market cap of around $330 million.
ALF continues on with the theme of generating income in volatile, bear and sideways markets. It’s a listed investment company (LIC) that trades both directions of the
3
market. It has done so successfully since listing on the ASX, and is one of three funds run by Watermark Funds Management.
All up, since inception this company has generated an annual return of 13.1%. And that’s after fees, and including the GFC.
Where it performs best, though, is in a bear market.
It’s all about the fundamentalsOver the last few years, the financial markets have been particularly volatile. At the start of 2016, and later in November, they looked as though they were headed for the floor. Yet the market has rallied strongly since then.
If you were a short term trader working off price action, the sudden reversal would almost certainly have caught you out.
Trading off price action can certainly work for some of the more nimble traders out there. But that’s not what Total Income is about. Our goal is to generate consistent and reliable income over the long term.
However, to earn regular income, you need something more concrete than trying to pick the daily fluctuations of the market. Something that’s going to produce consistent results over time. And that’s why I think you should consider adding ALF to your portfolio.
ALF uses fundamental analysis to trade both directions of the market. The same process that tells them when a share is ‘undervalued’…will also tell them when it’s ‘overvalued’.
A consistent strategy that has outperformed
the market for a decadeALF not only use fundamental analysis to determine which stocks they believe are over or under-valued. They also apply it to industries, sectors and markets.
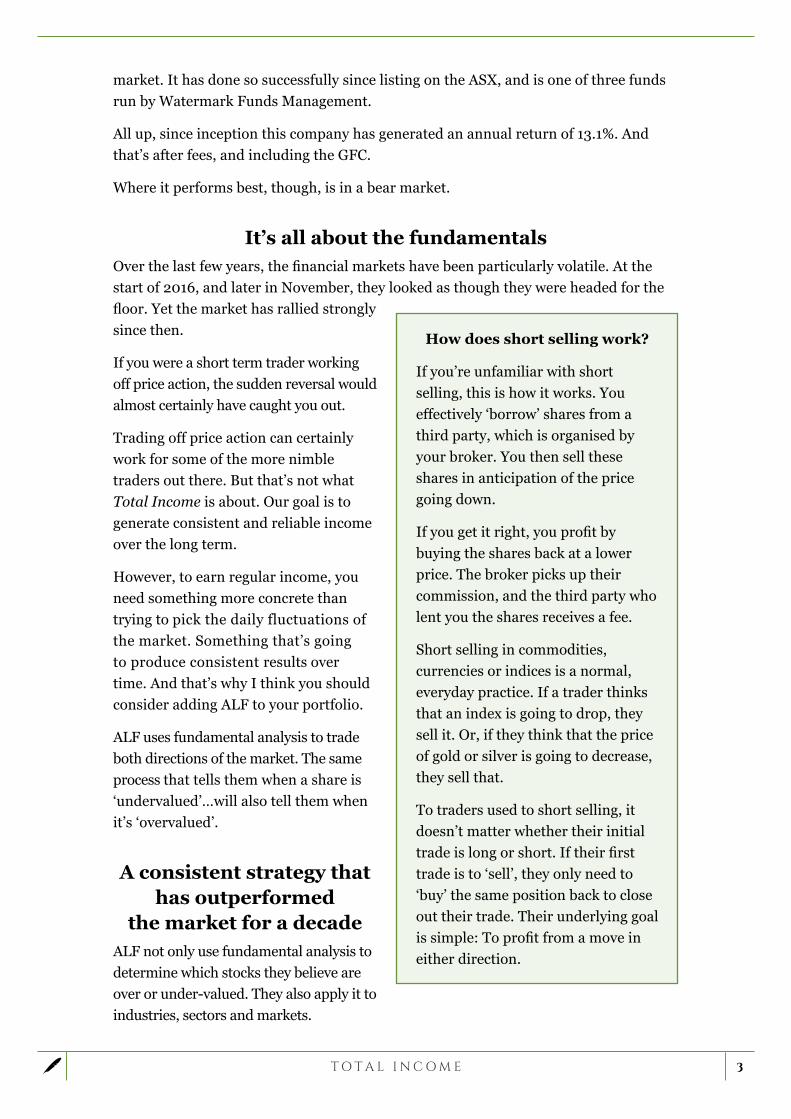
How does short selling work?
If you’re unfamiliar with short selling, this is how it works. You effectively ‘borrow’ shares from a third party, which is organised by your broker. You then sell these shares in anticipation of the price going down.
If you get it right, you profit by buying the shares back at a lower price. The broker picks up their commission, and the third party who lent you the shares receives a fee.
Short selling in commodities, currencies or indices is a normal, everyday practice. If a trader thinks that an index is going to drop, they sell it. Or, if they think that the price of gold or silver is going to decrease, they sell that.
To traders used to short selling, it doesn’t matter whether their initial trade is long or short. If their first trade is to ‘sell’, they only need to ‘buy’ the same position back to close out their trade. Their underlying goal is simple: To profit from a move in either direction.
4
But it’s not just a matter of flicking in and out of a stock based on its valuation profile — their strategy is broader than that. They construct a portfolio around a basic concept.
They short sell shares with weak fundamentals, whose share prices are trading above ALF’s valuation. They then buy shares in companies with strong fundamentals, whose share prices are trading below ALF’s valuation.
You sometimes see these referred to as ‘long-short’ funds, because they’re both long and short in the market at the same time.
You might be wondering what the purpose is of going both long and short simultaneously. Why don’t they just go long in a bull market, and short in a bear market? The answer is actually very simple.
The strategy is designed to make money irrespective of the market direction. As you know, picking the direction of the market can be difficult at the best of times. Even more so when it’s whip-sawing all over the place.
To understand their strategy, it’s best to think about it this way: When the market is going up, shares with strong fundamentals should increase in value more than shares with weak fundamentals. Therefore, the gains on your ‘longs’ should exceed any losses on your short positions.
Likewise, when the market is going down, shares with strong fundamentals should hold up better than shares with weak fundamentals. The gains on your ‘shorts’ should exceed any losses on your long positions.
The same rationale applies in a sideways or range-bound market. You might actually gain on both your longs and shorts at the same time.
If you think about it, it’s really a very conservative strategy. You’re not actually trying to pick market directions. Nor are you tying all of your funds to one side of the market — typically by just buying shares. What you are doing is backing stronger shares to outperform weaker ones over time.
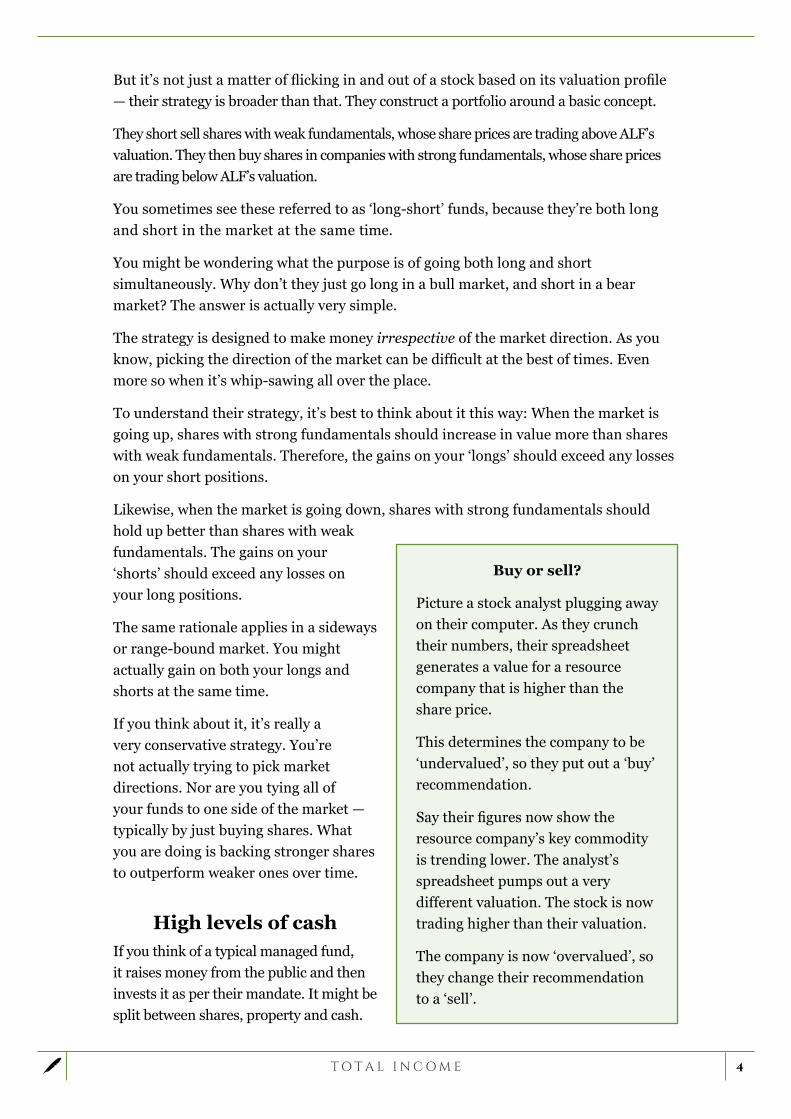
High levels of cashIf you think of a typical managed fund, it raises money from the public and then invests it as per their mandate. It might be split between shares, property and cash.
Buy or sell?
Picture a stock analyst plugging away on their computer. As they crunch their numbers, their spreadsheet generates a value for a resource company that is higher than the share price.
This determines the company to be ‘undervalued’, so they put out a ‘buy’ recommendation.
Say their figures now show the resource company’s key commodity is trending lower. The analyst’s spreadsheet pumps out a very different valuation. The stock is now trading higher than their valuation.
The company is now ‘overvalued’, so they change their recommendation to a ‘sell’.
5
But a long-short fund has a different dynamic. They hold a high level of cash.
The best way to understand this is to follow the trail. When you short sell shares, you receive the funds at settlement, just as you do when you sell your own shares. Of course, you’ll need to return these shares in the future, which you fulfil simply by buying back the shares that you shorted.
However, these short-sales add cash on top of the money the fund raised when they listed on the ASX.
In effect, the short-sold shares finance the purchase of the shares they want to buy. This leaves them sitting on a ready supply of cash.
Variations on the themeA fund that has equal weighting on both their long and short positions is called a ‘market-neutral strategy’. Meaning that they are split 50:50 between the shares they’ve short sold, and the ones they’ve bought.
But once you get your head around the strategy, you can see that there are an infinite number of variations you could apply. For example, you might go long 60% and short 40% in a bull market, or long 40% and short 60% in a bear market.
Or you might skew your portfolio to go long financials and defensive stocks, while shorting resource and cyclical stocks. ALF tailor their long-short weightings according to their view of the market.
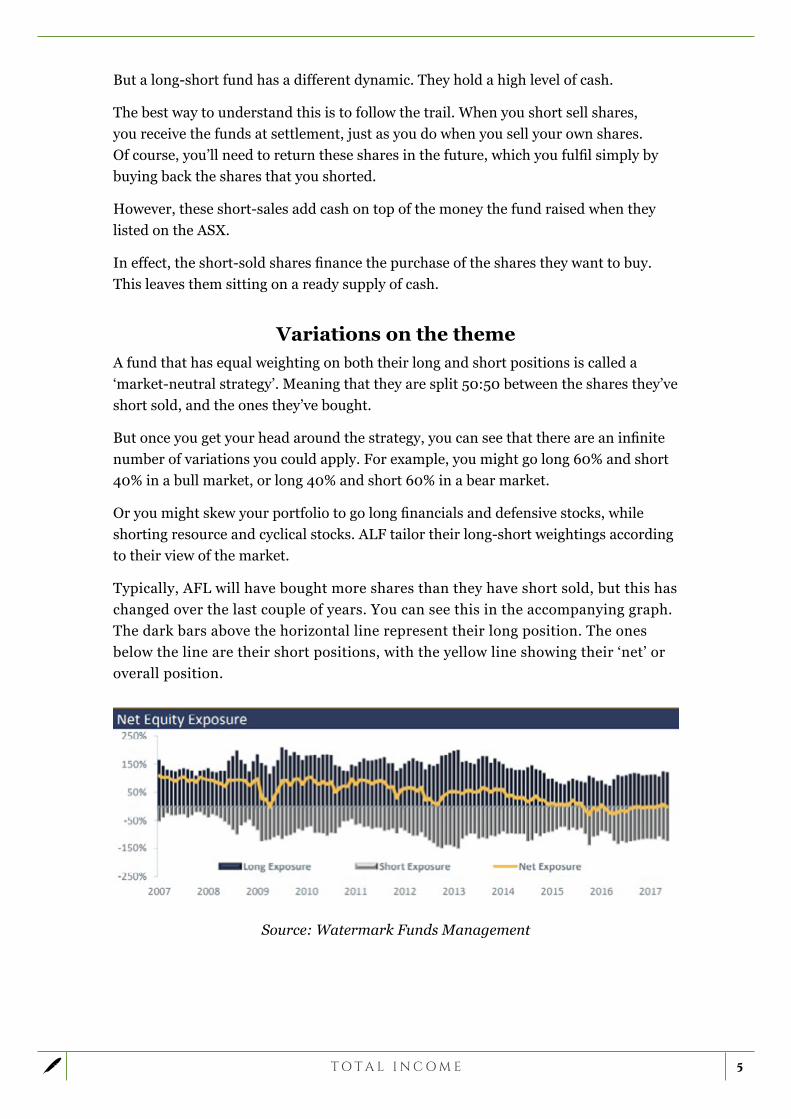
Typically, AFL will have bought more shares than they have short sold, but this has changed over the last couple of years. You can see this in the accompanying graph. The dark bars above the horizontal line represent their long position. The ones below the line are their short positions, with the yellow line showing their ‘net’ or overall position.
Source: Watermark Funds Management
6
You can imagine that trying to implement this kind of strategy would be a big challenge for a private investor.
But how do the professionals fare? Let’s look at the answer.
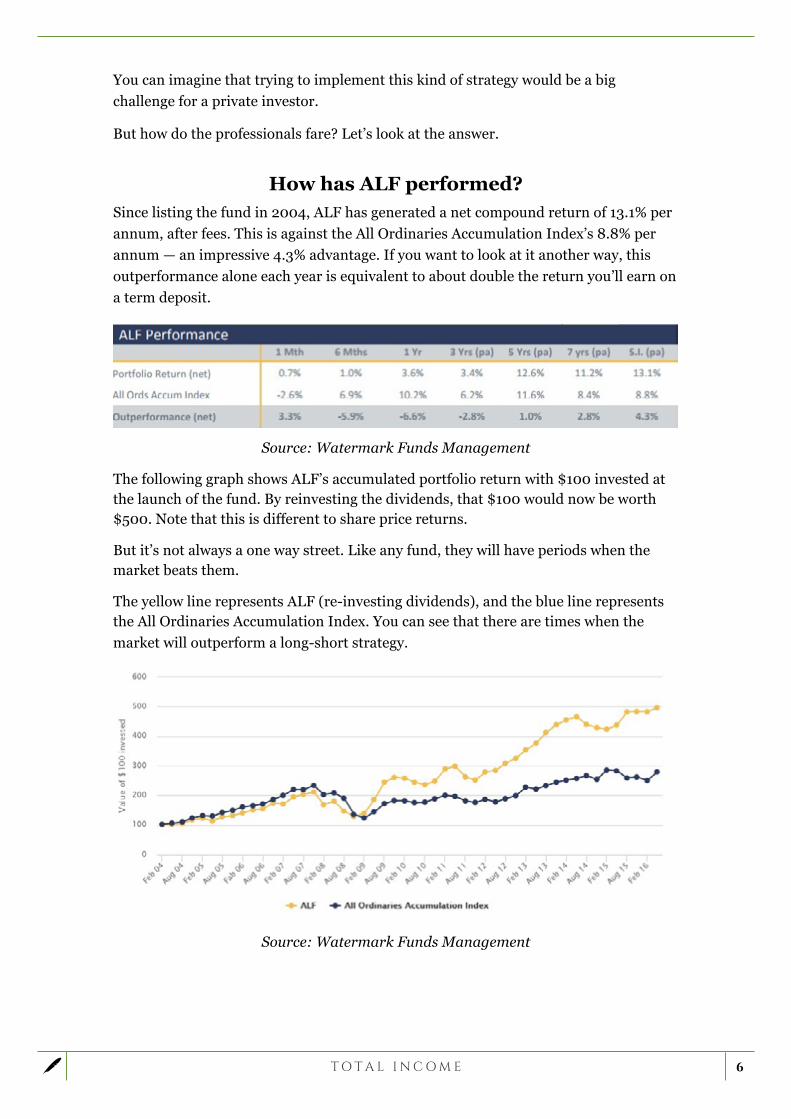
How has ALF performed?Since listing the fund in 2004, ALF has generated a net compound return of 13.1% per annum, after fees. This is against the All Ordinaries Accumulation Index’s 8.8% per annum — an impressive 4.3% advantage. If you want to look at it another way, this outperformance alone each year is equivalent to about double the return you’ll earn on a term deposit.
Source: Watermark Funds Management
The following graph shows ALF’s accumulated portfolio return with $100 invested at the launch of the fund. By reinvesting the dividends, that $100 would now be worth $500. Note that this is different to share price returns.
But it’s not always a one way street. Like any fund, they will have periods when the market beats them.
The yellow line represents ALF (re-investing dividends), and the blue line represents the All Ordinaries Accumulation Index. You can see that there are times when the market will outperform a long-short strategy.
Source: Watermark Funds Management
7
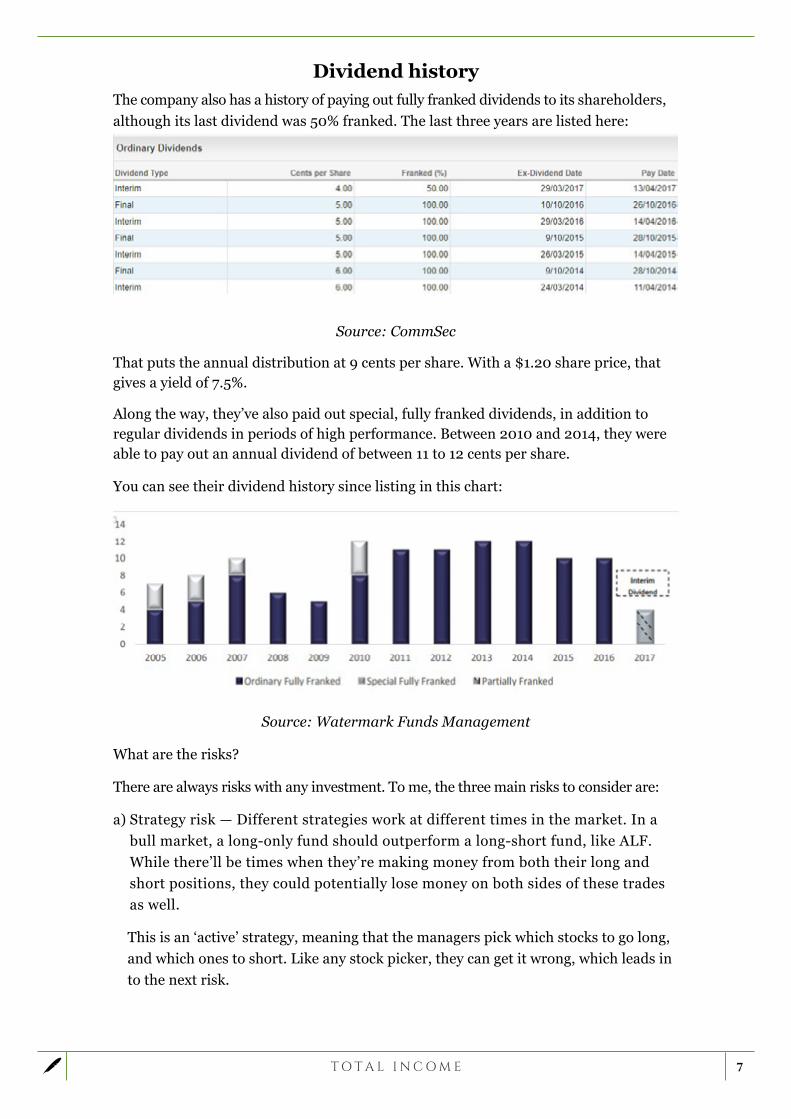
Dividend historyThe company also has a history of paying out fully franked dividends to its shareholders, although its last dividend was 50% franked. The last three years are listed here:
Source: CommSec
That puts the annual distribution at 9 cents per share. With a $1.20 share price, that gives a yield of 7.5%.
Along the way, they’ve also paid out special, fully franked dividends, in addition to regular dividends in periods of high performance. Between 2010 and 2014, they were able to pay out an annual dividend of between 11 to 12 cents per share.
You can see their dividend history since listing in this chart:
Source: Watermark Funds Management
What are the risks?
There are always risks with any investment. To me, the three main risks to consider are:
a) Strategy risk — Different strategies work at different times in the market. In a bull market, a long-only fund should outperform a long-short fund, like ALF. While there’ll be times when they’re making money from both their long and short positions, they could potentially lose money on both sides of these trades as well.
This is an ‘active’ strategy, meaning that the managers pick which stocks to go long, and which ones to short. Like any stock picker, they can get it wrong, which leads in to the next risk.
8
b) Dividend risk — Although ALF’s aim is to pay out a regular stream of fully franked dividends, they can only do so if they have generated sufficient funds and available franking credits. A sustained period of poor trades could potentially force them to cut or reduce their dividend.
c) Implementation risk — For some unforeseen reason, ALF may be unable to carry out their strategy. This could be an internal factor, such as key personnel leaving or rival firms poaching their staff.
Or it could also be something external, such as government or ASX policy. In times of severe market volatility, either of these bodies could suspend short selling of shares. This could impede their ability to fully implement their strategy.
You always know what this business is worthWhen you value a traditional business, you look at its profit and loss, the balance sheet, and the sector it operates in. You also take into consideration the health of the economy, interest rates, inflation and other factors.
By applying a multiple to it, you can work out a company’s value. It might be a P/E ratio — the company might be worth 15 times the earnings per share. Whichever method you use, the value of the share is still subjective. You might prefer one multiple, while another analyst prefers another.
With an LIC, however, you can always determine what a share is worth. There isn’t anything subjective about it. You know the market value of all open positions, and you know how much cash the company is sitting on.
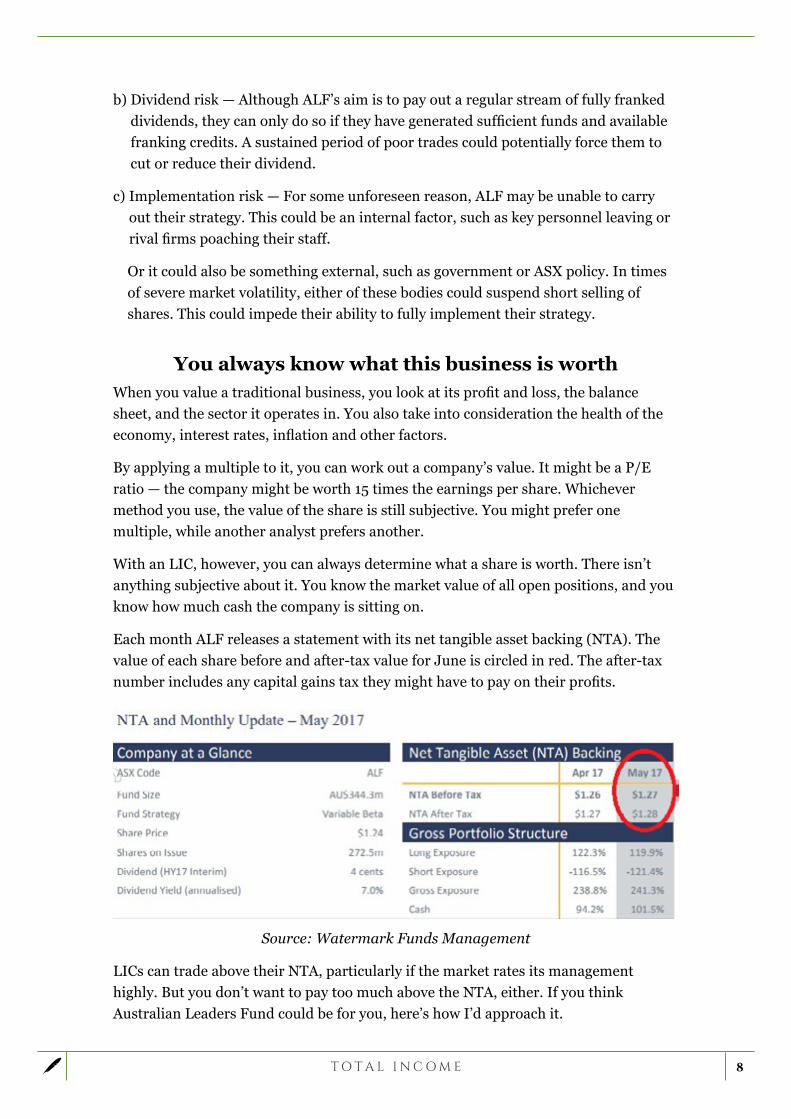
Each month ALF releases a statement with its net tangible asset backing (NTA). The value of each share before and after-tax value for June is circled in red. The after-tax number includes any capital gains tax they might have to pay on their profits.
Source: Watermark Funds Management
LICs can trade above their NTA, particularly if the market rates its management highly. But you don’t want to pay too much above the NTA, either. If you think Australian Leaders Fund could be for you, here’s how I’d approach it.
9
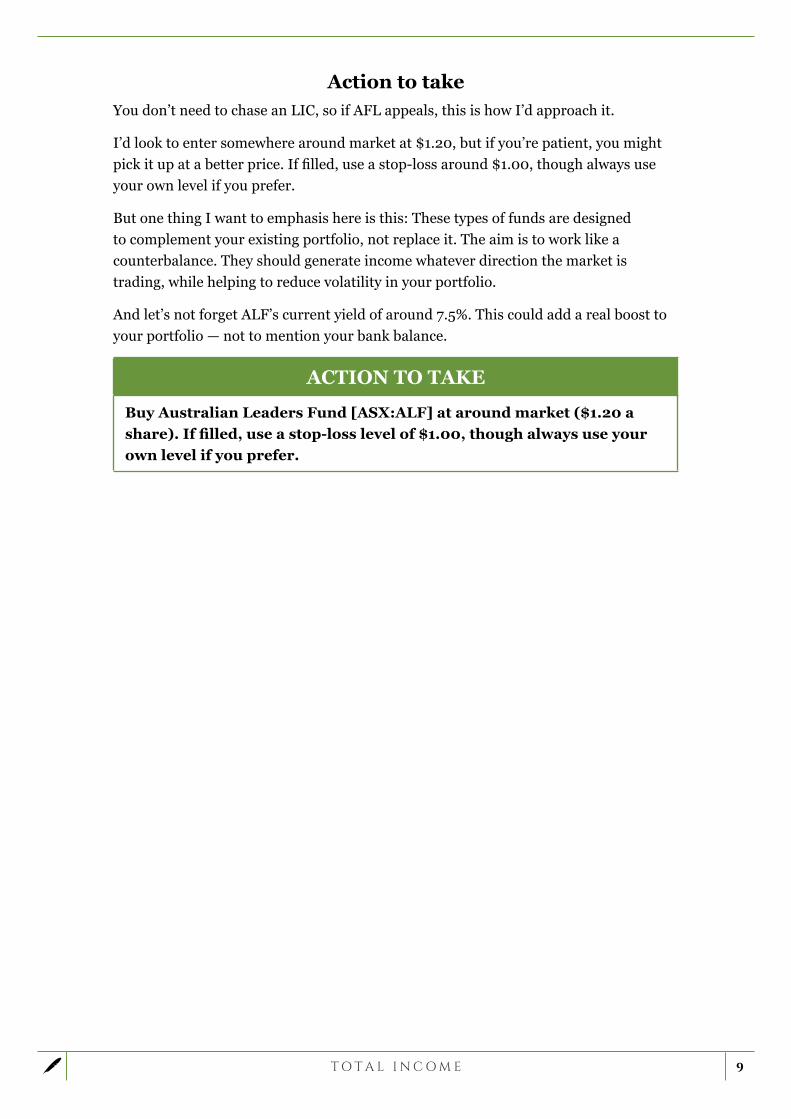
Action to takeYou don’t need to chase an LIC, so if AFL appeals, this is how I’d approach it.
I’d look to enter somewhere around market at $1.20, but if you’re patient, you might pick it up at a better price. If filled, use a stop-loss around $1.00, though always use your own level if you prefer.
But one thing I want to emphasis here is this: These types of funds are designed to complement your existing portfolio, not replace it. The aim is to work like a counterbalance. They should generate income whatever direction the market is trading, while helping to reduce volatility in your portfolio.
And let’s not forget ALF’s current yield of around 7.5%. This could add a real boost to your portfolio — not to mention your bank balance.
ACTION TO TAKE
Buy Australian Leaders Fund [ASX:ALF] at around market ($1.20 a share). If filled, use a stop-loss level of $1.00, though always use your own level if you prefer.
10
‘Boost Stock’ #2 1,258% from Australia’s greatest stock picker
…and PLENTY more to come As you likely know, this service is about generating income. Every month I’ll focus on finding stocks that should be able to pay you a generous dividend, year after year.
Now, the emphasis won’t be on a running commentary of the big banks, Telstra or Woolworths. But I’ll cover these if there’s an opportunity to pick them up for a bargain price.
Plus, I’ll introduce you to a range of recommendations. The companies will vary in size and what they do. Some will be growing more rapidly than others. But the underlying theme will be about the issue so many Australians are facing: how to earn a passive income that you can pick up today to gift you with an income for years to come.
Of course, just because I make a recommendation, doesn’t mean you have to follow it. Some of the recommendations will appeal to you, and some won’t.
If you’re not sure, leave it and wait for the next one I send through. I want you to be comfortable with any recommendation before you go ahead and invest your money.
Because that’s the point. This is your money. You have to be careful how you manage it. My role is to help guide you through the world of finance and stock markets, helping you build the solid and stable income streams that you need.
So, let’s get down to business…
How would you like a 6.2% dividend yield?You may be familiar with the two largest listed investment companies (LICs) on the ASX: Australian Foundation Investment Company [ASX:AFI] and Argo Investments [ASX:ARG]. They have a combined market cap of over $12 billion, and a combined history of over 150 years.
Run by some of the best people in the business, both have established an enviable record of producing capital gains, as well as regular and growing dividends for their shareholders over a long period of time.
But I’m not recommending either of those companies. I’ve dug a little deeper, researching 60-plus other companies in this sector you may not be familiar with.
Some are strictly small or micro-cap, and a bit too speculative for what we’re looking for in this service. Others are much larger, with clear strategies that have provided their shareholders with a regular stream of fully franked dividends over a long period of time.
This stock pick is a company that has regularly achieved both these goals since inception. Formed in August 1999 with a $20 million capital raising, this company has outperformed the market from the beginning.
11
Over this time period, they have doubled the return of the S&P/ASX All Ordinaries Accumulation Index prior to fees and taxes.
With a market cap of over $1.1 billion, a current yield of 6.2%, and a 17-year history of paying out dividends to its shareholders, this company could be a great addition to your portfolio.
Introducing your next Total Income stock pickTotal Income stock pick is WAM Capital Limited [ASX:WAM]. It’s a listed investment company that trades on the ASX for $2.38 a share, and is run and managed by Wilson Asset Management.
Chaired by industry veteran Geoff Wilson (who also acts as Portfolio Manager), and overseen by an experienced equities team, this group has managed to put together a string of stellar results since its debut in 1999.
I’ll run through my analysis of this company shortly. But, before I do, let me quickly explain what a ‘listed investment company’ is, and how they operate.
Listed Investment Companies are similar to managed funds as they pool funds together and invest them in various asset classes. They might invest in fixed assets, such as cash or bonds, or in local or international shares.
As for WAM Capital Limited, it’s an ‘active’ manager specialising in emerging companies on the ASX. I’ll run through their strategy in more detail shortly.
So why an LIC over a managed fund? LICs have many advantages over traditional managed funds. Perhaps the biggest of these is they have a ‘closed-end’ structure.
This means that the company raises a fixed amount of capital at the beginning, so that they always know exactly how much they have available to invest. In a traditional managed fund, this amount changes constantly with funds flowing in and out as investors enter and exit the fund. This can lead to underperformance.
Managed funds also have a strict mandate which includes a percentage they must allocate to different assets. For example, it might be that the fund must always have 60% of funds invested in Australian equities. To fulfil their mandate, the fund might need to buy shares near a market peak as investors pour money into what might be the late stages of a bull market.
They may also have to sell shares in a bear market as investors panic and exit near a market bottom. LICs can offer management more flexibility in that they can hold more cash when they believe the market is too expensive. And they don’t need to sell shares to cover any redemptions.
From your perspective, another big advantage is the ease with which you can buy into (or sell out of) an LIC. You just buy or sell them the same way as if you were buying or selling shares in BHP, CBA or any other share listed on the ASX.
12
So the cost of your transaction is only your brokerage fee. Compare this to a managed fund, where you will need to make a request for redemption (cashing out of the fund), something that could take weeks, while incurring a hefty fee to boot.
Buy, hold and sellWAM Capital is ‘actively managed’. This simply means that they pick stocks that match their underlying investment criteria.
This is distinct from a ‘passive’ manager, such as an ETF for example, that will try to match the performance of an index by buying all the companies that make up that index. You’ll sometimes see these referred to as ‘index-hugging’ funds.
WAM Capital specialises in actively buying growth companies they believe are undervalued. They then hold them until the price reaches a level they perceive to be full value. They then sell out and bank the proceeds. Simple.
These funds then stay in cash until they find their next investment. At times, they might hold up to 50% of their total funds in cash. Each six months they provide this information in their financial results.
Most of the opportunities they seek out are in medium and small-caps, with an emphasis on the industrial sector. This is where they have been able to produce their history of strong results. Typically, they might hold between 20 and 30 investments at a time. This is the number they believe is enough to help reduce risk by actively diversifying their portfolio.
Dual investing strategy for better returnsThere are essentially two types of activities WAM use to generate their investment ideas.
The first is straight research. Pure and simple. One of the key elements they look for is evidence of positive or ‘free’ cash flow. In basic terms, they want proof that a company is generating more cash than it is spending.
WAM Capital’s managers place a big weighting on a company’s management team. They regularly meet them face-to-face and claim to have over 1,000 meetings each year with target companies (including companies in the portfolio).
Other factors they look for are the potential for earnings growth, return on equity, and how the company compares to its peers. That is, is it a market leader, or is it just following everyone else?
They then form a valuation and compare it to the current market value. Finally, before they invest, they look for an event or catalyst that could lead to the market revaluing the stock higher.
The second activity is what they refer to as ‘market driven investing’.
These are more or less one-off trading opportunities. It’s a broad mandate, but it allows them to take advantage of special events that they can trade in and out of for a
13
profit. These could include taking part in initial public offerings (IPOs), rights issues or private placements.
Although their primary activity is buying mispriced (undervalued) shares on the long side, WAM Capital’s mandate also gives them the ability to go short. However, this comes with strict policies.
Firstly, their prospectus states that the manager ‘may short sell securities in an attempt to protect capital’. Secondly, ‘the short sale of securities together with borrowings will never exceed 50% of the value of the Portfolio.’
As of WAM’s most recent update (May 2017), 1.5% of its total portfolio is ‘short’, with 42.8% held in cash. In effect, they are sitting tight and waiting for the right opportunities to come along.
Doubled the market’s returnWAM Capital states their investment objectives as:
‘ The investment objectives of the Company are to deliver investors a rising stream of fully franked dividends; provide capital growth and preserve capital.’
Let’s be honest. That’s not rocket science. Every investor’s goal pretty much matches that objective. But it’s important to see that WAM Capital’s objectives do match with what we’re aiming for in Total Income.
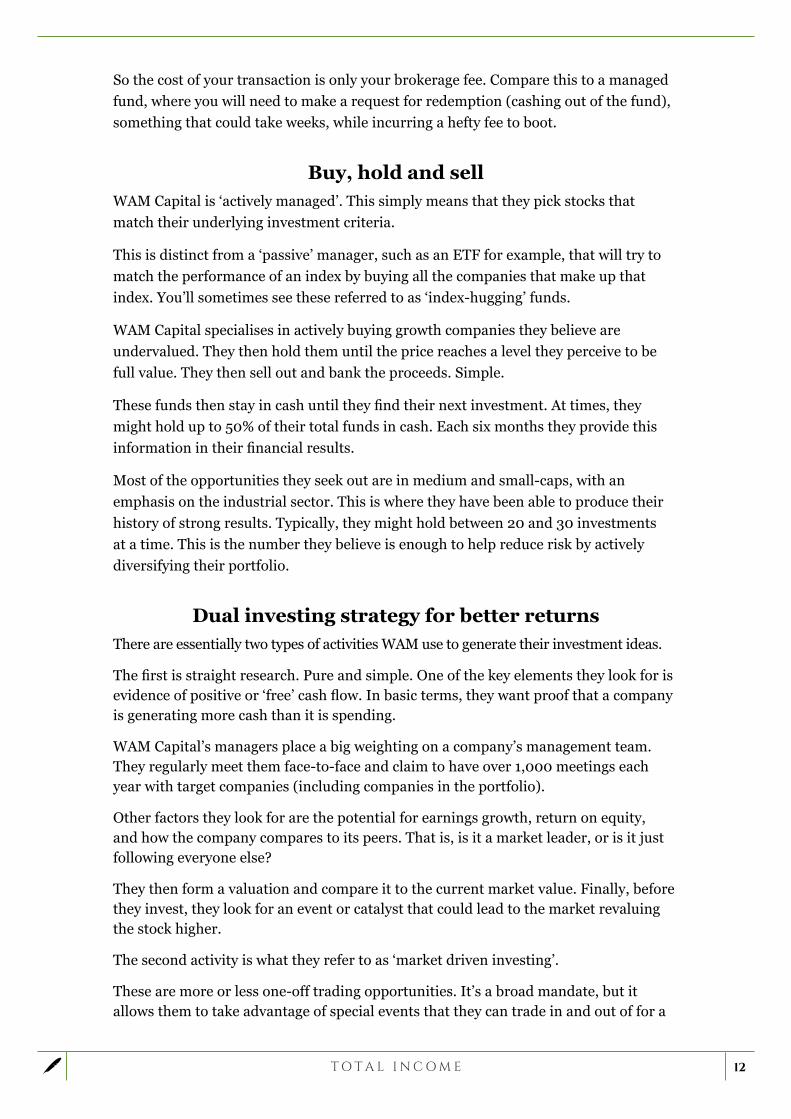
Now let’s look at how they’ve performed since inception to see if they’ve met their goals. The table below shows you their dividend history. There was a reduction in the dividend after the GFC but, since then, they have consistently increased payouts to shareholders.
Also note that, when looking at earlier dividend amounts, the original offer price in their IPO was $1.00.
Source: WAM Capital
That’s a pretty impressive result. Investors who bought in at the float have well and truly had their initial investment paid back in dividends many times over.
14
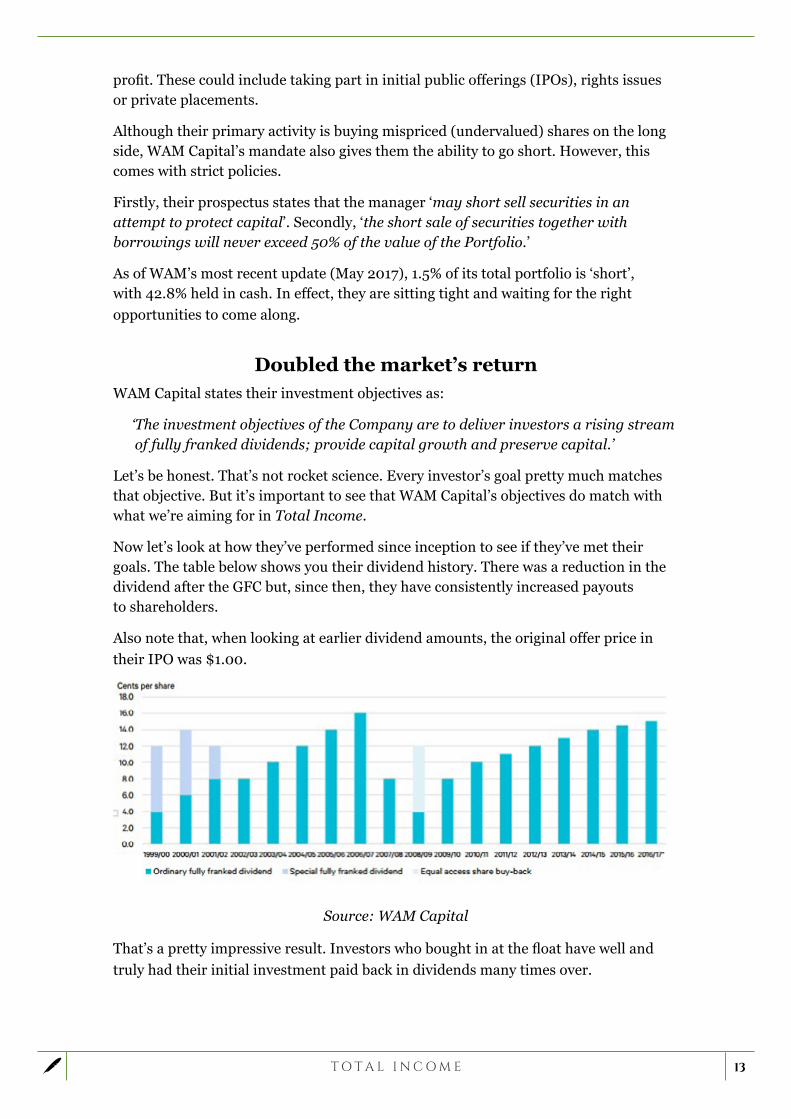
And it’s not all about dividends, either. WAM Capital has a good growth record too, as the table below shows:
Source: WAM Capital
Two notes about these figures. Firstly, expenses, fees and taxes are a material item. But they’re stripped out here so that you can gain a direct comparison of their share picking ability against the performance of the index itself.
Secondly, the accumulation index is, in my opinion, the best benchmark to use, as it includes both capital gains and dividends. It assumes that dividends are reinvested directly back into the market. This is the first target an active fund manager would strive to beat.
In their 17-year history, they have more than doubled the return of the Accumulation Index, achieving a total return of 17.6% per annum. There are plenty of fund managers out there who’ll be very envious of such a result!
This kind of talent doesn’t come cheapAnother impact on the net profit is the fees. Let’s be honest, this can be a real ‘bugbear’ for all of us, so let me explain how it works for WAM Capital.
Wilson Asset Management runs and manages WAM Capital. For this, they charge a 1% fee per annum based on the gross assets of WAM Capital. On top of this, they charge a performance fee if strict criteria are met. These are as follows:
Firstly, if the All Ordinaries Accumulation Index increases for the period, they receive 20% on the amount they beat it by. So if they don’t beat the index, they don’t get a performance fee. So they have to be better stock pickers than their competitors before they can earn any fee.
Secondly, if this Accumulation Index decreases for the year, they receive 20% only on the increase in the value of the total portfolio. So, if the portfolio doesn’t increase, or it loses value, again, they don’t get a performance fee.
15
These performance fees are then included in the accounts for the following financial year.
I know these levels of fees can upset some, but because they only earn the performance fee if they beat the market, that at least means their interests and investors interests are closely aligned.
Compare this to other fund managers that still seem to do well financially, even when the portfolio they manage is going down.
What are the risks?There are a number of risks that you need to consider before investing in WAM Capital.
Firstly, in the unlikely event that they would need to reduce or cut their dividend, there could be an impact on the share price. Investors buy this stock as much for the yield it generates as they do for its capital growth.
The second is that, quite simply, they could have a run of bad investments. Their track record suggests it hasn’t happened so far, but it’s still a possibility.
A related issue to this is personnel. In 2014, Australian Financial Review magazine listed Chris Stott (their Chief Investment Officer and Portfolio Manager) as one of their top six up and coming fund managers. There is always the potential (and this applies to any business) that a rival firm could poach key staff.
Thirdly, in the event of any market correction, the value of their holdings could fall, and so too their share price.
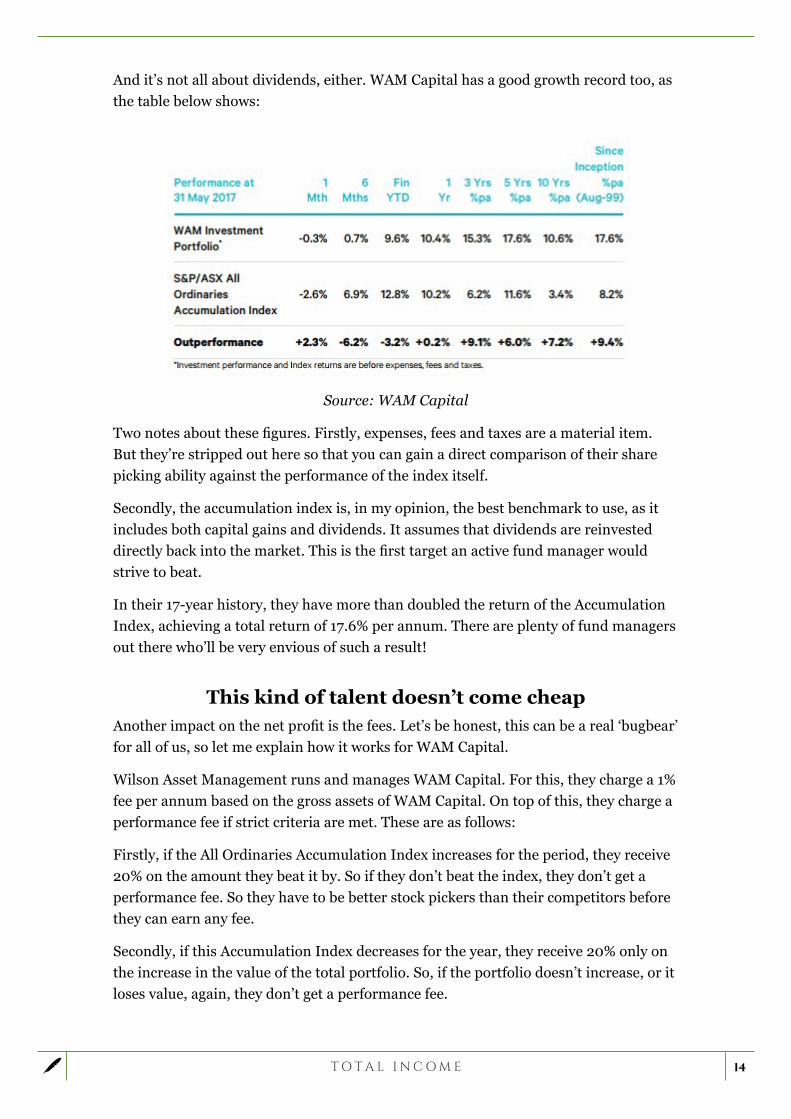
Action to takeLet’s take a look at WAM’s price chart. You can see it’s been in a strong uptrend over the last five years. After trading as high as $2.59, it’s recently pulled back and is trading at around $2.38.
Price Chart: WAM Capital Limited [ASX:WAM] — weekly
Source: eSignal
16
If WAM Capital appeals, you could look to enter around the market price. But if you’re patient, you’d ideally try and pick this stock up on a pullback closer to the $2.30 mark.
Once in the stock, I’d use a stop loss level of around the $1.75, though always use your own level if you prefer.
ACTION TO TAKE
Buy WAM Capital Limited [ASX:WAM] at around market price of $2.38, though ideally closer to $2.30 level. Once in the trade, use a stop loss of around $1.75.
Note: There are other shares listed on the ASX with a similar name. Place your order carefully. This is a recommendation to buy WAM Capital Limited with a stock code of WAM.
‘Boost Stock’ #3 Boost this ASX healthcare ‘dominator’ for
a potential 205% gain starting now Imagine you’re the Treasurer. It’s your job to balance the federal budget. Tucked away in your office in Canberra, your advisers swarm around you. All have their own ideas on how you should go about getting the budget back into the black.
A small cut here, a big cut there. That’s what you’ll need to do to have any chance of stemming a run of budget deficits that are projected far into the future. You think about how much easier it would be if only there was a sustained rally in commodity prices. Like in 2010.
Iron ore back at $160 or $170 a tonne? Coal and oil back at previous highs? Imagine all the extra money that would flow into government coffers. And fewer expenditure cuts would certainly be more palatable to the electorate.
But if you had to, where do you cut?
Perhaps superannuation concessions, or negative gearing? Maybe it’s the rebates on child care. Then, you imagine fronting a press conference and having to explain that to the Australian people.
Maybe the answer is really on the revenue side. Could you get more out of those hugely profitable blue chip companies that pay out a never-ending stream of fully franked dividends to their shareholders? Don’t expect any help there.
These companies are lobbying nonstop for a reduction in the corporate tax rate. Every time the topic comes up, they moan that Australia is uncompetitive, threatening to move their operations offshore to somewhere like Singapore.
And touching franking credits? There are millions of retirees relying on them to supplement their income. Do you really want to be the one to tell them to stick their money in the bank and earn 2% on a term deposit?
17
It’s back to the drawing board.
Another adviser offers a different approach. They suggest it might be easier to start by eliminating those things that you just couldn’t cut. That is, those parts of the budget where any cut will lead to community outrage. And…have you looking for another job come the next election.
Many fit that bill. Education and defence being two. Above all, you ask yourself, what is the one thing that people hold dearer than everything else? Not just for themselves and their family, but for their friends and the wider community.
The answer: good health.
It’s a challenge faced by governments across developed nations. People expect to have access to suitable healthcare, whatever the medical situation they might be facing.
If you are sick, you expect to be able to see a doctor that day. If someone is taken to a hospital, they expect to be assessed and treated accordingly. People don’t view it as a privilege; they see it as their right.
Governments may tinker with budgets and reallocate funds to where they think they can best be used. But expectations of the level of health services people should receive will only increase in the future.
It’s this expectation, along with an ever ageing population, that will continue to expand the size and level of medical treatment people will demand from their governments.
This recommendation for Total Income has played a huge part in the growth of the healthcare sector in Australia. It has been one of the most successful growth stories on the ASX for over 20 years. And it’s a market leader in a sector that will only continue to expand.
In 2000, the company took its first foray offshore. In 2009, for the first time, they generated more revenues from their international operations than they did back home in Australia. 2016 was a transformative year, where their international growth took a massive step up.
Introducing your final Total Income recommendationYour third Total Income pick is Sonic Healthcare [ASX:SHL]. It’s Australia’s largest provider of pathology services, and currently trades on the ASX for around $24 a share.
Sonic is also one of the largest medical diagnostic companies in the world. It provides laboratory and radiology services to doctors, community health centres and hospitals. It employs over 33,000 people worldwide.
With a market cap over $10 billion, and recently hitting $5 billion in annual revenue, Sonic sits comfortably in the ASX 50. That’s a long way from where it was two decades ago. Back then, Sonic was trading at 15 cents, with a turnover of just $20 million. Like I said, it has been one of the great growth stories of the ASX.
18
With a 3.0% yield franked at 30% (as per their recent dividend), it might not seem the most obvious choice to have in an income portfolio. However, Sonic’s growth could increase this yield to make it both an income and growth stock well into the future.
Trading recently at all-time highs, the share price has had a stellar run. It might not be the time to chase it, though, so please read my instructions before deciding to invest.
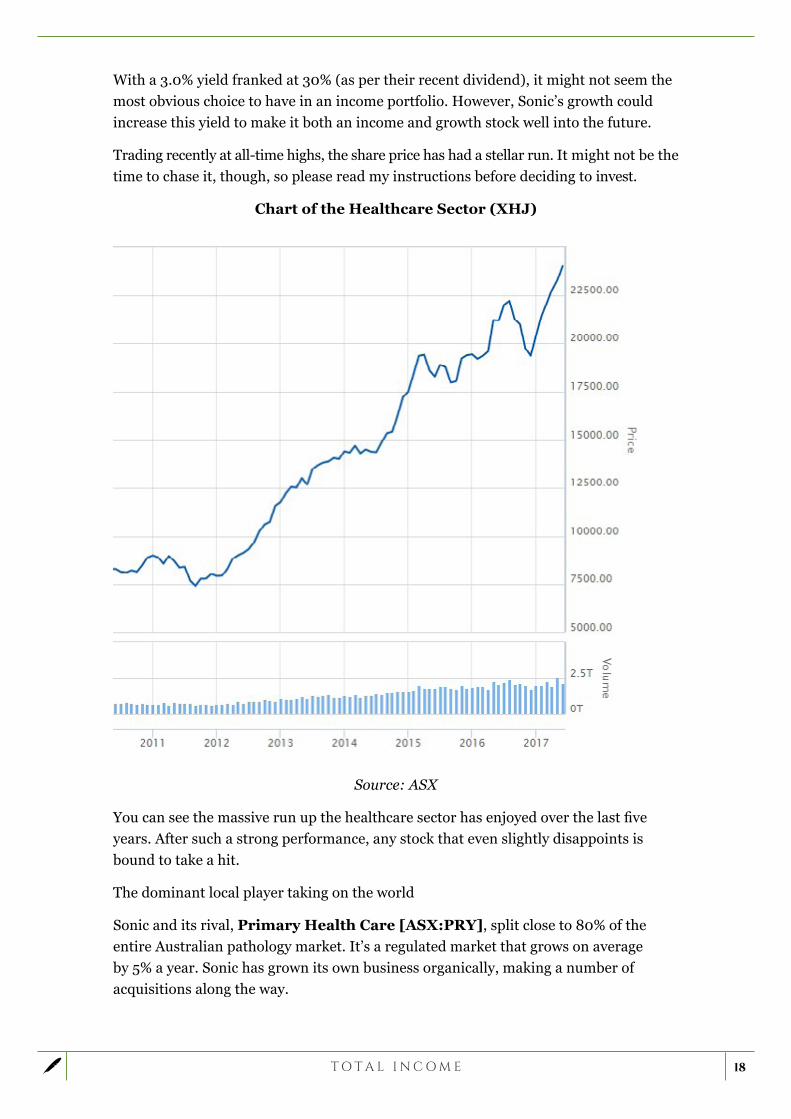
Chart of the Healthcare Sector (XHJ)
Source: ASX
You can see the massive run up the healthcare sector has enjoyed over the last five years. After such a strong performance, any stock that even slightly disappoints is bound to take a hit.
The dominant local player taking on the world
Sonic and its rival, Primary Health Care [ASX:PRY], split close to 80% of the entire Australian pathology market. It’s a regulated market that grows on average by 5% a year. Sonic has grown its own business organically, making a number of acquisitions along the way.

19
In fact, since 1991, there were only two years (1998 and 2014) when Sonic didn’t buy out a number of businesses.
And this hasn’t been growth just for the sake of it. Each acquisition naturally needed to fit into their business and profit targets. This scale now gives Sonic a cost advantage that any new entrant into the Australian market won’t be able to replicate.
These earnings from the Australian operations have enabled Sonic to carry out their global strategy. Like their Australian acquisitions, offshore purchases have been specifically targeted into countries where they can build up sufficient scale.
Sonic’s earnings have been punctuated by periods of high growth, followed by lower earnings growth as they undertook more acquisitions. For example, from 2001 to 2006, Morningstar calculates Sonic’s earnings per share growth at an annual compound rate of 15%.
This slowed to 5% over the next five years as Sonic expanded heavily into the US and Europe. Having now consolidated and rationalised many of these businesses, Sonic can once again concentrate on growth.
An ever-expanding global footprintCurrently operating in eight countries, Sonic is the number one pathology company in Germany, Switzerland and the UK. They’re the third largest in the US, though well behind the two entrenched locals.
Of their UK business, the biggest addition in 2015 was the joint venture between Sonic and two prestigious London hospitals — the University College London Hospital and the Royal Free. This joint venture was awarded a 10-year contract by the National Health Service (NHS) to provide laboratory services to these two hospitals, as well as the North Middlesex University Hospital.
This will most likely be the start of bigger things to come. As with Sonic’s business model, they are first investing in a cutting edge laboratory facility in central London. Completed near the end of last year, this facility will put all the processing facilities in a centralised location.
And earlier this year, Sonic announced partnerships with two hospital networks in the US — the Western Connecticut Health Network, and Baptist Memorial Health Care.
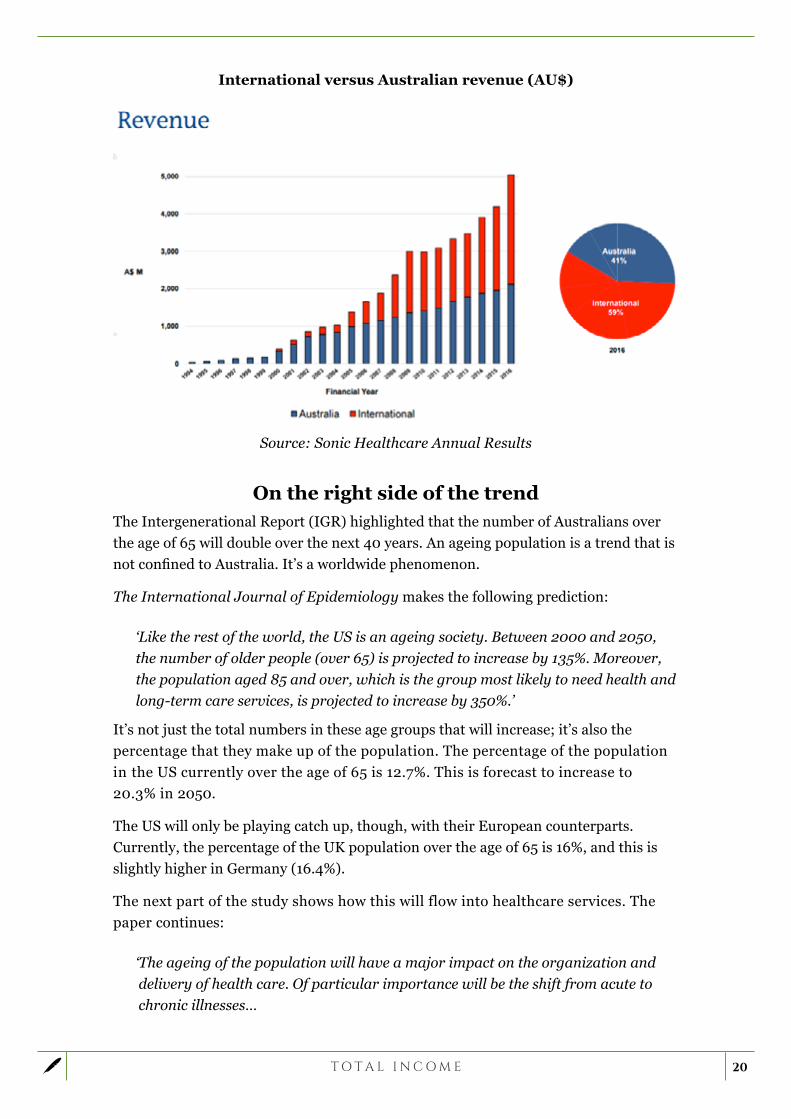
The accompanying chart shows just how much Sonic’s international revenues have grown since 2000. In 2016, international revenue exceeded that generated in Australia by $900 million.
The US alone generated just over AU$1 billion in revenue in 2016, representing around 22% of Sonic’s pathology revenues. Germany grew at 7%, and, combined with the Swiss operations, is likely to expand further into Europe.
As of its last full year results (30 June 2016), Sonic had in excess of AU$600 million in undrawn debt facilities with which to carry out further acquisitions.
20
International versus Australian revenue (AU$)
Source: Sonic Healthcare Annual Results
On the right side of the trendThe Intergenerational Report (IGR) highlighted that the number of Australians over the age of 65 will double over the next 40 years. An ageing population is a trend that is not confined to Australia. It’s a worldwide phenomenon.
The International Journal of Epidemiology makes the following prediction:
‘Like the rest of the world, the US is an ageing society. Between 2000 and 2050, the number of older people (over 65) is projected to increase by 135%. Moreover, the population aged 85 and over, which is the group most likely to need health and long-term care services, is projected to increase by 350%.’
It’s not just the total numbers in these age groups that will increase; it’s also the percentage that they make up of the population. The percentage of the population in the US currently over the age of 65 is 12.7%. This is forecast to increase to 20.3% in 2050.
The US will only be playing catch up, though, with their European counterparts. Currently, the percentage of the UK population over the age of 65 is 16%, and this is slightly higher in Germany (16.4%).
The next part of the study shows how this will flow into healthcare services. The paper continues:
‘ The ageing of the population will have a major impact on the organization and delivery of health care. Of particular importance will be the shift from acute to chronic illnesses…
21
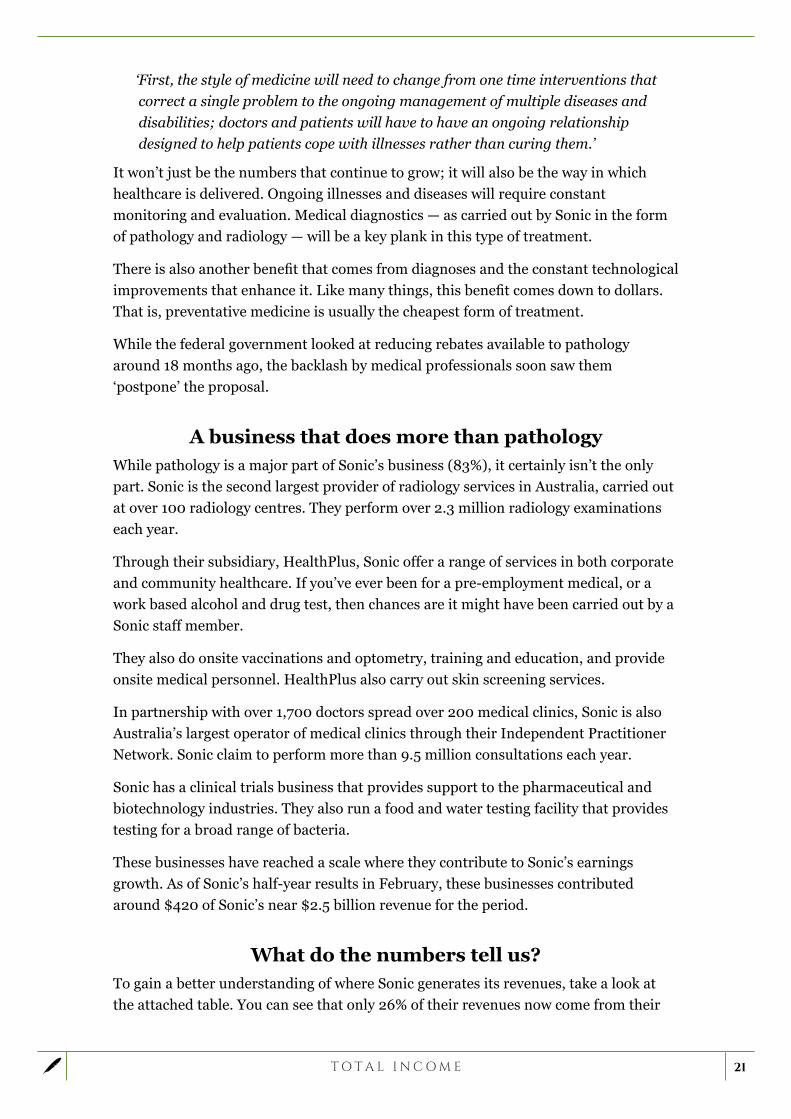
‘ First, the style of medicine will need to change from one time interventions that correct a single problem to the ongoing management of multiple diseases and disabilities; doctors and patients will have to have an ongoing relationship designed to help patients cope with illnesses rather than curing them.’
It won’t just be the numbers that continue to grow; it will also be the way in which healthcare is delivered. Ongoing illnesses and diseases will require constant monitoring and evaluation. Medical diagnostics — as carried out by Sonic in the form of pathology and radiology — will be a key plank in this type of treatment.
There is also another benefit that comes from diagnoses and the constant technological improvements that enhance it. Like many things, this benefit comes down to dollars. That is, preventative medicine is usually the cheapest form of treatment.
While the federal government looked at reducing rebates available to pathology around 18 months ago, the backlash by medical professionals soon saw them ‘postpone’ the proposal.
A business that does more than pathologyWhile pathology is a major part of Sonic’s business (83%), it certainly isn’t the only part. Sonic is the second largest provider of radiology services in Australia, carried out at over 100 radiology centres. They perform over 2.3 million radiology examinations each year.
Through their subsidiary, HealthPlus, Sonic offer a range of services in both corporate and community healthcare. If you’ve ever been for a pre-employment medical, or a work based alcohol and drug test, then chances are it might have been carried out by a Sonic staff member.
They also do onsite vaccinations and optometry, training and education, and provide onsite medical personnel. HealthPlus also carry out skin screening services.
In partnership with over 1,700 doctors spread over 200 medical clinics, Sonic is also Australia’s largest operator of medical clinics through their Independent Practitioner Network. Sonic claim to perform more than 9.5 million consultations each year.
Sonic has a clinical trials business that provides support to the pharmaceutical and biotechnology industries. They also run a food and water testing facility that provides testing for a broad range of bacteria.
These businesses have reached a scale where they contribute to Sonic’s earnings growth. As of Sonic’s half-year results in February, these businesses contributed around $420 of Sonic’s near $2.5 billion revenue for the period.
What do the numbers tell us?To gain a better understanding of where Sonic generates its revenues, take a look at the attached table. You can see that only 26% of their revenues now come from their
22
Australian pathology units. This is part of Sonic’s move to diversify its earnings to a wider base. This helps to reduce the impact from any potential change in government policy (more on that shortly).
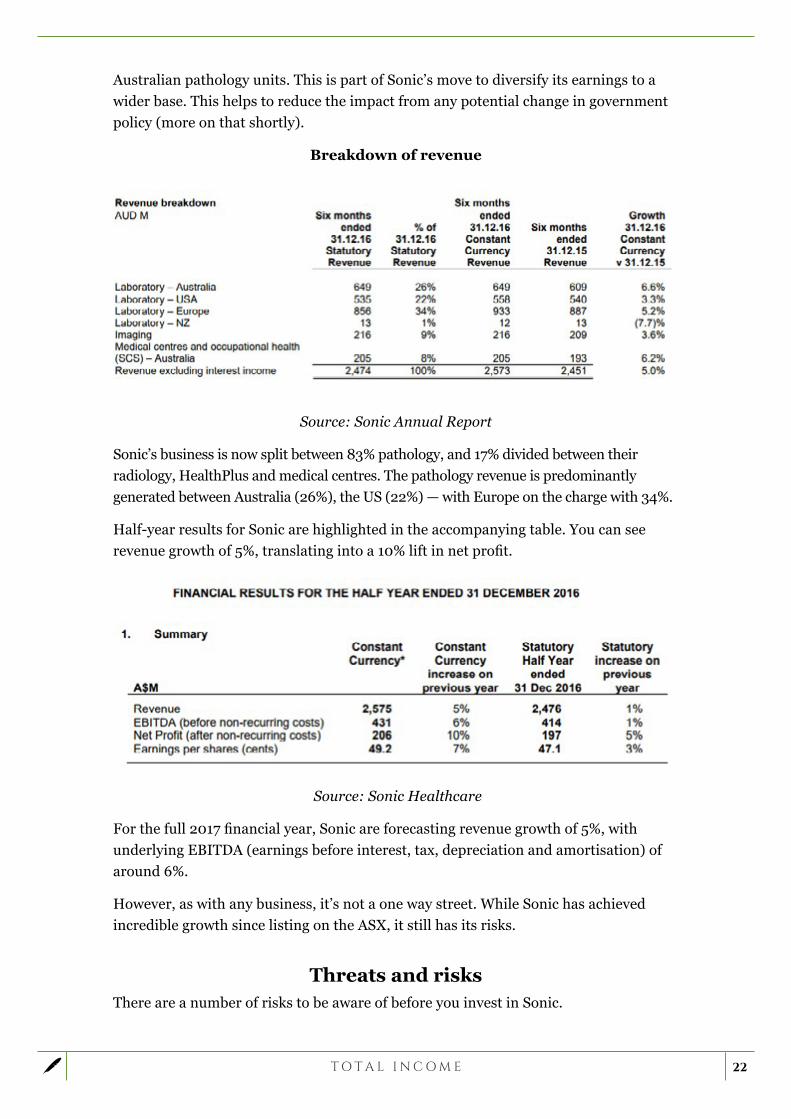
Breakdown of revenue
Source: Sonic Annual Report
Sonic’s business is now split between 83% pathology, and 17% divided between their radiology, HealthPlus and medical centres. The pathology revenue is predominantly generated between Australia (26%), the US (22%) — with Europe on the charge with 34%.
Half-year results for Sonic are highlighted in the accompanying table. You can see revenue growth of 5%, translating into a 10% lift in net profit.
Source: Sonic Healthcare
For the full 2017 financial year, Sonic are forecasting revenue growth of 5%, with underlying EBITDA (earnings before interest, tax, depreciation and amortisation) of around 6%.
However, as with any business, it’s not a one way street. While Sonic has achieved incredible growth since listing on the ASX, it still has its risks.
Threats and risksThere are a number of risks to be aware of before you invest in Sonic.
23
a) Government spending: Irrespective of the country or jurisdiction they operate in, any cut back in government spending on healthcare will directly impact Sonic’s revenues. While the preventative nature of diagnostics may attract fewer cuts than other areas, they are still vulnerable. This is another reason for Sonic to continue diversifying their income stream. It lessens the impact if there is any change in government policy.
b) Execution: Sonic have developed an enviable record for a string of acquisitions over the past 20 years. You’d suppose that, after buying so many businesses, they’d be pretty good at it. It doesn’t mean, though, that they’re not vulnerable to making a dud purchase. With little opportunity to expand the pathology business much further in Australia, Sonic could pursue the wrong opportunities for the sake of growth. They might also overpay for new businesses.
c) Succession: Much of the credit for Sonic’s stellar performance must go to CEO Colin Goldschmidt. He is widely credited with establishing the culture and reputation that has enabled Sonic to grow its business exponentially over the last two decades. A doctor and pathologist himself, he has now been at the helm since 1993. While Colin Goldschmidt is still only 63, there will obviously come a time when he decides it’s time to move on. Irrespective of whatever succession plan Sonic put in place, it will be a big transition for the new CEO.
d) Market risk: Specifically to Sonic, any negative news will directly affect its share price — like an earnings downgrade. More broadly, any selloff in the market could drag down their share price.
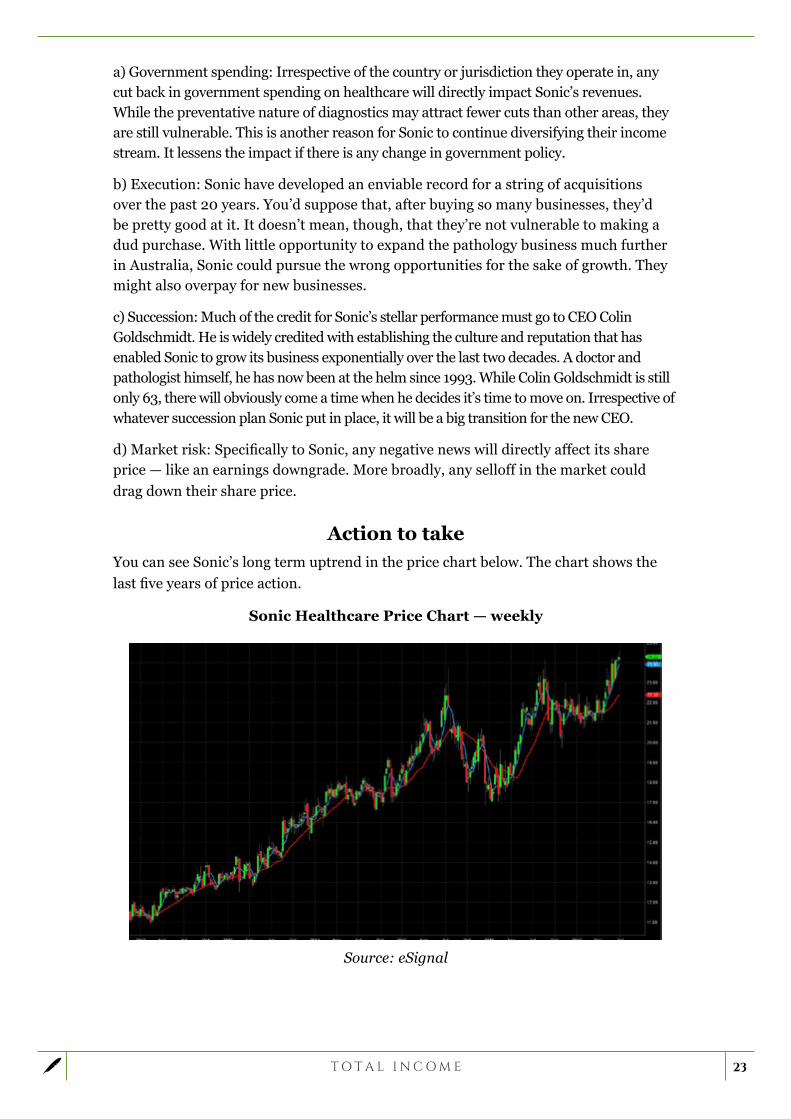
Action to takeYou can see Sonic’s long term uptrend in the price chart below. The chart shows the last five years of price action.
Sonic Healthcare Price Chart — weekly
Source: eSignal
24
Sonic is a company that has achieved a remarkable level of growth over the last 20 years. They are capitalising further after a string of carefully considered acquisitions, and by continually investing in their own business.
With a worldwide ageing population, the healthcare industry is one that looks set for even more growth and opportunities. Sonic is an Australian company ready to benefit from this seemingly unstoppable trend.
Sonic is currently trading at around $24.20. I’d wait for a pullback before looking to enter — somewhere in the $22–$23 range.
If you get set, I’d look to use a stop-loss around 30% below the entry price. If you bought in at $23, that puts your stop-loss around $16.10. Of course, this is just a guide. Please use your own stop levels if you have your own system.
ACTION TO TAKE
Buy Sonic Healthcare [ASX:SHL] at a target entry of $22–$23. Once in the trade, use a stop-loss around 30% below your entry price, although pick your own level if you prefer.

25
All content is © 2005–2017 Port Phillip Publishing Pty Ltd All Rights Reserved
Port Phillip Publishing Pty Ltd holds an Australian Financial Services License: 323 988. | ACN: 117 765 009 ABN: 33 117 765 009
All advice is general advice and has not taken into account your personal circumstances. Please seek independent financial advice regarding your own situation, or if in doubt about the suitability of an investment.
Calculating Your Future Returns: The value of any investment and the income derived from it can go down as well as up. Never invest more than you can afford to lose and keep in mind the ultimate risk is that you can lose whatever you’ve invested. While useful for detecting patterns, the past
is not a guide to future performance. Some figures contained in this report are forecasts and may not be a reliable indicator of future results. Any potential gains in this letter do not include taxes, brokerage commissions, or associated fees. Please seek independent financial advice regarding
your particular situation. Investments in foreign companies involve risk and may not be suitable for all investors. Specifically, changes in the rates of exchange between currencies may cause a divergence between your nominal gain and your currency-converted gain, making it possible to lose money once your total return is adjusted for currency. The Reader acknowledges that the contents of this newsletter and all associated
intellectual property rights of Port Philip Publishing Pty Ltd (PPP) including copyright, design rights, property rights, rights to data and databases, trademarks, service marks and any other rights created or developed in the course of the provision of the newsletter shall be and remain the sole
and exclusive property of PPP. No person is permitted to copy, forward or reproduce the newsletter and/or its contents without express consent of PPP. Subscribers to the newsletter are permitted to use this material for their own personal and investment use.
If you would like to contact us about your subscription please call us on 1300 667 481 or email us at [email protected]
Port Phillip Publishing Attn: Tactical Wealth PO Box 713 South Melbourne VIC 3205 | Tel: 1300 667 481 | Fax: (03) 9558 2219