Embed Size (px)
Citation preview
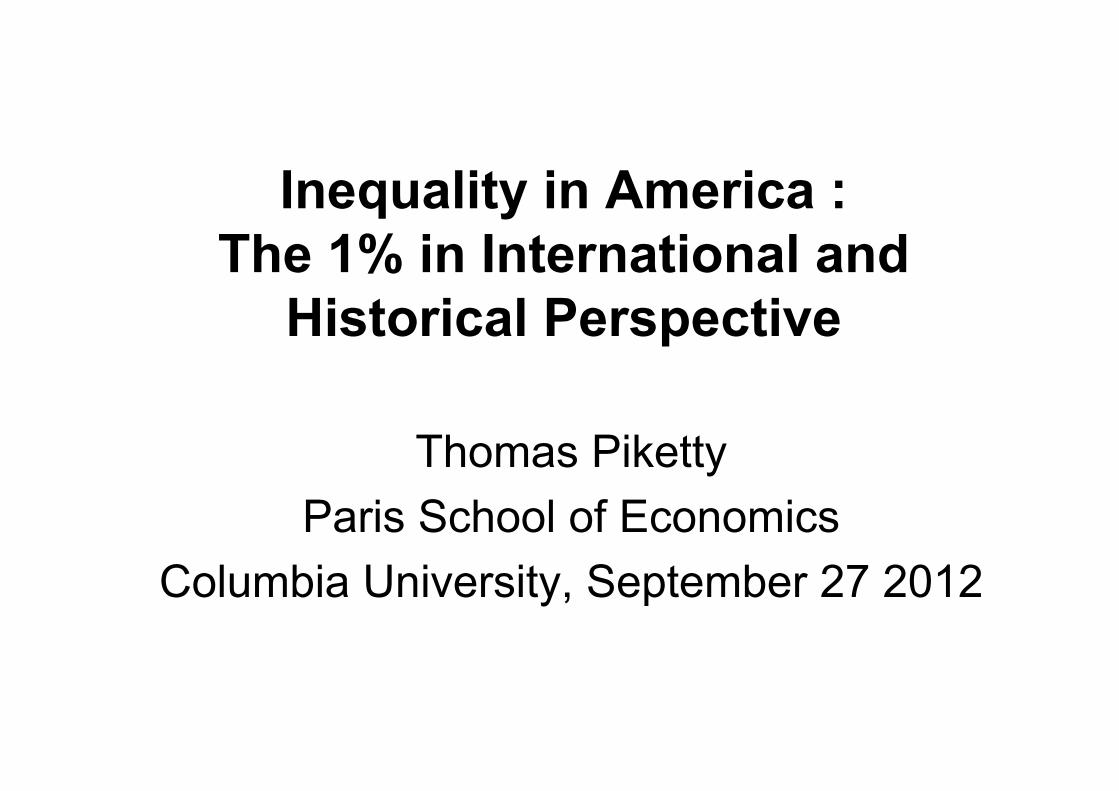
Inequality in America :The 1% in International and
Historical Perspective
Thomas PikettyParis School of Economics
Columbia University, September 27 2012

Inequality & capitalism in the long run
• Long run distributional trends = key question askedby 19C economists
• Many came with apocalyptic answers• Ricardo-Marx: a small group in society (land owners
or capitalists) will capture an ever growing share of income & wealth → no “balanced development path” can occur
• During 20C, a more optimistic consensus emerged: “growth is a rising tide that lifts all boats”(Kuznets 1953; cold war context)

• But inequality ↑ since 1970s destroyed this fragile consensus (US 1976-2007: ≈60% of total growth wasabsorbed by top 1%)
→ 19C economists raised the right questions; we need to adress these questions again; we have no strongreason to believe in balanced development path
• 2007-2012 world financial crisis also raised doubts about balanced devt path… will stock options & bonuses, or oil-rich countries, or China, or tax havens, absorb an ever growing share of world ressources in 21C capitalism?

Convergence vs divergence• Convergence forces do exist: diffusion of knowledge
btw countries (fostered by econ & fin integration) & wth countries (fostered by adequate educ institutions)
• But divergence forces can be stronger:(1) When top earners set their own pay, there’s no limit to
rent extraction → top income shares can diverge(2) The wealth accumulation process contains several
divergence forces, especially with r > g → a lot dependson the net-of-tax global rate of return r on large diversified portfolios : if r=5%-6% in 2010-2050 (=whatwe observe in 1980-2010 for large Forbes fortunes, or Abu Dhabi sovereign fund, or Harvard endowment), thenglobal wealth divergence is very likely

This lecture: Inequality in America• Inequality in the US is now larger than ever before in
American history. About 50% of national income goes to thetop 10% (incl. 20% to top 1%), i.e. approximately the samerecord high level as UK or France around 1910.
• Does US inequality keep a distinctive meritocraticcharacter, or is the New World simply becoming like OldEurope ?
• As compared to UK or France 1910, current US inequality hasa different structure: it is more based upon labor income andless upon inherited wealth. But:
• This difference is a matter of degree and should not beexagerated. US wealth concentration is very large. US wealth-income ratios might also reach record levels in the future. Key difference with Europe = population growth.
• The enormous rise in top labor incomes has little to do withmerit. Modern US inequality puts enormous pressure on loosers (meritocratic extremism). At least Belle Epoque or Ancien Régime inequality did not really pretend to be fair.
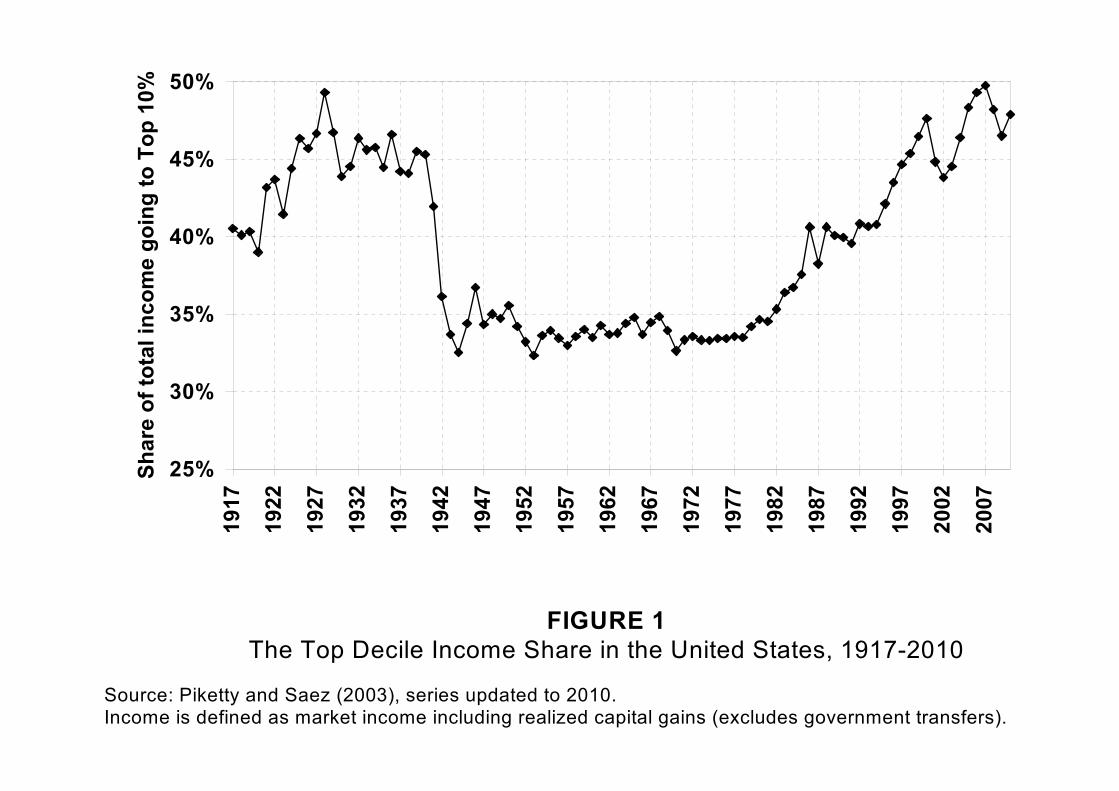
FIGURE 1The Top Decile Income Share in the United States, 1917-2010
Source: Piketty and Saez (2003), series updated to 2010. Income is defined as market income including realized capital gains (excludes government transfers).
25%
30%
35%
40%
45%
50%
1917
1922
1927
1932
1937
1942
1947
1952
1957
1962
1967
1972
1977
1982
1987
1992
1997
2002
2007
Shar
e of
tota
l inc
ome
goin
g to
Top
10%
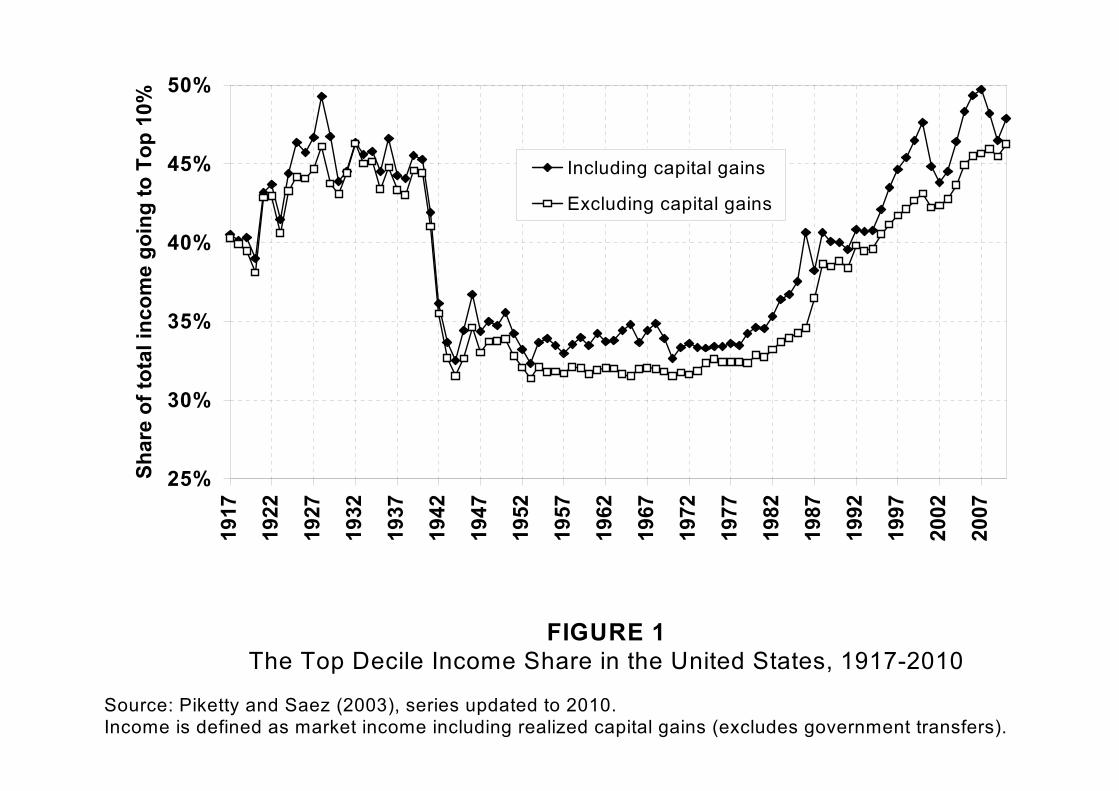
Including capital gains
Excluding capital gains
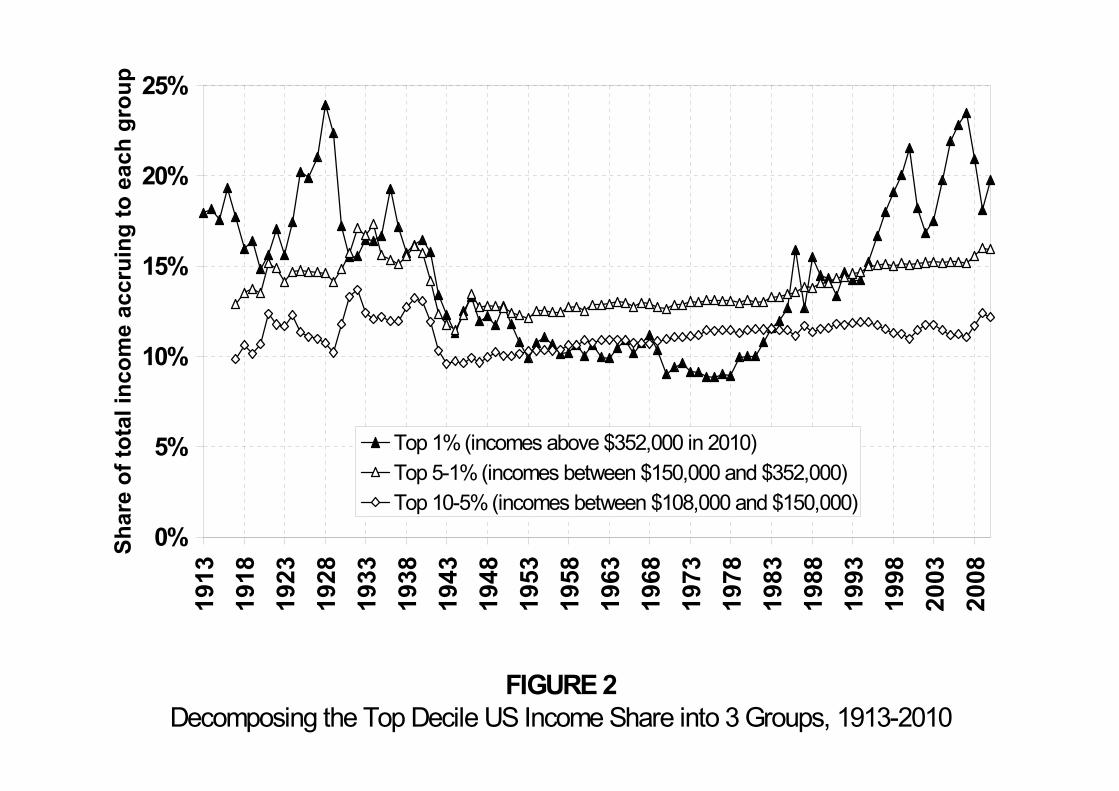
FIGURE 2Decomposing the Top Decile US Income Share into 3 Groups, 1913-2010
0%
5%
10%
15%
20%
25%
1913
1918
1923
1928
1933
1938
1943
1948
1953
1958
1963
1968
1973
1978
1983
1988
1993
1998
2003
2008
Shar
e of
tota
l inc
ome
accr
uing
to e
ach
grou
p
Top 1% (incomes above $352,000 in 2010)Top 5-1% (incomes between $150,000 and $352,000)Top 10-5% (incomes between $108,000 and $150,000)

Top Decile Income Shares 1910-2010
25%
30%
35%
40%
45%
50%
1910 1920 1930 1940 1950 1960 1970 1980 1990 2000 2010Source: World Top Incomes Database, 2012. Missing values interpolated using top 5% and top 1% series.
Shar
e of
tota
l inc
ome
goin
g to
top
10%
(inc
l. re
aliz
ed c
apita
l gai
ns
U.S.
U.K.
Germany
France

Top 1% share: English Speaking countries (U-shaped), 1910-2010
0
5
10
15
20
25
3019
10
1915
1920
1925
1930
1935
1940
1945
1950
1955
1960
1965
1970
1975
1980
1985
1990
1995
2000
2005
2010
Top
Perc
entil
e Sh
are
(in p
erce
nt)
United States United Kingdom
Canada Australia
Ireland New Zealand
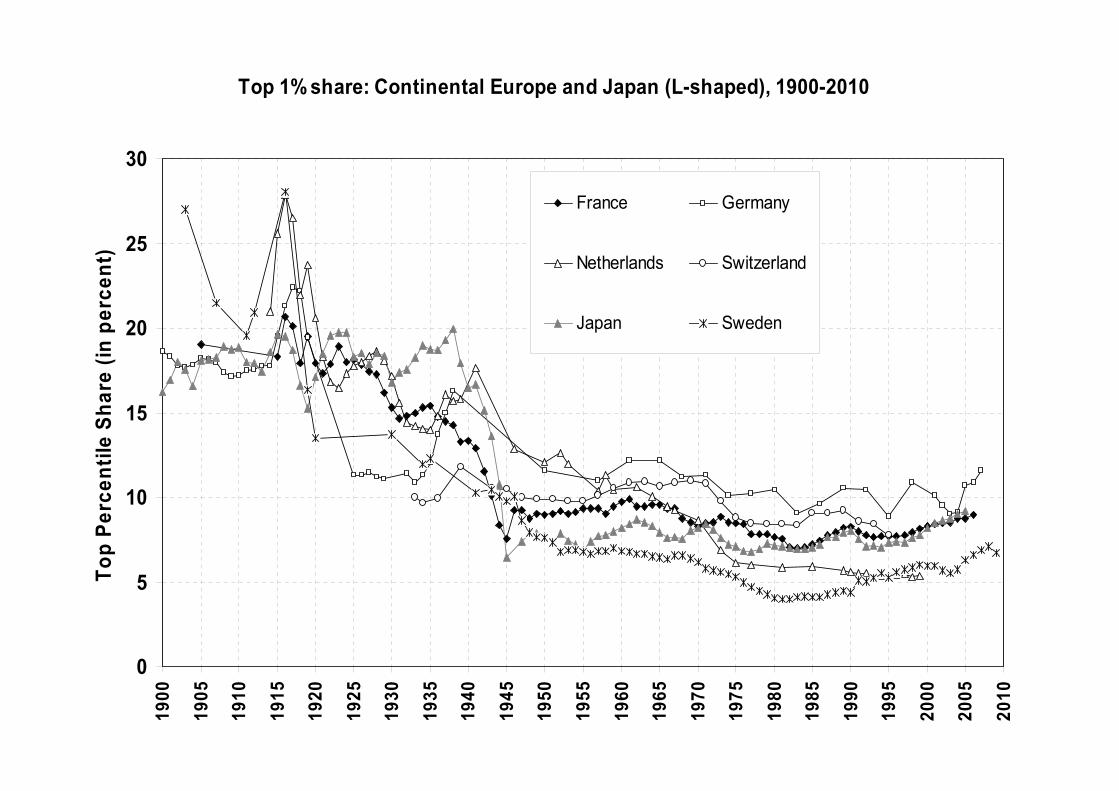
Top 1% share: Continental Europe and Japan (L-shaped), 1900-2010
0
5
10
15
20
25
3019
00
1905
1910
1915
1920
1925
1930
1935
1940
1945
1950
1955
1960
1965
1970
1975
1980
1985
1990
1995
2000
2005
2010
Top
Perc
entil
e Sh
are
(in p
erce
nt)
France Germany
Netherlands Switzerland
Japan Sweden
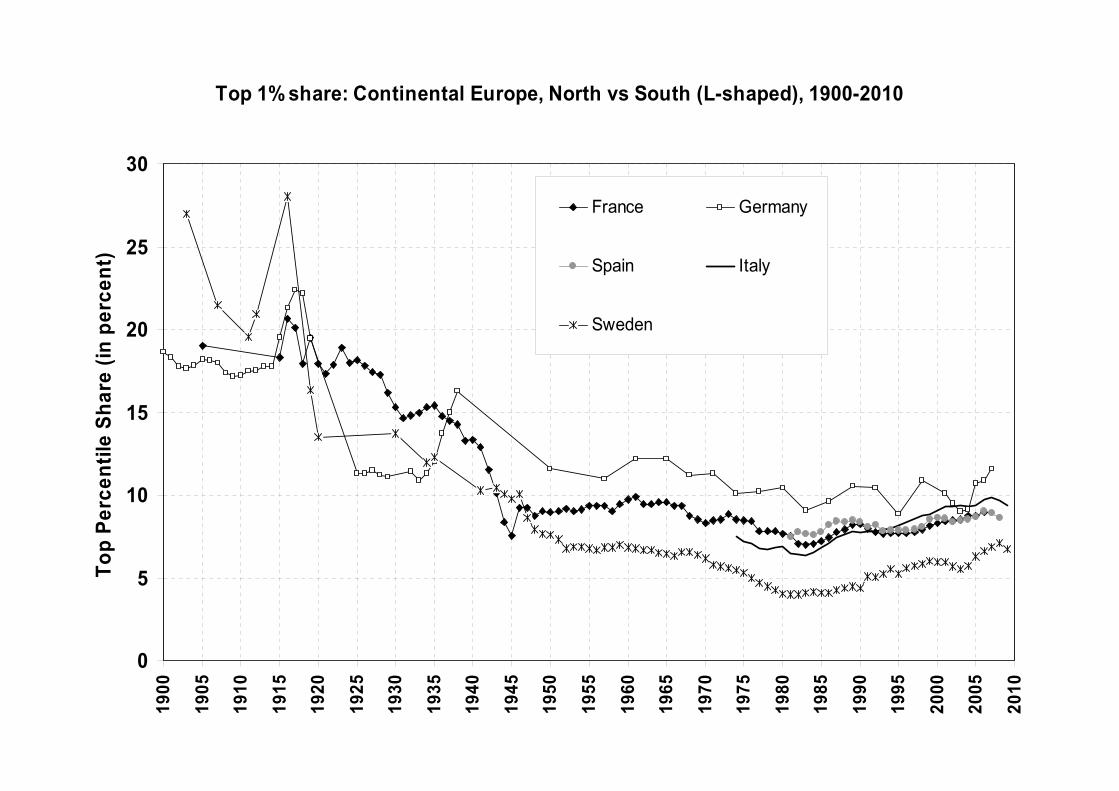
Top 1% share: Continental Europe, North vs South (L-shaped), 1900-2010
0
5
10
15
20
25
3019
00
1905
1910
1915
1920
1925
1930
1935
1940
1945
1950
1955
1960
1965
1970
1975
1980
1985
1990
1995
2000
2005
2010
Top
Perc
entil
e Sh
are
(in p
erce
nt)
France Germany
Spain Italy
Sweden
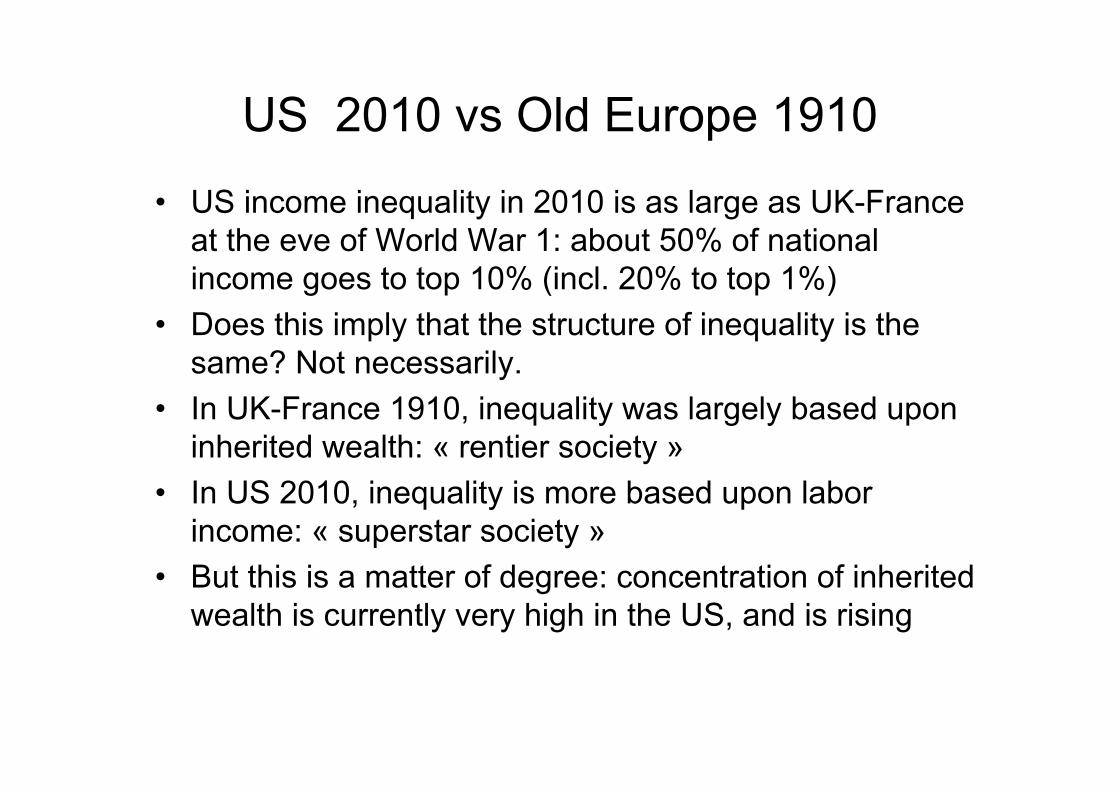
US 2010 vs Old Europe 1910
• US income inequality in 2010 is as large as UK-Franceat the eve of World War 1: about 50% of national income goes to top 10% (incl. 20% to top 1%)
• Does this imply that the structure of inequality is thesame? Not necessarily.
• In UK-France 1910, inequality was largely based uponinherited wealth: « rentier society »
• In US 2010, inequality is more based upon laborincome: « superstar society »
• But this is a matter of degree: concentration of inheritedwealth is currently very high in the US, and is rising
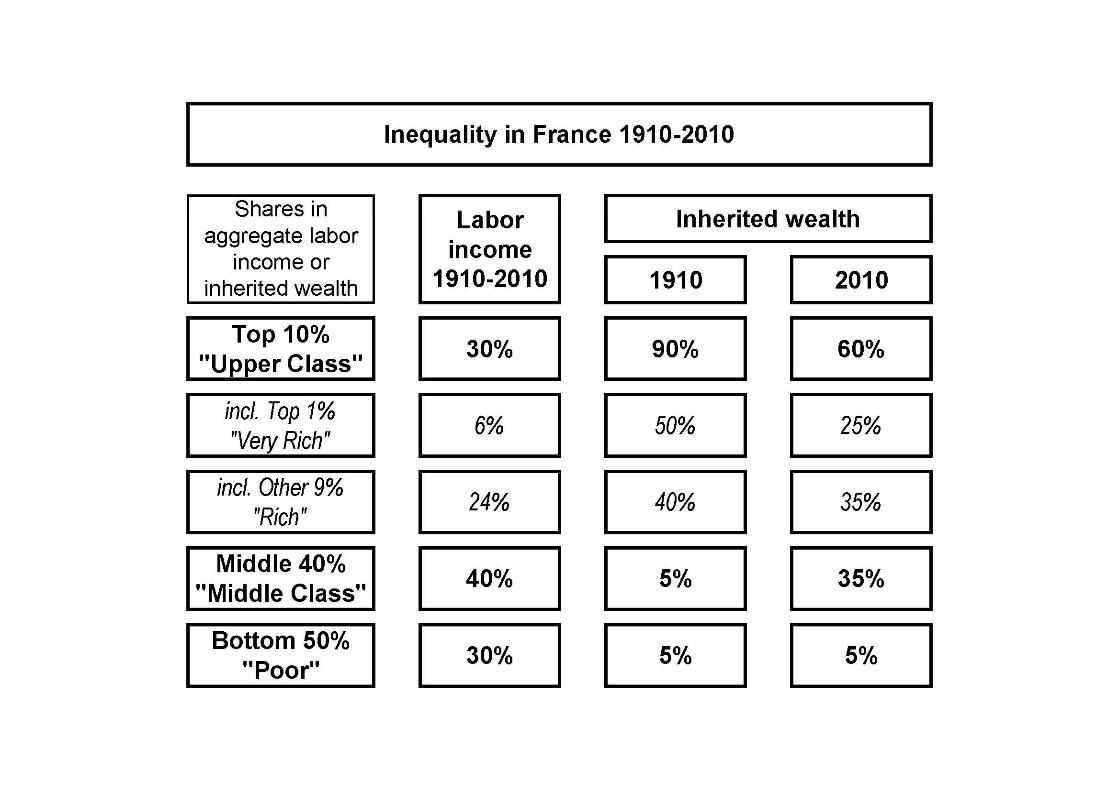
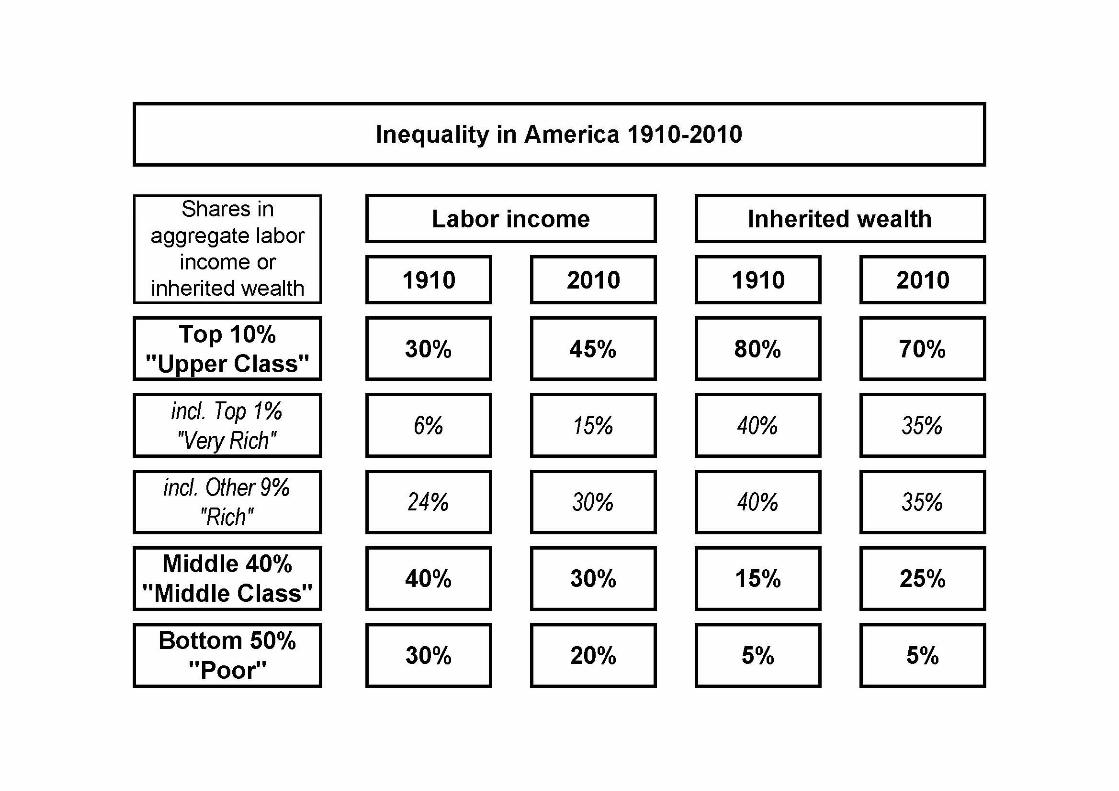

• Main difference btw US and Europe: aggregate wealth-income larger in Europe, bc higher pop growth in US
• Key mechanism: wealth-income ratio β = s/gIf saving rate s=10% & growth rate g=3%, then β≈300%
But if s=10% & g=1.5%, then β≈600%
• Back in 1800, the US was already a country where wealthmattered much less than in Europe: abundant land isworth less, so that new world had more land in volume, but less land in value
(more precisely: wealth mattered less in the US if weneglect slavery system; complex legacy for US inequality)

Private wealth / national income ratios 1870-2010
100%
200%
300%
400%
500%
600%
700%
800%
1870 1890 1910 1930 1950 1970 1990 2010Authors' computations using country national accounts. Private wealth = non-financial assets + financial assets - financial liabilities (household & non-profit sectors)
USA
Europe
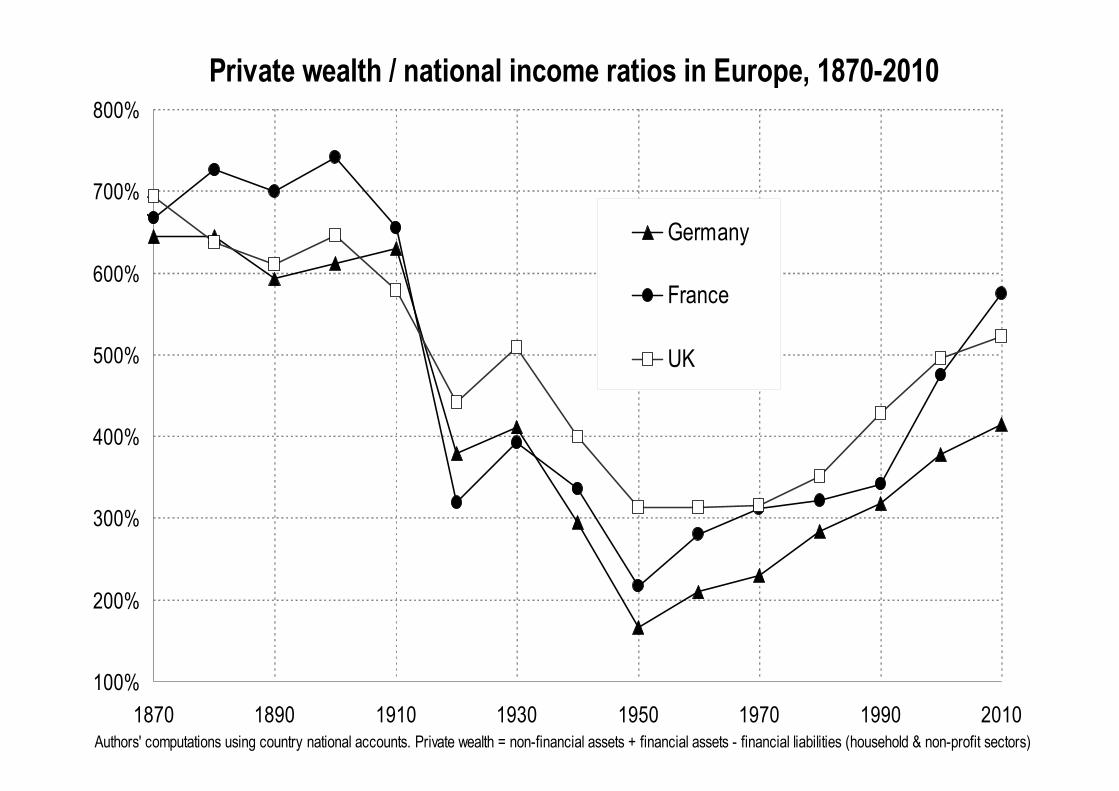
Private wealth / national income ratios in Europe, 1870-2010
100%
200%
300%
400%
500%
600%
700%
800%
1870 1890 1910 1930 1950 1970 1990 2010Authors' computations using country national accounts. Private wealth = non-financial assets + financial assets - financial liabilities (household & non-profit sectors)
Germany
France
UK
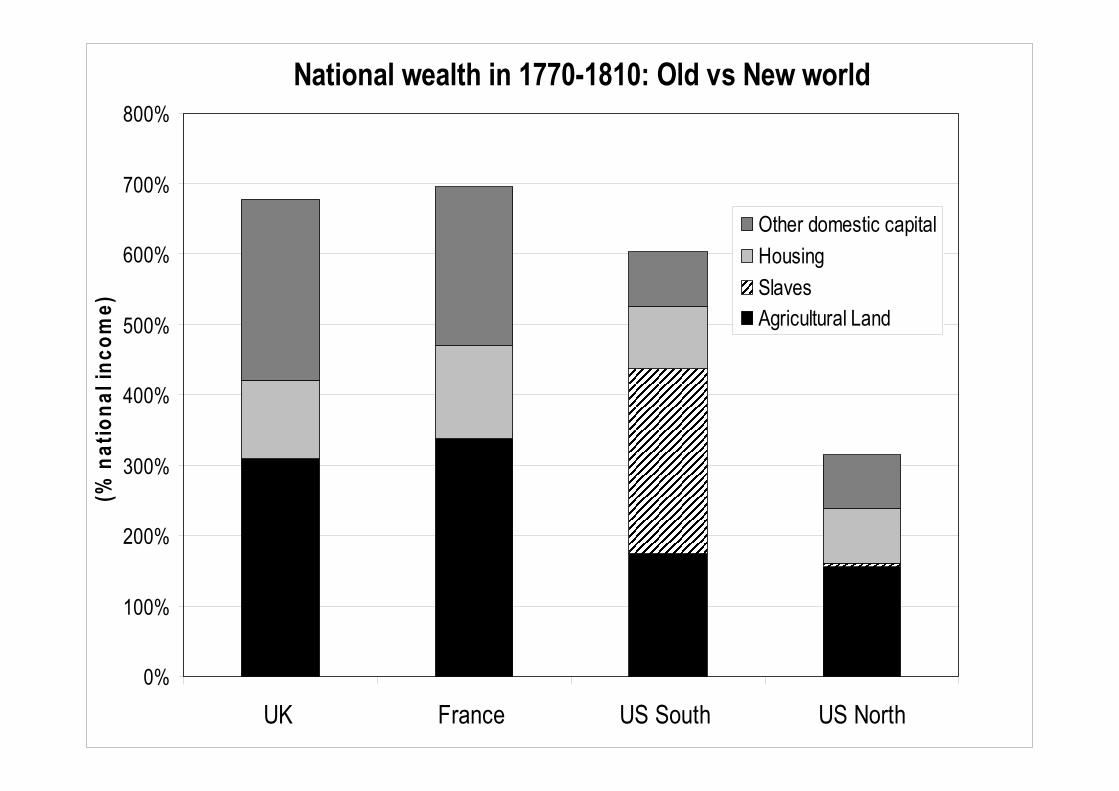
National wealth in 1770-1810: Old vs New world
0%
100%
200%
300%
400%
500%
600%
700%
800%
UK France US South US North
(% n
atio
nal i
ncom
e)
Other domestic capitalHousingSlavesAgricultural Land

Why did US top labor incomes rise so much?• It is hard to account for observed cross-country
variations with a purely technological, marginal-product story: technical change also occurred in Europe & Japan, so why inequality ↑ in US only?
• One popular view among some economists: US today = working rich get their marginal product(globalization, superstars)Europe today (& US 1970s) = market prices for highskills are distorted downwards (social norms, etc.)
→ very naïve view of the top end labor market…& very ideological: we have zero evidence on the
marginal product of top executives; it could well bethat prices are distorted upwards
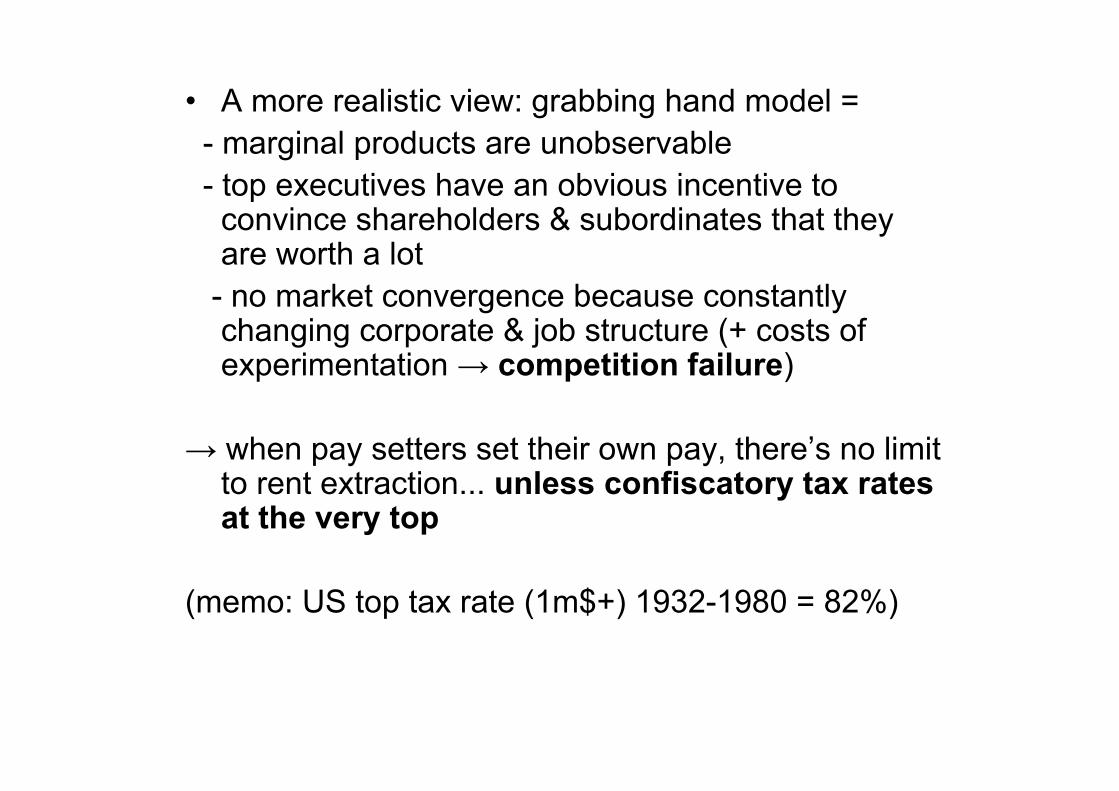
• A more realistic view: grabbing hand model = - marginal products are unobservable- top executives have an obvious incentive to
convince shareholders & subordinates that theyare worth a lot
- no market convergence because constantlychanging corporate & job structure (+ costs of experimentation → competition failure)
→ when pay setters set their own pay, there’s no limitto rent extraction... unless confiscatory tax rates at the very top
(memo: US top tax rate (1m$+) 1932-1980 = 82%)

Top Income Tax Rates 1910-2010
0%
10%
20%
30%
40%
50%
60%
70%
80%
90%
100%
1910 1920 1930 1940 1950 1960 1970 1980 1990 2000 2010Source: World Top Incomes Database, 2012.
Top
mar
gina
l inc
ome
tax
rate
app
lyin
g to
top
inco
me
U.S.
U.K.
Germany
France
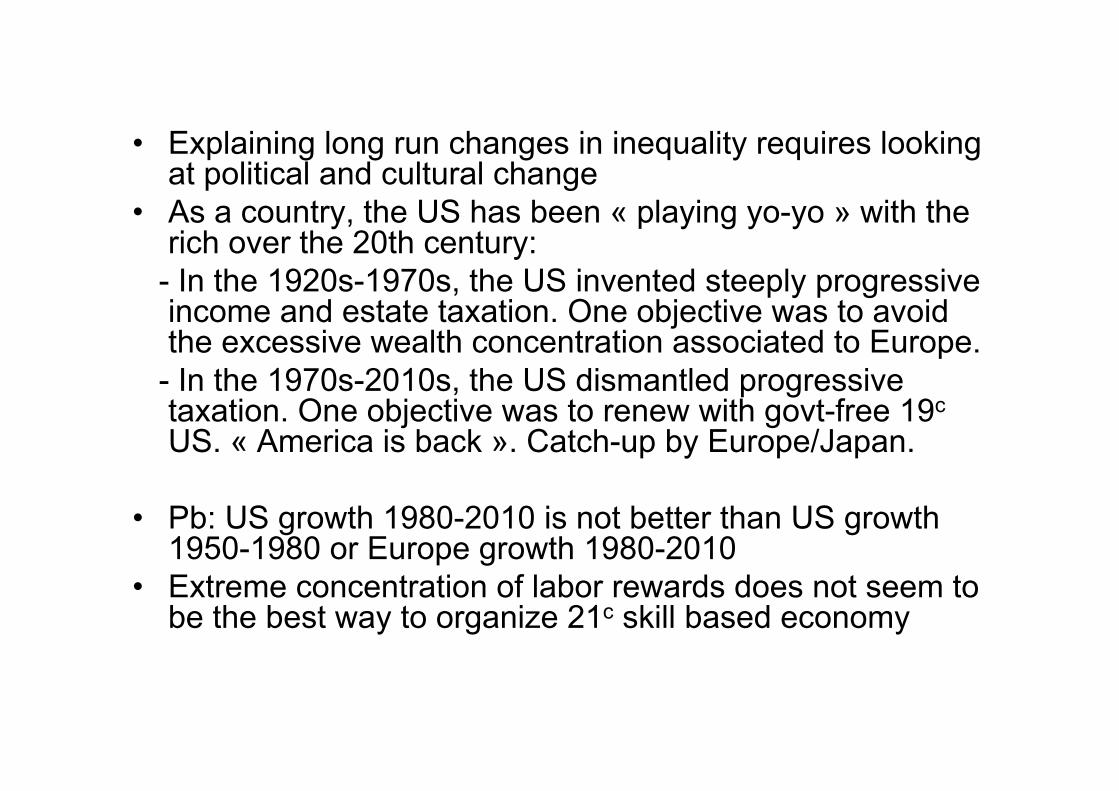
• Explaining long run changes in inequality requires lookingat political and cultural change
• As a country, the US has been « playing yo-yo » with therich over the 20th century:
- In the 1920s-1970s, the US invented steeply progressive income and estate taxation. One objective was to avoidthe excessive wealth concentration associated to Europe.
- In the 1970s-2010s, the US dismantled progressive taxation. One objective was to renew with govt-free 19c
US. « America is back ». Catch-up by Europe/Japan.
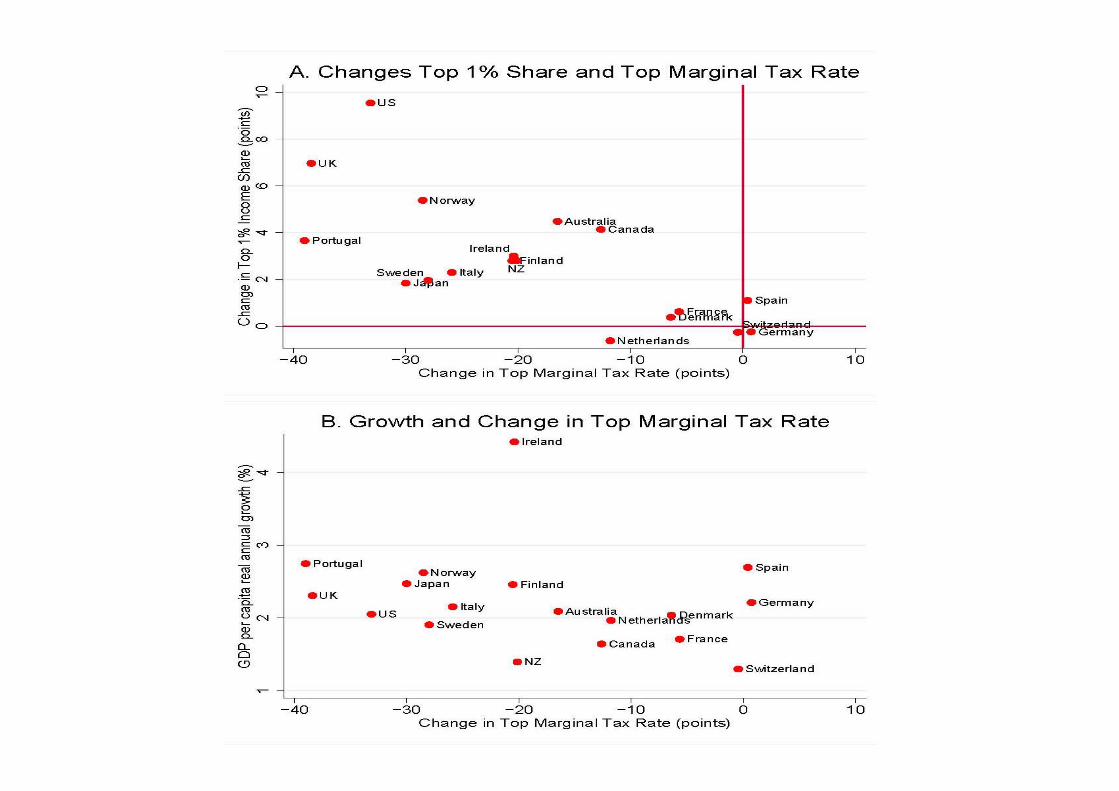
• Pb: US growth 1980-2010 is not better than US growth1950-1980 or Europe growth 1980-2010
• Extreme concentration of labor rewards does not seem to be the best way to organize 21c skill based economy
Summing up• American inequality will keep its distinctive character
as long as the US remains the New world, i.e. as long as population growth is much larger than Europe
• … and if the US renews with its equal-opportunitytradition and institutions: massive investment in skills, progressive taxation to prevent excessive concentration of wealth and economic power
• Otherwise the US inequality model can become theworst of all worlds: large concentration of wealth + large concentration of labor income + extremistmeritocratic discourse putting pressure on loosers

Top Inheritance Tax Rates 1900-2011
0%
10%
20%
30%
40%
50%
60%
70%
80%
90%
100%
1900 1910 1920 1930 1940 1950 1960 1970 1980 1990 2000 2010
U.S.
U.K.
France
Germany

Private wealth / national income ratios, 1970-2010
100%
200%
300%
400%
500%
600%
700%
800%
1970 1975 1980 1985 1990 1995 2000 2005 2010Authors' computations using country national accounts. Private wealth = non-financial assets + financial assets - financial liabilities (household & non-profit sectors)
USA Japan
Germany France
UK Italy
Canada Australia
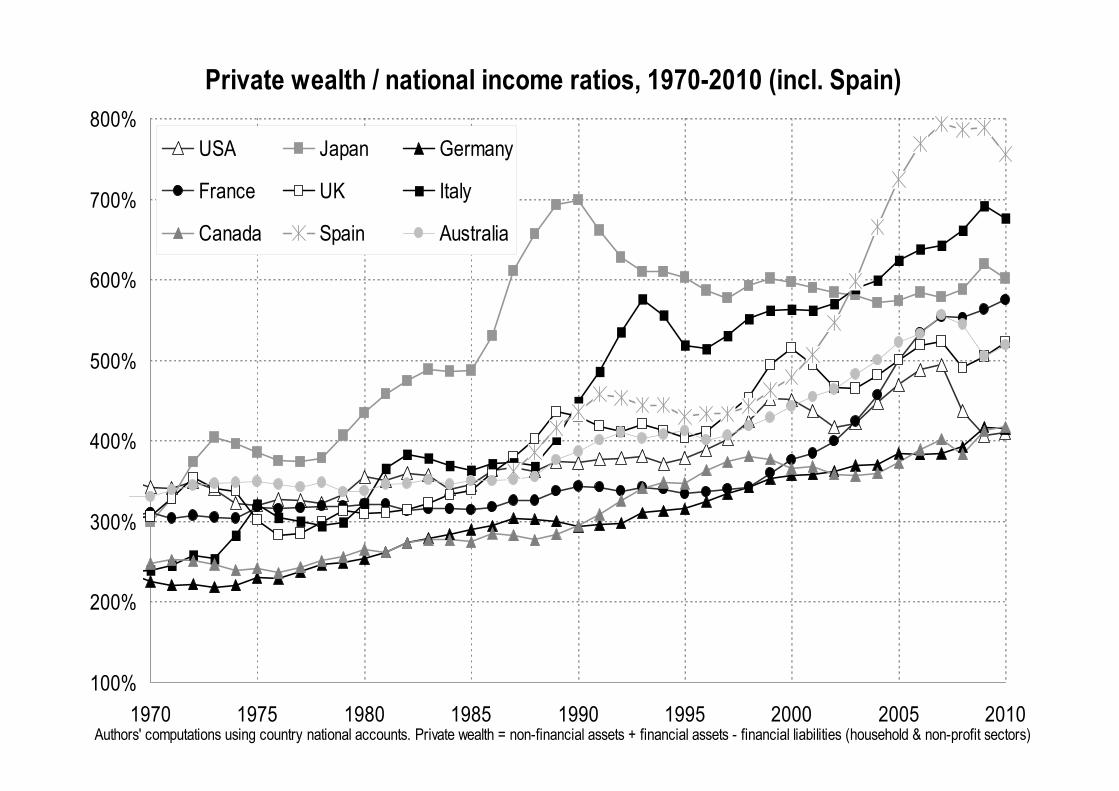
Private wealth / national income ratios, 1970-2010 (incl. Spain)
100%
200%
300%
400%
500%
600%
700%
800%
1970 1975 1980 1985 1990 1995 2000 2005 2010Authors' computations using country national accounts. Private wealth = non-financial assets + financial assets - financial liabilities (household & non-profit sectors)
USA Japan Germany
France UK Italy
Canada Spain Australia

Private vs governement wealth, 1970-2010 (% national income)
-100%
0%
100%
200%
300%
400%
500%
600%
700%
800%
1970 1975 1980 1985 1990 1995 2000 2005 2010Authors' computations using country national accounts. Government wealth = non-financial assets + financial assets - financial liabilities (govt sector)
USA Japan
Germany France
UK Italy
Canada Australia
Government wealth
Private wealth
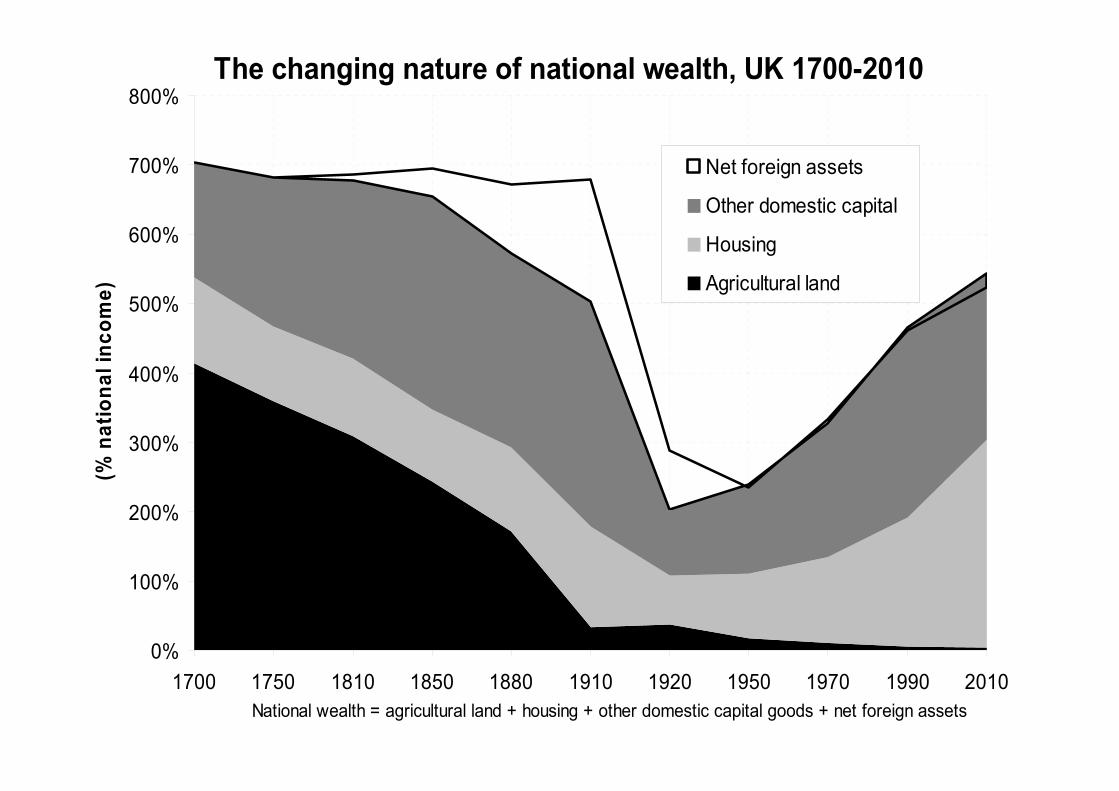
The changing nature of national wealth, UK 1700-2010
0%
100%
200%
300%
400%
500%
600%
700%
800%
1700 1750 1810 1850 1880 1910 1920 1950 1970 1990 2010National wealth = agricultural land + housing + other domestic capital goods + net foreign assets
(% n
atio
nal i
ncom
e)
Net foreign assets
Other domestic capital
Housing
Agricultural land

The changing nature of national wealth, France 1700-2010
0%
100%
200%
300%
400%
500%
600%
700%
800%
1700 1750 1780 1810 1850 1880 1910 1920 1950 1970 1990 2010National wealth = agricultural land + housing + other domestic capital goods + net foreign assets
(% n
atio
nal i
ncom
e)
Net foreign assets
Other domestic capital
Housing
Agricultural land

The changing nature of national wealth, US 1770-2010
0%
100%
200%
300%
400%
500%
600%
1770 1810 1850 1880 1910 1920 1930 1950 1970 1990 2010National wealth = agricultural land + housing + other domestic capital goods + net foreign assets
(% n
atio
nal i
ncom
e)Net foreign assetsOther domestic capitalHousingAgricultural land

The changing nature of national wealth, US 1770-2010 (incl. slaves)
0%
100%
200%
300%
400%
500%
600%
1770 1810 1850 1880 1910 1920 1930 1950 1970 1990 2010
National wealth = agricultural land + housing + other domestic capital goods + net foreign assets
(% n
atio
nal i
ncom
e)Net foreign assetsOther domestic capitalHousingSlavesAgricultural land

The changing nature of national wealth, Canada 1860-2010
0%
100%
200%
300%
400%
500%
600%
1860 1880 1900 1920 1940 1960 1980 2000National wealth = agricultural land + housing + other domestic capital - net foreign liabilites
(% n
atio
nal i
ncom
e)
Net foreign liabilitiesOther domestic capitalHousingAgricultural land