Embed Size (px)
Citation preview

The 09/03/2010 Darfield Earthquake and its Aftershocks,
Including the 02/21/2011 Christchurch Event
Educational SlidesCreated & Compiled by Gavin Hayes
U.S. Geological Survey, National Earthquake Information Center
Contributions from: David Wald, USGS NEICKuo-Wan Lin, USGS NEICKishor Jaiswal, USGS NEICBrendon Bradley, U. Canterbury, New Zealand
Gavin Hayes and Kishor Jaiswal are contracted to work for the USGS NEIC by Synergetics Inc., Fort Collins, CO.

Darfield Earthquake, 09/03/2010, Mw7.0

Christchurch Earthquake, 02/21/2011, Mw6.1

Comparing Population Exposure
Much greater exposures at high intensities for the Christchurch earthquake.
Christchurch Earthquake Population Exposure
This Google Earth snap-shot shows the extent of earthquake ground shaking (from USGS ShakeMap; represented in color) overlain on population density (from LandScan 2008, Oakridge National Labs; represented as height of vertical bars) at a grid size of 1 km2.

Comparing Shaking Distributions
In Christchurch, accelerations were much higher during the 02/21 event - up to x6 the accelerations of the Darfield earthquake.

Comparing Shaking Distributions
The concentration of higher accelerations coincided with the regions of highest population density. Population data from LandScan 2008, Oakridge National Labs.

Comparing Shaking Distributions

Comparing Ground Motions
The figures on the left compare preliminary ground motions for stations in the Christchurch region observing both the Christchurch and Darfield earthquakes.
Figures courtesy of Brendon Bradley; data from GNS Science, New Zealand.
HPSCPRPC

Darfield Earthquake Aftershock Sequence, 09/03/10 - 02/20/11 (prior to the Christchurch earthquake).
Data from GNS Science, New Zealand

Darfield Earthquake Aftershock Sequence, 09/03/10 - 03/02/11
Data from GNS Science, New Zealand

Darfield Earthquake Aftershock Sequence, Time History
Figure modified from J. Donovan & T. Jordan
Christchurch EQ
Darfield EQ

Darfield Earthquake Aftershock Sequence, M:Time History
Christchurch EQ
Darfield EQ
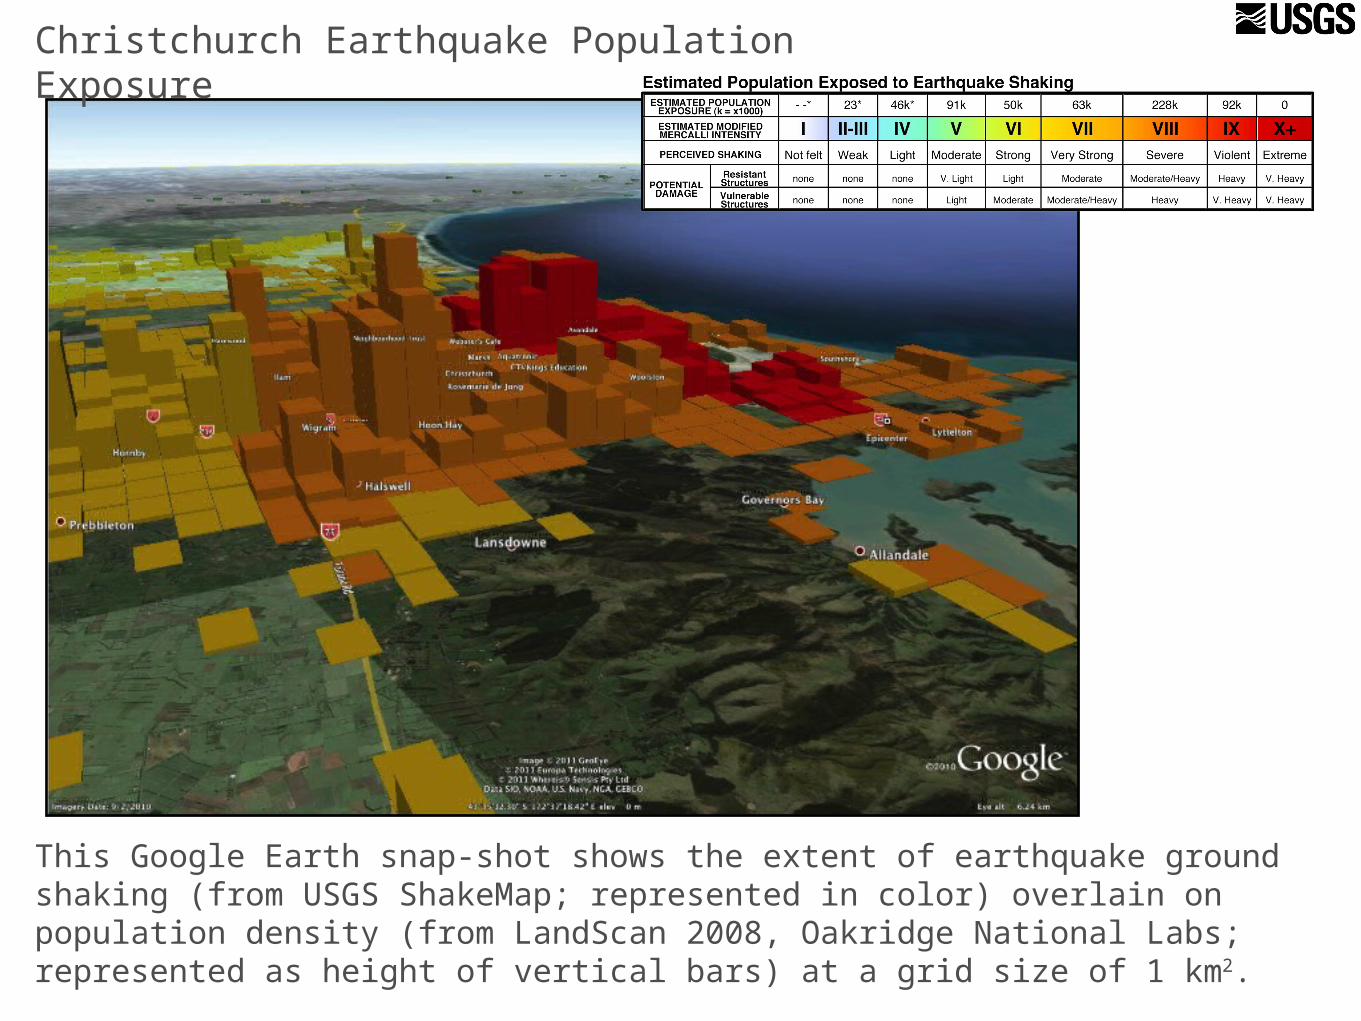
Darfield Earthquake Aftershock Sequence, Spatial Energy Release
Understanding the precise relationship between the two events involves unraveling the complex faulting history of the Darfield earthquake, and how that network of faults relates to the fault that ruptured on 02/21.
This image projects the energy release of all earthquakes in the sequence onto an E-W profile.