Embed Size (px)
Citation preview

Assessment – TE2B NORTH /2016 © Crown Copyright
Produced for:
THAMES ESTUARY
TE2B NORTH SHIPWAY
ASSESSMENT TE2B NORTH/2016 V2
An assessment of the 2016 hydrographic survey of the area TE2B North Shipway: to monitor recent seabed movement; to identify any implications for shipping; and to make recommendations for future surveys.

Assessment – TE2B NORTH /2016 © Crown Copyright
CONTENTS
1. Executive Summary 1
2. Introduction 1
3. Area History 2
4. Description of the Area 2
5. Shipping in the Area 3
6. Reference Survey Detail 4
7. Comparison Survey Detail 5
8. Description of Recent Bathymetric Change 6
9. Implications for Shipping 10
10. Recommendations for Future Surveys 10
Assessment – TE2B/2016 © Crown Copyright
Page 1 of 10
TE2B NORTH SHIPWAY, 2016
1. EXECUTIVE SUMMARY
The Area and Recent Changes
1.1 Area TE2B North Shipway is an area that covers part of the northern approach to Harwich Haven ports. It is bounded by Bawdsey Bank to the west and an area of sandwaves to the east. The area TE2B is not formally included in the Routine Resurvey Programme following the recommendation in 1993 to remove the area but does partially overlap TE2A North Shipwash to the north.
1.2 In the east of TE2B there is an area of sandwaves up to 5m amplitude, which appear to be fairly stable.
1.3 The minimum depth in the area is 2.8m, located along a sandwave in the south-east of the area; which is 0.1m shoaler than in 1993.
1.4 AIS data indicates that the largest registered draught of vessel to transit through Area TE2B was 11.4m. Depths within the main shipping route through TE2B are deeper than this draught, but Bawdsey Bank to the west and the sandwave area to the east are shoaler.
Reasons for Continuing to Resurvey the Area
1.5 To monitor the eastward migration of Bawdsey Bank towards shipping route through TE2B.
1.6 To monitor the north to north-easterly movement of sandwaves towards N Shipwash buoy and the majority of shipping that bear eastwards after N Shipwash buoy.
1.7 Another full density survey is required for better clarification on the movement and potential migratory trends of both Bawdsey and Shipwash Bank, and the North Ship Head sandwaves.
Recommendations
1.8 TE2B North and South should be reintroduced in to the Routine Resurvey Programme with the same limits. Another multibeam survey is recommended for TE2B in 2020 to allow confirmation of the migration rates indicated in this report and for a more comprehensive comparison with the 2016 survey.
2. INTRODUCTION
2.1 This Assessment is produced by the United Kingdom Hydrographic Office (UKHO) for the Maritime and Coastguard Agency (MCA).
2.2 Analysis of the Routine Resurvey Areas forms part of the Civil Hydrography Programme and the reports are made available to all interested parties through the UKHO website and are presented to the Civil Hydrography Working Group. When approved, the recommendations are incorporated into the Routine Resurvey Programme.
2.3 The Admiralty Chart extracts, other graphics and tables in this Report are included for illustrative purposes only and are NOT TO BE USED FOR NAVIGATION.
2.4 This material is protected by Crown Copyright. It may be downloaded from the UK Hydrographic Office's (UKHO) web site and printed in full for personal or non-commercial internal business use. Extracts may also be reproduced for personal or non-commercial internal business use on

Assessment – TE2B/2016 © Crown Copyright
Page 2 of 10
the condition that the UK Hydrographic Office is acknowledged as the publisher and the Crown is acknowledged as the copyright owner.
2.5 Applications for permission to reproduce the material for any other purpose (including any distribution of the material or extracts to third parties) can be made interactively on the UKHO's web site (www.ukho.gov.uk), by e-mail to [email protected] or in writing to Intellectual Property, UK Hydrographic Office, Admiralty Way, Taunton, Somerset, TA1 2DN.
3. AREA HISTORY
3.1 Summary of Surveys:
Key: s = sonar sweep, t = seabed texture tracing, d = digital data, m = multibeam digital data Single-beam surveys (prior to 2004) conducted at 1:25,000 scale
3.2 Summary of historical recommendation enacted
Year Remarks
1993 The controlling depth of the navigation channel is dependent upon that established in the shoaler neighbouring area of TE2a - North Shipwash, forming the entrance to area TE2b - Shipway. Subject to that depth not increasing, area TE2b should be removed from the list of routine resurvey areas.
The southern limits of adjoining area TE2a, should be extended south-Westwards to include the sandwaves present in the north of area TE2b
4. DESCRIPTION OF THE AREA
4.1 Area TE2B North Shipway is an area that covers part of the northern approach to Harwich Haven ports. It is bounded by Bawdsey Bank to the west and North Ship Head sandwave area to the east. N Shipwash buoy is to the north of the sandwave area in the east of the survey area.
4.2 The shoalest depth in TE2B is 2.8m in the sandwave area in the east of the survey area. The shoalest depth in the west of the area is 3.4m on Bawdsey Bank.
4.3 In the east of TE2B there is an area of symmetric sandwaves up to 5m amplitude, which are similar heights compared to the 2012 survey. The sandwaves are migrating in a north to north-easterly direction.
4.4 Area Covered: 3.2 NM2 (11 km2) as shown in Figure 1 below.
Year Survey Reference (Note) Data Year Survey Reference (Note) Data
1972 K6654 (East Side) s. 1987 M1083 H4027/86
(Whole Area)
s.t.
1972 K6655 (West Side) s. 1993 M2122/HI572 HH090/572/01 s.
1978 K8128 (East Side) s. 2012 HI1398 2012-117404
(Partial Coverage).
2012
1981 K8860 H1940/80
(Whole Area)
s.t 2016 HI1522 2016-181430 m
Assessment – TE2B/2016 © Crown Copyright
Page 3 of 10
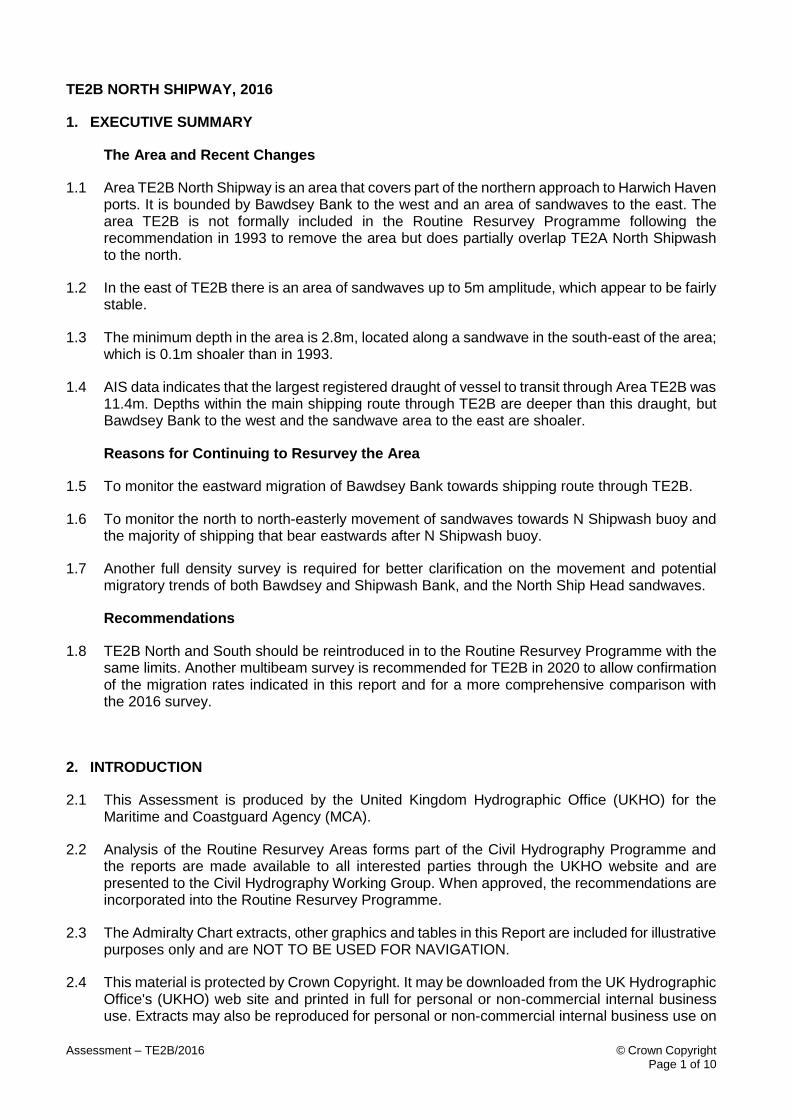
Figure 1 – 2016 survey data sun-illuminated view overlaid on BA Chart 2052
4.5 The geographic limits at the time of resurvey are shown in the Table 1 below and coordinates are in Decimal Degrees referenced to WGS84:
Table 1: HI1531 TE2B Survey Limits
4.6 Survey interval at time of resurvey: Not Applicable
4.7 Largest scale chart: BA2052 (Scale 1:50,000)
5. SHIPPING IN THE AREA
5.1 Shipping uses Shipway channel as an approach or departure to and from the Harwich Haven ports. Figure 2 shows that most departing ships and those with the deepest draught follow a
Point Latitude (N) Longitude (E)
01 52.00031 1.63013
02 52.00774 1.57058
03 52.02853 1.58700
04 52.02500 1.64674

Assessment – TE2B/2016 © Crown Copyright
Page 4 of 10
route bearing east towards Dutch and German ports immediately after passing north of N Shipwash buoy, although some continue in a northerly direction.
5.2 Shipping data from satellite AIS data for 2016 of vessels larger then 2000GT shows the maximum registered draught vessel to transit through the area was 11.4m.
Figure 2 – Indicative shipping routes overlaid on BA Chart 2052
6. REFERENCE SURVEY DETAIL
6.1 The historical survey that covers the area TE2B, which has been used as the reference to compile this assessment, was Hydrographic Instruction (HI) 572 which was gathered between the 14th and 28 July 1993.
6.2 The survey data was acquired using a single beam echosounder system and side scan sonar. The position system used during the survey was an Omni Trisponder 540. The survey is referred
Indicative shipping routes of vessels with <11.5m draught
Lower density traffic route
2016 Survey Area Limits

Assessment – TE2B/2016 © Crown Copyright
Page 5 of 10
to the OS(SN) 80 datum and subsequently transformed to WGS84 datum for databasing. The horizontal accuracy of the survey is ± 13m.
6.3 Depths were reduced to Chart Datum via observations at Walton on the Naze and adjusted by Co-tidal Chart values. The stored deliverable was a xyz surface with line spacing of 125m.
6.4 The bathymetric surface for HI572 is available to download from INSPIRE portal and MEDIN Bathymetry Data Archive Centre.
6.5 The data was validated by UKHO in 1993 as meeting 1SC in accordance with GIHS 0906.
6.6 Given the lower density of soundings available in the 1993 survey compared to the comparison survey it will be necessary to undertake linear interpolation between soundings. This reduced resolution will limit the detail in later sections of this report.
6.7 The historical survey gathered for the north-eastern part of TE2B, which has been used to compile this assessment, is Hydrographic Instruction (HI) 1398 which was gathered from the 6th to the 9th October 2012. This was surveyed as a part of the Routine Resurvey element of the Civil Hydrography Programme (CHP) for area TE2A, which has been used as the reference to compile this assessment, was. Sea states 1 (calm) – 2 (smooth) were generally experienced during the period, but increased to sea state 4 (moderate) towards the end of the survey.
6.8 The survey data was acquired using multibeam echosounder system. The primary reference position system used GNSS and was supplemented by a dynamic GNSS Precise Point measuring system. The survey is referred to the European Terrestrial Reference Frame 1989 (ETRF89) datum.
6.9 Observations from GNSS 3D positioning were combined with the UKHO Vertical Offshore Reference Frame (VORF) to reduce depths to Chart Datum. The final deliverable was a 1m resolution CUBE (Combined Uncertainty and Bathymetry Estimator) surface.
6.10 The survey was validated by UKHO and met IHO S44 (5th Edition) Order 1a standards.
6.11 The Report of Survey is available upon request from the UKHO and the validated bathymetric surfaces are available to download from INSPIRE portal and MEDIN Bathymetry Data Archive Centre.
7. COMPARISON SURVEY DETAIL
7.1 The latest survey undertaken as part of the Civil Hydrography Programme (CHP) Routine Resurvey was in 2016 under HI1531. The survey area was split in 2 parts TE2B North and TE2B South but no operations were conducted on TE2B South due to time constraints. Field surveying for TE2B North was undertaken between 31st October and 10th November. The time lost for weather was 51.9% of the operational time. Survey operations were suspended due to weather conditions on 5th, 6th, 7th and 9th November.
7.2 The survey data was acquired using a multibeam echosounder system. The primary reference position system used GNSS and was supplemented by a dynamic GNSS Precise Point measuring system. The survey is referred to the European Terrestrial Reference Frame 1989 (ETRF89) datum.
7.3 Observations from GNSS 3D positioning combined with the UKHO Vertical Offshore Reference Frame (VORF) to reduce depths to Chart Datum. The final deliverable was a 1m resolution CUBE (Combined Uncertainty and Bathymetry Estimator) surface.
7.4 The survey was validated by UKHO and met IHO S44 (5th Edition) Order 2 standards due to data density and gaps. However, the horizontal and vertical uncertainty of soundings was compliant with IHO Order 1A or above.

Assessment – TE2B/2016 © Crown Copyright
Page 6 of 10
7.5 The Report of Survey for these surveys is available upon request from the UKHO and the validated bathymetric surfaces are available to download from INSPIRE portal and MEDIN Bathymetry Data Archive Centre.
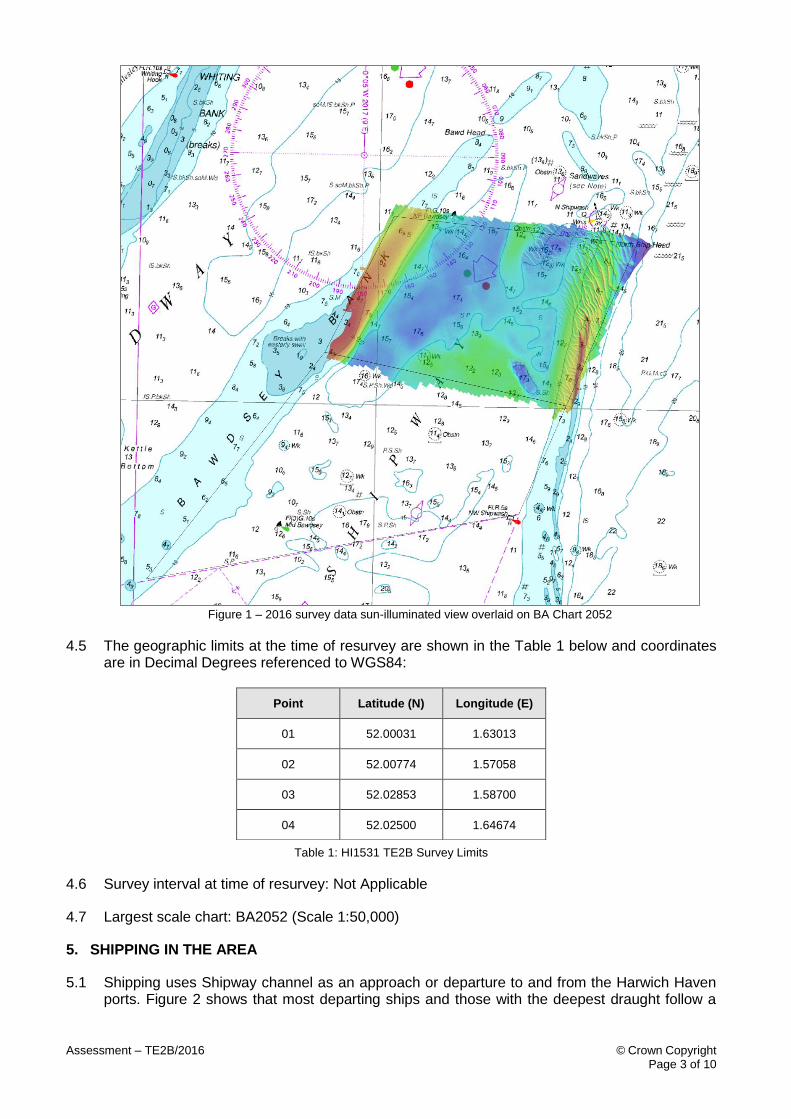
8. DESCRIPTION OF RECENT BATHYMETRIC CHANGE
8.1 The reference survey dated 1993 used a single beam echo sounder. For comparison against the 2016 survey it was necessary to create a surface using Triangular Irregular Network (TIN) to interpolate between the single beam echo sounder data points which increases the uncertainty in the apparent observations.
8.2 The Variability Plot in Figure 3 shows that between 1993 and 2016 the eastern edge of Bawdsey Bank has shoaled significantly, by up to 7m. In 2016 the shoalest depth over Bawdsey Bank within the TE2B area limits was 3.4m, compared to a shoalest depth of 4.1m in 1993.
8.3 The Profile A-B Comparison in Figure 4 shows that as well as shoaling, Bawdsey Bank has migrated eastwards between 1993 and 2016. For example, the 10-metre contour in this profile has migrated approximately 120m eastward within this timeframe.
8.4 In 2016 the controlling depth in TE2B was 2.8m along sandwaves in the south-east of the area, which is 0.1m shoaler than in 1993. Sandwave movement between 1993 and 2016 is inconclusive from Figure 3.
8.5 In the mid-northern part of TE2B, depths have shoaled by up 3.3m between 1993 and 2016.
Assessment – TE2B/2016 © Crown Copyright
Page 7 of 10
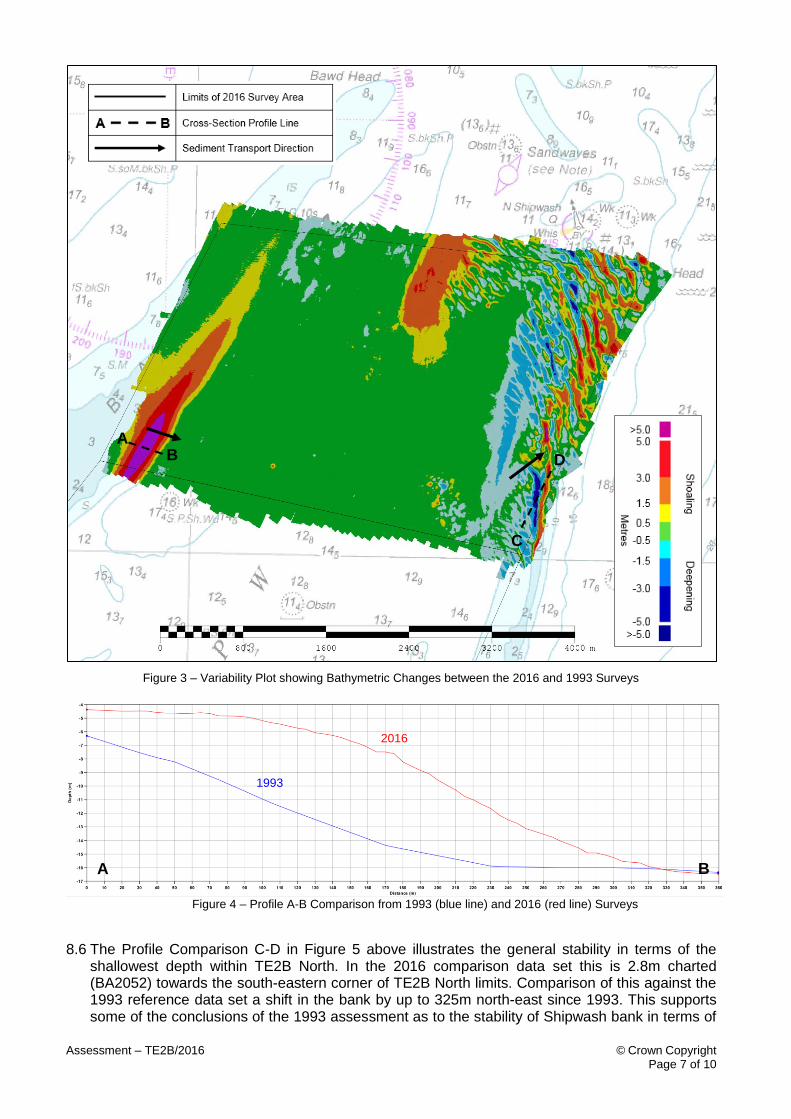
Figure 3 – Variability Plot showing Bathymetric Changes between the 2016 and 1993 Surveys
Figure 4 – Profile A-B Comparison from 1993 (blue line) and 2016 (red line) Surveys
8.6 The Profile Comparison C-D in Figure 5 above illustrates the general stability in terms of the shallowest depth within TE2B North. In the 2016 comparison data set this is 2.8m charted (BA2052) towards the south-eastern corner of TE2B North limits. Comparison of this against the 1993 reference data set a shift in the bank by up to 325m north-east since 1993. This supports some of the conclusions of the 1993 assessment as to the stability of Shipwash bank in terms of
A B
B A
1993
2016
C
D

Assessment – TE2B/2016 © Crown Copyright
Page 8 of 10
the depths however the slow migration of the bank at approximately 25m per year to north north-east was not commented on the historical report.
Figure 5 – Profile C-D Comparison from 1993 (blue line) and 2016 (red line) Surveys
8.7 The Variability Plot in Figure 6 and Profile E-F Comparison in Figure 7 shows that between 2012 and 2016 sandwaves in the north-eastern part of the survey area have migrated in a north to north-easterly towards N Shipwash buoy by up to approximately 50m.
C D
2016
1993

Assessment – TE2B/2016 © Crown Copyright
Page 9 of 10
Figure 6 – Variability Plot showing Bathymetric Changes between the 2012 and 2016 Surveys
Figure 7 – Profile E-F Comparison from 2012 (blue line) and 2016 (red line) Surveys
2016 2012
C
D
E F

Assessment – TE2B/2016 © Crown Copyright
Page 10 of 10
9. IMPLICATIONS FOR SHIPPING
9.1 Satellite AIS data indicates that the largest registered draught of vessel to transit through Area TE2B was 11.4m. Depths within the main shipping route through TE2B are deeper than this draught, however Bawdsey Bank to the west and the sandwave area to the east are shoaler.
9.2 After transiting through Area TE2B most vessel traffic bears east after passing N Shipwash buoy. The movement of sandwaves in a north to north-easterly direction towards N Shipwash buoy is therefore a concern to shipping because in the future the sandwaves may encroach into the shipping route.
9.3 The charted 10m contour marking the eastern edge of Bawdsey Bank is approximately 1000m
from shipping transiting TE2B according to the 2016 AIS data available. The shoaling and eastward migration of the bank is a concern to shipping using this route.
10. RECOMMENDATIONS FOR FUTURE SURVEYS
10.1 The slow migration indicated since 1993 of: Bawdsey Bank by less than 10m east per year in to the route used by shipping; and of Shipwash by 25m north north-east in to TE2A, would suggest that the area needs to be included in the Routine Resurvey Programme.
10.2 To confirm the migration rates of the banks and sandwaves and their associated impact on TE2A, the next survey for TE2B (North and South) should be scheduled for 2020 (same year as TE2A).
10.3 Given the ongoing stability in terms of the controlling depth within the northern part of TE2B it is envisaged that following the 2020 that TE2B will have a resurvey interval of 12 years.
10.4 The limits of TE2B North and South should be unchanged.
The coordinates of the survey area limits for TE2B are shown below.
TE2B total area: 7.29 NM2 (25 km2)
Area TE2B North
A 52.02850N 1.58700E B 52.02500N 1.64675E C 52.00030N 1.63013E D 52.00770N 1.57058E
Area TE2B South
A 52.00770N 1.57058E B 52.00030N 1.63013E C 51.98380N 1.61902E D 51.97280N 1.52789E