Embed Size (px)
Citation preview

Thai Film Industries Plc.Thai Film Industries Plc.

2
TOPICS OF TODAYTOPICS OF TODAY
World BOPP Demand VS. Supply
History of Pricing
TFI Expansion Plan
Q & A
3
BOPP DEMAND VS. SUPPLYBOPP DEMAND VS. SUPPLY
4
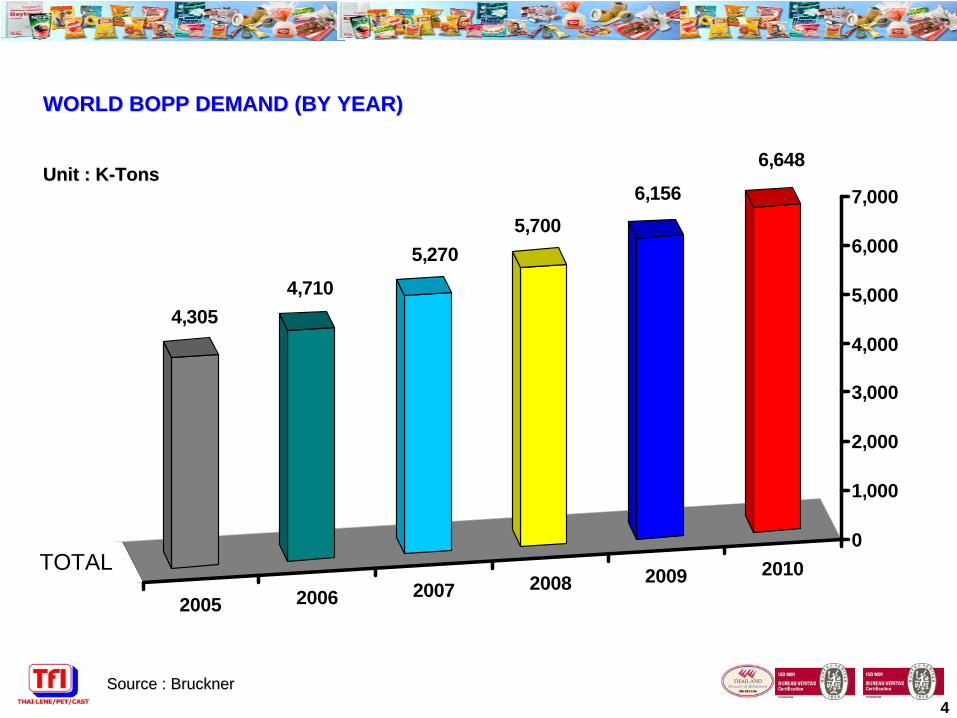
WORLD BOPP DEMAND (BY YEAR)WORLD BOPP DEMAND (BY YEAR)
Source : BrucknerSource : Bruckner
Unit : KUnit : K--TonsTons
2005 2006 2007 2008 2009 2010TOTAL
6,648
6,1565,700
5,270
4,7104,305
0
1,000
2,000
3,000
4,000
5,000
6,000
7,000
5
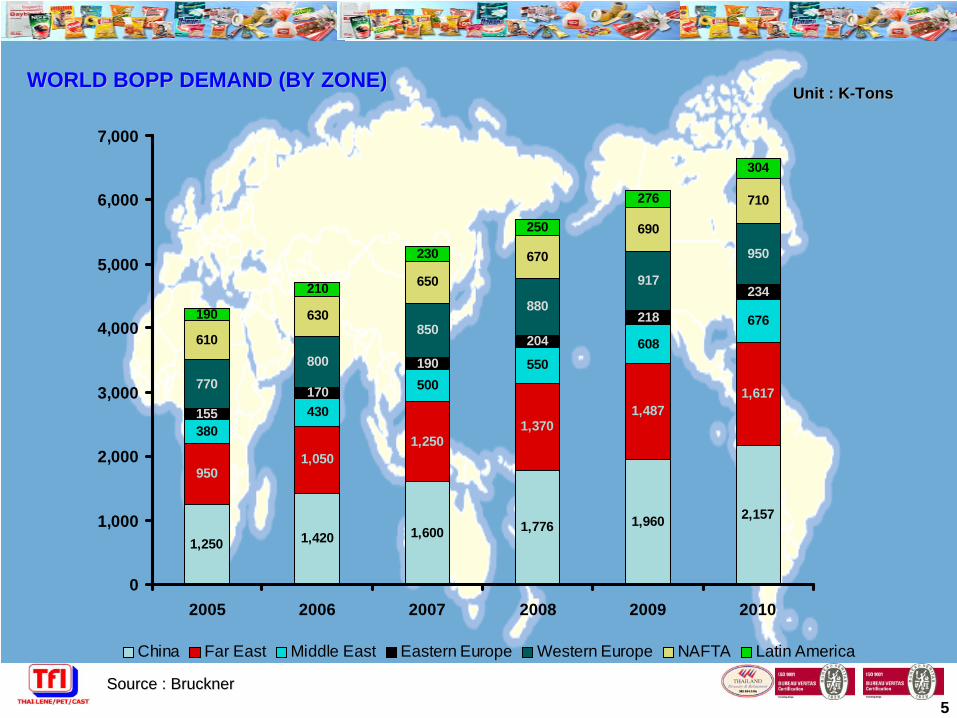
WORLD BOPP DEMAND (BY ZONE)WORLD BOPP DEMAND (BY ZONE)
Source : BrucknerSource : Bruckner
Unit : KUnit : K--TonsTons
1,250 1,420 1,600 1,776 1,960 2,157
9501,050
1,2501,370
1,4871,617
380430
500550
608
676
170
190204
218
234
770800
850
880
917
950
610
630
650
670
690
710
210
230
250
276
304
155
190
0
1,000
2,000
3,000
4,000
5,000
6,000
7,000
2005 2006 2007 2008 2009 2010
China Far East Middle East Eastern Europe Western Europe NAFTA Latin America
6
GROWTH (BY ZONE)GROWTH (BY ZONE)
Source : BrucknerSource : Bruckner
3%3%
3% 3%
10%10%11%13%14%
9%9%10%19%11%
11%11%10%16%
13%
7%7%7%
12%10%
4%4%4%
6%4%
3%
11% 10% 9% 10% 10%
0%
10%
20%
30%
40%
50%
60%
70%
80%
90%
100%
2006 2007 2008 2009 2010
China Far East Middle East Eastern Europe Western Europe NAFTA Latin America
7
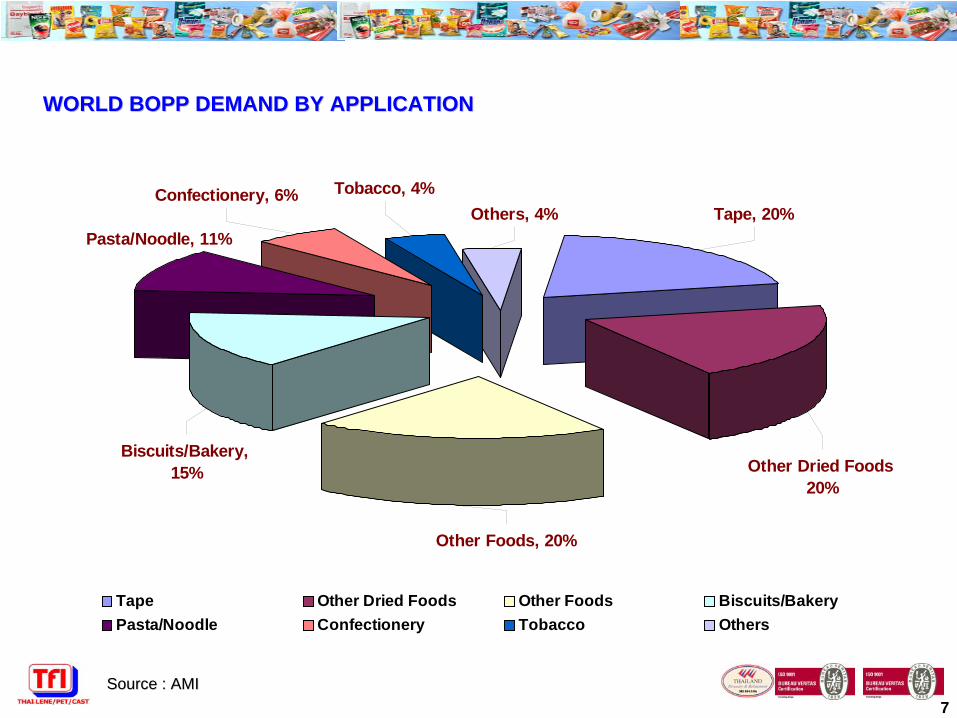
WORLD BOPP DEMAND BY APPLICATIONWORLD BOPP DEMAND BY APPLICATION
Source : AMISource : AMI
Pasta/Noodle, 11%
Other Dried Foods 20%
Other Foods, 20%
Biscuits/Bakery, 15%
Tape, 20%Others, 4%Confectionery, 6% Tobacco, 4%
Tape Other Dried Foods Other Foods Biscuits/BakeryPasta/Noodle Confectionery Tobacco Others

8
WORLD BOPP DEMAND VS. SUPPLYWORLD BOPP DEMAND VS. SUPPLY
* Global capacity used at 85% utilization** Capacity in year 2010, not include new machines which not ordered.- Growth at 8% per years (= 456,000 tons in year 09 and 492,000 tons in 2010)
Unit : KUnit : K--TonsTons
Source : BrucknerSource : Bruckner
5,000
5,722
6,046
5,700
6,156
6,648
(434)
(700)
(602)
-2,000 0 2,000 4,000 6,000 8,000
Yr 08
Yr 09
Yr 10
Global Capacity* Demand Balance
9
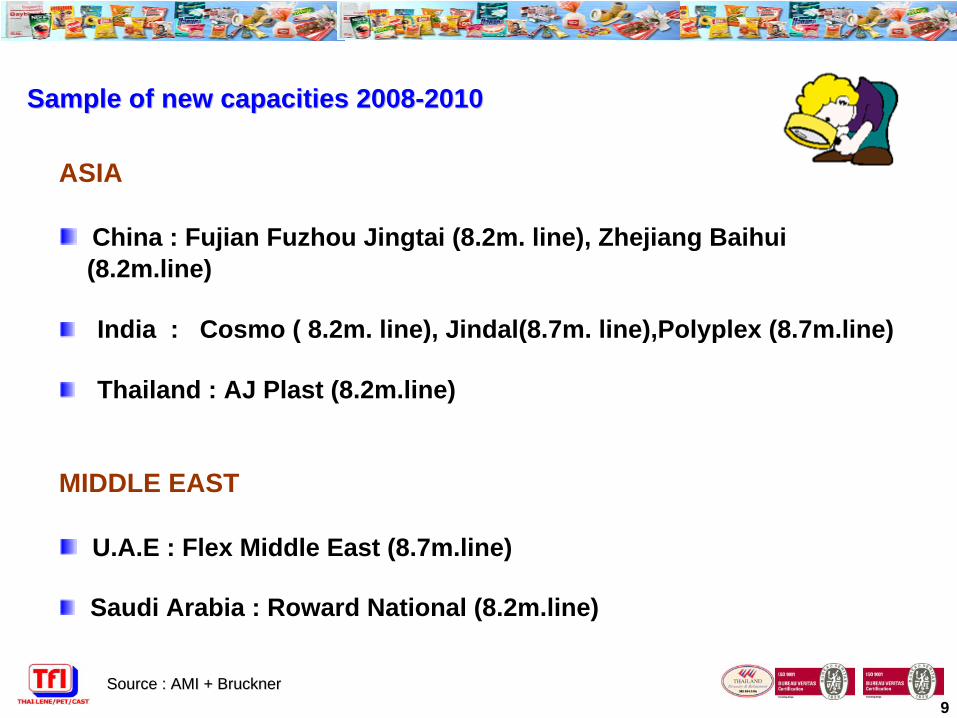
Sample of new capacities 2008Sample of new capacities 2008--20102010
ASIA
China : Fujian Fuzhou Jingtai (8.2m. line), Zhejiang Baihui (8.2m.line)
India : Cosmo ( 8.2m. line), Jindal(8.7m. line),Polyplex (8.7m.line)
Thailand : AJ Plast (8.2m.line)
MIDDLE EAST
U.A.E : Flex Middle East (8.7m.line)
Saudi Arabia : Roward National (8.2m.line)
Source : AMI + BrucknerSource : AMI + Bruckner
10
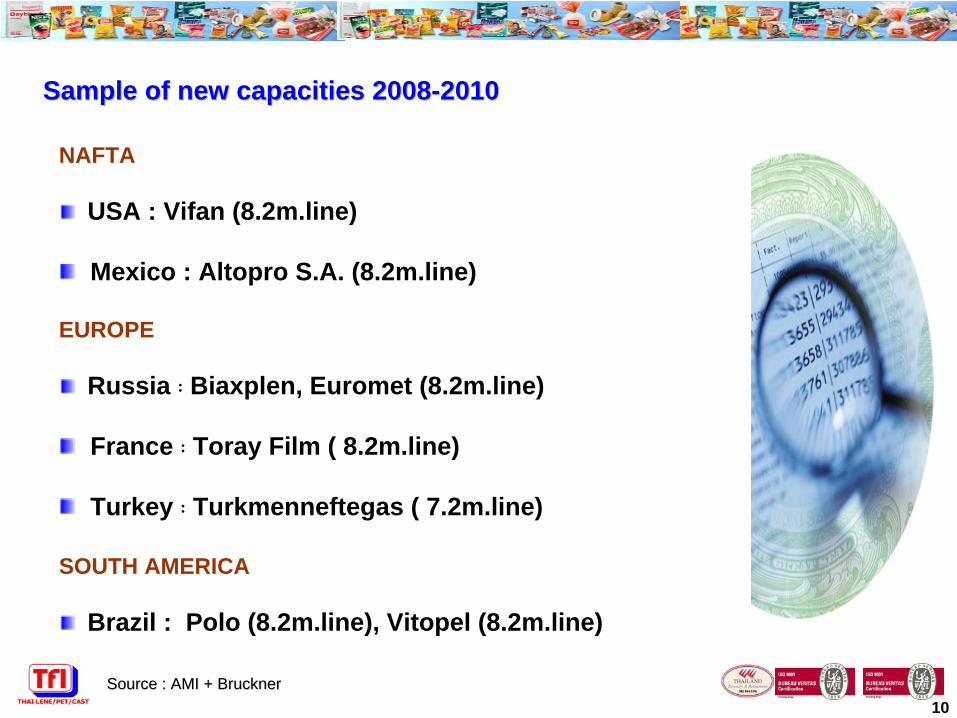
NAFTA
USA : Vifan (8.2m.line)
Mexico : Altopro S.A. (8.2m.line)
EUROPE
Russia :
Biaxplen, Euromet (8.2m.line)
France :
Toray Film ( 8.2m.line)
Turkey :
Turkmenneftegas ( 7.2m.line)
SOUTH AMERICA
Brazil : Polo (8.2m.line), Vitopel (8.2m.line)
Source : AMI + BrucknerSource : AMI + Bruckner
Sample of new capacities 2008Sample of new capacities 2008--20102010
11
There were some BOPP plants were shut down during last few years
Asia
- Indonesia Diaz, PT Poly Darya, and Tri Polita
- China close 12 factories with capacity approximate 300,000 tons/year
Europe
- Rhone Poulenc Films in France
- Moplefan in Italy.
- Hoechst in Germany
- Shorko and ICI in U.K.
Australia
- ICI

12
Some were merged and acquired…
- Hoechst (Germany) was merged by Treophan.
- Shorko (U.K) and Radici (Italy) were taken over by Taghleef (Dubai film group).
- Manuli (Italy) now inviting new investors.
Bulgaria
- Famtex was merged by Plastchim (supplier of PE films, PP and injection molds)
Source : AMI + Plastic MagazineSource : AMI + Plastic Magazine

13
Growth of BOPP comes from…
1. Increasing of world population
2. Growing of economy in China, India, Russia, Brazil and etc.
3. Substitution to other plastic films i.e. PE film, LDPE film, Cellophane film, PVC film and paper. In term of yield and price per sq.meter, BOPP film is better alternative.
4. Increasing of consumption per capita in developing countries due to higher standard of living required such as in China, Indochina, India, South America and etc.
5. Higher demand of consumer on sanitation and environmentally friendly issues.
Source : AMI + TFISource : AMI + TFI

14
HISTORY OF PRICINGHISTORY OF PRICING

15
1998 1998 -- 2007 Historical Price BOPP Plain Film (Export Market)2007 Historical Price BOPP Plain Film (Export Market)
Unit : US$/TonsUnit : US$/Tons
0200400600800
10001200140016001800200022002400260028003000320034003600
BOPP Film 2000 1400 1200 2000 2500 1800 1300 1000 1100 1150 1200 1250 1250 1300 1500 1650 2200 2450 3000 3200 3400
1991 1992 1993 1994 1995 1996 1997 1998 1999 2000 2001 2002 2003 2004 2005 2006 2007*1ST HALF 2008
**2ND HALF 2008
2009 F
2010 F
Down Trend Up Trend Down Trend Up Trend Down Trend Up Trend
16
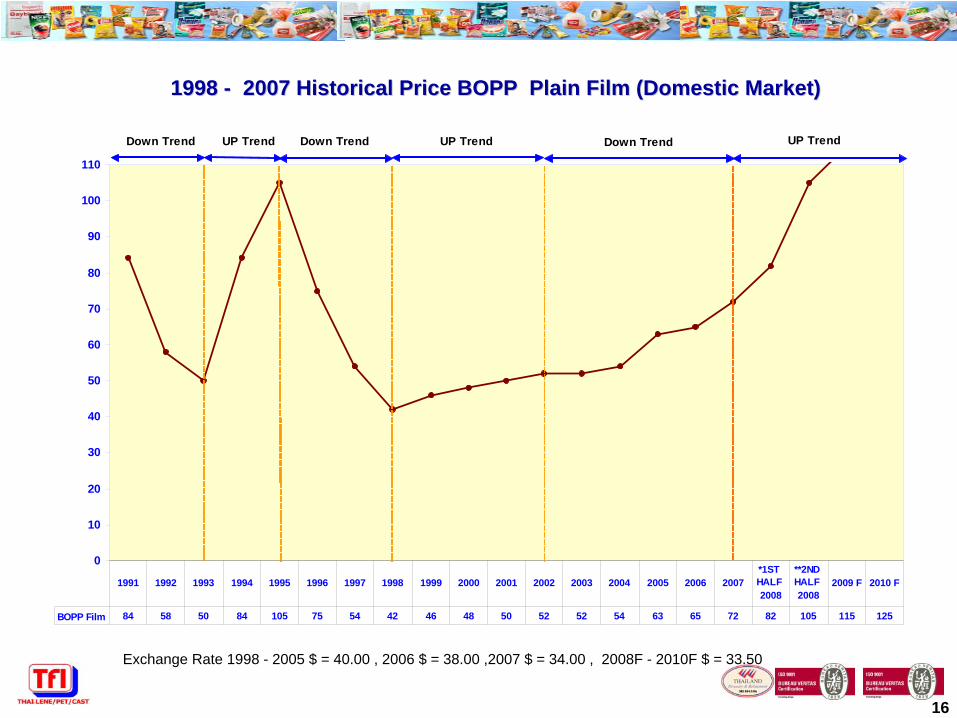
1998 1998 -- 2007 Historical Price BOPP Plain Film (Domestic Market)2007 Historical Price BOPP Plain Film (Domestic Market)
Exchange Rate 1998 - 2005 $ = 40.00 , 2006 $ = 38.00 ,2007 $ = 34.00 , 2008F - 2010F $ = 33.50
0
10
20
30
40
50
60
70
80
90
100
110
BOPP Film 84 58 50 84 105 75 54 42 46 48 50 52 52 54 63 65 72 82 105 115 125
1991 1992 1993 1994 1995 1996 1997 1998 1999 2000 2001 2002 2003 2004 2005 2006 2007*1ST HALF 2008
**2ND HALF 2008
2009 F 2010 F
Down TrendDown Trend Down TrendUP Trend UP Trend UP Trend

17
TFI EXPANSION PLANTFI EXPANSION PLAN

18
TFI Expansion Plan 2008TFI Expansion Plan 2008--20102010Unit : Tons/YearUnit : Tons/Year
115,000115,000 115,000100,000
3,5003,500 3,500
23,50017,000
3,5003,500 3,500
7,000
7,0007,000 7,000
5,000
107,000
160,500
122,000 122,000
0
20,000
40,000
60,000
80,000
100,000
120,000
140,000
160,000
180,000
2007 2008 2009 2010
BOPP PET CPP METALLISED BOPA Total

19
With LoveWith Love Thank you for your attentionThank you for your attention
Wanlop KunanukornkulWanlop Kunanukornkul
Thai Film Industries Public Co,,Ltd.Thai Film Industries Public Co,,Ltd.


![[English.01] KPIC BOPP Film Grade CatalogEnglish.01] KPIC BOPP Film Grade...• Bruckner Line : 25㎛BOPP film. • Above data are typical laboratory averages. They are intended to](https://img.dokumen.tips/doc/110x75/5c70159d09d3f20d2f8b6797/english01-kpic-bopp-film-grade-english01-kpic-bopp-film-grade-bruckner.jpg)