Embed Size (px)
Citation preview

See discussions, stats, and author profiles for this publication at: https://www.researchgate.net/publication/303671336
The MENA Super Grid towards 100% Renewable Energy Power Supply by 2030
Conference Paper · May 2016
CITATIONS
18
READS
2,080
3 authors:
Some of the authors of this publication are also working on these related projects:
Energy security View project
Sustainable bioenergy solution for tomorrow View project
Arman Aghahosseini
Lappeenranta University of Technology
158 PUBLICATIONS 154 CITATIONS
SEE PROFILE
Dmitrii Bogdanov
Lappeenranta University of Technology
265 PUBLICATIONS 634 CITATIONS
SEE PROFILE
Christian Breyer
Lappeenranta University of Technology
610 PUBLICATIONS 2,327 CITATIONS
SEE PROFILE
All content following this page was uploaded by Christian Breyer on 30 May 2016.
The user has requested enhancement of the downloaded file.

preprint to be published in the proceedings of the 11th International Energy Conference, May 30-31, Tehran, Iran
The MENA Super Grid towards 100% Renewable Energy Power Supply by 2030
Arman Aghahosseini, Dmitrii Bogdanov and Christian Breyer
Lappeenranta University of Technology, Skinnarilankatu 34, 53850 Lappeenranta,
Finland
E-mail: [email protected], [email protected]
Abstract
The Middle East and North Africa (MENA) region, comprised of 19 countries, is
currently facing a serious challenge to supply their growing economies with secure,
affordable and clean electricity. The MENA region holds a high share of proven crude
oil and natural gas reserves in the world. Further, it is predicted to have increasing
population growth, energy demand, urbanization and industrialization, each of which
necessitates a comparable expansion of infrastructure, resulting in further increased
energy demand. When planning this expansion, the effects of climate change, land
use change and desertification must be taken into account. The MENA region has
an excellent potential of renewable energy (RE) resources, particularly solar PV and
wind energy, which can evolve to be the main future energy sources in this area. In
addition, the costs of RE are expected to decrease relative to conventional energy
sources, making a transition to RE across the region economically feasible. The
main objective of this paper is to assume a 100% RE-based system for the MENA
region in 2030 and to evaluate its results from different perspectives. Three
scenarios have been evaluated according to different high voltage direct current
(HVDC) transmission grid development levels, including a region-wide, area-wide
and integrated scenario. The levelized cost of electricity (LCOE) is found to be 61
€/MWhel in a decentralized scenario. However, it is observed that this amount
decreases to 55 €/MWhel in a more centralized HVDC grid connected scenario. In
the integrated scenario, which consists of industrial gas production and reverse
osmosis water desalination demand, integration of new sectors provides the system
with required flexibility and increases the efficiency of the usage of storage
technologies. Therefore, the LCOE declines to 37 €/MWhel and the total electricity
generation is decreased by 6% in the system compared to the non-integrated
sectors. The results clearly show that a 100% RE-based system is feasible and a
real policy option.
Keywords: 100% renewable energy, MENA, energy system model, integrated
scenario, solar PV, wind energy, energy storage, power-to-gas, battery, economics.

preprint to be published in the proceedings of the 11th International Energy Conference, May 30-31, Tehran, Iran
Nomenclature A-CAES Adiabatic compressed air energy storage AC Alternating current Capex Capital Expenditure CCGT Combined cycle gas turbine CSP Concentrating solar thermal power FLH Full load hours HVDC High Voltage Direct Current MENA Middle East and North Africa OCGT Open cycle gas turbine Opex Operating Expenditure PHS Pumped hydro storage PtG Power-to-gas RE Renewable Energy RES Renewable Energy Sources SNG Synthetic natural gas SWRO Seawater reverse osmosis TES Thermal energy storage TPES Total Primary Energy Supply WACC Weighted average cost of capital
1. Introduction
Total Primary Energy Supply (TPES) of the Middle East and North Africa (MENA)
region reached around 10,290 TWhth in 2013 [1], which was an increase of 10%
compared to 2010 [2]. In 2013, electricity consumption reached about 1161 TWh in
the region, a 16% increase in comparison to the year 2010 with 1000 TWh. The
electricity sector is the single largest source of CO2 emissions in the region,
accounting for 42% of total carbon emissions in 2011 [3]. Most of the MENA
countries have experienced a tremendous rise in energy consumption over the last
three decades. Increased energy demand in the region is largely due to population
growth, socio-economic development and urbanization in recent decades, driven
both by oil and gas revenues, and by growth-oriented policies [4]. On top of that,
energy costs are extremely subsidized in the MENA region. In other words, most of
the countries have the highest rate of energy subsidies in the world and it can to
somehow explain the high electricity demand and CO2 emissions per capita
prevalent in the region [5].
With holding the highest share of proven crude oil reserves and to a lesser extent
natural gas reserves, the MENA region constitutes a main group of oil and gas
producers globally [6]-[8]. As a matter of fact, the substantial link between fossil fuels
and the socio-economic development make the region highly vulnerable to the
impacts of climate change. As global temperature continues to rise, it will have a
devastating effects on the region, such as increasing the temperature above average
and decreasing precipitation. This would mean a rise in demand for water
desalination and air conditioning, in a region that is one of the most water-stressed

preprint to be published in the proceedings of the 11th International Energy Conference, May 30-31, Tehran, Iran
in the world [9],[10]. Recent results even indicate that survival of humans in the
outdoors may not be possible anymore in a growing fraction of the Middle East
during the 21st century [11].
Nowadays, renewable energy (RE) sources have a small share in the MENA region’s
TPES [1]. The main primary energy in Iran, Qatar, Oman and the UAE is natural gas,
which covers most of their needs. In Iraq, Bahrain, Kuwait and Libya, oil remains the
primary energy source, where natural gas is either not well developed or available.
Saudi Arabia is one of the largest consumers of total primary energy per capita in
the world with 60% of this consumption being oil-based, and natural gas accounting
for the rest [12].
The MENA region depends on natural gas and oil to generate most of its electricity
and it is anticipated to continue that reliance through to 2030 [7]. According to the
International Energy Agency (IEA) [13], natural gas accounted for 93% of power
generation in Algeria in 2013. About 70% of Egypt's electricity is produced by natural
gas, with the remainder being fueled by oil and RE (mostly hydroelectricity) [14]. In
2013, 98% of electricity generation in Tunisia was produced by fossil fuels, with
hydroelectric and wind sources supplying only 2% of total generation [15]. The
electricity sector in Oman heavily relies on the country's domestic natural gas
resources to fuel electricity generation [16]. In 2010, 94% of electricity generation in
Syria came from conventional thermal power plants, with the remaining 6% coming
from hydroelectric power plants [17]. In 2013, 11.5% of electricity generation came
from renewable sources (mainly hydroelectricity) in Morocco, although 38% was
based on coal, 18% on natural gas and 14% on oil [18]. Saudi Arabia, Iran, Egypt
and the UAE account for nearly 63% of the regional demand for electricity, and
demand has increased dramatically over the past decade in each of the countries.
However, decreasing costs of modern RE technologies, increasing costs of fossil
fuels and RE policies [19] have led to a rise in the share of technologies such as
wind and solar in the region. Undoubtedly, solar and wind offer the highest potential
among all the renewable sources. The RE targets set by countries [19] and the
number of projects in the pipeline reveal that substantial RE deployment is well
underway in the MENA region and it is expected to continue for the next couple of
decades [2],[3].
Today, hydropower is the primary RE source for power generation in the region. Iran
is the main leader in the case of hydropower generation in the MENA region with 9.5
GW, followed by Egypt with 2.8 GW of installed capacity [2]. However, the outlook
for further hydropower advancement is not as bright as other RE technologies, given
its relatively restricted further resources to exploit in the region.

preprint to be published in the proceedings of the 11th International Energy Conference, May 30-31, Tehran, Iran
Beyond hydro, wind energy is the most common RE source to generate power in the
region, especially in Egypt, Morocco, Tunisia and Saudi Arabia. By the end of 2014,
total installed capacity of wind power accounted for around 1.7 GW in the region
[20]. Wind power increased significantly between 2010 and 2014, with a more than
twofold growth in total installed capacity, from 0.7 GW in the early 2010 to 1.7 GW
at the end of 2014 [20]. Tunisia has developed power generation from wind over the
last few years, with wind power capacity rising more than fourfold from 2008 to 2013,
from 54 MW in 2008 to 242 MW in 2013 [2],[20],[21],[22].
The MENA region has the greatest potential for solar power generation across the
world, and accounts for 45% of the total energy potential from all renewable sources
globally [23],[24]. By achieving this potential, this region could cover all the total
current and future energy demands in the world alone. In addition, PV electricity can
partly or fully reduce costly dependence on fossil fuels and act as fuel and cost
saving energy options [25],[26]. Solar PV will experience a sharp rise due to
continuously declining technology costs and removal of barriers in the MENA region.
From 2008 to 2013, the average annual growth rate of solar PV generation was more
than 100% in the region [27],[28]. The MENA countries have set ambitious targets
for increasing the share of solar PV installations [2]. For instance, Morocco plans to
achieve 2 GW solar (PV and CSP) installations by 2020 and Algeria set a target of
831 MW of PV by 2020 and 2.8 GW by 2030 [27].
In the MENA region, Algeria, Iran, Egypt, and the UAE all recently announced plans
to build concentrating solar thermal power (CSP) plants paired with natural gas. In
2010, Iran and Morocco started to operate the first CSP plants in the MENA region.
The year after the first construction of CSP plants in this region, Algeria and Egypt
started to operate their first CSP plants. In 2013, the UAE joined the market and it is
projected that the UAE will have the world’s largest CSP plant with an install capacity
of 100 MW. However, the economic value add of CSP for the region remains
questionable, since solar PV is lower in LCOE [29] and the thermal energy storage
of CSP plants generates no further value until a RE penetration of about 50% [30],
which is far in the future for all countries in the region. Even worse, there are
indications, that hybrid PV-battery-gas turbine plants are lower in cost [31],[32].
Whereas other forms of RE may be promising, most MENA countries do not have
enough natural resources to make them viable. Israel, Jordan, Qatar, and the UAE
are the only countries currently producing electricity from modern biomass, with the
UAE and Saudi Arabia planning large-scale waste-to-energy projects. The use of
biomass can create competition for agricultural lands, potentially interfering with food
production. Land-use changes can also have a negative impact on the local
environment or even produce more carbon than is saved by the green energy

preprint to be published in the proceedings of the 11th International Energy Conference, May 30-31, Tehran, Iran
produced. The large amount of water necessary to grow energy crops is another
concern, especially in the water-constrained MENA region.
The MENA region has a great potential of RES and it can be maximized by providing
an infrastructure for interconnection of the regions’ electricity grid. Only a few studies
have been carried out for an electricity grid interconnected system for the region that
address a high share of RE-based electricity. These studies mostly discussed that
solar energy could be used to meet increasing power demand and to power
desalination plants to provide freshwater in the MENA region, and further to provide
zero-carbon energy to Europe [33]-[37]. The EU-MENA Desertec vision, which has
been studied in much detail by DESERTEC Foundation [38] and Dii [33], is a good
example of this, and has pointed out that Europe should source some of its electricity
from the MENA region with its excellent solar and wind sources. A transmission base
map for this power grid interconnection is shown in Figure 1.
Figure 1: Schematic transmission grid 2050 for electricity system optimization [33].
This study aims at designing an optimal and cost competitive 100% RE power
system for the MENA region considering a potential evolution of the generation mix
that takes into account:

preprint to be published in the proceedings of the 11th International Energy Conference, May 30-31, Tehran, Iran
- the actual electricity trade and transmission infrastructure of different sub-
regions of the MENA region;
- an optimal system design and wise utilization of considered available RE
resources;
- synergy between various resources and different regions that increase the
efficiency of the power sector.
2. Methodology
An hourly resolved model has been developed based on linear optimization of
energy system parameters under given constraints with a bright perspective of RE
power generation and demand. The main features of the model are its flexibility and
expandability. The model is composed of several power generation and storage
technologies, respective installed capacities and different operation modes of these
technologies, which are used to supply the electricity demand of power, water
desalination and synthetic natural gas (SNG) generation sectors [39],[40]. The
energy system model can be separated into market and regulatory models.
Regulatory models only take the long-term energy system structure into account and
short-term market mechanisms are not considered. This model has already been
applied to several regions up to now [39]-[43], and a detailed description can be
found in those studies. Further technical and financial assumptions can be found in
the Supplementary Material in the appendix of this paper.
2.1. Model summary
A multi-node approach enables definition of a grid configuration in scenario
assumptions for power transmission interconnections among the sub-regions. The
main constraint for the optimization is the matching of the power generation and
demand for every hour of the applied year. The computation time takes longer when
the hourly resolution is used in the model. Nevertheless, it guarantees that for every
hour of the year that the total generation of a sub-region and electricity import cover
the local electricity demand from all considered sectors and enables a precise
system description including synergy effects of different system components for the
system balance. The main target of the system optimization is the minimization of
the total annual energy system cost, calculated as the sum of the annual costs of
installed capacities of the different technologies, costs of energy generation and
generation ramping. The system also includes distributed generation and self-
consumption of residential, commercial and industrial electricity consumers
(prosumers) by installing respective capacities of rooftop PV systems and batteries.
For these prosumers the target function is minimal cost of consumed energy
calculated as the sum of self-generation, annual cost and cost of electricity

preprint to be published in the proceedings of the 11th International Energy Conference, May 30-31, Tehran, Iran
consumed from the grid, minus benefits from the selling of excess energy. The model
flow diagram that contains all the considered input data, system models and model
output data is presented in Figure 2.
Figure 2: Model flow diagram that is considered in this paper.
2.2. Input data
The model uses several types of input data and constraints which are listed below:
- historical weather data for direct and diffuse solar irradiation, wind speed and
precipitation amounts;
- synthetic load data for every sub-region based on the available hourly load
data at a national level. In addition, local data of each sub-region is also taken
into consideration, such as population, temperature, gross domestic product
and power plant structure;
- synthetic geothermal energy potential;
- non-energy natural gas consumption sector for every sub-region;
- projected water desalination demand for every sub-region;

preprint to be published in the proceedings of the 11th International Energy Conference, May 30-31, Tehran, Iran
- technical characteristics of energy generation, storage and transmission
technologies, such as power yield, energy conversion efficiency, power
losses in transmission lines and storage round trip efficiency;
- technical characteristics of seawater reverse osmosis (SWRO) desalination;
- capital expenditures, operational expenditures and ramping costs for all
technologies;
- electricity costs for residential, commercial and industrial consumers,
- limits for minimum and maximum installed capacity for all energy
technologies,
- configuration of regions and interconnections.
The datasets for wind speed, solar irradiation components and precipitation are
collected from NASA databases [44],[45] and partly reprocessed by the German
Aerospace Center [46]. The spatial resolution of the data is 0.45˚ × 0.45˚. The time
resolution is hourly for wind speed and solar irradiation, and monthly for precipitation.
IEA data [47] are used to estimate natural gas consumption in the industrial sector
for the year 2030 (gas demand for electricity generation, residential and
transportation sectors are not considered in this study). Water demand is calculated
based on water consumption projections and future water stress [48]. It is assumed
that water stress greater than 50% shall be covered by seawater desalination. Water
transportation costs are also taken into account, which is described in Caldera et al.
[49]. Annual industrial gas demand and water demand are presented in the
Supplementary Material (Table 11).
Geothermal data are evaluated based on existing information on the surface heat
flow rate [50],[51] and surface ambient temperature for the year 2005 globally. For
areas where surface heat flow data are not available, the extrapolation of existing
heat flow data was performed. Based on that, temperature levels and available heat
of the middle depth point of each 1 km thick layer, between depths of 1 km and 10
km [52],[53],[54] globally with 0.45˚ × 0.45˚ spatial resolution, are derived. The
calculated geothermal potentials are presented in the Supplementary Material
(Table 6).
The potentials for biomass and waste resources are taken from German Biomass
Research Center [55] and for Lebanon are taken from the UNDP [56]. All biowaste
is divided into three different components: solid waste, solid biomass and biogas.
Solid wastes consists of municipal and industrial used wood; solid biomass includes
straw, wood and coconut residues; biogas is comprised of excrement, municipal
biowaste and bagasse. The costs for biomass are calculated using data from [57]
and [58]. For solid fuels a 50 €/ton gate fee for the waste incineration is assumed.

preprint to be published in the proceedings of the 11th International Energy Conference, May 30-31, Tehran, Iran
The results for regional biomass potentials and costs are provided in the
Supplementary Material (Table 6 and 7, respectively).
All the input data can be found in the Supplementary Material, in the appendix of this
paper.
2.3. Applied technologies
Four types of technologies are applied in the MENA energy system optimization,
which consist of conversion of RE resources into electricity, energy storage, energy
sector bridging and electricity transmission. The full model block diagram is shown
in Figure 3.
The technologies for converting RE resources into electricity that are used in this
model are solar PV (distributed rooftop systems, ground-mounted and single-axis
tracking plants), concentrating solar thermal power (CSP), onshore wind turbines,
biomass plants (solid biomass and biogas), waste-to-energy power plants,
hydropower (run-of-river and dam) and geothermal energy.
In addition to the mentioned energy sources, the energy storage technologies used
in this model are batteries, pumped hydro storage (PHS), thermal energy storage
(TES), adiabatic compressed air energy storage (A-CAES) and power-to-gas (PtG)
technology. PtG includes synthetic natural gas (SNG) synthesis technologies: water
electrolysis, methanation, CO2 scrubbing from air, gas storage, and both combined
and open cycle gas turbines (CCGT, OCGT). SNG synthesis process technologies
have to be operated in synchronization because of hydrogen and CO2 storage
absence. Additionally, there is a 48-hour biogas buffer storage and a part of the
biogas can be upgraded to biomethane and injected into the gas storage.
The energy sector bridging technologies provide more flexibility to the entire energy
system, thus reducing the overall cost. One bridging technology available in the
model is PtG technology for the case that the produced gas is consumed in the
industrial sector and not as a storage option for the electricity sector. The second
bridging technology is SWRO desalination, which couples the water sector to the
electricity sector.
The electricity transmission technologies are represented on two levels: power
distribution and transmission within the sub-regions are assumed to be based on
standard alternating current (AC) grids which are not part of the model and inter-
regional transmission grids modeled by applying high voltage direct current (HVDC)
technology. Power losses in the HVDC grids consist of two major components:

preprint to be published in the proceedings of the 11th International Energy Conference, May 30-31, Tehran, Iran
length dependent electricity losses of the power lines and losses in the converter
stations at the interconnection with the AC grid.
An energy system mainly based on RE and in particular intermittent solar PV and
wind energy requires different types of flexibility for an overall balanced and cost
optimized energy mix. The four major categories are generation management (e.g.
hydro dams or biomass plants), demand side management (e.g. PtG, SWRO
desalination), storage of energy at one location and energy shifted in time (e.g.
batteries), and transmission grids connecting different locations and energy shifted
in location (e.g. HVDC transmission).
Figure 3: Block diagram of the energy system model for the MENA region.
3. Scenario assumptions
3.1. Regions subdivision and grid structure
For the sake of comparison, the 19 MENA countries were clustered into 17 sub-
regions, including Algeria, Egypt, Libya, Morocco, Tunisia, Bahrain & Qatar1, Iran,
1 Bahrain and Qatar are considered as one sub-region. From hereafter they will be called Bahrain & Qatar for the region-wide and area-wide scenarios.

preprint to be published in the proceedings of the 11th International Energy Conference, May 30-31, Tehran, Iran
Iraq, Israel, Jordan & Palestine2, Kuwait, Lebanon, Oman, Saudi Arabia, Syria,
United Arab Emirates and Yemen in the region-wide and the area-wide scenarios.
Bahrain & Qatar, and Jordan & Palestine are merged according to their territory,
population and demand. However, due to additional electricity demand for water
desalination and industrial gas, the countries are categorized into 11 sub-regions in
the integrated scenario to get more benefits of the final energy system. The more
collaboration countries have, the more cost-effective energy systems they will
achieve. The categorization is as follows: Algeria, Egypt, Morocco, Tunisia & Libya3,
Iran, Iraq & Kuwait, Israel, Saudi Arabia, Syria & Jordan & Lebanon, UAE & Bahrain
& Qatar and Yemen & Oman. The subdivision and grid configuration of the MENA
region are presented in Figure 4.
Figure 4: The MENA sub-regions and interconnection between the countries for the
region-wide and the country-wide scenarios (top) and for the integrated scenario (bottom).
The yellow dots represent the consumption center of the countries and red lines show the
HVDC transmission lines configuration.
2 Jordan and Palestine (including West Bank and Gaza Strip) are considered as one sub-region. From hereafter they will be called Jordan & Palestine for the region-wide and area-wide scenarios. 3 All the countries which are called by “&” in the integrated scenario are considered as a one sub-region.

preprint to be published in the proceedings of the 11th International Energy Conference, May 30-31, Tehran, Iran
In this paper three scenarios for energy system development options are discussed:
- region-wide energy systems, in which all the regions are independent (no
HVDC grid interconnections) and the electricity demand has to be covered by
the respective region’s own generation;
- area-wide energy system, in which the regional-based energy systems are
interconnected;
- integrated scenario: area-wide energy system scenario with SWRO
desalination and industrial gas demand. In this scenario, RE combined with
PtG technology are used not only as electricity generation and storage
options within the system, but also as energy sector bridging technologies to
cover water desalination and industrial gas demand, increasing the flexibility
of the system.
3.2. Financial and technical assumptions
The model optimization is carried out on an assumed cost basis and technological
status for the year 2030 and the overnight building approach. The financial
assumptions for capital expenditures (capex), operational expenditures (opex) and
lifetimes of all components are provided in the Supplementary Material (in Table 1).
References for the financial and technical assumptions can be found in Bogdanov
and Breyer [39],[40]. Weighted average cost of capital (WACC) is set to 7% for all
scenarios, but for residential PV self-consumption WACC is set to 4%, due to lower
financial return requirements. The technical assumptions concerning power to
energy ratios for storage technologies, efficiency numbers for generation and
storage technologies, and power losses in HVDC power lines and converters are
provided in the Supplementary Material (Tables 2, 3 and 4, respectively). Electricity
prices in residential, commercial and industrial sectors in most of the countries are
taken from Gerlach et al. [59] for the year 2015, except for Iran and Yemen, whose
electricity prices are taken from local sources [60][61]. Prices are provided in the
Supplementary Material (in Table 5). The electricity price is on a country basis.
However, for the sub-regions electricity prices are the weighted average of a sub-
region. Then, electricity prices are extrapolated in order to calculate electricity prices
for the year 2030. The excess electricity generation, which cannot be self-consumed
by the solar PV prosumers, is assumed to be fed into the grid for a transfer selling
price of 2 €cents/kWh. Prosumers cannot sell to the grid more power than their own
annual consumption.
3.3. Feed-in for solar and wind energy
The feed-in profiles for solar CSP, optimally tilted and single-axis tracking PV, and
wind energy were calculated according to Bogdanov and Breyer [39],[40]. The

preprint to be published in the proceedings of the 11th International Energy Conference, May 30-31, Tehran, Iran
aggregated profiles of solar PV generation (optimally tilted and single-axis tracking),
wind energy power generation and CSP solar field, normalized to maximum capacity
averaged for the MENA region are presented in Figure 5. The computed average full
load hours (FLH) for optimally tilted, single-axis tracking PV systems, wind power
plants and CSP are provided in the Supplementary Material (Table 8).
Figure 5: Aggregated feed-in profiles for optimally tilted PV (top left), single-axis tracking
PV (top right), CSP solar field (bottom left) and wind power plant (bottom right) in the
MENA region.
The feed-in values for hydropower are computed based on the historical weather
data for precipitation for the year 2005 as a normalized sum of precipitation in the
regions. Such an estimate leads to a good approximation of the annual generation
of hydropower plants.
3.4. Upper and lower limitations on installed capacities
Lower limits are taken from Farfan and Breyer [20] and upper limits are calculated
according to Bogdanov and Breyer [40]. Lower limits on already installed capacities
in the MENA sub-regions are provided in the Supplementary Material (Table 9) and

preprint to be published in the proceedings of the 11th International Energy Conference, May 30-31, Tehran, Iran
all upper limits of installable capacities in the MENA sub-regions are summarized in
the Supplementary Material (Table 10). For all other technologies, upper limits are
not specified. However, for solid biomass residues, biogas and waste-to-energy
plants it is assumed, due to energy efficiency reasons, that the available and
specified amount of the fuel is used during the year.
3.5. Load profile
The demand profiles for sub-regions are computed as the total demand of regions
based on synthetic load data. Figure 6 represents the area-aggregated demand of
all sub-regions in the MENA region. Current electricity demand is collected from IEA
data [1] and RCREEE data [62], and the electricity demand growth rate by the year
2030 is estimated using IEA data [63]. According to the IEA [63], the electricity
demand is set to continue growing by 2.7% and 4% in the Middle East and North
Africa by 2030, respectively. Solar PV self-consumption prosumers have a
significant impact on the residual load demand in the energy system as depicted in
Figure 6 (right). The overall electricity demand and the peak load are reduced by
8.5% and 3.2%, respectively.
Figure 6: Aggregated load curve (left) and system load curve with prosumers influence
(right) for the year 2030 in the MENA region.
4. Results
For each scenario, a cost minimized electrical energy system configuration is derived
for the given constraints and characterized by optimized installed capacities of RE
electricity generation, storage and transmission for every technology used in the
model, which in turn leads to hourly electricity generation, storage charging and
discharging, import and export of electricity between countries, and curtailment. The

preprint to be published in the proceedings of the 11th International Energy Conference, May 30-31, Tehran, Iran
average financial results of the different scenarios for the total energy system are
presented in Table 1. The main financial parameters represent levelized cost of
electricity (LCOE) (including PV self-consumption and the centralized system),
levelized cost of electricity for primary generation (LCOE primary), levelized cost of
curtailment (LCOC), levelized cost of storage (LCOS), levelized cost of transmission
(LCOT), total annualized cost, total capital expenditures, total RE capacity and total
primary generation.
Table 1: Key financial results for the three analyzed scenarios applied for the MENA
region.
Total LCOE
LCOE primary
LCOC LCOS LCOT Total ann. cost
Total CAPEX
RE capacities
Generated electricity
[€/MWh] [€/MWh] [€/MWh] [€/MWh] [€/MWh] [b€] [b€] [GW] [TWh]
Region-wide 61 34 2.2 25 0 108 1011 963 2107
Area-wide 55 36 1.8 15 2.2 96 922 877 1999
Integrated scenario
37 32 1.5 2 1.4 375 3643 3440 8413
From Table 1, it can be perceived that the integration benefit due to connection of
different regions via HVDC transmission lines is significant in both electricity cost
and annual expenditures. Electricity cost of the entire system in the area-wide open
trade scenario declines by about 10% compared to the region-wide scenario. Grid
utilization decreases the primary energy conversion capacities and generation by
9% in terms of installed capacities and by 5% in terms of generated electricity in
reference to the region-wide scenario. Grid utilization leads to a noticeable reduction
of storage utilization (Table 2), particularly A-CAES, whereas cost of transmission is
relatively small in comparison to the decrease in primary generation and storage
costs. Curtailment costs decrease consistently compared to storage costs in the
case of broader grid utilization, leading to a reduction of about 18% in the area-wide
scenario compared to the region-wide scenario. However, the impact of excess
energy on total cost is rather low. The power line capacities for the electricity trade
between the sub-regions for the area-wide open trade scenario is shown in the
Supplementary Material (Figure 7 and Table 15).
A further decrease in LCOE of 33% compared to the area-wide open trade scenario
can be reached by the integration of water desalination and industrial gas sectors.
This cost reduction is mainly explained by a reduction of storage cost by 87% since
industrial gas and desalination sectors decrease the need for long-term storage
utilization, giving additional flexibility to the system. An 11% decrease in primary
electricity generation cost can be noticed as well and is explained by an increase in

preprint to be published in the proceedings of the 11th International Energy Conference, May 30-31, Tehran, Iran
the flexibility of the system and the utilization of low-cost wind and solar electricity
as can be seen in Table 2. For the case of biogas, a fraction of 48% of the biogas
used in biogas power plants in the area wide-open trade scenario is re-allocated
from the electricity sector to the industrial gas demand for efficiency reasons.
The LCOE components and the import/export share in region-wide, area-wide and
integrated scenario are presented in the Supplementary Material (Table 12). The
share of export is defined as the ratio of net exported electricity to the generated
primary electricity of a sub-region and the share of import is defined as the ratio of
imported electricity to the electricity demand. The area average is composed of sub-
regions’ values weighted by the electricity demand.
Concerning RE installed capacities, an increase of grid utilization leads to a
decrease in total installed capacities of RE. To be more precise, for PV total the
installed capacities decrease by 25% from the region-wide to area-wide scenario
while for wind energy the installed capacities increase by 17% from the region-wide
to area-wide scenario. The reason for increasing the installed capacity of wind is that
the LCOE for wind energy in some sub-regions is lower than solar PV. Therefore,
the system prefers to install wind rather than PV single-axis tracking and exchange
this electricity with neighboring regions. In addition, the wind resource is at a really
excellent level in some parts of the MENA region. In the integrated scenario, installed
capacities of PV and wind increase due to the additional demand of seawater
desalination and industrial gas demand. The high share of solar PV can be examined
by the fact that this is the least cost RE source in the region, followed by wind. It is
noticeable to mention that a fast cost reduction of solar PV technology and battery
storage is assumed in the next 15 years. The share of PV single-axis tracking and
PV self-consumption of the total solar PV installed capacity for the area-wide
scenario are 73% and 24%, respectively. The grid interconnection decreases the
need of energy storage. Installed capacities of batteries, A-CAES, PtG and gas
turbines decrease with interconnection of the regions as summarized in Table 2,
whereas the share of PHS stays constant.
Compared to all the available RE in the region, PV and wind seems to be more
profitable technologies due to the availability of the resources. Theoretically, MENA
could meet its projected power requirements through 2030 using solar PV alone.
A division of regions into net importers and exporters can be observed for the area-
wide scenario and the integrated scenario, which are presented in Figure 7, and
where sub-regions with the best renewable resources are net exporters and the
others are net importers. In the region-wide scenario, all the individual sub-regions
or countries of the MENA region need to match their own demand using their own

preprint to be published in the proceedings of the 11th International Energy Conference, May 30-31, Tehran, Iran
RE. The regions can import or export electricity depending on their demand and
generation. The differences between the demand and production are mainly due to
import, export and storage losses. For the integrated scenario, the difference is due
to the energy consumption for SNG production (Figure 8). The net importer regions
in the MENA region are the UAE, Bahrain & Qatar, Kuwait, Israel, Morocco,
Lebanon, Tunisia, Iraq and Syria. The net exporter regions are Saudi Arabia, Egypt,
Iran and Libya. In comparing net importer and exporter regions, some regions have
a balancing system of import and export, such as Algeria, Yemen, Oman and Jordan
& Palestine. Due to a high electricity demand for additional desalination and SNG
production, the integrated scenario tends to increase the electricity generation
between the regions to fulfill the increased demand. Hourly resolved profiles for the
net exporting region, Saudi Arabia, the net importing region, the UAE, and the
balancing region, Jordan & Palestine, are presented in the Supplementary Material
(Figure 1, 2 and 3, respectively).
Table 2: Results on the installed RE technologies and storage capacities for the three
scenarios.
Region-wide
scenario Area-wide scenario
Integrated scenario
PV self-consumption [GW] 85.1 85.1 87.0 PV optimally tilted [GW] 26.2 11.4 1.3 PV single-axis tracking [GW] 368.5 261.4 1666.4 PV total [GW] 479.8 357.9 1754.7 CSP [GW] 0.1 0.0 0.0 Wind energy [GW] 333.9 391.9 1541.2 Biomass power plants [GW] 7.6 7.5 5.5 MSW incinerator [GW] 0.7 0.7 0.7 Biogas power plants [GW] 22.3 21.4 11.2 Geothermal power [GW] 5.9 6.1 4.9 Hydro Run-of-River [GW] 0.21 0.21 0.2 Hydro dams [GW] 31.5 31.5 31.5 Battery PV self-consumption
[GWh] 69.5 69.5 61.0
Battery System [GWh] 452.0 298.7 5.9 Battery total [GWh] 521.5 368.2 66.9 PHS [GWh] 1.6 1.6 1.6 A-CAES [GWh] 2141.1 80.9 3.7 Heat storage [GWh] 29.6 0.0 1.1 PtG electrolyzers [GWel] 39.5 26.2 592.7 CCGT [GW] 53.2 39.8 29.7 OCGT [GW] 37.3 33.6 64.3 Steam Turbine [GW] 0.4 0.0 0.1
Figure 8 gives an overview of the installed capacities for RE generation and storage
for all sub-regions in the region-wide, area-wide and integrated scenarios. In the
region-wide open trade scenario for the sub-regions of Bahrain & Qatar, Israel,
Kuwait, Lebanon, the UAE, Oman and Libya, solar PV capacities exceed 50% of all

preprint to be published in the proceedings of the 11th International Energy Conference, May 30-31, Tehran, Iran
installed RE capacities despite the fact that FLH for wind are higher or comparable
to PV FLH. In sub-regions with excellent wind conditions, wind energy is the next
preferred technology with the lowest cost after solar PV. Saudi Arabia, Iran, Algeria,
Morocco, Egypt and Libya have the highest share of wind in the region.
Figure 7: Annual import and export of electricity diagrams for the area-wide (top) and the
integrated scenario (bottom).
The interconnection of the sub-regions via HVDC transmission lines decreases the
installed capacities of PV by 25%, as shown in Figure 8 and Table 2, from the region-
wide to the area-wide scenario. In the case of the integrated scenario, installed
capacities for PV and wind increase significantly by 390% and 293% compared to
the area-wide scenario, respectively, due to the higher demand for electricity and

preprint to be published in the proceedings of the 11th International Energy Conference, May 30-31, Tehran, Iran
increased system flexibility. PV self-consumption plays a key role in the MENA
region due to higher electricity prices. PV self-generation covers 89%, 87% and 90%
of residential, commercial and industrial prosumer demand, respectively. An
overview of PV self-consumption is provided in the Supplementary Material (Table
13).
The interconnected HVDC transmission grid, together with the RE generation and
demand, significantly influence the requirement of total storage capacity, but also
change with the need of different storage technologies for the energy system in the
whole region. The throughputs of batteries, A-CAES and gas storage decrease by
27%, 96% and 25%, respectively, from the region-wide to the area-wide scenario.
Therefore, A-CAES storage technology experienced the highest decline in
comparison to other storage technologies while the need for PHS technology
increased from 0.4 TWhel to 0.5 TWhel in the area-wide scenario. The installation of
HVDC lines leads to a reduction of the storage technology utilization as the
transmitted electricity is lower in cost in many cases than storage options. Installed
capacities of batteries, PHS, A-CAES, heat storage, PtG and gas turbines decrease
due to the expansion of the grid. The storage discharge capacities, annual
throughput of storage and full load cycles per year are provided in the
Supplementary Material (Table 14). State of charge profile diagrams for the area-
wide scenario for battery, PHS, gas storage and A-CAES is given in the
Supplementary Material (Figure 5).
Various electricity generation curves for the area-wide scenario are illustrated in the
Supplementary Material (Figure 6). A full year divided into 8760 hours sorted
according to the generation minus the load, which is shown by a black line. Electricity
generation is more than demand for about 5000 hours of the year, which is used for
charging storage. The reason for high electricity generation can be attributed to the
inflexibility of energy sources, due to the high share of solar and wind energy and a
higher solar irradiation and wind speed during these hours of the year in the MENA
region. Consequently, other flexible electricity generation options such as hydro
dams, biomass, biogas, geothermal energy and discharge of storage plants are
required. As observed for the other hours of the year, the inflexible electricity
generation options reduces significantly as the electricity demand decreases and
there is a need for flexible electricity generation options, discharge of storage
technologies and utilization of the grid. There is curtailment in about 1000 hours of
the year, but for all the other hours the HVDC lines enable the export of the electricity
from the best RE producing sub-regions to other sub-regions of remaining demand
or due to charging of storage.

preprint to be published in the proceedings of the 11th International Energy Conference, May 30-31, Tehran, Iran
Figure 8: Installed capacities RE generation (left) and storage capacities (right) for region-
wide (top), area-wide (center) and integrated (bottom) scenarios for the MENA regions.
The grid utilization profile for the MENA region can be found in the Supplementary
Material (Figure 7). It can be observed that the grid utilization is distributed between
different hours of a day. However, it is mostly utilized in the morning and evening
hours. This can be explained by seasonal variation in the region, where most trading
of the electricity takes place. There are mainly two major climatic patterns in most of
the countries; the first six months of the year and the second six months of the year.
April-May is regarded as spring in some countries such as Iran, Morocco and Israel,

preprint to be published in the proceedings of the 11th International Energy Conference, May 30-31, Tehran, Iran
going into the summer which is June to September and winter starts in October-
November and ends in March. In the winter months solar radiation decreases due to
the overcast and cloudy conditions. In order to satisfy the morning and evening
demand, transmission of electricity takes place between the regions. In hours of very
good solar conditions, grid utilization is at its minimum. The capacities and utilization
of the transmission lines between different regions is provided in the Supplementary
Material (Table 15).
The key findings of the energy system from generation to demand in the integrated
scenario can be depicted by an energy flow diagram (Figure 9). The flow diagram is
comprised of the primary RE resources, the energy storage technologies, HVDC
transmission grids, total demand of each sector and system losses. The sector use
of electricity for the integrated scenario consists of electricity, desalination and
industrial gas demand. The usable heat generated and ultimate system losses can
be explained as a difference between primary electricity generation and final
electricity demand, which includes curtailed electricity, heat produced by biomass,
biogas and waste-to-energy power plants, heat generated from electrolyzers for
transforming power-to-hydrogen, in methanation process transforming hydrogen-to-
methane and methane-to-power in gas turbines. Efficiency losses lead to A-CAES,
PHS, battery storage and HVDC transmission grid losses. The energy flow diagrams
for the region-wide and area-wide scenario are presented in the Supplementary
Material (Figure 8).

preprint to be published in the proceedings of the 11th International Energy Conference, May 30-31, Tehran, Iran
Figure 9: System energy flow for the integrated scenario.
5. Discussion
The electricity cost is decreased remarkably in the RE-based system due to the
installation of a HVDC transmission grid. The reduction of electricity cost by
connection of HVDC grid has been also observed in other studies carried out with
the same criteria [39]-[43]. The total levelized cost of electricity in the region
decreased from 61 €/MWh for the region-wide open trade scenario to 55 €/MWh for
the area-wide open trade scenario and to 37 €/MWh for the integrated scenario. By
comparison with the region-wide scenario, it can be highlighted that regions such as
Egypt, Tunisia and Saudi Arabia experienced the highest reduction of total LCOE in
the area-wide scenario, by 13%, 12% and 11%, respectively. In contrast, the total
LCOE rose in some regions such as Yemen, Iraq and Jordan & Palestine from
region-wide to area-wide scenario. This can be justified on the basis that in these
three regions the electricity cost is lower when they are independent. However, in
most of the regions HVDC grid interconnection leads to a decrease the cost of
electricity.
preprint to be published in the proceedings of the 11th International Energy Conference, May 30-31, Tehran, Iran
The total annualized cost of the system decreased from 108 b€ for the region-wide
scenario to 96 b€ for the area-wide scenario. The total capex requirements dropped
substantially from 1011 b€ for the region-wide open trade scenario to 922 b€ for the
area-wide open trade scenario. However, the total annualized cost and the total
capex increased drastically for the integrated scenario by 375 b€ and 3643 b€,
respectively, to cover the excess electricity needed for the desalination and industrial
gas sectors. Additional costs of the HVDC transmission grid in the area-wide open
trade scenario are compensated by a significant decline in installed capacities of
electricity generation and storage capacities, which is enabled by lower efficiency
losses, decrease in costs of energy transmission compared to energy storage and
access to low cost electricity generation in other regions. It is important to mention
that the HVDC transmission grid may not cover the electricity supply in rural areas,
since RE-based mini-grid applications based on PV systems, small wind power and
micro-hydro plants might be a proper solution in addition to grid extension [64]-[68].
PV technologies followed by wind energy have the highest share of installed
capacities for a 100% RE energy mix in the region-wide and the integrated scenario.
The reason is that these technologies have well distributed FLH all over the sub-
regions and are the least cost RE technologies in most of the cases. In comparison,
wind energy has the highest share of installed capacity in the area-wide open trade
scenario, followed by PV. However, it is also noticeable to mention that an increase
in the share of wind could be inverted again after 2030, since the learning curve of
PV continues [69], in particular in combination with batteries [70],[71] . However, the
learning curve of wind is not so steep, i.e. the share of PV is expected to grow year
by year. Besides, the installation of distributed small-scale and centralized PV plants
is already profitable in numerous countries across the world and PV electricity
generation cost will tend to be further reduced in the coming years [72].
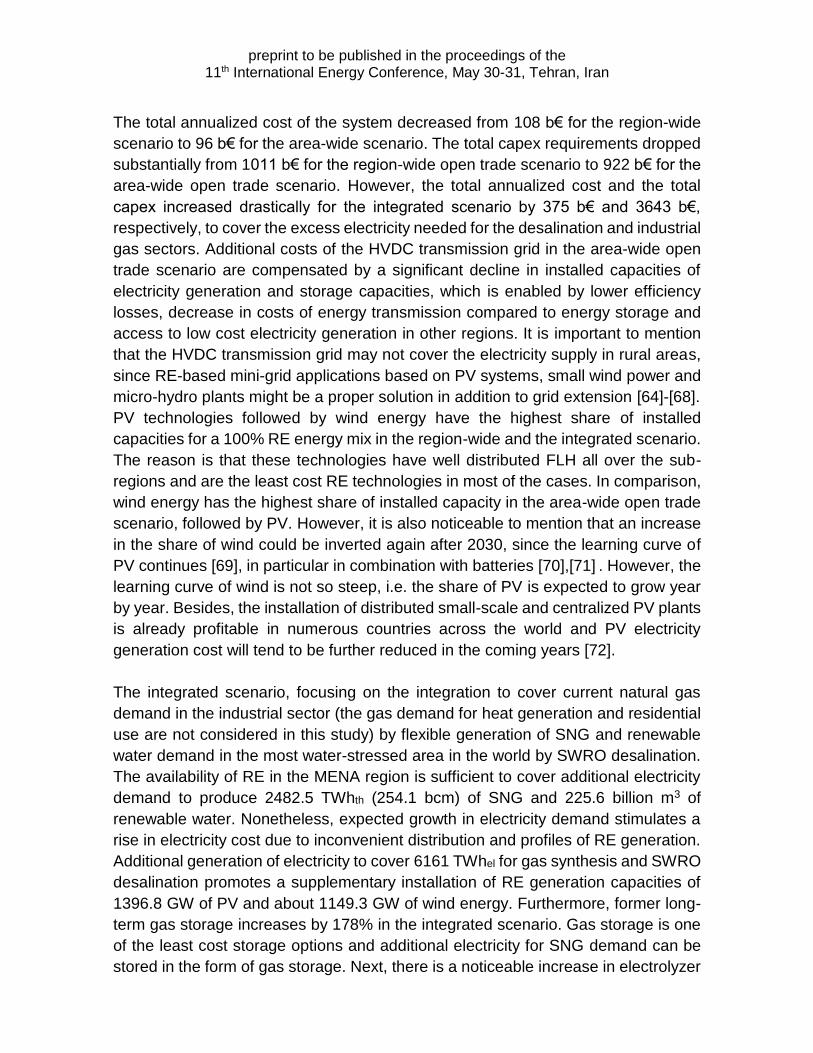
The integrated scenario, focusing on the integration to cover current natural gas
demand in the industrial sector (the gas demand for heat generation and residential
use are not considered in this study) by flexible generation of SNG and renewable
water demand in the most water-stressed area in the world by SWRO desalination.
The availability of RE in the MENA region is sufficient to cover additional electricity
demand to produce 2482.5 TWhth (254.1 bcm) of SNG and 225.6 billion m3 of
renewable water. Nonetheless, expected growth in electricity demand stimulates a
rise in electricity cost due to inconvenient distribution and profiles of RE generation.
Additional generation of electricity to cover 6161 TWhel for gas synthesis and SWRO
desalination promotes a supplementary installation of RE generation capacities of
1396.8 GW of PV and about 1149.3 GW of wind energy. Furthermore, former long-
term gas storage increases by 178% in the integrated scenario. Gas storage is one
of the least cost storage options and additional electricity for SNG demand can be
stored in the form of gas storage. Next, there is a noticeable increase in electrolyzer

preprint to be published in the proceedings of the 11th International Energy Conference, May 30-31, Tehran, Iran
units of about 566.5 GW and a significant reduction in CCGT capacities of about
10.1 GW.
In addition, the system generates excess heat as a byproduct of different processes
such as biogas and biomass CHP plants, waste-to-energy incinerators and gas
turbines, as well as excess electrical energy which can be curtailed or converted to
usable heat and stored in heat storage. The usable heat amount varies from 179
TWhth per year for the area-wide scenario up to 227 TWhth for the region-wide
scenario. The amount of usable heat in the integrated scenario is 966 TWhth, which
is noticeably larger than for the area-wide scenario because of higher losses in gas
turbines, methanation and electrolysis. Totally, the estimation of the integration
benefit for the electricity, industrial gas and water sectors is around 45 b€ of the
annual system cost. An additional reduction can be seen in the electricity generation
by 544 TWh and the curtailed electricity by 33 TWh. Further, the cost of renewable
water seems to be quite affordable at 1.1 €/m3 and the cost of electricity decreases
by 33% to 37 €/MWh for the integrated scenario compared to the area-wide open
trade scenario without sector integration.
The findings for the MENA region 100% RE-based energy system clearly reveal that
the potential of the region for RE generation, in particular for solar and wind energy,
is quite high. By applying this system to the region, not only can the MENA region
fulfill all the electricity demands in the region itself, but also can export the rest of the
production to other continents. The results of a fairly low LCOE in all the considered
scenarios for the year 2030 added to the already existing RE policies and low carbon
development plans can boost the development of a renewable power system in the
region in the coming years. Several studies have been already discussed about
various alternatives to reduce the production of fossil fuels and to achieve a low
carbon based energy system [73],[74]. They have mostly addressed non-renewable
options, such as nuclear energy, natural gas and coal carbon capture and storage
(CCS). However, the LCOE of the alternatives are rather high compared to our
findings, which are listed as follows [73]: 112 €/MWh for new nuclear (assumed for
2023 in the UK and Czech Republic), 112 €/MWh for gas CCS (assumed for 2019
in the UK) and 126 €/MWh for coal CCS (assumed for 2019 in the UK). Moreover, a
report published by the European Commission [75] concludes that CCS technology
is not likely to be commercially available before the year 2030. The findings for
Europe are assumed to be also valid for the MENA region in the mid-term. In
addition, several studies for 100% RE by 2050, such as from WWF [76] and
Greenpeace [77] state that nuclear fission produced dangerous waste that remains
extremely toxic for many years and it cannot be stored safely anywhere in the world.
Consequently, these studies have assumed a phase-out of nuclear energy due to
sustainability reasons. Dittmar [78] also points out that the financial and human

preprint to be published in the proceedings of the 11th International Energy Conference, May 30-31, Tehran, Iran
research and development resources spent for nuclear fusion cannot solve the
energy problems in the world and even worse these resources are not available for
research of pathways towards a low cost energy future.
The 100% renewable resource-based energy system options for the MENA region
demonstrated and described in this paper seem to be substantially cost-effective
(about 67 - 71% lower cost) than the other alternatives, by comparison of the
integrated scenario with nuclear energy and CCS technology, which have still further
drawbacks. These include nuclear melt-down risk, nuclear terrorism risk, unsolved
nuclear waste disposal, remaining CO2 emissions of power plants with CCS
technology, a diminishing conventional energy resource base and high health cost
due to heavy metal emissions of coal fired power plants.
6. Conclusion
Existing RE technologies can generate sufficient energy not only to cover all
electricity demand in the MENA region for the year 2030 on a cost level of 55 - 61
€/MWhel, but also to export the additional energy to other continents. In addition, the
electricity demand, gas demand and clean water demand can be covered by
electricity generation based on RE sources as well using PtG and SWRO
desalination technology, providing the region with 100% renewable synthetic natural
gas and clean water supply. However, the synthetic natural gas price in 2030 is
significantly higher than today and government regulation and subsidies are still
needed to ensure the financial viability of this synthetic fuel. More detailed analyses
have to be carried out to balance this with today’s direct and indirect subsidies to
draw a more solid conclusion.
Extreme dependency on fossil fuel resources to generate electricity and rather low
prices of these resources lead to a low share of RE in the region today. However,
there is no doubt that non-renewable resources cause harmful effects on the
environment and also will run out in the mid-term future. In order to cut the
dependency of the MENA region power sector on fossil fuels, different shares of
variable RE technologies are taken into consideration for a 100% RE-based power
system for the region. The need to eliminate this dependency has been an urgent
issue for many countries throughout the region for the last few years. In the cost
minimized design of the energy mix presented in this study, solar PV dominates the
energy system in the electricity sector (in terms of TWh of electricity production) in
most sub-regions of the MENA region, followed by wind energy. For all the studied
scenarios solar PV technology emerged as the main energy supply (in terms of GW
of installed capacities) in most of the sub-regions; however, for the area-wide open

preprint to be published in the proceedings of the 11th International Energy Conference, May 30-31, Tehran, Iran
trade scenario the role of PV decreases in sub-regions where wind sites are the least
cost technology. It is also noticeable to mention that an increase in the share of wind
could be inverted again after 2030, since the learning curve of PV continues, in
particular in combination with batteries. However, the learning curve of wind is not
so steep, i.e. the share of PV way grow year by year.
Heat generated as a byproduct of electricity, synthetic natural gas generation and
curtailed electricity conversion can cover up to 966 TWhth of heat demand. The
HVDC transmission grid plays a significant role within the renewable resource-based
energy system since the established Super Grid enables a significant cost decrease,
a cut-off of storage utilization, and a significant reduction of primary generation
capacities. Simultaneously, PV self-consumption promotes a moderate increase of
total electricity costs of 0.7% (region-wide) and 3.3% (area-wide), because
consumers tend to utilize solar energy at a higher cost level and the electricity excess
from prosumer generation provokes additional disturbances in the system.
For the integrated scenario it was found that industrial SNG generation displaces
SNG storage as seasonal storage for the electricity sector. Instead of gas turbine
utilization in the case of an energy deficit, the system curtails the SNG generation in
that system set-up as a major source of flexibility to the system.
More research is needed for a better understanding of a fully integrated RE system
in the MENA region. However, this research work clearly indicates that a 100%
renewable resources-based energy system is a real policy and low cost option.
Acknowledgements
The authors gratefully acknowledge the public financing of Tekes (Finnish Funding
Agency for Innovation) for the ‘Neo-Carbon Energy’ project under the number
40101/14. The authors would like to thank Michael Child for proofreading.
Supplementary Material
Supplementary data associated with this article can be found in the appendix of this
paper.

preprint to be published in the proceedings of the 11th International Energy Conference, May 30-31, Tehran, Iran
References
[1] [IEA] – International Energy Agency, 2015, Key World Energy Statistics, Paris.
[2] [IRENA] – The International Renewable Energy Agency, 2013, MENA: Renewables Status Report. United Arab Emirates Ministry of Foreign Affairs, REN 21, Abu Dhabi.
[3] World Bank, 2014. World Development Indicators: CO2 Emissions from Electricity and Heat Production, Total (Million Metric Tons). World Bank, Washington D.C. [accessed 17.12.2015].
[4] [IRENA] – The International Renewable Energy Agency, 2016. Renewable Energy Market Analysis: The GCC Region’. IRENA, Abu Dhabi.
[5] [RCREEE] – The Regional Center for Renewable Energy and Energy Efficiency, 2015. Arab future energy index 2015 – Energy efficiency. Cairo, Egypt. www.rcreee.org/sites/default/files/afex_ee_2015_engish_web_0.pdf [accessed 08.03.2016].
[6] [BP] – British Petroleum, 2015. Statistical Review of World Energy 2015, London, www.bp.com/en/global/corporate/energyeconomics/statistical-review-of-world-energy.html [accessed 10.02.2016].
[7] [IEA] – International Energy Agency, 2015. World Energy Outlook 2015. IEA Publishing, Paris. [8] [EIA] – U.S. Energy Information Administration, 2014. International Energy Outlook 2014: World
Petroleum and Other Liquid Fuels, With Projections to 2040, Washington, DC. [9] World Bank, 2012. Renewable Energy Desalination: An Emerging Solution to Close the Water
Gap in the Middle East and North Africa. Washington, DC: World Bank. DOI: 10.1596/978-0-8213-8838-9.
[10] Zyadin, A., 2013. Water Shortage in MENA Region: An Interdisciplinary Overview and a Suite of Practical Solutions, Journal of Water Resource and Protection, 5, 49-58.
[11] Pal J.S. and Eltahir E.A.B., 2015. Future temperature in southwest Asia projected to exceed a threshold for human adaptability, nature climate change, published online: October 26, DOI: 10.1038/NCLIMATE2833.
[12] [EIA] – U.S. Energy Information Administration, 2014. Country Analysis Brief: Saudi Arabia, Washington, DC., www.eia.gov/beta/international/analysis_includes/countries_long/Saudi_Arabia/saudi_arabia.pdf [accessed 17.03.2016].
[13] [IEA] – International Energy Agency, 2013. Algeria: Electricity and Heat for 2013, www.iea.org/statistics/statisticssearch/report/?country=Algeria&product=electricityandheat [accessed 18.03.2016].
[14] [EIA] – U.S. Energy Information Administration, 2015. Country data: Egypt, www.eia.gov/beta/international/analysis.cfm?iso=EGY [accessed 18.03.2016].
[15] [EIA] – U.S. Energy Information Administration, 2015. Country data: Tunisia, www.eia.gov/beta/international/analysis.cfm?iso=TUN [accessed 18.03.2016].
[16] [EIA] – U.S. Energy Information Administration, 2015. Country data: Oman, www.eia.gov/beta/international/analysis.cfm?iso=OMN [accessed 18.03.2016].
[17] [EIA] – U.S. Energy Information Administration, 2015. Country data: Syria, www.eia.gov/beta/international/analysis.cfm?iso=SYR [accessed 18.03.2016].
[18] Energypedia, n.d., Morocco Energy Situation, https://energypedia.info/wiki/Morocco_Energy_Situation [accessed 18.03.2016].
[19] REN21, 2015. Renewables 2015 Global Status Report, Paris. [20] Farfan J. and Breyer Ch., 2016. Structural changes of global power generation capacity towards
sustainability and the risk of stranded investments, submitted. [21] [GIZ] – Deutsche Gesellschaft für Internationale Zusammenarbeit (GIZ) Gmbh, 2012, Renewable
energy and energy efficiency in Tunisia – employment, qualification and economic effects, Tunis. [22] [RCREEE] - Regional Center for Renewable Energy and Energy Efficiency, 2015, Country profile
– Renewable Energy, www.rcreee.org/content/member-states [accessed: 22.03.2016]. [23] IEA/IRENA, 2013. Concentrating Solar Power - Technology Brief. IEA-ETSAP/IRENA, Abu
Dhabi. [24] [IEA] – International Energy Agency, 2014. Technology Roadmap. Solar Thermal Electricity. IEA,
Paris.

preprint to be published in the proceedings of the 11th International Energy Conference, May 30-31, Tehran, Iran
[25] Breyer, Ch., Gerlach, A., Schäfer, D. and Schmid, J., 2010. Fuel-parity: new very large and sustainable market segments for PV systems, In Energy Conference and Exhibition (EnergyCon), 2010 IEEE International, 406-411, IEEE, Manama/Bahrain, December 18-22.
[26] Breyer, Ch., Gerlach, A., Beckel, O. and Schmid, J., 2010. Value of solar PV electricity in MENA region. In Energy Conference and Exhibition (EnergyCon), 2010 IEEE International, 558-563, IEEE, Manama/Bahrain, December 18-22.
[27] Breyer Ch. and Reiß J., 2014. Hybrid Photovoltaic Power Plants: Least Cost Power Option for the MENA Region, 29th European Photovoltaic Solar Energy Conference, Amsterdam, September 22-26, Netherlands.
[28] Werner Ch., Gerlach A., Breyer Ch., 2014. Global Installed Photovoltaic Capacity and Identification of Hidden Growth Markets, 29th European Photovoltaic Solar Energy Conference, Amsterdam, September 22-26, Netherlands.
[29] LAZARD, 2015. LAZARD’s Levelized Cost of Energy Analysis – Version 9.0, New York, November.
[30] Bogdanov D. and Breyer Ch., 2015. The Role of Solar Energy towards 100% Renewable Power Supply for Israel: Integrating Solar PV, Wind Energy, CSP and Storages, 19th Sede Boqer Symposium on Solar Electricity Production, February 23-25.
[31] Afanasyeva S., Breyer Ch., Engelhard M., 2016. The Impact of Cost Dynamics of Lithium-Ion Batteries on the Economics of Hybrid PV-Battery-GT Plants and the Consequences for Competitiveness of Coal and Natural Gas-Fired Power Plants, 10th International Renewable Energy Storage Conference (IRES 2016), Düsseldorf, March 15-17.
[32] Hlusiak M., Bedoya Díaz H.A., Götz M., Breyer Ch., 2014. Hybrid Photovoltaic (PV) - Concentrated Solar Thermal Power (CSP) Power Plants: Modelling, Simulation and Economics, 29th EU PVSEC, Amsterdam, September 22-26.
[33] Dii,, Desert Power 2050: Perspectives on a Sustainable Power System for EUMENA, Munich, 2012.
[34] Mohamed A.M., Al-Habaibeh A., Abdo H. and Elabar S., 2015. Towards exporting renewable energy from MENA region to Europe: An investigation into domestic energy use and householders’ energy behaviour in Libya. Applied Energy, 146, pp.247-262.
[35] Bohn S., Agsten M., Marten A.K., Westermann D., Boie I., Ragwitz M., 2014. A Pan-European-North African HVDC Grid for Bulk Energy Transmission - A Model-based Analysis, IEEE-PES Transmission Distribution conference, April 14-17, Chicago, IL, USA.
[36] Trieb F. et al., 2006. Trans-Mediterranean interconnection for concentrating solar power. DLR - German Aerospace Center, Stuttgart. [accessed: 28.03.2016] www.dlr.de/tt/desktopdefault.aspx/tabid-2885/4422_read-6588/..
[37] Czisch G., 2005. Szenarien zur zukünftigen Stromversorgung Kostenoptimierte Variationen zur Versorgung Europas und seiner Nachbarn mit Strom aus erneuerbaren Energien, dissertation, University of Kassel.
[38] Desertec Foundation, 2007. The Deserctec Concept, Hamburg, www.desertec.org/concept/. [39] Bogdanov D. and Breyer Ch., 2015. Eurasian Super Grid for 100% Renewable Energy power
supply: Generation and storage technologies in the cost optimal mix, ISES Solar World Congress 2015, Daegu, Korea, November 8-12.
[40] Bogdanov D. and Breyer Ch., 2016. North-East Asian Super Grid for 100% Renewable Energy supply: Optimal mix of energy technologies for electricity, gas and heat supply options. Energy Conversion & Management, 112, 176-190.
[41] Gulagi A., Bogdanov D., Breyer Ch., 2016. Southeast Asia and the Pacific Rim Super Grid for 100% Renewable Energy Power Supply, submitted.
[42] Gulagi A., Aghahosseini, A., Bogdanov D., Breyer Ch., 2016. Comparison of the potential role of adiabatic compressed air energy storage (A-CAES) for a fully sustainable energy system in a region of significant and low seasonal variations, 10th International Renewable Energy Storage Conference, Düsseldorf, Germany.
[43] Barbosa L.S.N.S, Bogdanov D., Vainikka P., Breyer Ch., 2016. Hydro, wind and solar power as a base for a 100% Renewable Energy supply for South and Central America, submitted.
[44] Stackhouse P.W., Whitlock C.H., editors. 2008. Surface meteorology and solar energy (SSE) release 6.0, NASA SSE 6.0, earth science enterprise program. National Aeronautic and Space Administration (NASA), Langley; http://eosweb. larc.nasa.gov/sse/ [accessed 28.05.2015].

preprint to be published in the proceedings of the 11th International Energy Conference, May 30-31, Tehran, Iran
[45] Stackhouse P.W., Whitlock C.H., editors. 2009. Surface meteorology and solar energy (SSE) release 6.0 Methodology, NASA SSE 6.0, earth science enterprise program, National Aeronautic and Space Administration (NASA), Langley; http://eosweb.larc.nasa.gov/sse/documents/SSE6Methodology.pdf [accessed 28.05.2015].
[46] Stetter D., 2012. Enhancement of the REMix energy system model: global renewable energy potentials optimized power plant siting and scenario validation. Dissertation, Faculty of Energy-, Process and Bio-Engineering, University of Stuttgart.
[47] [IEA] – International Energy Agency, 2005. World Energy Outlook 2005 - Middle East and North Africa Insights, Paris.
[48] Luck M., Landis M., Gassert F., 2015. Aqueduct Water Stress Projections: Decadal projections of water supply and demand using CMIP5 GCMs, Washington DC, World Resources Institute.
[49] Caldera U., Bogdanov D., Breyer Ch., 2016. Local cost of seawater RO desalination based on solar PV and wind energy - A global estimate, Desalination, 385, 207-216.
[50] AAPG, 2015. Global Heat Flow Database. American Association of Petroleum Geologists, Tulsa, USA, www.datapages.com/gis-map-publishing-program/gis-open-files/globalframework/ global-heat-flow-database.
[51] IASPEI, 2015. International Association of Seismology and Physics of the Earth's Interior, The International Heat Flow Commission, Colorado, USA. IHFC database http://www.heatflow.und.edu/index2.html.
[52] Chamorro C.R., García-Cuesta J.L., Mondéjar M.E., Pérez-Madrazo A., 2014a. An estimation of the enhanced geothermal systems potential for the Iberian Peninsula. Renewable Energy 66, 1-14.
[53] Chamorro C.R., García-Cuesta J.L., Mondéjar M.E., Pérez-Madrazo A., 2014b. Enhanced geothermal systems in Europe: An estimation and comparison of the technical and sustainable potentials. Energy 65, 250-263.
[54] Huenges E., 2012. Geothermal Energy Systems, Exploration, Development and Utilization, 2nd edition, Weinheim, Germany.
[55] German Biomass Research Centre, 2009. Regionale und globale räumliche Verteilung von Biomassepotenzialen. German Biomass Research Centre; Leipzig [in German].
[56] [UNDP] - The United Nations Development Programme, 2012. The National Bioenergy Strategy for Lebanon, UNDP/CEDRO. http://www.undp.org.lb.
[57] [IEA] - International Energy Agency, 2012. Technology roadmap – bioenergy for heat and power. IEA Publications; Paris.
[58] [IPCC] - Intergovernmental Panel on Climate Change, 2011. Special report on RE sources and CC mitigation. Intergovernmental panel on climate change; Geneva.
[59] Gerlach A., Werner Ch., Breyer Ch., 2014. Impact of Financing Cost on Global Grid-Parity Dynamics till 2030. 29th EU PVSEC, Amsterdam, September 22-26, DOI: 10.4229/29thEUPVSEC2014-7DO.15.4., www.researchgate.net/publication/266558306_Impact_of_Financing_Cost_on_Global_Grid-Parity_Dynamics_till_2030 [accessed: 15.01.2016].
[60] Ministry of Energy of Iran, 2015. Electricity tariffs and their general condition [in Persian], http://tariff.moe.gov.ir.
[61] Ministry of electricity and energy of Yemen, 2015, Electricity tariff [in Arabic], Public Electricity Corporation, www.pec.com.ye/index_files/page0002.htm.
[62] [RCREEE] - Regional Center for Renewable Energy and Energy Efficiency, 2012, Country profile - Energy efficiency, www.rcreee.org/content/member-states [accessed: 05.03.2016].
[63] [IEA] – International Energy Agency, 2014. World Energy Outlook 2014. IEA Publishing, Paris. [64] Breyer Ch, Werner C., Rolland S., Adelmann P., 2011. Off-Grid Photovoltaic Applications in
Regions of Low Electrification: High Demand, Fast Financial Amortization and Large Market Potential. 26th EU PVSEC, Hamburg, September 5-9. Available online at: www.researchgate.net/publication/261172910_Off-Grid_Photovoltaic_Applications_in_Regions_of_Low_Electrification_High_Demand_Fast_Financial_Amortization_and_Large_Market_Potential [accessed: 22.02.2016]
[65] Breyer Ch., Gaudchau E., Gerlach A.-K., Hlusiak M, Cader C., Bertheau P., Wasgindt V., 2012. PV-based Mini-Grids for Electrification in Developing Countries - An overview on market potentials and business models. A study of the Reiner Lemoine Institut gGmbH on behalf of the

preprint to be published in the proceedings of the 11th International Energy Conference, May 30-31, Tehran, Iran
cdw Stiftungsverbund gGmbH, December 11. www.researchgate.net/publication/261345306_PV-based_Mini Grids_for_Electrification_in_Developing_Countries_-_An_overview_on_market_potentials_and_business_models [accessed: 29.02.2016]
[66] Molyneaux L., Wagner L., Foster J., 2016. Rural electrification in India: Galilee Basin coal versus decentralised renewable energy micro grids, Renewable Energy 89, 422-436.
[67] Yadoo A. and Cruickshank H., 2012. The role for low carbon electrification technologies in poverty reduction and climate change strategies: A focus on renewable energy mini-grids with case studies in Nepal, Peru and Kenya, Energy Policy 42, 591-602.
[68] Sen, R. and Bhattacharyya, S.C., 2014. Off-grid electricity generation with renewable energy technologies in India: An application of HOMER, Renewable Energy 62, 388-398.
[69] Fraunhofer ISE, 2015. Current and Future Cost of Photovoltaics. Long-term Scenarios for Market Development, System Prices and LCOE of Utility-Scale PV Systems, study on behalf of Agora Energiewende, Freiburg and Berlin.
[70] Hoffmann W., 2014. Importance and evidence for cost effective electricity storage, 29th EU PVSEC, Amsterdam, September 22-26.
[71] Nykvist B. and Nilsson M., 2015. Rapidly falling costs of battery packs for electric vehicles, nature climate change, 5, 329–332.
[72] Breyer Ch., Gerlach A., 2013. Global Overview on Grid-Parity, Progress in Photovoltaics: Research and Applications 21, 121-136.
[73] Agora Energiewende, 2014. Comparing the cost of low-carbon technologies: what is the cheapest option? report by Prognos AG on behalf of Agora Energiewende, p. 10-13. Available online at: www.prognos.com/fileadmin/pdf/publikationsdatenbank/140417_Prognos_Agora_Analysis_Decarbonisationtechnologies_EN.pdf [accessed: 20.02.2016].
[74] Tokimatsu K., Yasuoka R., Nishio M., 2016. Global zero emissions scenarios: The role of biomass energy with carbon capture and storage by forested land use. Applied Energy, in press.
[75] European Commission, 2014. Integration of renewable energy in Europe. study prepared by KEMA Consulting, DNV GL – Energy, Imperial College and NERA Economic Consulting on behalf of DG Energy, Brussels, pp. 7-8 and 54.
[76] [WWF] – World Wide Fund for Nature, 2011. The energy report: 100% renewable energy by 2050, Switzerland, assets.panda.org/downloads/101223_energy_report_final_print_2.pdf [accessed: 12.12.2015].
[77] Teske S., et al. 2015. Energy [r] evolution - a sustainable world energy outlook 2015, Greenpeace International, GWEC and SolarPowerEurope, 5th edition, Amsterdam.
[78] Dittmar M., 2012. Nuclear energy: Status and future limitations, Energy, 37, 35-40.

preprint to be published in the proceedings of the 11th International Energy Conference, May 30-31, Tehran, Iran
Supplementary Material
Table 1: Financial assumptions for energy system components.
Technology Capex [€/kW]
Opex fix [€/(kW∙a)]
Opex var [€/kWh]
Lifetime [a]
PV optimally tilted 550 8 0 35 PV single-axis tracking 620 9 0 35 PV rooftop 813 12 0 35 Wind onshore 1000 20 0 25 CSP (solar field) 528 11 0 25 Hydro run-of-river 2560 115.2 0.005 60 Hydro dam 1650 66 0.003 60 Geothermal energy 4860 87 0 30 Water electrolysis 380 13 0.0012 30 Methanation 234 5 0.0015 30 CO2 scrubbing 356 14 0.0013 30 CCGT 775 19.4 0.001 30 OCGT 475 14.25 0.001 30 Steam turbine 600 12 0 30 Hot heat burner 100 2 0 30 Heating rod 20 0.4 0.001 30 Biomass CHP 2500 175 0.001 30 Biogas CHP 370 14.8 0.001 30 Waste incinerator 5240 235.8 0.007 20 Biogas digester 680 27.2 0 20 Biogas upgrade 250 20 0 20
Capex [€/kWh]
Opex fix [€/(kWh∙a)]
Opex var [€/kWh]
Lifetime [a]
Battery 150 10 0.0002 10 PHS 70 11 0.0002 50 A-CAES 31 0.4 0.0012 40 TES 24 2 0 20 Gas storage 0.05 0.001 0 50
Capex
[€/(kWNTC*km)] Opex fix
[€/(kWNTC∙km∙a)] Opex var
[€/kWhNTC] Lifetime
[a]
HVDC line on ground 0.612 0.0075 0 50 HVDC line submarine 0.992 0.0010 0 50
Capex
[€/kWNTC] Opex fix
[€/(kWNTC∙a] Opex var
[€/kWhNTC] Lifetime
[a]
HVDC converter pair 180 1.8 0 50
Capex
[€/(m3∙a)] Opex fix [€/(m3 a)]
Opex var [€/m3]
Lifetime [a]
Water desalination 2.23 0.09 0 30
Capex
[€/(m3∙h∙km)] Opex fix
[€/(m3∙h∙km∙a)] Opex var
[€/m3∙h∙km] Lifetime
[a]
Horizontal pumping and pipes
19.3 0.39 0 30
Vertical pumping and pipes 15.5 0.31 0 30
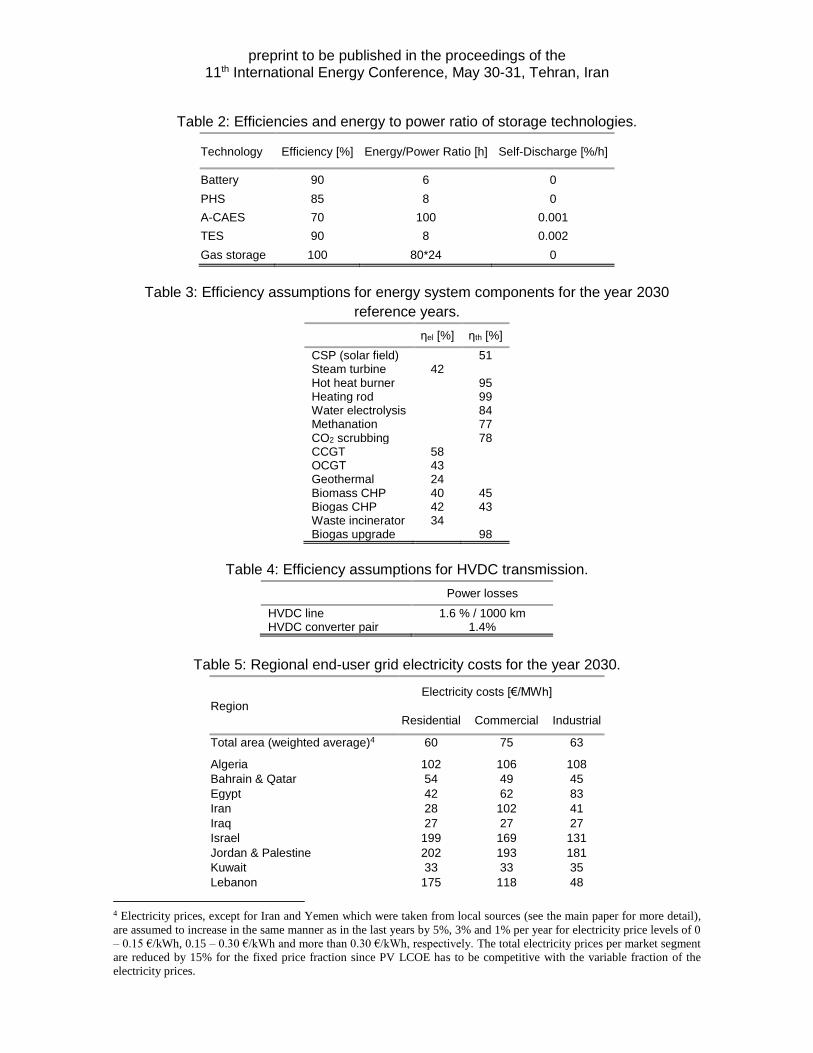
preprint to be published in the proceedings of the 11th International Energy Conference, May 30-31, Tehran, Iran
Table 2: Efficiencies and energy to power ratio of storage technologies.
Technology Efficiency [%] Energy/Power Ratio [h] Self-Discharge [%/h]
Battery 90 6 0
PHS 85 8 0
A-CAES 70 100 0.001
TES 90 8 0.002
Gas storage 100 80*24 0
Table 3: Efficiency assumptions for energy system components for the year 2030
reference years.
ηel [%] ηth [%]
CSP (solar field) 51 Steam turbine 42 Hot heat burner 95 Heating rod 99 Water electrolysis 84 Methanation 77 CO2 scrubbing 78 CCGT 58 OCGT 43 Geothermal 24 Biomass CHP 40 45 Biogas CHP 42 43 Waste incinerator 34 Biogas upgrade 98
Table 4: Efficiency assumptions for HVDC transmission.
Power losses
HVDC line 1.6 % / 1000 km HVDC converter pair 1.4%
Table 5: Regional end-user grid electricity costs for the year 2030.
Region
Electricity costs [€/MWh]
Residential Commercial Industrial
Total area (weighted average)4 60 75 63
Algeria 102 106 108
Bahrain & Qatar 54 49 45
Egypt 42 62 83
Iran 28 102 41
Iraq 27 27 27
Israel 199 169 131
Jordan & Palestine 202 193 181
Kuwait 33 33 35
Lebanon 175 118 48
4 Electricity prices, except for Iran and Yemen which were taken from local sources (see the main paper for more detail),
are assumed to increase in the same manner as in the last years by 5%, 3% and 1% per year for electricity price levels of 0
– 0.15 €/kWh, 0.15 – 0.30 €/kWh and more than 0.30 €/kWh, respectively. The total electricity prices per market segment
are reduced by 15% for the fixed price fraction since PV LCOE has to be competitive with the variable fraction of the
electricity prices.

preprint to be published in the proceedings of the 11th International Energy Conference, May 30-31, Tehran, Iran
Libya 25 33 39
Morocco 194 191 185
Oman 18 20 23
Saudi Arabia 31 31 31
Syria 169 135 87
Tunisia 162 155 148
United Arab Emirates (UAE) 79 79 79
Yemen 85 135 87
Table 6: Regional biomass potentials and geothermal energy potentials.
Region
Biomass potential [TWhth/a]
Geothermal Potential
Solid waste
Solid biomass Biogas sources [TWhth/a]
Total area 17.3 114.5 0.0 165.0
Algeria 0.6 4.9 0.0 5.2
Bahrain & Qatar 0.2 0.0 0.0 0.0
Egypt 1.5 40.7 0.0 3.6
Iran 4.8 32.8 0.0 15.6
Iraq 2.1 9.4 0.0 46.5
Israel 0.6 0.5 0.0 1.6
Jordan & Palestine 0.4 0.1 0.0 16.1
Kuwait 0.2 0.1 0.0 11.3
Lebanon 0.2 2 0.0 0.0
Libya 0.1 0.3 0.0 0.0
Morocco 0.6 8.4 0.0 0.0
Oman 0.2 0.2 0.0 0.0
Saudi Arabia 1.9 4.1 0.0 57.5
Syria 1.6 7.2 0.0 1.9
Tunisia 0.2 2.5 0.0 5.7
United Arab Emirates (UAE)
0.3 0.0 0.0 0.0
Yemen 1.7 1.4 0.0 0.0
Table 7: Regional biomass costs.
Region Biomass costs [€/MWhth]
Solid waste Solid biomass Biogas sources
Total area (weighted average)
-10.2 5.0 0.7
Algeria -10.2 5.3 0.0
Bahrain & Qatar -10.2 5.3 0.0
Egypt -10.2 5.3 5.2
Iran -10.2 5.3 3.0
Iraq -10.2 5.3 3.0
Israel -10.1 5.3 0.0
Jordan & Palestine -10.2 5.3 0.0
Kuwait -10.2 5.3 0.0
Lebanon -10.2 5.3 0.0
Libya -10.2 5.3 0.0
Morocco -10.2 5.3 1.1
Oman -10.2 5.3 0.0
Saudi Arabia -10.2 5.3 0.0

preprint to be published in the proceedings of the 11th International Energy Conference, May 30-31, Tehran, Iran
Syria -10.2 5.3 0.0
Tunisia -10.2 5.3 0.0
United Arab Emirates (UAE) -10.2 0 0.0
Yemen -10.2 5.3 0.0
Table 8: Average full load hours (FLH) and LCOE for single-axis tracking PV, optimally
tilted PV, solar CSP and wind power plants in the MENA region by 2030.
Region Pop.
[mio. Pop]
Electr. demand [TWh]
PV-single-
axis FLH
PV optimally
tilted FLH
CSP FLH
Wind FLH
PV single-axis
LCOE [€/MWh]
PV optimally
tilted LCOE
[€/MWh]
CSP LCOE
[€/MWh]
Wind LCOE
[€/MWh]
Total area 500 1756 2297 1767 2201 2633 25 29 53 42
Algeria 48 84 2304 1773 2184 3091 25 28 54 34
Bahrain & Qatar 4 86 2215 1714 2037 2544 26 29 58 42
Egypt 117 227 2447 1866 2442 2970 23 27 48 36
Iran 89 326 2297 1789 2197 2955 25 28 53 36
Iraq 54 78 2143 1691 2056 2851 27 30 57 37
Israel 10 84 2236 1747 2121 1427 25 29 55 74
Jordan & Palestine
16 23 2347 1796 2271 2802 24 28 52 38
Kuwait 5 75 2185 1659 2143 3077 26 30 55 34
Lebanon 5 22 2143 1671 2011 1575 27 30 58 67
Libya 7 58 2397 1851 2326 3002 24 27 50 35
Morocco 40 58 2344 1790 2305 2883 24 28 51 37
Oman 5 34 2463 1846 2348 2647 23 27 50 40
Saudi Arabia 39 389 2443 1830 2382 2729 23 28 49 39
Syria 29 37 2137 1688 2014 2887 27 30 58 37
Tunisia 13 29 2072 1677 1886 2792 27 30 62 38
United Arab Emirates (UAE)
11 140 2320 1774 2248 1977 25 28 52 54
Yemen 36 7 2553 1883 2456 2556 22 27 48 41
Table 9: Lower limits of installed capacities in the MENA sub-regions.
Region
Installed capacity [MW]
Solar PV Wind Hydro dams Hydro RoR5 PHS6
Total area 1343.7 1686.2 20981.3 266.4 813.6
Algeria 79.2 10.2 247.0 0.0 0.0
Bahrain & Qatar 41.5 0.0 0.0 0.0 0.0
Egypt 26.6 550.25 2800.0 0.0 0.0
Iran 58.3 120.0 13996.9 142.3 0.0
Iraq 7.2 0.0 2064.0 62.0 250.0
Israel 709.5 6.0 0.0 0.0 0.0
Jordan & Palestine 32.2 1.5 5.0 0.0 6.0
Kuwait 15.7 0.0 0.0 0.0 0.0
5 RoR = Run-of-River 6 PHS = Pumped Hydroelectric Storage

preprint to be published in the proceedings of the 11th International Energy Conference, May 30-31, Tehran, Iran
Lebanon 4.1 60.0 207.9 62.2 0.0
Libya 4.2 0.0 0.0 0.0 0.0
Morocco 57.4 694.5 940.7 0.0 557.6
Oman 5.9 0.0 0.0 0.0 0.0
Saudi Arabia 82.7 0.0 0.0 0.0 0.0
Syria 2 0.6 719.8 0.0 0.0
Tunisia 28.3 242.4 0.0 0.0 0.0
United Arab Emirates (UAE)
182.2 0.9 0.0 0.0
0.0
Yemen 6.6 0.0 0.0 0.0 0.0
Table 10: Upper limits on installable capacities in the MENA region in units of GW th for
CSP and GWel for all other technologies.
Region
area Limits [GW]
[1000 km2] Solar CSP
Solar PV
Wind Hydro RoR
Hydro dams PHS
Total area 11067 101270 50635 3781 0.2 31.5 2
Algeria 2382 21436 10718 800 0 0.4 0 Bahrain & Qatar 12 111 56 4 0 0 0 Egypt 1001 9013 4507 336 0 4.2 0 Iran 1648 14834 7417 554 0.2 21.0 0 Iraq 438 3945 1972 147 0 3.1 1 Israel 21 187 93 7 0 0.0 0 Jordan & Palestine 96 860 430 32 0 0.0 0 Kuwait 18 160 80 6 0 0.0 0 Lebanon 10 94 47 3 0 0.3 0 Libya 1760 15836 7918 591 0 0.0 0 Morocco 447 4019 2009 150 0 1.4 1 Oman 310 2786 1393 104 0 0.0 0 Saudi Arabia 2150 19347 9674 722 0 0.0 0 Syria 185 1667 833 62 0 1.1 0 Tunisia 164 1472 736 55 0 0.0 0 United Arab Emirates (UAE) 84 752 376 28 0 0.0 0 Yemen 528 4752 2376 177 0 0.0 0
Table 11: Annual industrial gas demand and water demand for the year 2030.
Annual gas demand Annual electricity demand for gas
synthesis
Annual water desalination
demand
Annual electricity
demand for water
desalination
[Mtoe] [TWhth] [TWhel] [Mil. m3] [TWhel]
Total 213.5 2482.5 4711.9 225634.2 1391.5
Algeria 9.0 105.1 197.1 1310.1 6.1 Egypt 20.1 233.5 437.1 8682.8 36.9 Iran 61.8 718.7 1365.6 89418.7 708.6 Iraq & Kuwait 6.3 73.5 136.9 71732.7 333.9 Israel 0.7 7.7 14.1 948.0 5.5 Morocco 0.1 1.0 1.0 2663.3 15.3 Saudi Arabia 42.1 489.7 933.9 28648.4 162.6 Syria & Jordan & Lebanon 1.2 14.1 24.7 14816.3 80.3 Tunisia & Libya 1.5 17.0 30.7 3552.0 12.7 United Arab Emirates (UAE) & Bahrain & Qatar
54.5 634.0 1211.8 1053.0 3.4
Yemen & Oman 16.2 188.2 358.9 2808.7 26.2

preprint to be published in the proceedings of the 11th International Energy Conference, May 30-31, Tehran, Iran
Table 12: Total LCOE components in all sub-regions of the MENA region.
Region-wide LCOE primary LCOC LCOS LCOT LCOE total
[€/MWh] [€/MWh] [€/MWh] [€/MWh] [€/MWh]
Area average 36.8 2.3 24.4 0.0 63.5 Algeria 35.2 2.5 20.8 0.0 58.5 Bahrain & Qatar 28.9 2.4 49.4 0.0 80.7 Egypt 37.2 2.2 16.9 0.0 56.3 Iran 41.7 2.4 13.0 0.0 57.1 Iraq 44.1 1.4 14.0 0.0 59.5 Israel 32.9 2.4 53.2 0.0 88.5 Jordan & Palestine 36.4 1.8 29.0 0.0 67.2 Kuwait 31.2 2.0 42.6 0.0 75.8 Lebanon 38.0 2.0 39.6 0.0 79.6 Libya 32.7 2.0 23.1 0.0 57.8 Morocco 39.6 3.2 24.0 0.0 66.8 Oman 31.9 1.8 33.2 0.0 66.9 Saudi Arabia 35.8 2.2 18.5 0.0 56.5 Syria 40.1 3.0 25.4 0.0 68.5 Tunisia 38.4 2.6 32.2 0.0 73.2 United Arab Emirates (UAE)
34.5 2.9 38.9 0.0 76.3
Yemen 40.3 1.0 13.7 0.0 55.0
Area-wide LCOE primary LCOC LCOS LCOT LCOE total
export (-)/ import (+)
[€/MWh] [€/MWh] [€/MWh] [€/MWh] [€/MWh] [%]
Area average 38.0 1.9 15.0 2.2 57.1 12.6 Algeria 35.0 1.9 15.2 1.8 53.9 -1.6 Bahrain & Qatar 28.8 1.0 42.8 4.1 76.7 27.3 Egypt 38.9 1.5 6.6 1.9 48.9 -6.0 Iran 43.8 2.1 4.9 1.4 52.2 -2.1 Iraq 45.6 0.9 14.8 2.1 63.4 7.4 Israel 28.1 0.8 47.5 3.6 80.0 19.4 Jordan & Palestine 36.9 1.6 27.2 2.8 68.5 -9.7 Kuwait 31.2 1.2 34.8 4.4 71.6 29.9 Lebanon 40.9 1.0 27.2 3.3 72.4 21.5 Libya 34.3 1.5 14.9 2.5 53.2 -10.7 Morocco 40.3 1.8 20.2 1.8 64.1 6.5 Oman 33.4 1.4 29.0 2.6 66.4 -2.3 Saudi Arabia 38.1 2.8 7.3 2.0 50.2 -15.4 Syria 41.8 1.3 15.8 2.7 61.6 5.8 Tunisia 40.1 1.3 19.8 3.1 64.3 10.6 United Arab Emirates (UAE)
30.9 0.9 38.9 3.2 73.9 20.6
Yemen 40.0 1.6 18.7 2.2 62.5 -0.5
Integrated scenario LCOE primary LCOC LCOS LCOT LCOE total
export (-)/ import (+)
[€/MWh] [€/MWh] [€/MWh] [€/MWh] [€/MWh] [%]
Area average 32.2 1.5 1.9 1.4 37.0 10.5 Algeria 32.5 1.3 1.5 0.8 36.2 5.4 Egypt 32.6 1.8 1.1 1.0 36.4 -11.7 Iran 32.9 1.8 2.4 0.4 37.5 -4.2 Iraq & Kuwait 37.2 1.8 6.3 3.4 48.7 28.6 Israel 29.0 4.4 41.8 23.4 98.6 74.5 Morocco 37.9 2.0 12.9 1.6 54.5 3.9 Saudi Arabia 34.1 1.6 0.1 1.6 37.4 -23.0 Syria & Jordan & Lebanon
37.2 2.1 7.7 2.0 49.0 -6.1
Tunisia & Libya 35.0 1.6 4.3 1.5 42.3 -13.3

preprint to be published in the proceedings of the 11th International Energy Conference, May 30-31, Tehran, Iran
United Arab Emirates (UAE) & Bahrain & Qatar
24.8 0.4 0.2 2.8 28.2 29.9
Yemen & Oman 26.5 0.9 0.1 0.2 27.7 -0.5
Table 13: Prosumer electricity costs, installed capacities and electricity utilization in the
MENA region.
Prosumers parameters Residential Commercial Industrial
Electricity price [€/kWh] 0.062 0.076 0.064
PV LCOE [€/kWh] 0.025 0.033 0.033
Self-consumption PV LCOE [€/kWh] 0.028 0.038 0.037
Self-consumption PV and Battery LCOE [€/kWh] 0.042 0.059 0.051
Self-consumption LCOE [€/kWh] 0.042 0.059 0.051
Benefit [€/kWh] 0.021 0.017 0.013
Installed capacities Residential Commercial Industrial
PV [GW] 46.5 15.8 22.8
Battery storage [GWh] 36.1 16.8 16.5
Generation Residential Commercial Industrial
PV [TWh] 82.5 28.0 40.7
Battery storage [TWh] 11.4 5.3 5.2
Excess [TWh] 7.8 3.0 3.6
Utilization Residential Commercial Industrial
Self-consumption of generated PV electricity [%] 89.0 87.0 89.8
Self-coverage market segment [%] 8.5 6.0 7.6
Self-coverage operators [%] 42.3 29.9 38.0
Table 14: Overview on storage capacities, throughput and full cycles per year for the four
scenarios in the MENA region.
Region-wide Area-wide Integrated
Battery SC [GWhel] 69.5 69.5 61.0
Storage capacities
Battery system [GWhel] 452.0 298.7 5.9
PHS [GWhel] 1.6 1.6 1.6
A-CAES [GWhel] 2141.1 80.9 3.7
Gas [GWhth] 97,368 106,571 295,764
Battery SC [TWhel] 21.9 21.9 19.3
Throughput of storage
Battery system [TWhel] 147.8 101.2 1.7
PHS [TWhel] 0.4 0.5 0.4
A-CAES [TWhel] 54.8 2.1 0.1
Gas [TWhth] 164.4 123.5 68.6
Battery SC [-] 314.7 314.7 315.8
Full cycles per year
Battery system [-] 327.1 338.9 287.4
PHS [-] 265.8 294.0 231.4
A-CAES [-] 25.6 26.2 22.6
Gas [-] 1.7 1.2 0.2

preprint to be published in the proceedings of the 11th International Energy Conference, May 30-31, Tehran, Iran
Table 15: Electricity transmission line parameters for the area-wide scenario for the MENA
region.
Region 1 Region 2 Length
[km]
Capacity
[GW]
Utilization
[%]
Algeria Tunisia 379.5 3.2 59
Bahrain & Qatar Iran 690.2 0.9 55
Egypt Israel 255.2 4.9 62
Egypt Saudi Arabia 1049.6 7.3 63
Iraq Iran 412.5 2.2 63
Iraq Kuwait 342.1 1.2 58
Israel Jordan & Palestine 66 1.5 46
Israel Lebanon 126.5 0.6 62
Israel Syria 137.5 1.2 55
Jordan & Palestine Saudi Arabia 794.2 1.3 65
Jordan & Palestine Syria 104.5 1.1 53
Kuwait Iran 498.9 5.5 62
Lebanon Syria 50.6 0.7 59
Libya Egypt 1074.7 4.6 62
Morocco Algeria 618.2 1.8 64
Saudi Arabia Bahrain & Qatar 298.1 4.7 65
Saudi Arabia Kuwait 312.4 8.5 50
Saudi Arabia United Arab
Emirates (UAE) 489.5 6.5 63
Syria Iraq 401.5 3.8 53
Tunisia Libya 843.9 1.5 63
United Arab
Emirates (UAE) Iran 226.6 2.0 55
United Arab
Emirates (UAE) Oman 641.3 0.3 67
Yemen Saudi Arabia 447.7 1.3 58
Figure 1: Hourly generation profile for a net exporter region, Saudi Arabia.

preprint to be published in the proceedings of the 11th International Energy Conference, May 30-31, Tehran, Iran
Figure 2: Hourly generation profile for a net importer region, United Arab Emirates (UAE).
Figure 3: Hourly generation profile for Jordan & State of Palestine, example for a balancing
region.
Figure 4: Hourly generation profile for Bahrain and Qatar, example for a net importer
region.

preprint to be published in the proceedings of the 11th International Energy Conference, May 30-31, Tehran, Iran
Figure 5: Aggregated yearly state-of-charge for storage in area-wide open trade scenario,
battery (top left), PHS (top right), gas storage (bottom left) and A-CAES (bottom right).

preprint to be published in the proceedings of the 11th International Energy Conference, May 30-31, Tehran, Iran
Figure 6: Electricity generation curves for a whole year for area-wide open trade scenario
for the MENA region.
Figure 7: Profile for interregional electricity trade between regions for area-wide open trade
scenario for the MENA region.

preprint to be published in the proceedings of the 11th International Energy Conference, May 30-31, Tehran, Iran
Figure 8: Energy flow of the system for the region-wide open trade scenario (top) and the
area-wide open trade scenario (bottom) in 2030.
View publication statsView publication stats